
Marker-Less Video Analysis of Infant Movements for Early Identification of Neurodevelopmental Disorders

 , ,
, ,  ,
,  ,
,  and
and
Abstract
1. Introduction
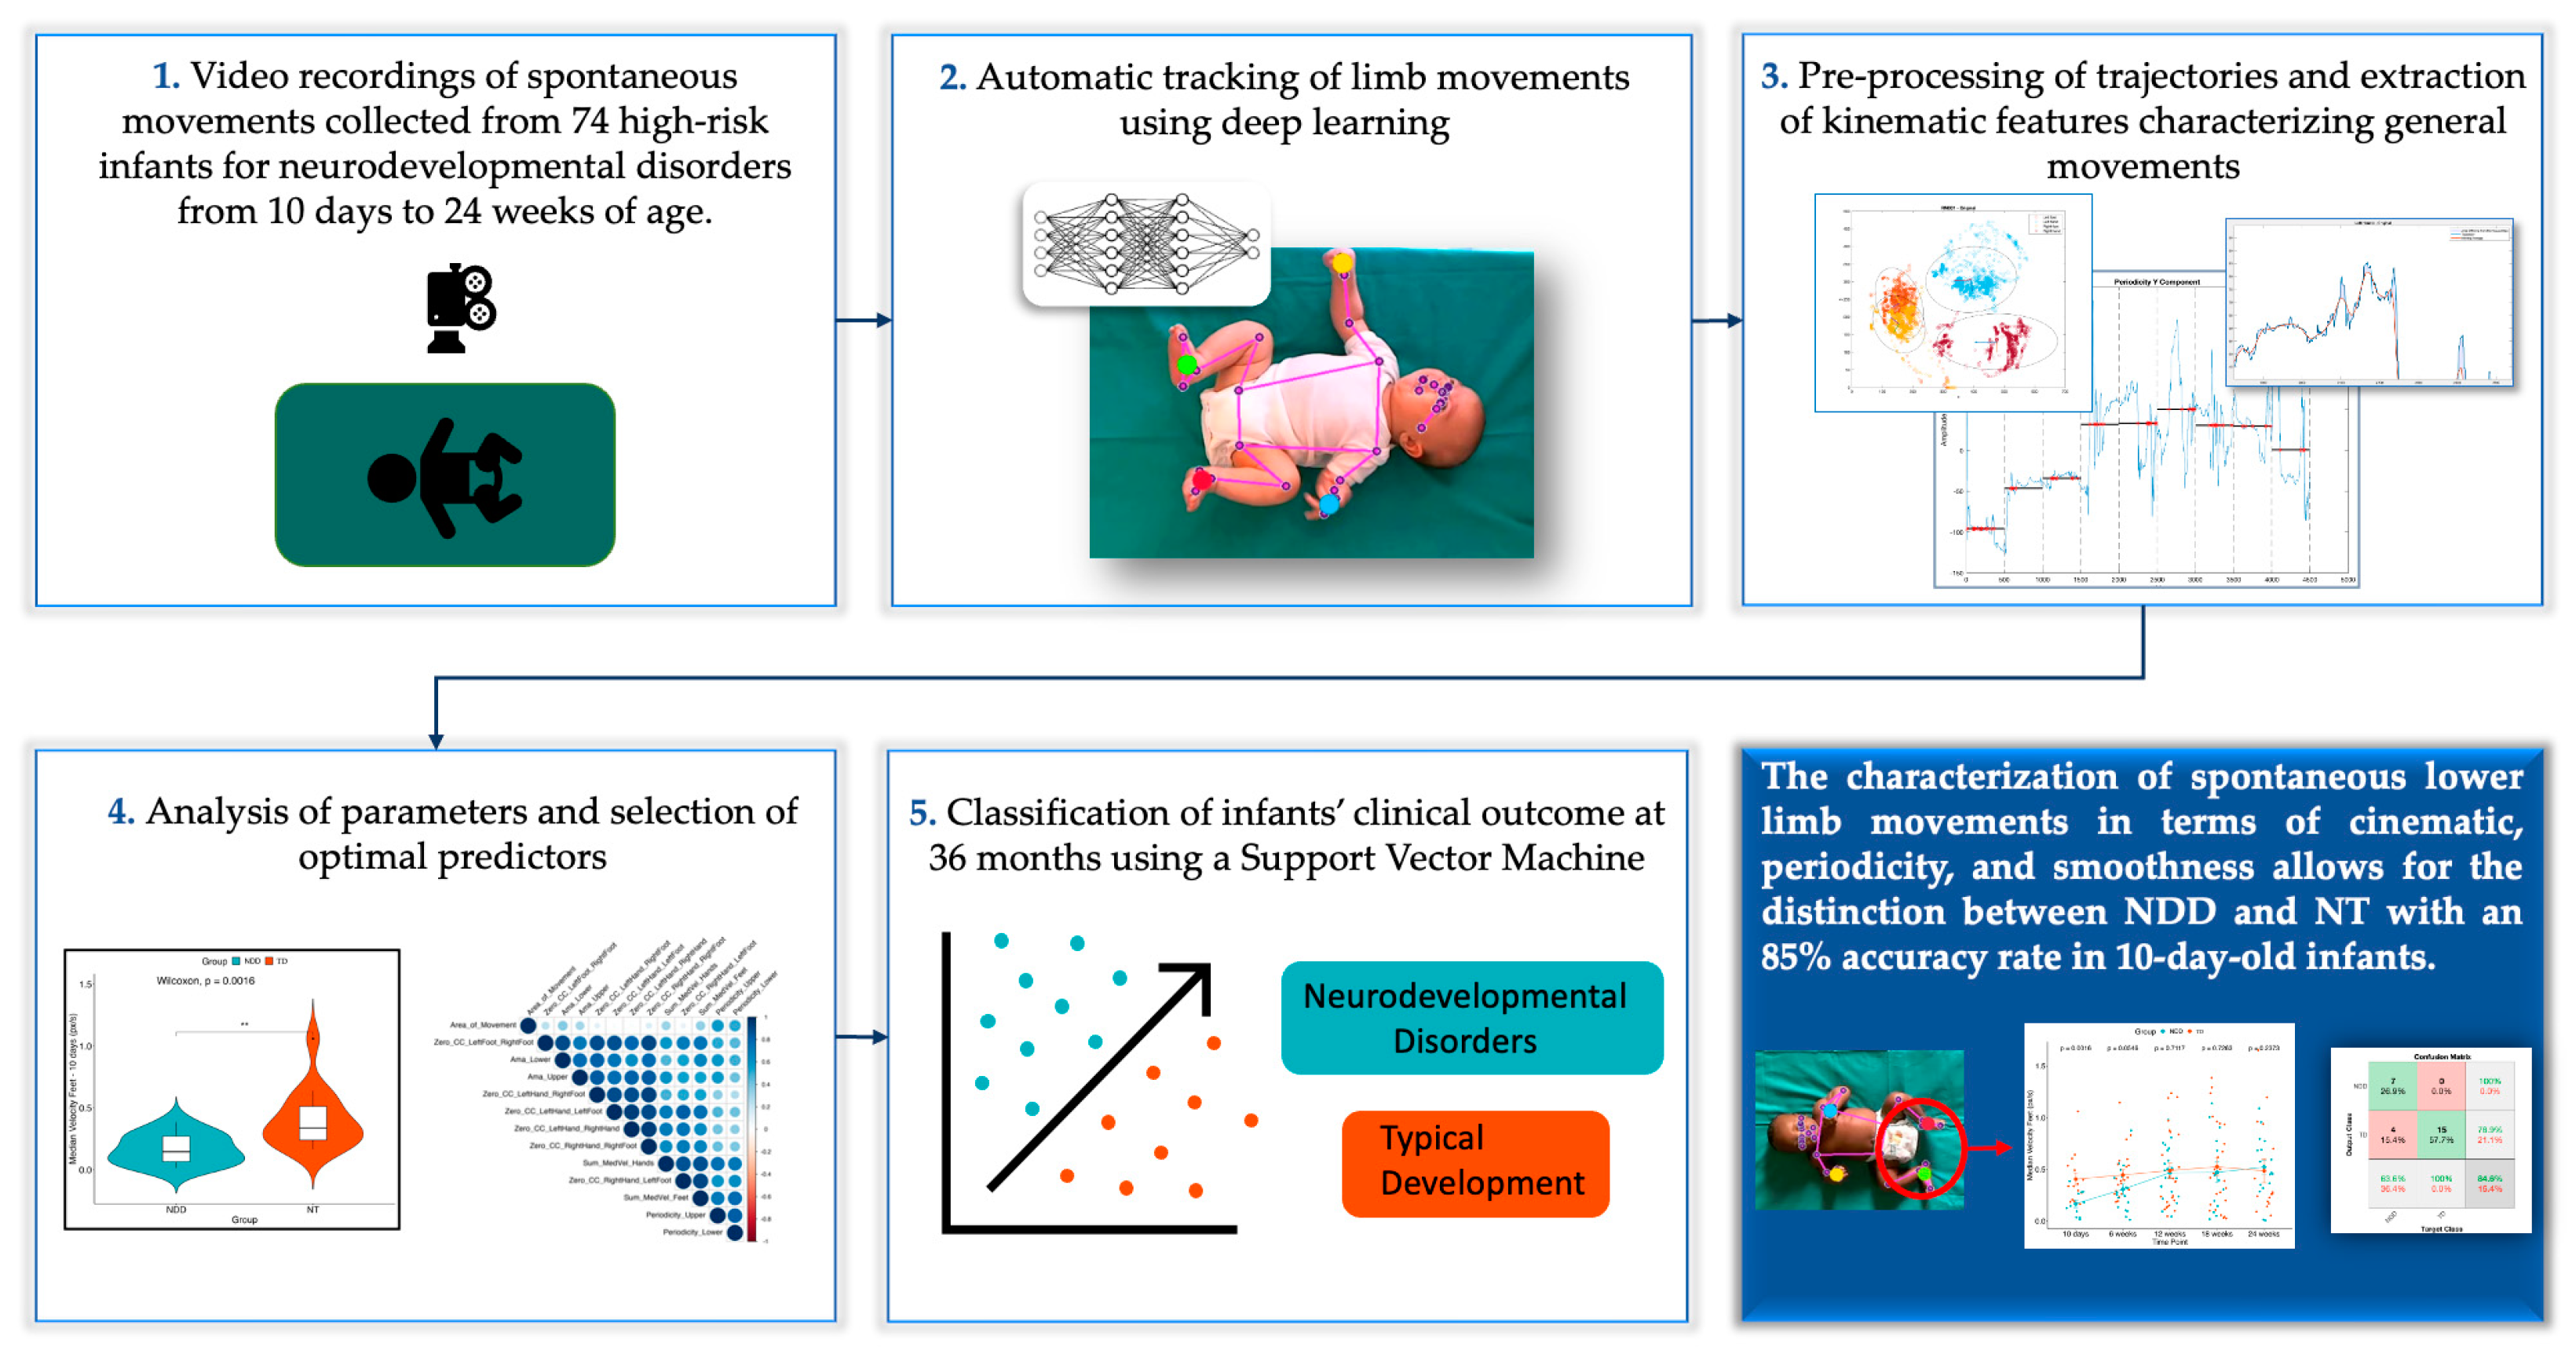
2. Materials and Methods
2.1. Participants
2.2. Data Collection & Video Editing
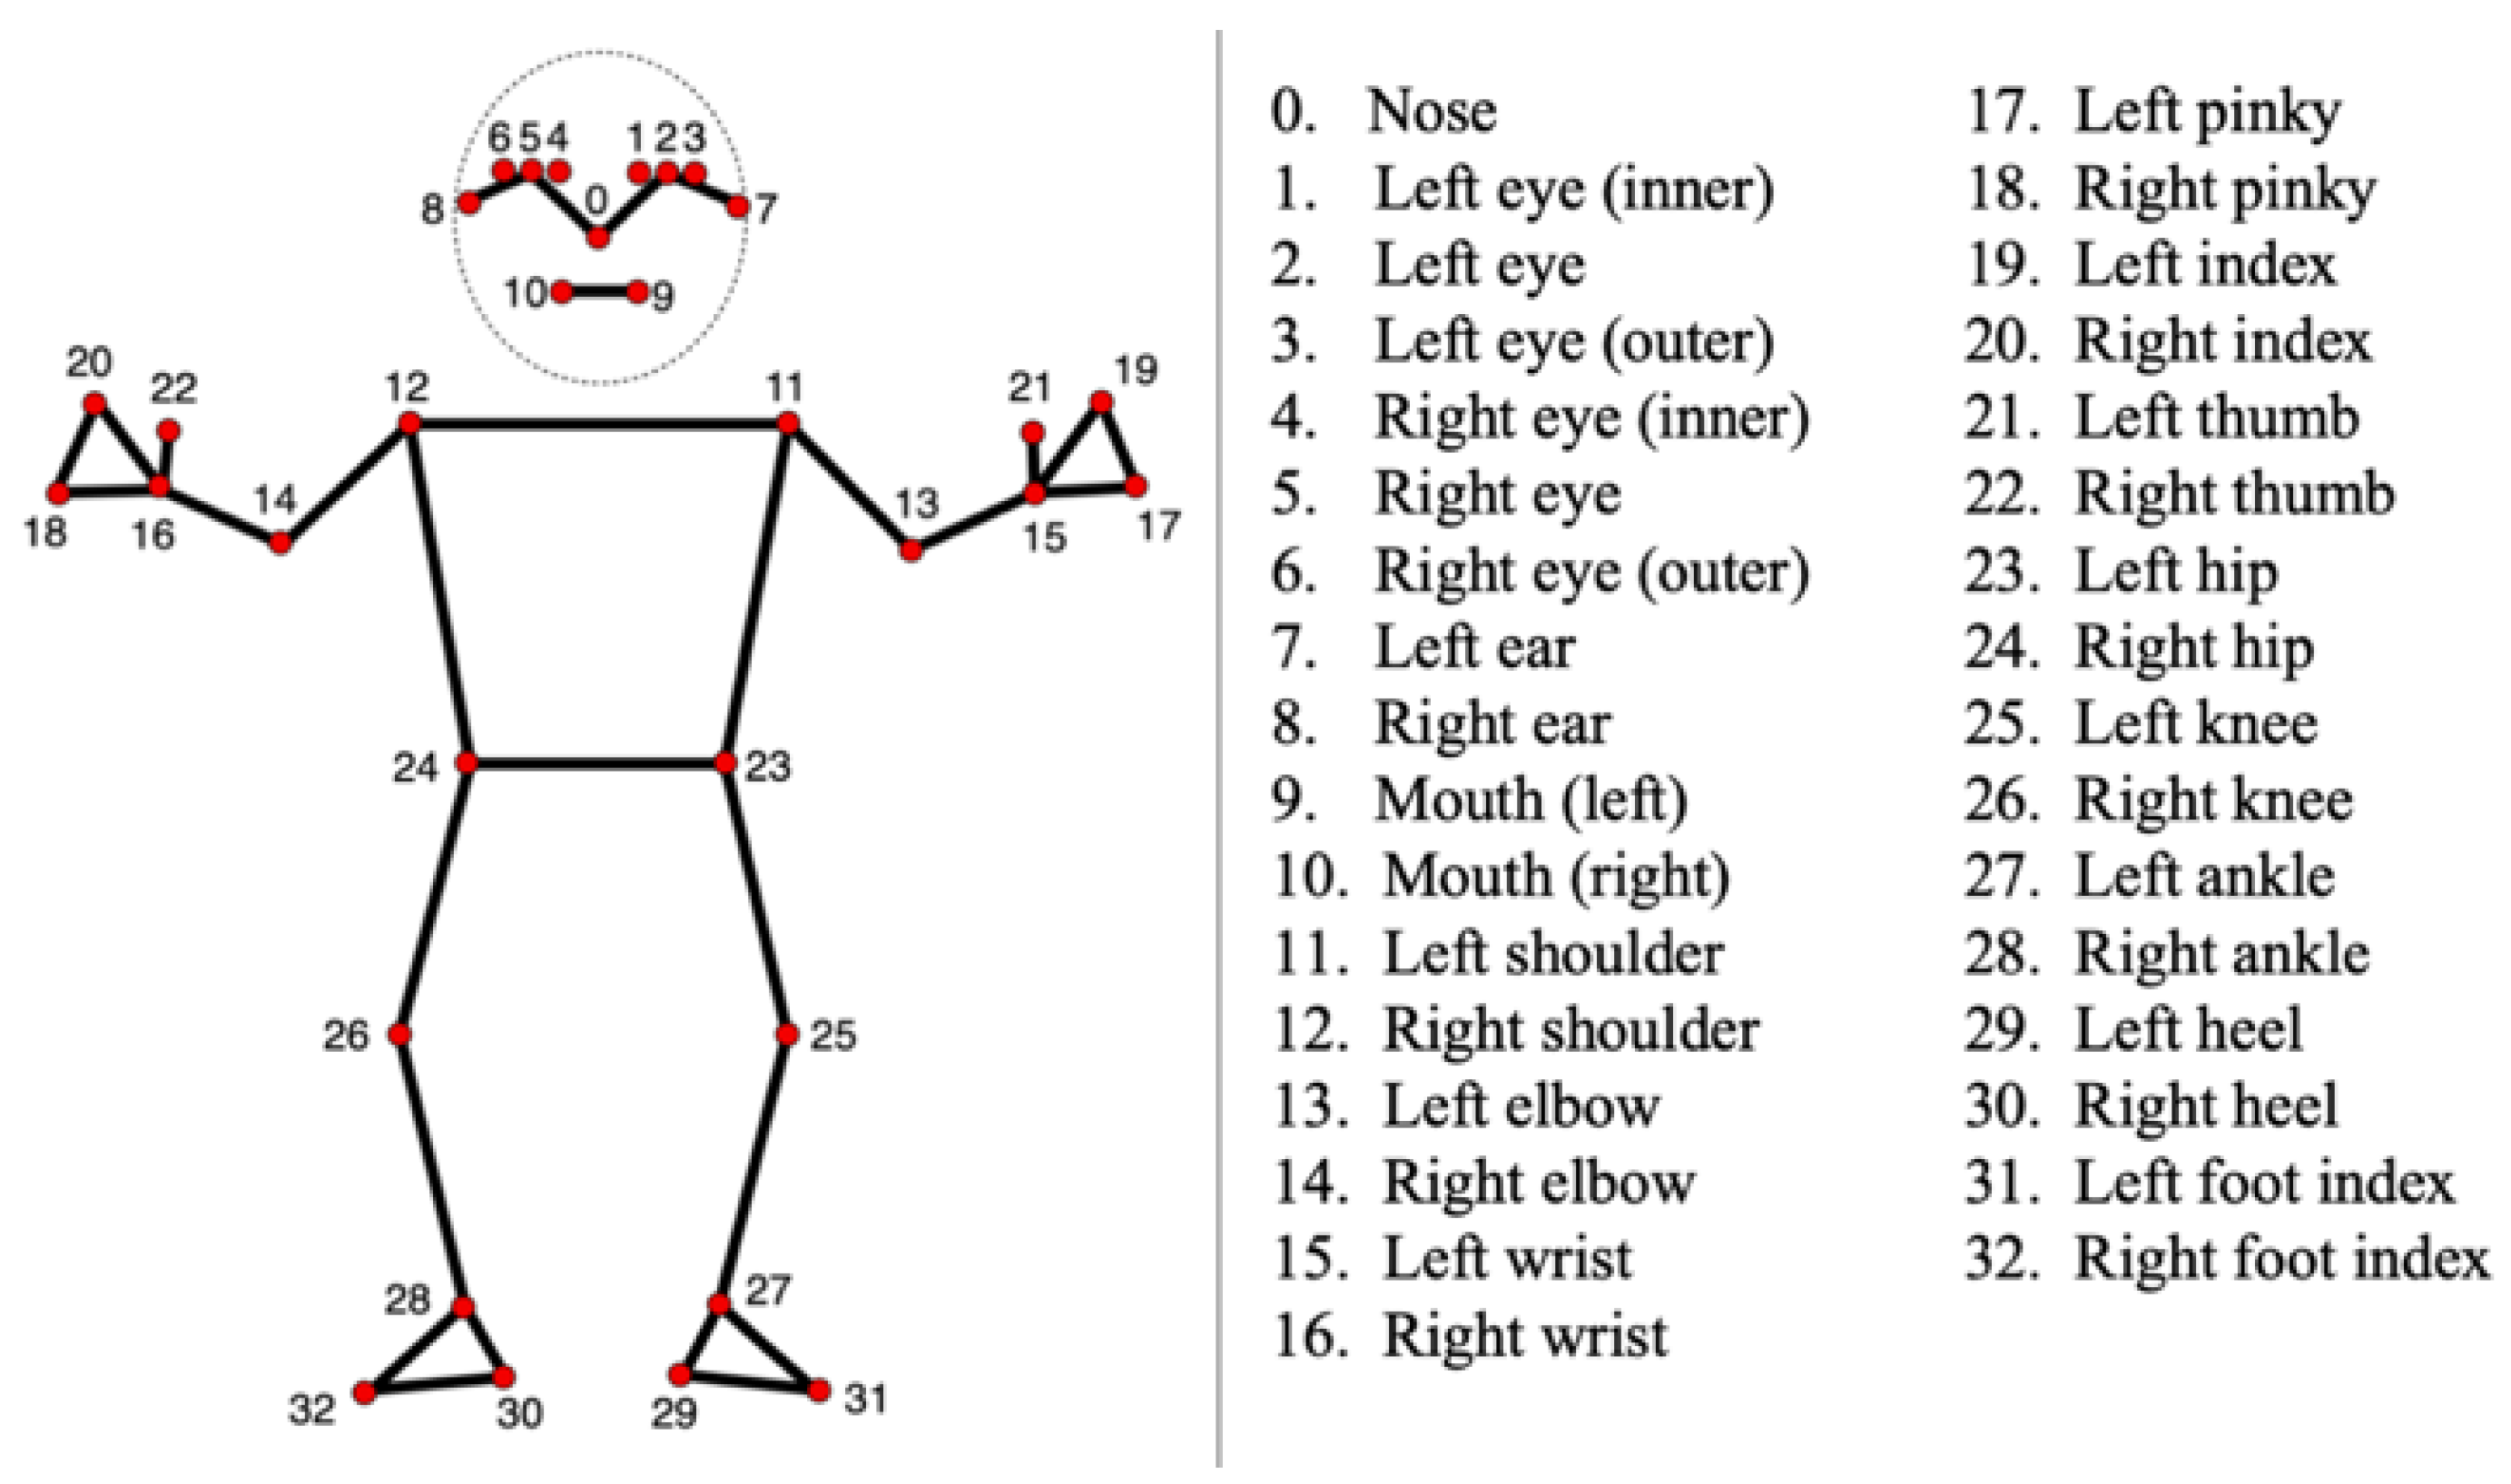
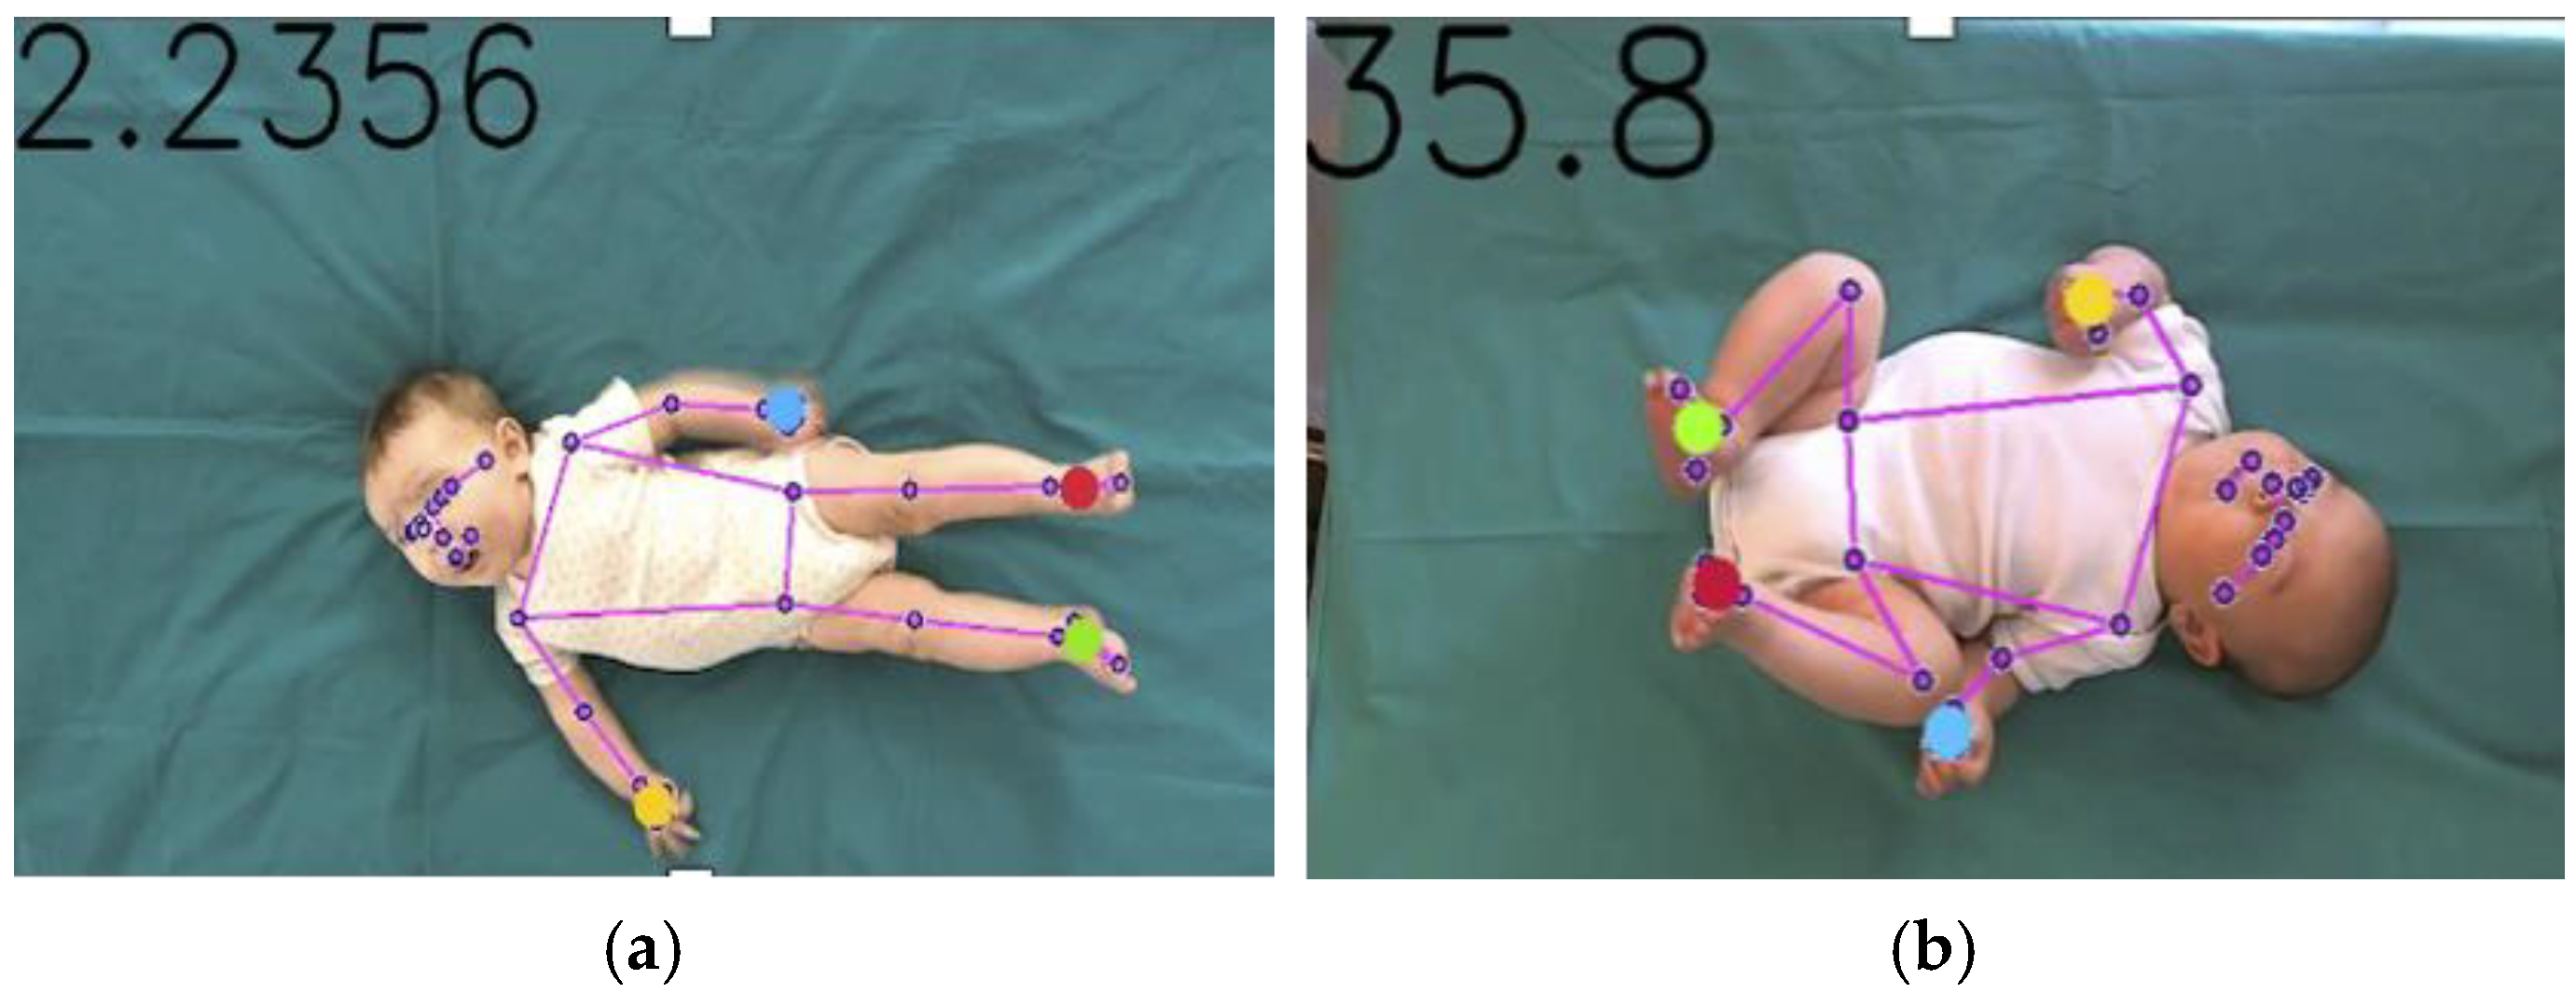
2.3. Tracking Procedure
2.4. Signal Processing
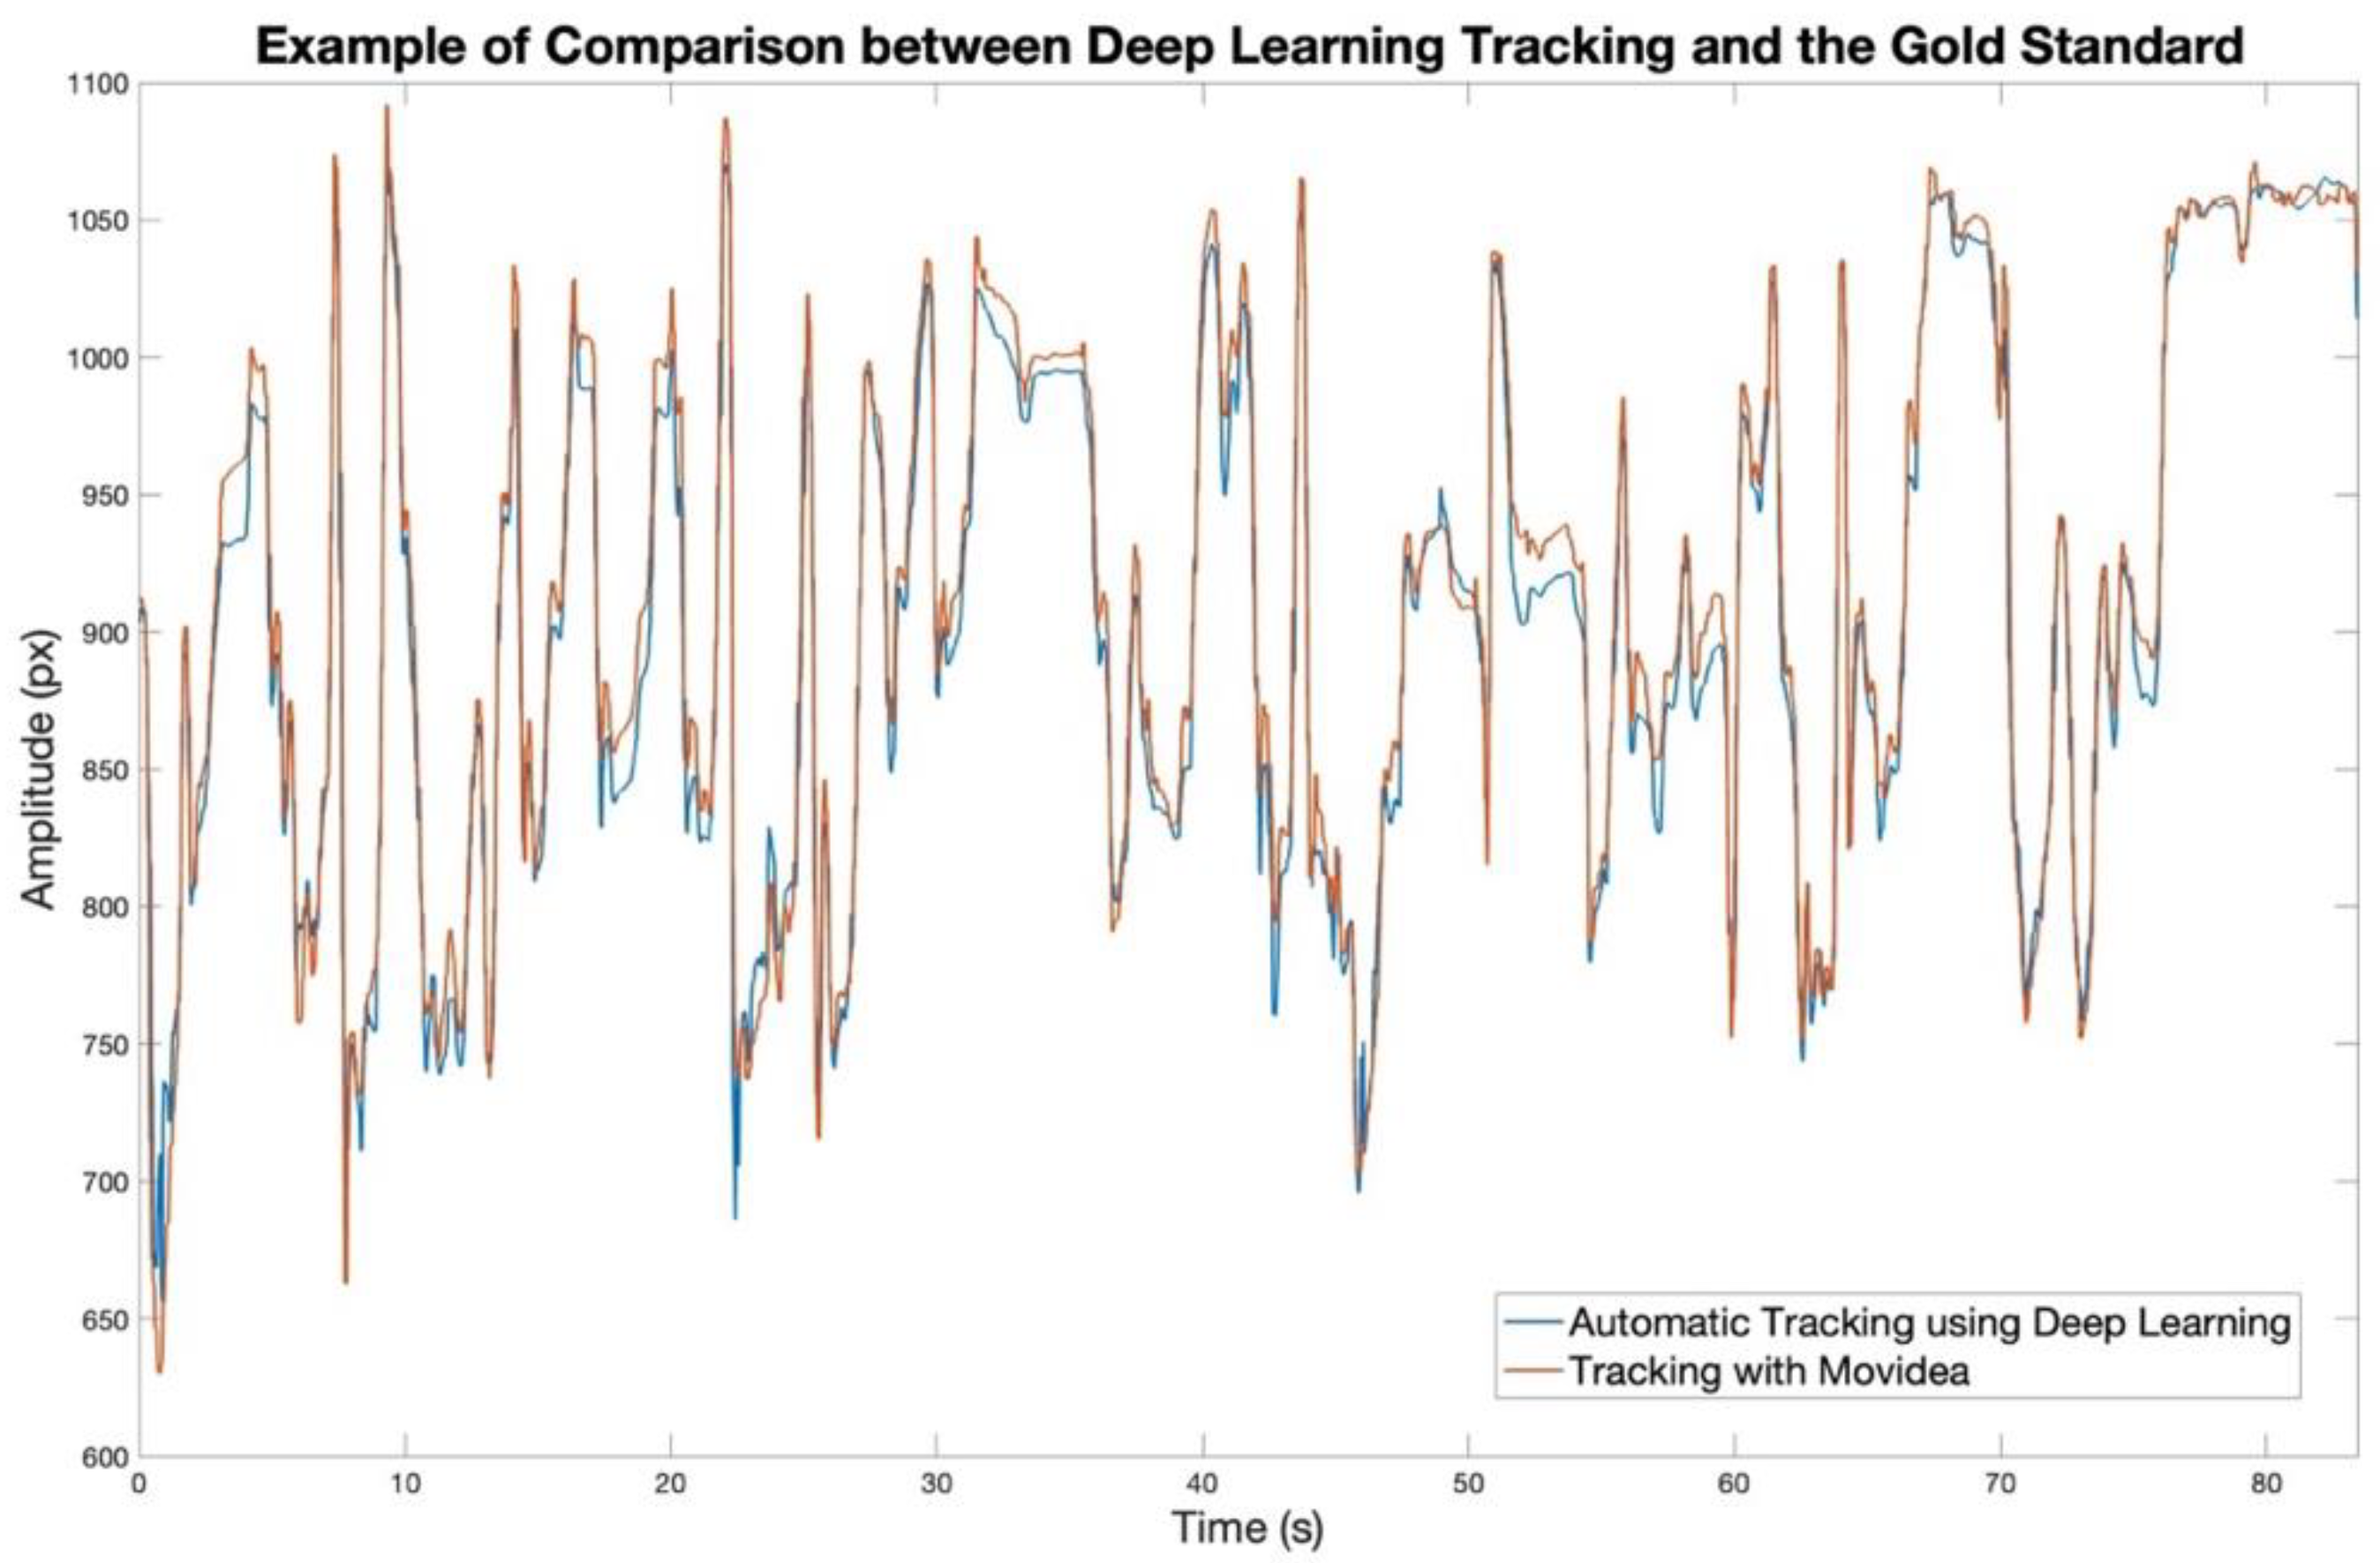
2.5. Model Validation: Comparison with Movidea
2.6. Feature Extraction
- Velocity and Acceleration:
- Cross-correlation (CC):
- Area differing from moving average (Ama):
- Periodicity:
- Maximum displacement along the x and y axes:
- The smallest and largest eigenvalues of the 95% error ellipse between the x and y components of the body centroid trajectory:
- Percentage of covered space:
- Mean Pearson Correlation Coefficient [39]:
- The difference between the mean velocity of upper body and the mean velocity of lower body:
2.7. Feature Selection
2.8. Mixed-Effects Model for Selected Features
2.9. Classification Model
- Accuracy:
- Precision:
- Recall or Sensitivity:
- Specificity:
- F1 Score:
3. Results
3.1. Model Validation with Movidea
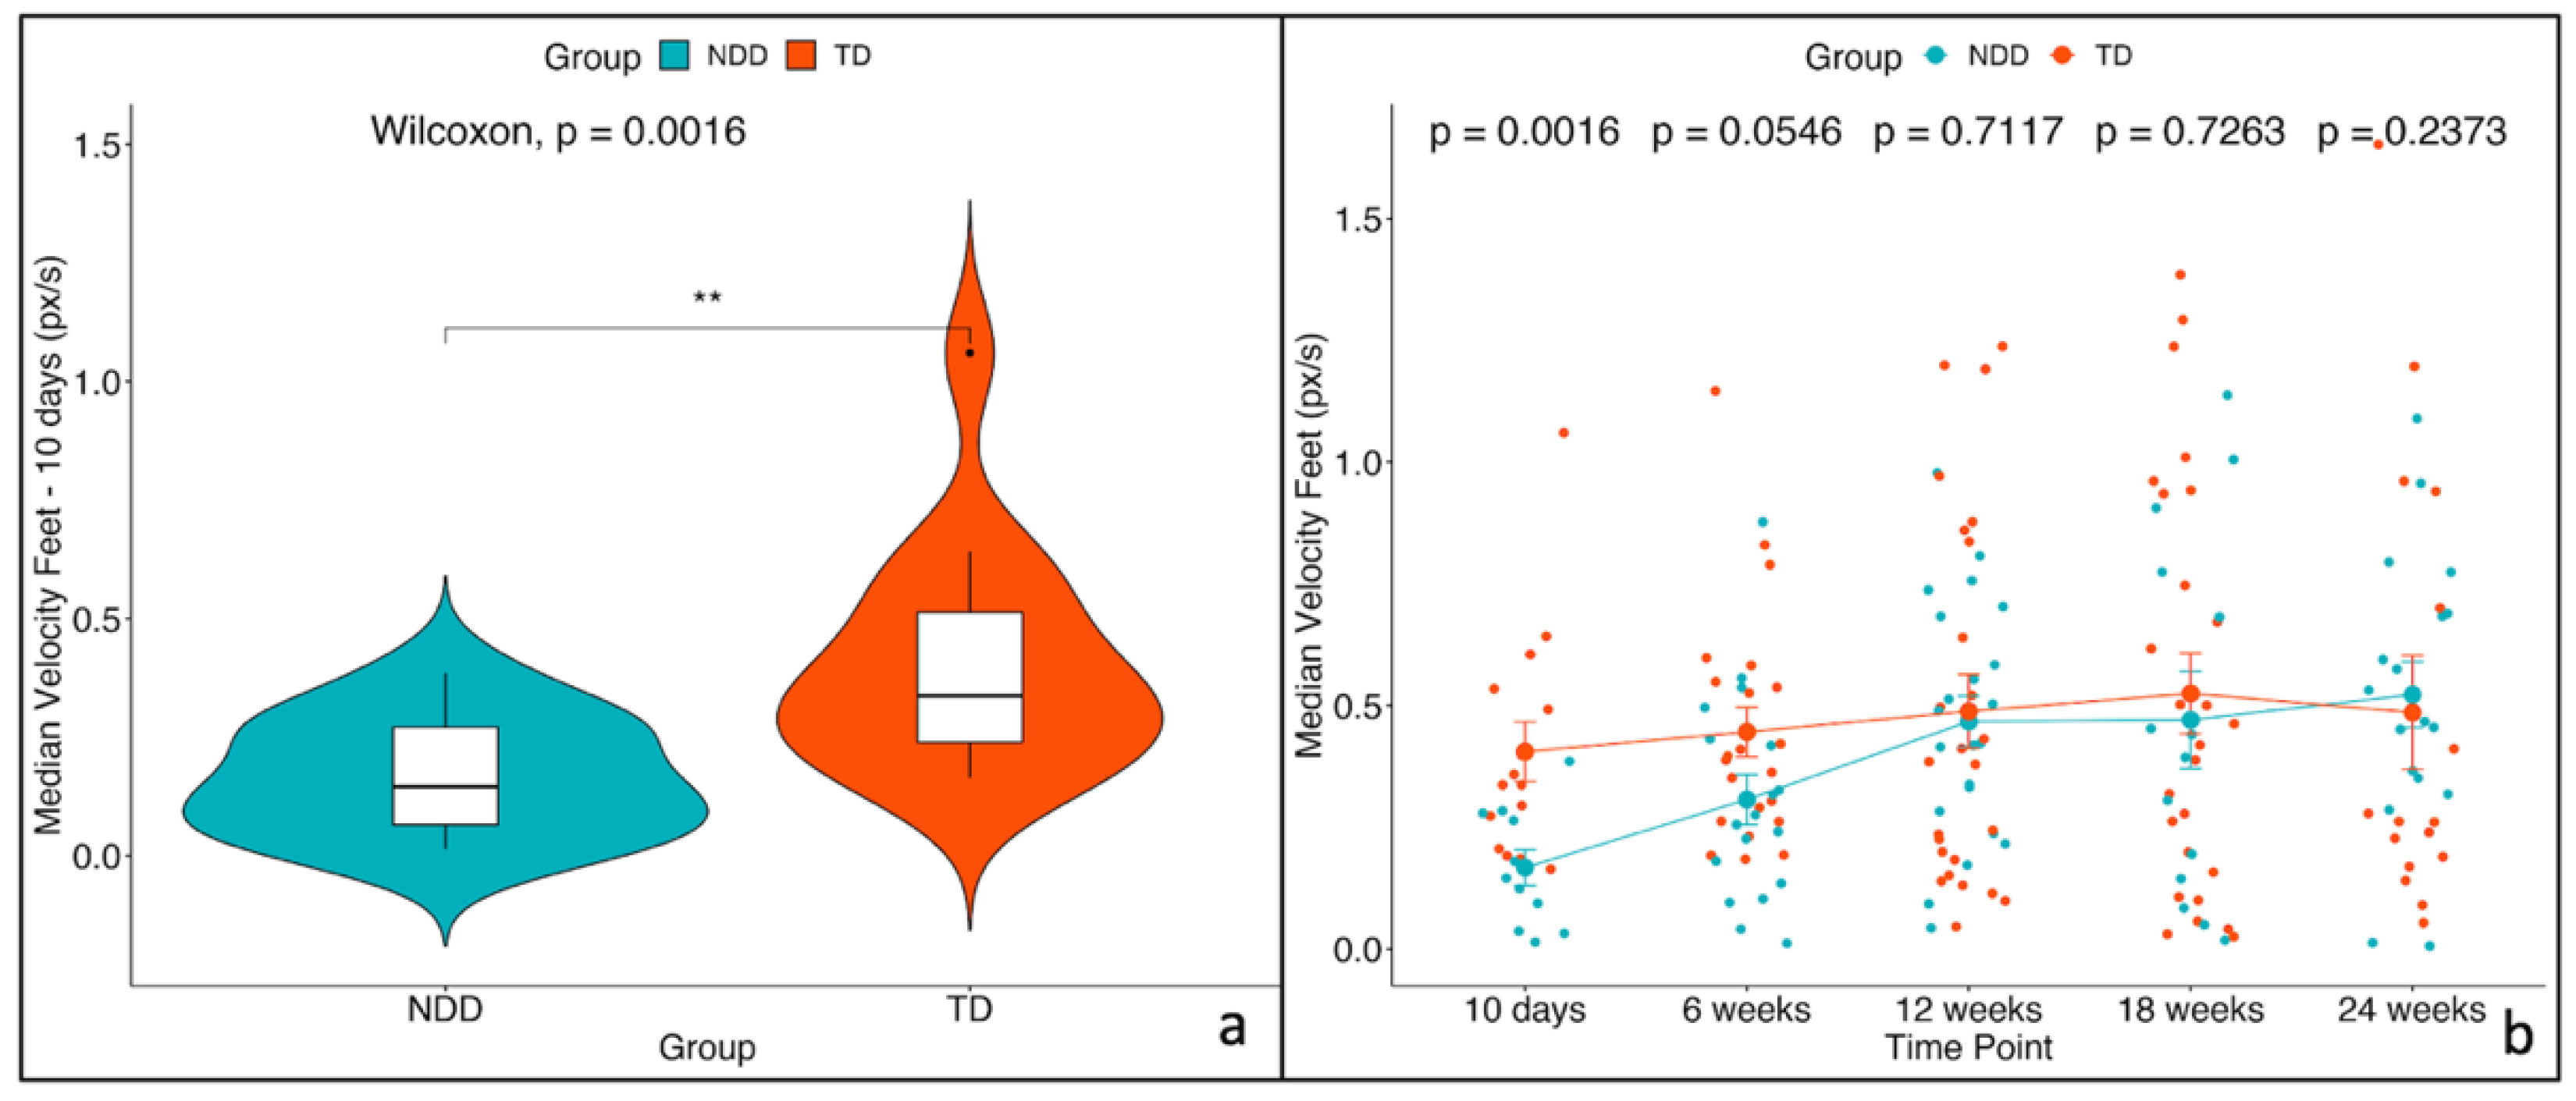
3.2. Feature Selected and Mixed-Effects Model
3.3. Classification
4. Discussion
5. Conclusions
Supplementary Materials
Author Contributions
Funding
Institutional Review Board Statement
Informed Consent Statement
Data Availability Statement
Acknowledgments
Conflicts of Interest
References
- American Psychiatric Association. Diagnostic and Statistical Manual of Mental Disorders; DSM-5-TR; American Psychiatric Association Publishing: Washington, DC, USA, 2022; ISBN 978-0-89042-575-6. [Google Scholar]
- Zwaigenbaum, L.; Bauman, M.L.; Stone, W.L.; Yirmiya, N.; Estes, A.; Hansen, R.L.; McPartland, J.C.; Natowicz, M.R.; Choueiri, R.; Fein, D.; et al. Early Identification of Autism Spectrum Disorder: Recommendations for Practice and Research. Pediatrics 2015, 136 (Suppl. S1), S10–S40. [Google Scholar] [CrossRef] [PubMed]
- Adolph, K.E.; Tamis-LeMonda, C.S. The Costs and Benefits of Development: The Transition From Crawling to Walking. Child Dev. Perspect. 2014, 8, 187–192. [Google Scholar] [CrossRef] [PubMed]
- Bradshaw, J.; Schwichtenberg, A.J.; Iverson, J.M. Capturing the Complexity of Autism: Applying a Developmental Cascades Framework. Child Dev. Perspect. 2022, 16, 18–26. [Google Scholar] [CrossRef]
- Iverson, J.M.; West, K.L.; Schneider, J.L.; Plate, S.N.; Northrup, J.B.; Roemer Britsch, E. Early Development in Autism: How Developmental Cascades Help Us Understand the Emergence of Developmental Differences. Adv. Child Dev. Behav. 2023, 64, 109–134. [Google Scholar] [CrossRef]
- Thelen, E. The Central Role of Action in Typical and Atypical Development. In Movement and Action in Learning and Development; Academic Press: Cambridge, MA, USA, 2004; pp. 49–73. ISBN 978-0-12-671860-7. [Google Scholar]
- Campbell, S.K.; Hedeker, D. Validity of the Test of Infant Motor Performance for Discriminating among Infants with Varying Risk for Poor Motor Outcome. J. Pediatr. 2001, 139, 546–551. [Google Scholar] [CrossRef] [PubMed]
- Einspieler, C.; Prechtl, H.F.; Ferrari, F.; Cioni, G.; Bos, A.F. The Qualitative Assessment of General Movements in Preterm, Term and Young Infants—Review of the Methodology. Early Hum. Dev. 1997, 50, 47–60. [Google Scholar] [CrossRef] [PubMed]
- Prechtl, H.F. Qualitative Changes of Spontaneous Movements in Fetus and Preterm Infant Are a Marker of Neurological Dysfunction. Early Hum. Dev. 1990, 23, 151–158. [Google Scholar] [CrossRef] [PubMed]
- Eliks, M.; Gajewska, E. The Alberta Infant Motor Scale: A Tool for the Assessment of Motor Aspects of Neurodevelopment in Infancy and Early Childhood. Front. Neurol. 2022, 13, 927502. [Google Scholar] [CrossRef] [PubMed]
- Peabody Developmental Motor Scales-Second Edition | RehabMeasures Database. Available online: https://www.sralab.org/rehabilitation-measures/peabody-developmental-motor-scales-second-edition (accessed on 24 November 2023).
- Pires, C.d.S.; Marba, S.T.M.; Caldas, J.P.d.S.; Stopiglia, M.d.C.S. Predictive Value of The General Movements Assessment in Preterm Infants: A Meta-Analysis. Rev. Paul. Pediatr. 2020, 38, e2018286. [Google Scholar] [CrossRef]
- Einspieler, C.; Sigafoos, J.; Bölte, S.; Bratl-Pokorny, K.D.; Landa, R.; Marschik, P.B. Highlighting the First 5 Months of Life: General Movements in Infants Later Diagnosed with Autism Spectrum Disorder or Rett Syndrome. Res. Autism Spectr. Disord. 2014, 8, 286–291. [Google Scholar] [CrossRef]
- Einspieler, C.; Bos, A.F.; Libertus, M.E.; Marschik, P.B. The General Movement Assessment Helps Us to Identify Preterm Infants at Risk for Cognitive Dysfunction. Front. Psychol. 2016, 7, 406. [Google Scholar] [CrossRef] [PubMed]
- Smith, B.A.; Vanderbilt, D.L.; Applequist, B.; Kyvelidou, A. Sample Entropy Identifies Differences in Spontaneous Leg Movement Behavior between Infants with Typical Development and Infants at Risk of Developmental Delay. Technologies 2017, 5, 55. [Google Scholar] [CrossRef] [PubMed]
- Silva, N.; Zhang, D.; Kulvicius, T.; Gail, A.; Barreiros, C.; Lindstaedt, S.; Kraft, M.; Bölte, S.; Poustka, L.; Nielsen-Saines, K.; et al. The Future of General Movement Assessment: The Role of Computer Vision and Machine Learning—A Scoping Review. Res. Dev. Disabil. 2021, 110, 103854. [Google Scholar] [CrossRef] [PubMed]
- Caruso, A.; Gila, L.; Fulceri, F.; Salvitti, T.; Micai, M.; Baccinelli, W.; Bulgheroni, M.; Scattoni, M.L. Early Motor Development Predicts Clinical Outcomes of Siblings at High-Risk for Autism: Insight from an Innovative Motion-Tracking Technology. Brain Sci. 2020, 10, 379. [Google Scholar] [CrossRef] [PubMed]
- Tsuji, T.; Nakashima, S.; Hayashi, H.; Soh, Z.; Furui, A.; Shibanoki, T.; Shima, K.; Shimatani, K. Markerless Measurement and Evaluation of General Movements in Infants. Sci. Rep. 2020, 10, 1422. [Google Scholar] [CrossRef] [PubMed]
- Jaiswal, A.; Kruiper, R.; Rasool, A.; Nandkeolyar, A.; Wall, D.P.; Washington, P. Digitally Diagnosing Multiple Developmental Delays Using Crowdsourcing Fused With Machine Learning: Protocol for a Human-in-the-Loop Machine Learning Study. JMIR Res. Protoc. 2024, 13, e52205. [Google Scholar] [CrossRef]
- Zago, M.; Kleiner, A.F.R.; Federolf, P.A. Editorial: Machine Learning Approaches to Human Movement Analysis. Front. Bioeng. Biotechnol. 2021, 8, 638793. [Google Scholar] [CrossRef] [PubMed]
- Shin, H.I.; Shin, H.-I.; Bang, M.S.; Kim, D.-K.; Shin, S.H.; Kim, E.-K.; Kim, Y.-J.; Lee, E.S.; Park, S.G.; Ji, H.M.; et al. Deep Learning-Based Quantitative Analyses of Spontaneous Movements and Their Association with Early Neurological Development in Preterm Infants. Sci. Rep. 2022, 12, 3138. [Google Scholar] [CrossRef]
- Reich, S.; Zhang, D.; Kulvicius, T.; Bölte, S.; Nielsen-Saines, K.; Pokorny, F.B.; Peharz, R.; Poustka, L.; Wörgötter, F.; Einspieler, C.; et al. Novel AI Driven Approach to Classify Infant Motor Functions. Sci. Rep. 2021, 11, 9888. [Google Scholar] [CrossRef]
- Moro, M.; Pastore, V.P.; Tacchino, C.; Durand, P.; Blanchi, I.; Moretti, P.; Odone, F.; Casadio, M. A Markerless Pipeline to Analyze Spontaneous Movements of Preterm Infants. Comput. Methods Programs Biomed. 2022, 226, 107119. [Google Scholar] [CrossRef]
- Doi, H.; Iijima, N.; Furui, A.; Soh, Z.; Yonei, R.; Shinohara, K.; Iriguchi, M.; Shimatani, K.; Tsuji, T. Prediction of Autistic Tendencies at 18 Months of Age via Markerless Video Analysis of Spontaneous Body Movements in 4-Month-Old Infants. Sci. Rep. 2022, 12, 18045. [Google Scholar] [CrossRef] [PubMed]
- Doi, H.; Furui, A.; Ueda, R.; Shimatani, K.; Yamamoto, M.; Sakurai, K.; Mori, C.; Tsuji, T. Spatiotemporal Patterns of Spontaneous Movement in Neonates Are Significantly Linked to Risk of Autism Spectrum Disorders at 18 Months Old. Sci. Rep. 2023, 13, 13869. [Google Scholar] [CrossRef]
- Groos, D.; Adde, L.; Støen, R.; Ramampiaro, H.; Ihlen, E.A.F. Towards Human-Level Performance on Automatic Pose Estimation of Infant Spontaneous Movements. Comput. Med. Imaging Graph. 2022, 95, 102012. [Google Scholar] [CrossRef]
- Marschik, P.B.; Pokorny, F.B.; Peharz, R.; Zhang, D.; O’Muircheartaigh, J.; Roeyers, H.; Bölte, S.; Spittle, A.J.; Urlesberger, B.; Schuller, B.; et al. A Novel Way to Measure and Predict Development: A Heuristic Approach to Facilitate the Early Detection of Neurodevelopmental Disorders. Curr. Neurol. Neurosci. Rep. 2017, 17, 43. [Google Scholar] [CrossRef] [PubMed]
- Caruso, A.; Micai, M.; Gila, L.; Fulceri, F.; Scattoni, M.L. The Italian Network for Early Detection of Autism Spectrum Disorder: Research Activities and National Policies. Psychiatr. Danub. 2021, 33, 65–68. [Google Scholar] [PubMed]
- Welcome to Python.Org. Available online: https://www.python.org/ (accessed on 23 November 2023).
- MathWorks—Makers of MATLAB and Simulink. Available online: https://www.mathworks.com/ (accessed on 18 June 2024).
- Lugaresi, C.; Tang, J.; Nash, H.; McClanahan, C.; Uboweja, E.; Hays, M.; Zhang, F.; Chang, C.-L.; Yong, M.G.; Lee, J.; et al. MediaPipe: A Framework for Building Perception Pipelines. arXiv 2019, arXiv:1906.08172. [Google Scholar]
- Bazarevsky, V.; Grishchenko, I.; Raveendran, K.; Zhu, T.; Zhang, F.; Grundmann, M. BlazePose: On-Device Real-Time Body Pose Tracking. arXiv 2020, arXiv:2006.10204. [Google Scholar]
- Sandler, M.; Howard, A.; Zhu, M.; Zhmoginov, A.; Chen, L.-C. MobileNetV2: Inverted Residuals and Linear Bottlenecks. In Proceedings of the IEEE Conference on Computer Vision and Pattern Recognition (CVPR), Salt Lake City, UT, USA, 18–22 June 2018. [Google Scholar]
- Pose Landmark Detection Guide | MediaPipe. Available online: https://developers.google.com/mediapipe/solutions/vision/pose_landmarker (accessed on 23 November 2023).
- Baccinelli, W.; Bulgheroni, M.; Simonetti, V.; Fulceri, F.; Caruso, A.; Gila, L.; Scattoni, M.L. Movidea: A Software Package for Automatic Video Analysis of Movements in Infants at Risk for Neurodevelopmental Disorders. Brain Sci. 2020, 10, 203. [Google Scholar] [CrossRef]
- Anstey, N.A. Correlation Techniques —A Review. Geophys. Prospect. 1964, 12, 355–382. [Google Scholar] [CrossRef]
- Meinecke, L.; Breitbach-Faller, N.; Bartz, C.; Damen, R.; Rau, G.; Disselhorst-Klug, C. Movement Analysis in the Early Detection of Newborns at Risk for Developing Spasticity Due to Infantile Cerebral Palsy. Hum. Mov. Sci. 2006, 25, 125–144. [Google Scholar] [CrossRef] [PubMed]
- Manly, B.; Navarro Alberto, J. Multivariate Statistical Methods. A Primer, 4th ed.; Routledge: London, UK, 2016; ISBN 978-1-4987-2896-6. [Google Scholar]
- Pearson’s Correlation Coefficient. In Encyclopedia of Public Health; Kirch, W., Ed.; Springer: Dordrecht, The Netherlands, 2008; pp. 1090–1091. ISBN 978-1-4020-5614-7. [Google Scholar]
- Elssied, N.; Ibrahim, O.; Hamza Osman, A. A Novel Feature Selection Based on One-Way ANOVA F-Test for E-Mail Spam Classification. Res. J. Appl. Sci. Eng. Technol. 2014, 7, 625–638. [Google Scholar] [CrossRef]
- Sawilowsky, S. Fermat, Schubert, Einstein, and Behrens-Fisher: The Probable Difference Between Two Means When Σ_1^2≠σ_2^2. J. Mod. Appl. Stat. Methods 2002, 1, 461–472. [Google Scholar] [CrossRef]
- Liu, H.; Motoda, H. Feature Selection for Knowledge Discovery and Data Mining; Kluwer Academic Publishers: New York, NY, USA, 1998; ISBN 978-0-7923-8198-3. [Google Scholar]
- Two-Stage Analysis versus Linear Mixed-Effects Models for Longitudinal Data [The Metafor Package]. Available online: https://www.metafor-project.org/doku.php/tips:two_stage_analysis (accessed on 18 June 2024).
- Bishop, C.M. Pattern Recognition and Machine Learning; Information Science and Statistics; Springer: New York, NY, USA, 2009; ISBN 978-0-387-31073-2. [Google Scholar]
- Berrar, D. Cross-Validation. In Encyclopedia of Bioinformatics and Computational Biology; Ranganathan, S., Gribskov, M., Nakai, K., Schönbach, C., Eds.; Academic Press: Oxford, UK, 2019; pp. 542–545. ISBN 978-0-12-811432-2. [Google Scholar]
- Hossin, M.; Sulaiman, M.N. A Review on Evaluation Metrics for Data Classification Evaluations. Int. J. Data Min. Knowl. Manag. Process 2015, 5, 1–11. [Google Scholar] [CrossRef]
- Iverson, J.M.; Shic, F.; Wall, C.A.; Chawarska, K.; Curtin, S.; Estes, A.; Gardner, J.M.; Hutman, T.; Landa, R.J.; Levin, A.R.; et al. Early Motor Abilities in Infants at Heightened versus Low Risk for ASD: A Baby Siblings Research Consortium (BSRC) Study. J. Abnorm. Psychol. 2019, 128, 69–80. [Google Scholar] [CrossRef] [PubMed]
- Adolph, K.E.; Franchak, J.M. The Development of Motor Behavior. Wiley Interdiscip. Rev. Cogn. Sci. 2017, 8, e1430. [Google Scholar] [CrossRef]
- Hadders-Algra, M. Early Human Motor Development: From Variation to the Ability to Vary and Adapt. Neurosci. Biobehav. Rev. 2018, 90, 411–427. [Google Scholar] [CrossRef]


| Time Point | NDD | TD | No Label | Drop-Out |
|---|---|---|---|---|
| 10 days | 11 | 15 | 2 | 4 |
| 6 weeks | 18 | 22 | 6 | 4 |
| 12 weeks | 22 | 25 | 6 | 2 |
| 18 weeks | 14 | 26 | 5 | 2 |
| 24 weeks | 18 | 16 | 6 | 1 |
| Variable | Group | Median | Min | Max | 95% Confidence Interval | Unpaired Wilcoxon Test | ||
|---|---|---|---|---|---|---|---|---|
| Lower | Upper | U | p-Value | |||||
| Median Velocity of the Feet [px/s] | NDD | 0.145 | 0.0140 | 0.385 | 0.0848 | 0.249 | 24 | 0.002 |
| TD | 0.337 | 0.1641 | 1.060 | 0.2742 | 0.536 | |||
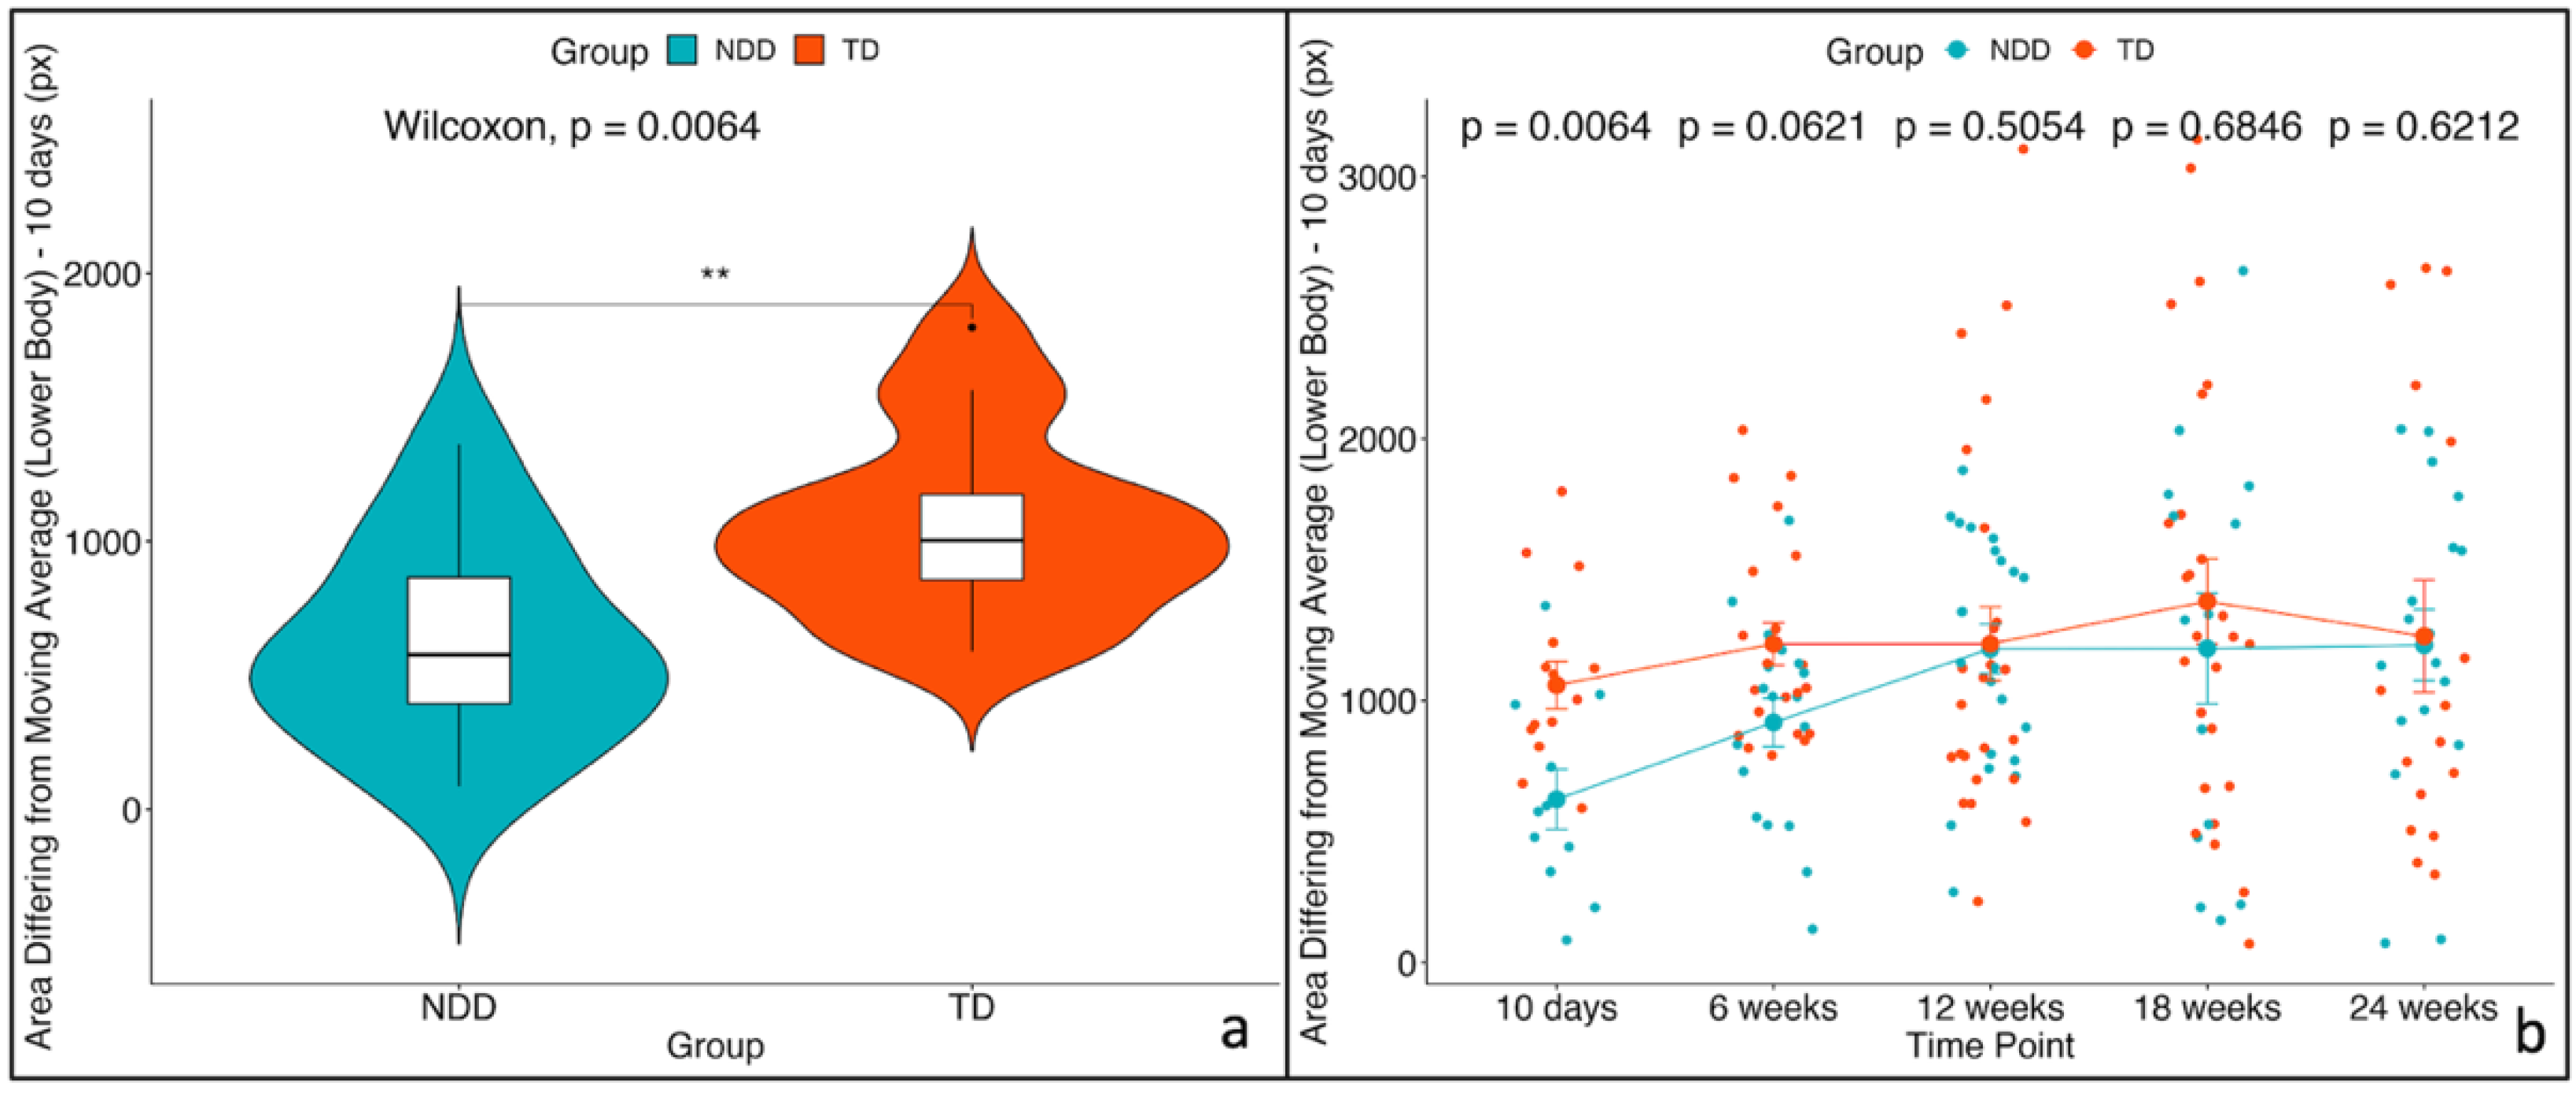
| Area differing from moving average (lower body) [px] | NDD | 576.866 | 86.1931 | 1361.686 | 368.1953 | 878.608 | 29 | 0.004 |
| TD | 1003.886 | 589.6773 | 1798.358 | 864.5623 | 1253.916 | |||
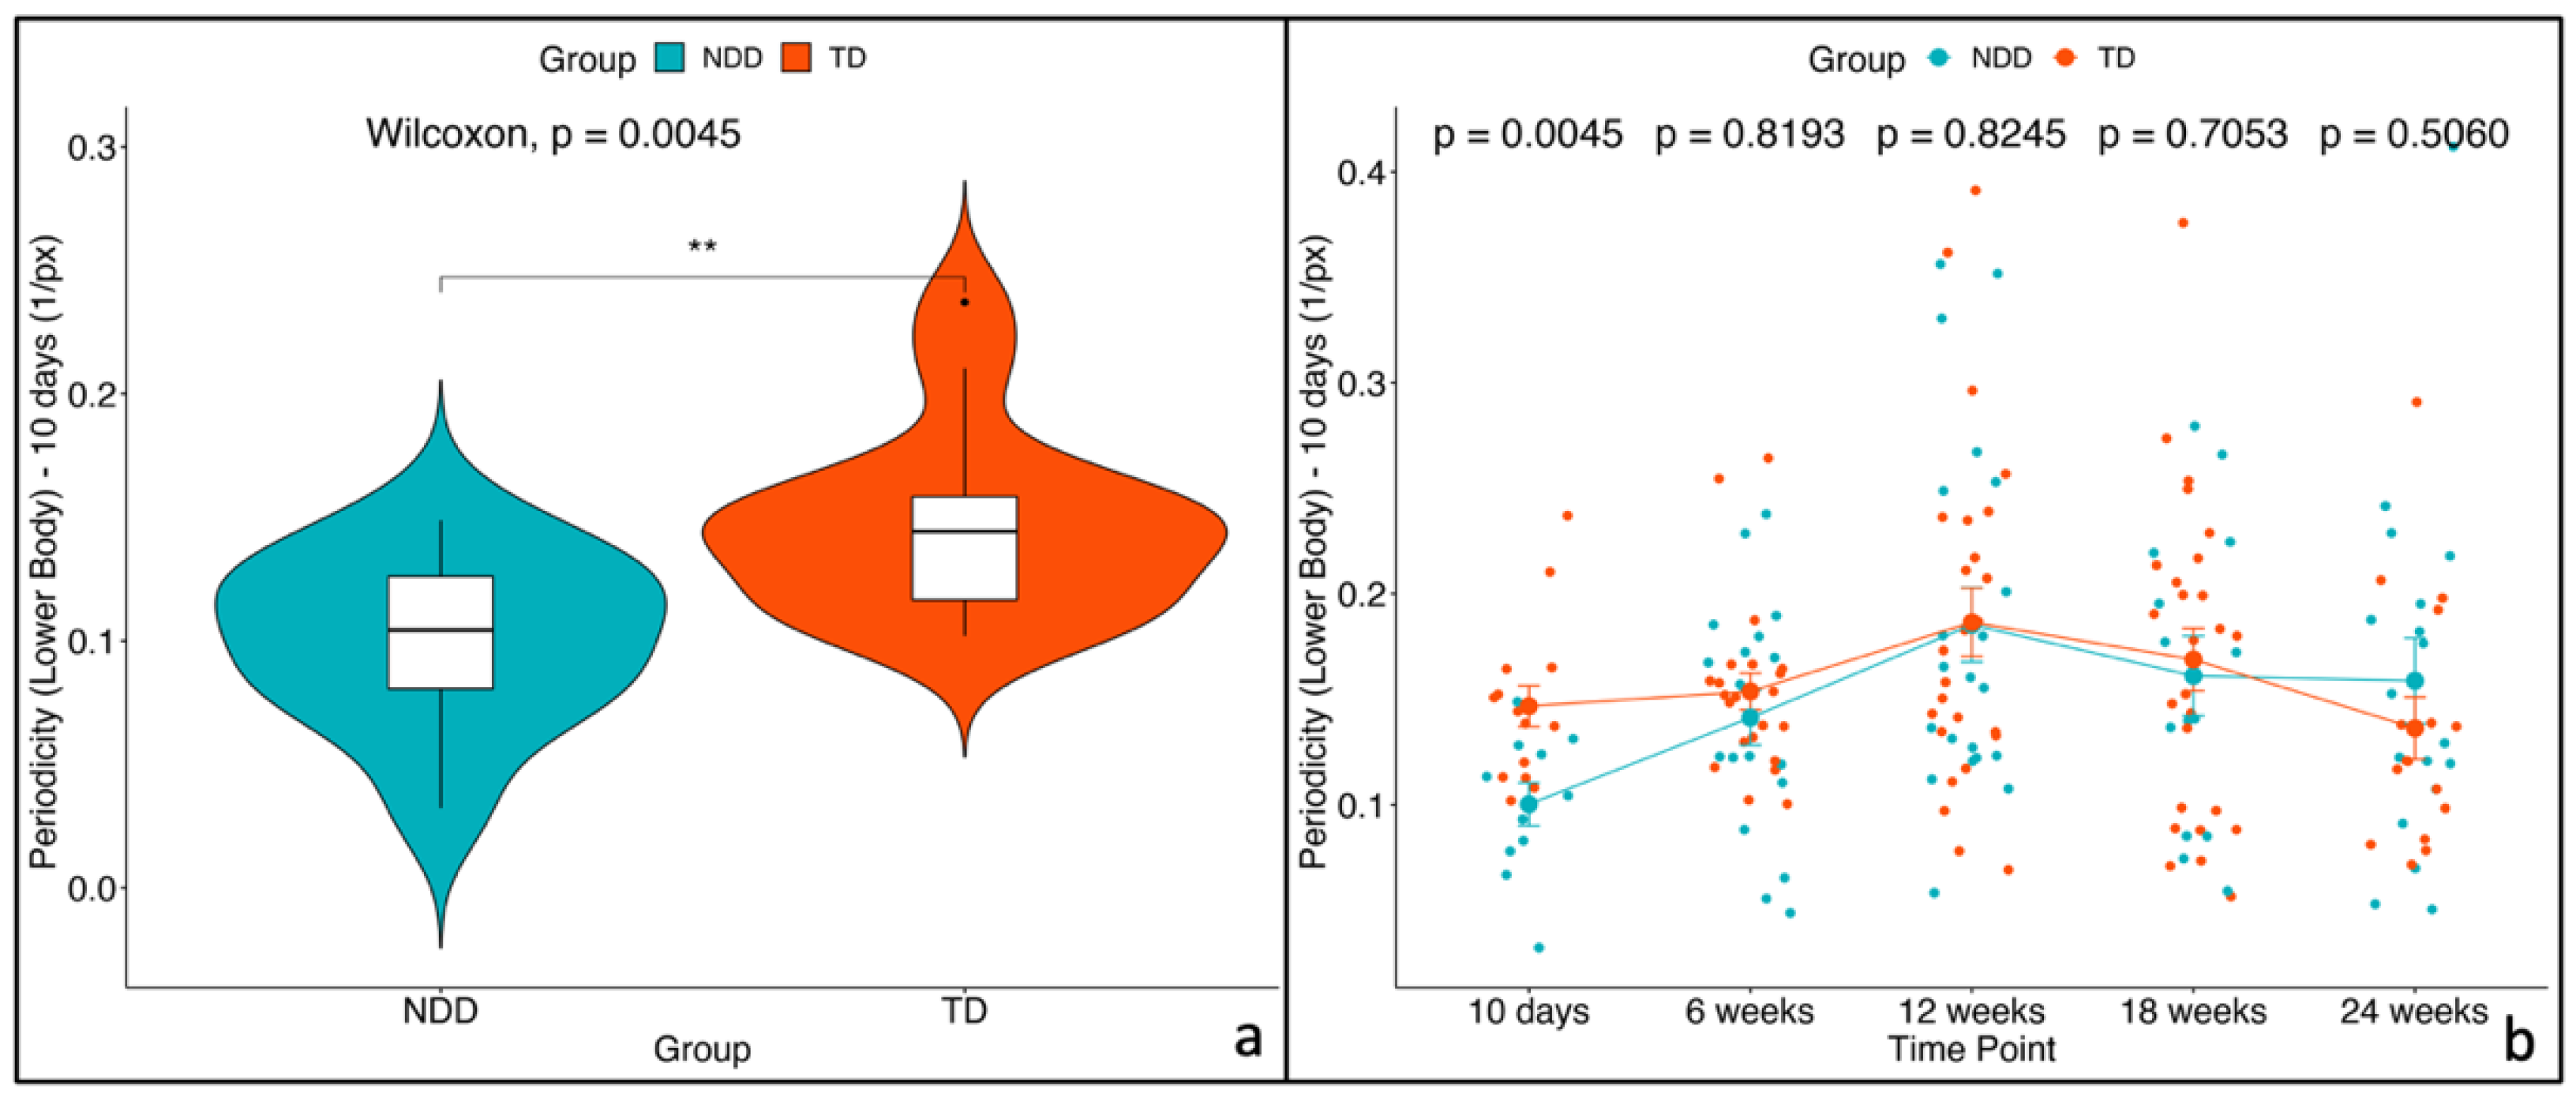
| Periodicity (lower body) [1/px] | NDD | 0.104 | 0.0323 | 0.149 | 0.0776 | 0.123 | 31 | 0.006 |
| TD | 0.144 | 0.1020 | 0.237 | 0.1261 | 0.167 | |||
| Comparison | |||||||||
|---|---|---|---|---|---|---|---|---|---|
| Variable | Time Point | Group | Time Point | Group | Difference | SE | t | Df | p |
| Median Velocity of Feet | 10 days | NDD | 10 days | TD | −0.25532 | 0.1262 | −2.0234 | 177 | 0.045 |
| 6 weeks | NDD | 6 weeks | TD | −0.14762 | 0.1019 | −1.4484 | 173 | 0.149 | |
| 12 weeks | NDD | 12 weeks | TD | −0.02627 | 0.0942 | −0.2790 | 169 | 0.781 | |
| 18 weeks | NDD | 18 weeks | TD | −0.07217 | 0.1061 | −0.6801 | 175 | 0.497 | |
| 24 weeks | NDD | 24 weeks | TD | 0.00852 | 0.1098 | 0.0776 | 176 | 0.938 | |
| Area differing from moving average (lower body) | 10 days | NDD | 10 days | TD | −488.51 | 232 | −2.1036 | 177 | 0.037 |
| 6 weeks | NDD | 6 weeks | TD | −329.69 | 190 | −1.7363 | 167 | 0.084 | |
| 12 weeks | NDD | 12 weeks | TD | −51.00 | 177 | −0.2888 | 158 | 0.773 | |
| 18 weeks | NDD | 18 weeks | TD | −240.54 | 197 | −1.2201 | 170 | 0.224 | |
| 24 weeks | NDD | 24 weeks | TD | −89.90 | 203 | −0.4418 | 173 | 0.659 | |
| Periodicity (lower body) | 10 days | NDD | 10 days | TD | −0.04338 | 0.0260 | −1.6703 | 177 | 0.097 |
| 6 weeks | NDD | 6 weeks | TD | −0.01417 | 0.0211 | −0.6709 | 170 | 0.503 | |
| 12 weeks | NDD | 12 weeks | TD | −0.00121 | 0.0196 | −0.0616 | 163 | 0.951 | |
| 18 weeks | NDD | 18 weeks | TD | −0.01011 | 0.0219 | −0.4605 | 173 | 0.646 | |
| 24 weeks | NDD | 24 weeks | TD | 0.01251 | 0.0227 | 0.5515 | 174 | 0.582 | |
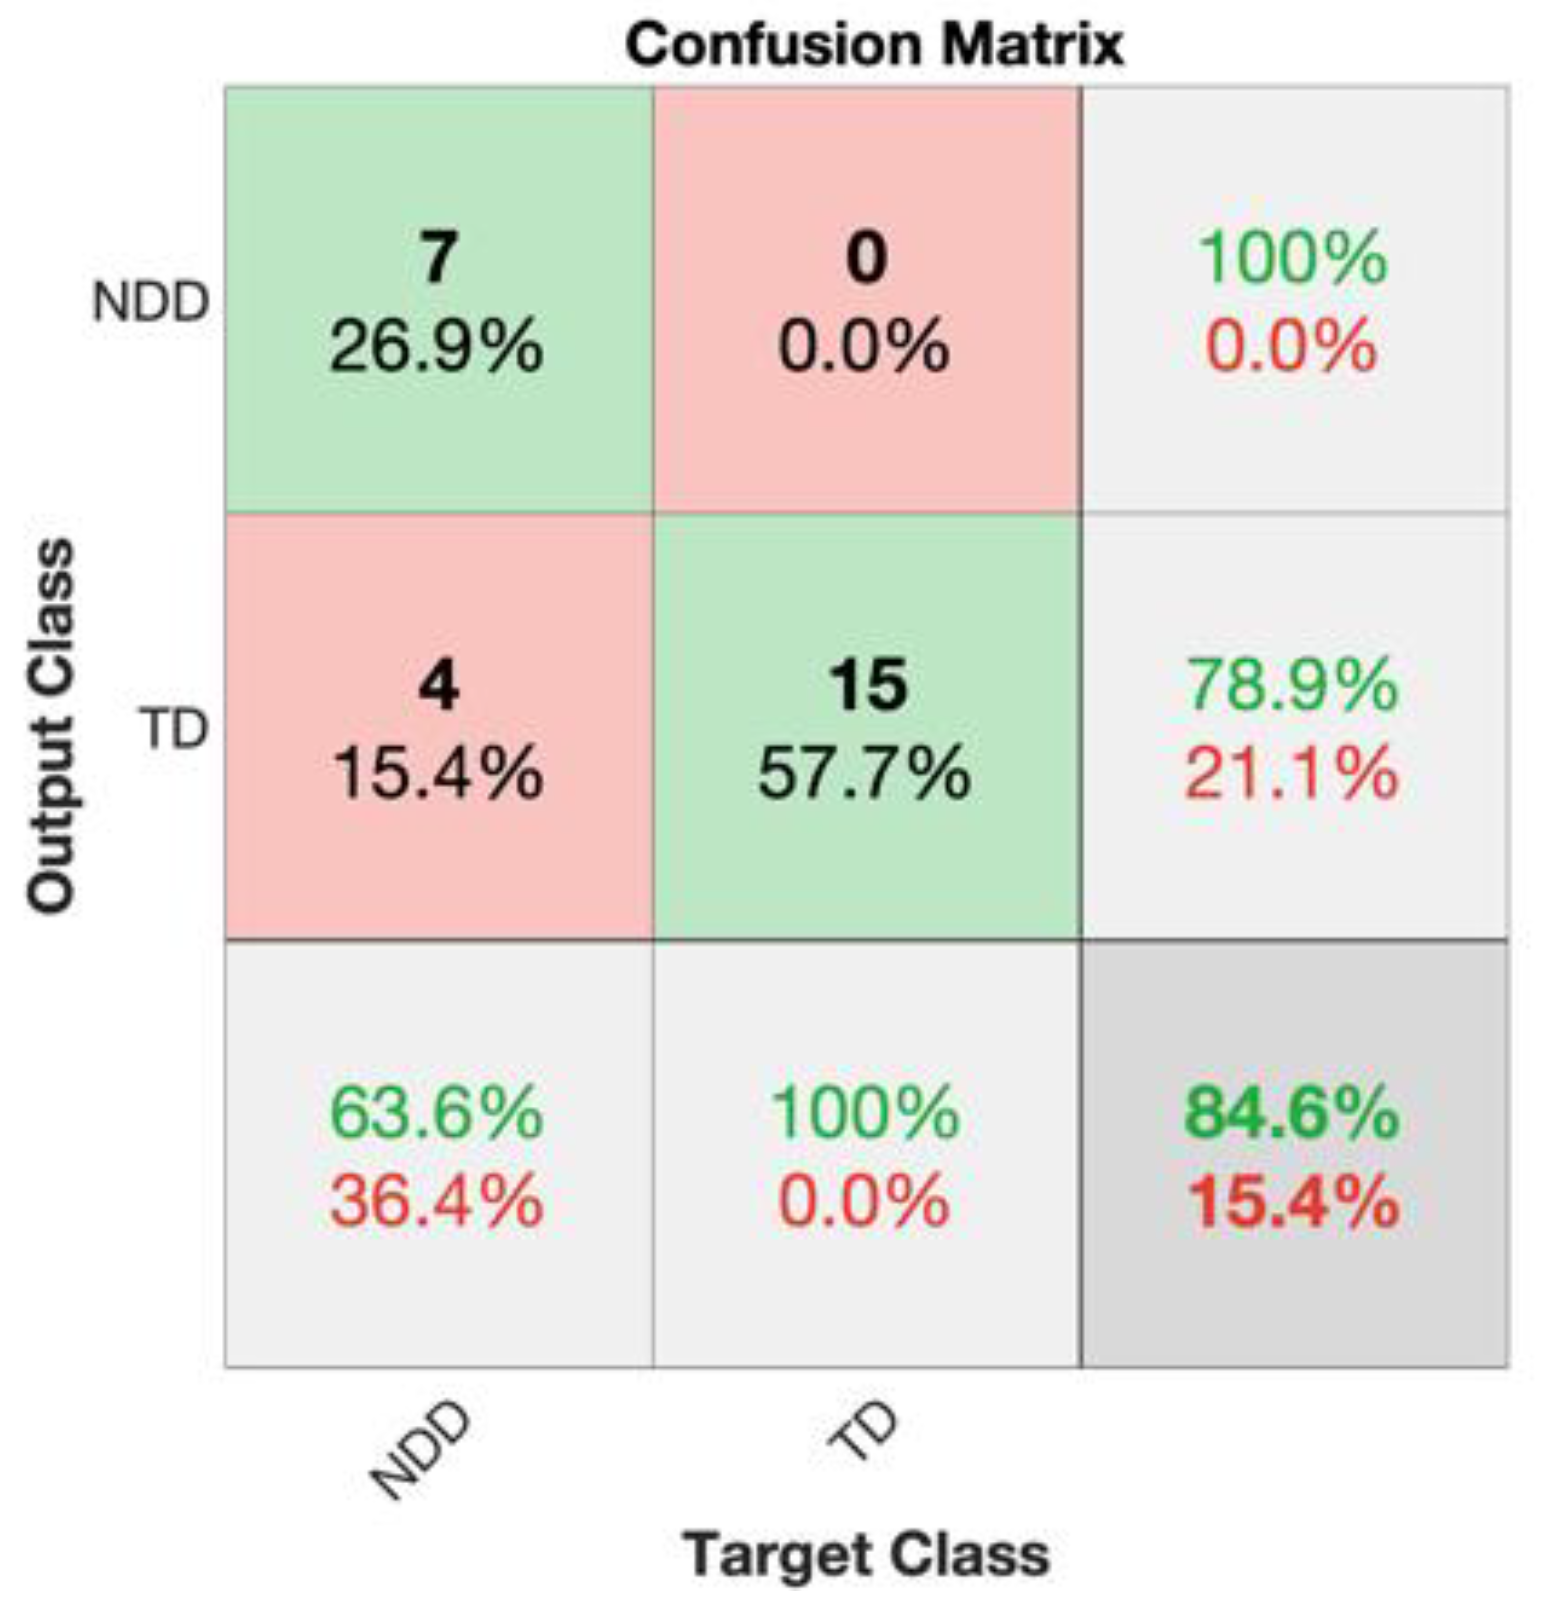
| Accuracy | Precision | Sensitivity | F1 Score | Specificity | |
|---|---|---|---|---|---|
| 10 days | 84.62% | 100% | 63.64% | 77.78% | 100% |
Disclaimer/Publisher’s Note: The statements, opinions and data contained in all publications are solely those of the individual author(s) and contributor(s) and not of MDPI and/or the editor(s). MDPI and/or the editor(s) disclaim responsibility for any injury to people or property resulting from any ideas, methods, instructions or products referred to in the content. |
© 2025 by the authors. Licensee MDPI, Basel, Switzerland. This article is an open access article distributed under the terms and conditions of the Creative Commons Attribution (CC BY) license (https://creativecommons.org/licenses/by/4.0/).
Share and Cite
Bruschetta, R.; Caruso, A.; Micai, M.; Campisi, S.; Tartarisco, G.; Pioggia, G.; Scattoni, M.L. Marker-Less Video Analysis of Infant Movements for Early Identification of Neurodevelopmental Disorders. Diagnostics 2025, 15, 136. https://doi.org/10.3390/diagnostics15020136
Bruschetta R, Caruso A, Micai M, Campisi S, Tartarisco G, Pioggia G, Scattoni ML. Marker-Less Video Analysis of Infant Movements for Early Identification of Neurodevelopmental Disorders. Diagnostics. 2025; 15(2):136. https://doi.org/10.3390/diagnostics15020136
Chicago/Turabian StyleBruschetta, Roberta, Angela Caruso, Martina Micai, Simona Campisi, Gennaro Tartarisco, Giovanni Pioggia, and Maria Luisa Scattoni. 2025. "Marker-Less Video Analysis of Infant Movements for Early Identification of Neurodevelopmental Disorders" Diagnostics 15, no. 2: 136. https://doi.org/10.3390/diagnostics15020136
APA StyleBruschetta, R., Caruso, A., Micai, M., Campisi, S., Tartarisco, G., Pioggia, G., & Scattoni, M. L. (2025). Marker-Less Video Analysis of Infant Movements for Early Identification of Neurodevelopmental Disorders. Diagnostics, 15(2), 136. https://doi.org/10.3390/diagnostics15020136