
Diagnostic Accuracy of Shear Wave Elastography in Predicting Malignant Origins of Pleural Effusions in Emergency Departments

 ,
,
Abstract
:1. Introduction
2. Materials and Methods
2.1. Study Design
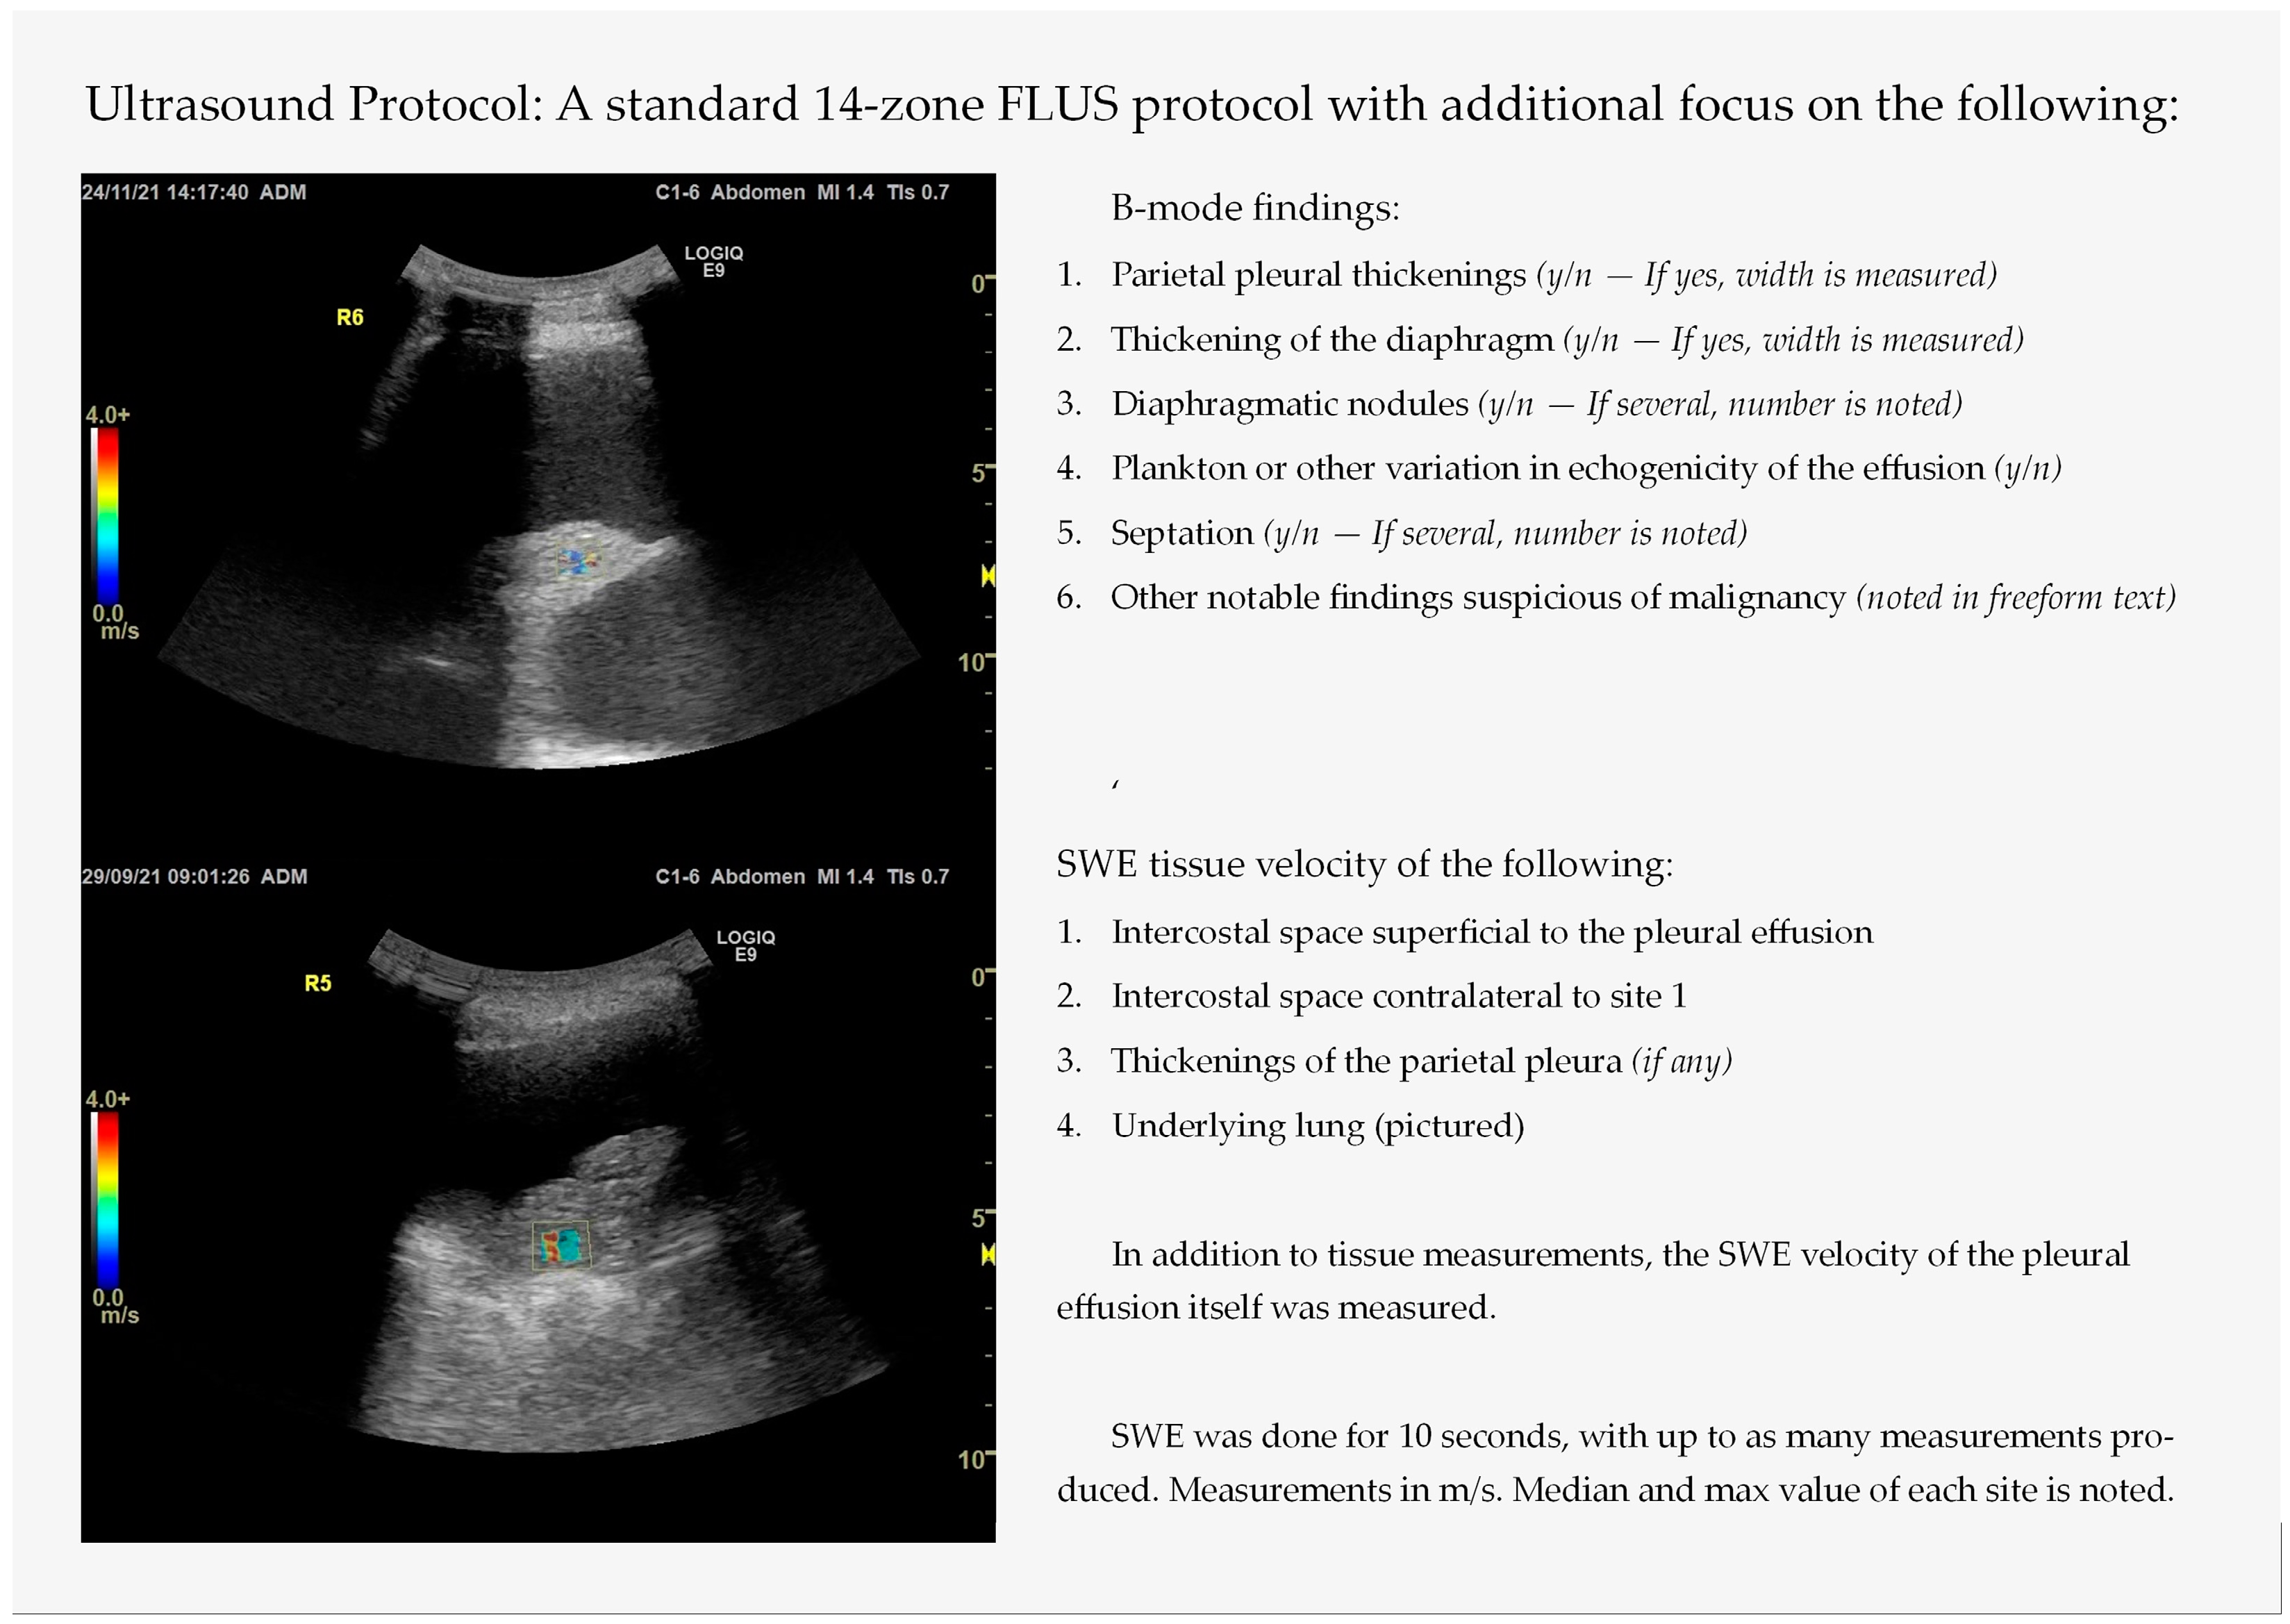
2.2. Thoracic Ultrasound with Integrated Elastography—Index Test
2.3. Initial Test Result Follow-Up
2.4. Reference Test
2.5. Statistical Analysis
2.6. Ethics
3. Results
3.1. Thoracic Ultrasound Findings
3.2. Shear Wave Elastography Findings
3.3. Structuring an SWE-Based Index Test
3.4. Diagnostic Accuracy of the Index Tests
4. Discussion
4.1. Interpretations and Perspectives
4.2. Strengths and Limitations
5. Conclusions
Author Contributions
Funding
Institutional Review Board Statement
Informed Consent Statement
Data Availability Statement
Conflicts of Interest
Appendix A
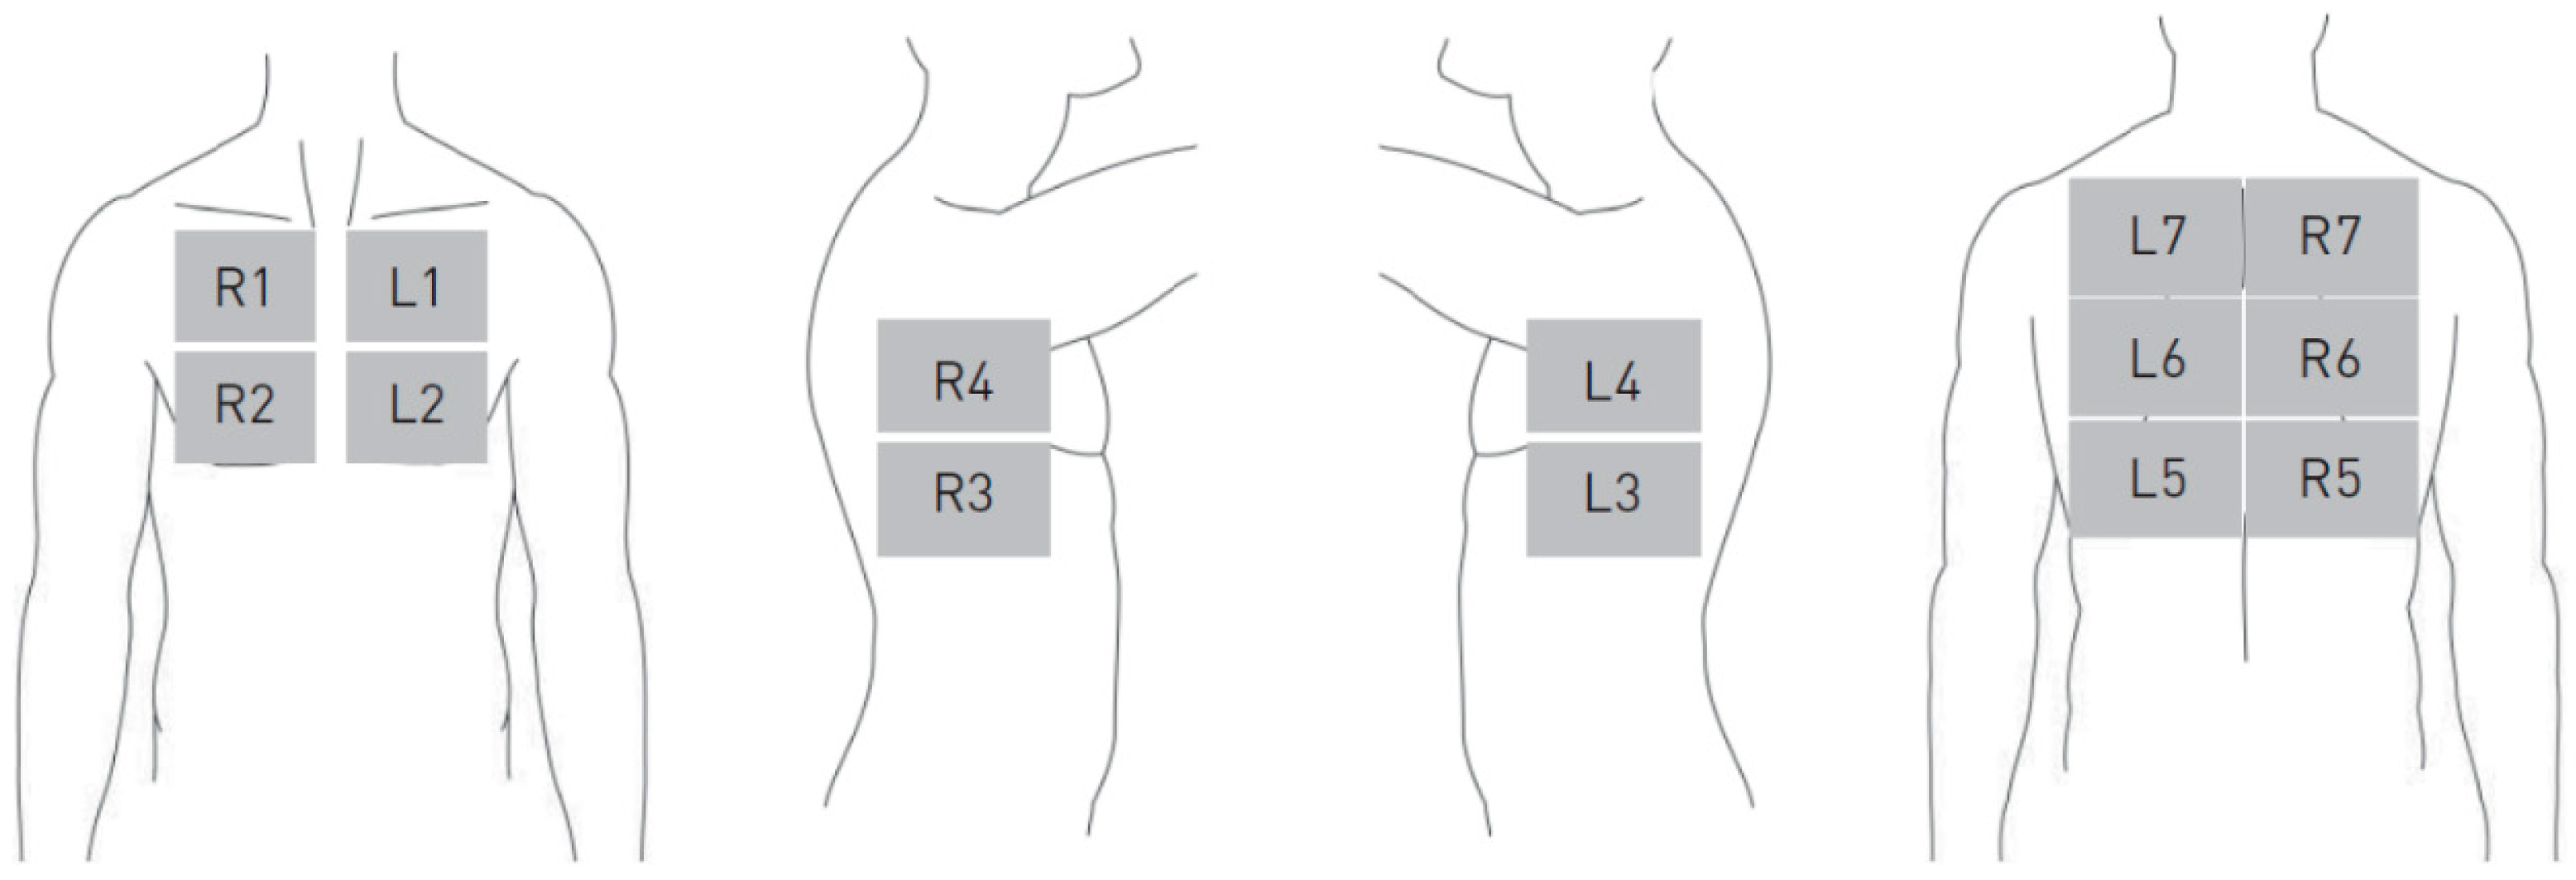
Focused Lung Ultrasound with Integrated Elastography—Procedure
Appendix B
Additional Tables

| Malignant PE (n = 7) | Benign PE (n = 32) | p-Value (Fisher’s Exact) | Exudate (n = 5) | Transudate (n = 8) | p-Value (Fisher’s Exact) | |
|---|---|---|---|---|---|---|
| B-mode findings, n (%): | ||||||
| 2 (28.6) | 11 (34.4) | 1 | 2 (40) | 3 (37.5) | 1 |
| 1 (14.3) | 9 (28.2) | 0.653 | 2 (40) | 2 (25) | 1 |
| 1 (14.3) | 8 (25) | 1 | 1 (20) | 2 (25) | 1 |
| 0 | 1 (3.2) | 1 | 0 | 0 | - |
| 1 (14.3) | 7 (21.9) | 1 | 1 | 2 (25) | 1 |
| 0 | 3 (9.4) | 1 | 1 (20) | 1 (12.5) | 1 |
| 0 | 2 (6.3) | 1 | 1 (20) | 1 (12.5) | 1 |
| 2 (28.6) | 0 | 0.028 | 0 | 1 (12.5) | 1 |
| 1 (33.3) | 4 (12.5) | 1 | - | - | - |
| SWE Findings | Malign Shapiro–Wilk p-Value (n) | Benign Shapiro–Wilk p-Value (n) | Malignant PE (n = 6) | Benign PE (n = 27) | p-Value (Mann–Whitney U) |
|---|---|---|---|---|---|
| 0.480 (5) | 0.03 (22) | 1.69 (1.12–1.97) | 1.64 (1.29–2.28) | 0.685 |
| 0.521 (5) | 0.486 (22) | 2.28 (2.23–2.62) | 1.97 (1.65–2.96) | 0.236 |
| 0.123 (4) | 0.921 (15) | −0.03 (−0.7–0.15) | −0.54 (−0.9—(−0.09)) | 0.388 |
| 0.911 (4) | 0.736 (15) | 0.01 (−0.5–0.69) | −0.72 (−1.2–(−0.29)) | 0.199 |
| 0.886 (3) | 0.395 (10) | 1.81 (1.12–2.66) | 1.41 (1.04–1.73) | 0.237 |
| 0.604 (3) | 0.026 (10) | 2.75 (1.12–3.51) | 1.42 (1.17–2.2) | 0.398 |
| 0.100 (3) | 0.001 (19) | 0.9 (0.89–0.94) | 1.38 (1.24–1.53) | 0.006 |
| 0.961 (3) | 0.008 (19) | 1.23 (0.96–1.52) | 1.82 (1.4–2.13) | 0.031 |
| - (0) | 0.439 (3) | - (0) | 1.96 (1.48–2.11) | - |
| - (0) | 0.010 (3) | - (0) | 2.16 (2.15–3.73) | - |
| SWE Region of Interest | Cases in Which SWE Yielded Results (Malign/Benign) | No Results Due to Poor Conditions for SWE (n) | No Results in Contrary to Good Conditions for SWE (n) |
|---|---|---|---|
| Intercostal space | 27 (5/22) | Patient’s wish (3) Practical difficulties (4) | 5 |
| Opposite intercostal space | 23 (4/19) | Patient’s wish (3) Practical difficulties (6) | 7 |
| Intercostal difference | 19 (4/15) | - | - |
| Pleural effusion | 13 (3/10) | No measurable pathology (2) Patient’s wish (3) Practical difficulties (4) | 17 |
| Lung consolidation | 22 (3/19) | No measurable pathology (3) Patient’s wish (2) Practical difficulties (6) | 6 |
| Pleural thickening | 3 (0/3) | No measurable pathology (29) Patient’s wish (3) Practical difficulties (4) | - |
| B-Mode Finding | True Positive/Total Positive | True Negative/Total Negative | Sensitivity | Specificity | PPV | NPV | PLR | NLR | Accuracy |
|---|---|---|---|---|---|---|---|---|---|
| B-mode index test of malignancy | 2/5 | 29/34 | 29% (4–71%) | 91% (75–98%) | 40% (12–77%) | 85% (78–90%) | 3.05 (0.62–15) | 0.79 (0.49–1.3) | 80% (64–91%) |
| B-mode index test of Exudates | 3/7 | 4/6 | 43% (10–82%) | 33% (4–78%) | 43% (21–68%) | 33% (12–65%) | 0.64 (0.23–1.8) | 1.71 (0.5–6.3) | 39% (14–68%) |
| Solely swirling sign | 2/5 | 5/8 | 40% (5–85%) | 63% (25–92%) | 40% (14–73%) | 63% (41–80%) | 1.07 (0.3–4.3) | 0.96 (0.4–2.4) | 54% (25–81%) |
| Solely septae | 2/4 | 6/9 | 40% (5–85%) | 75% (35–97%) | 50% (17–83%) | 67% (47–82%) | 1.6 (0.3–8) | 0.8 (0.4–1.8) | 62% (32–86%) |
| SWE Finding | Malign n/Benign n | Cutoff in m/s | Sensitivity | Specificity | AUROC | Youden | PPV | NPV | PLR | NLR | Accuracy |
|---|---|---|---|---|---|---|---|---|---|---|---|
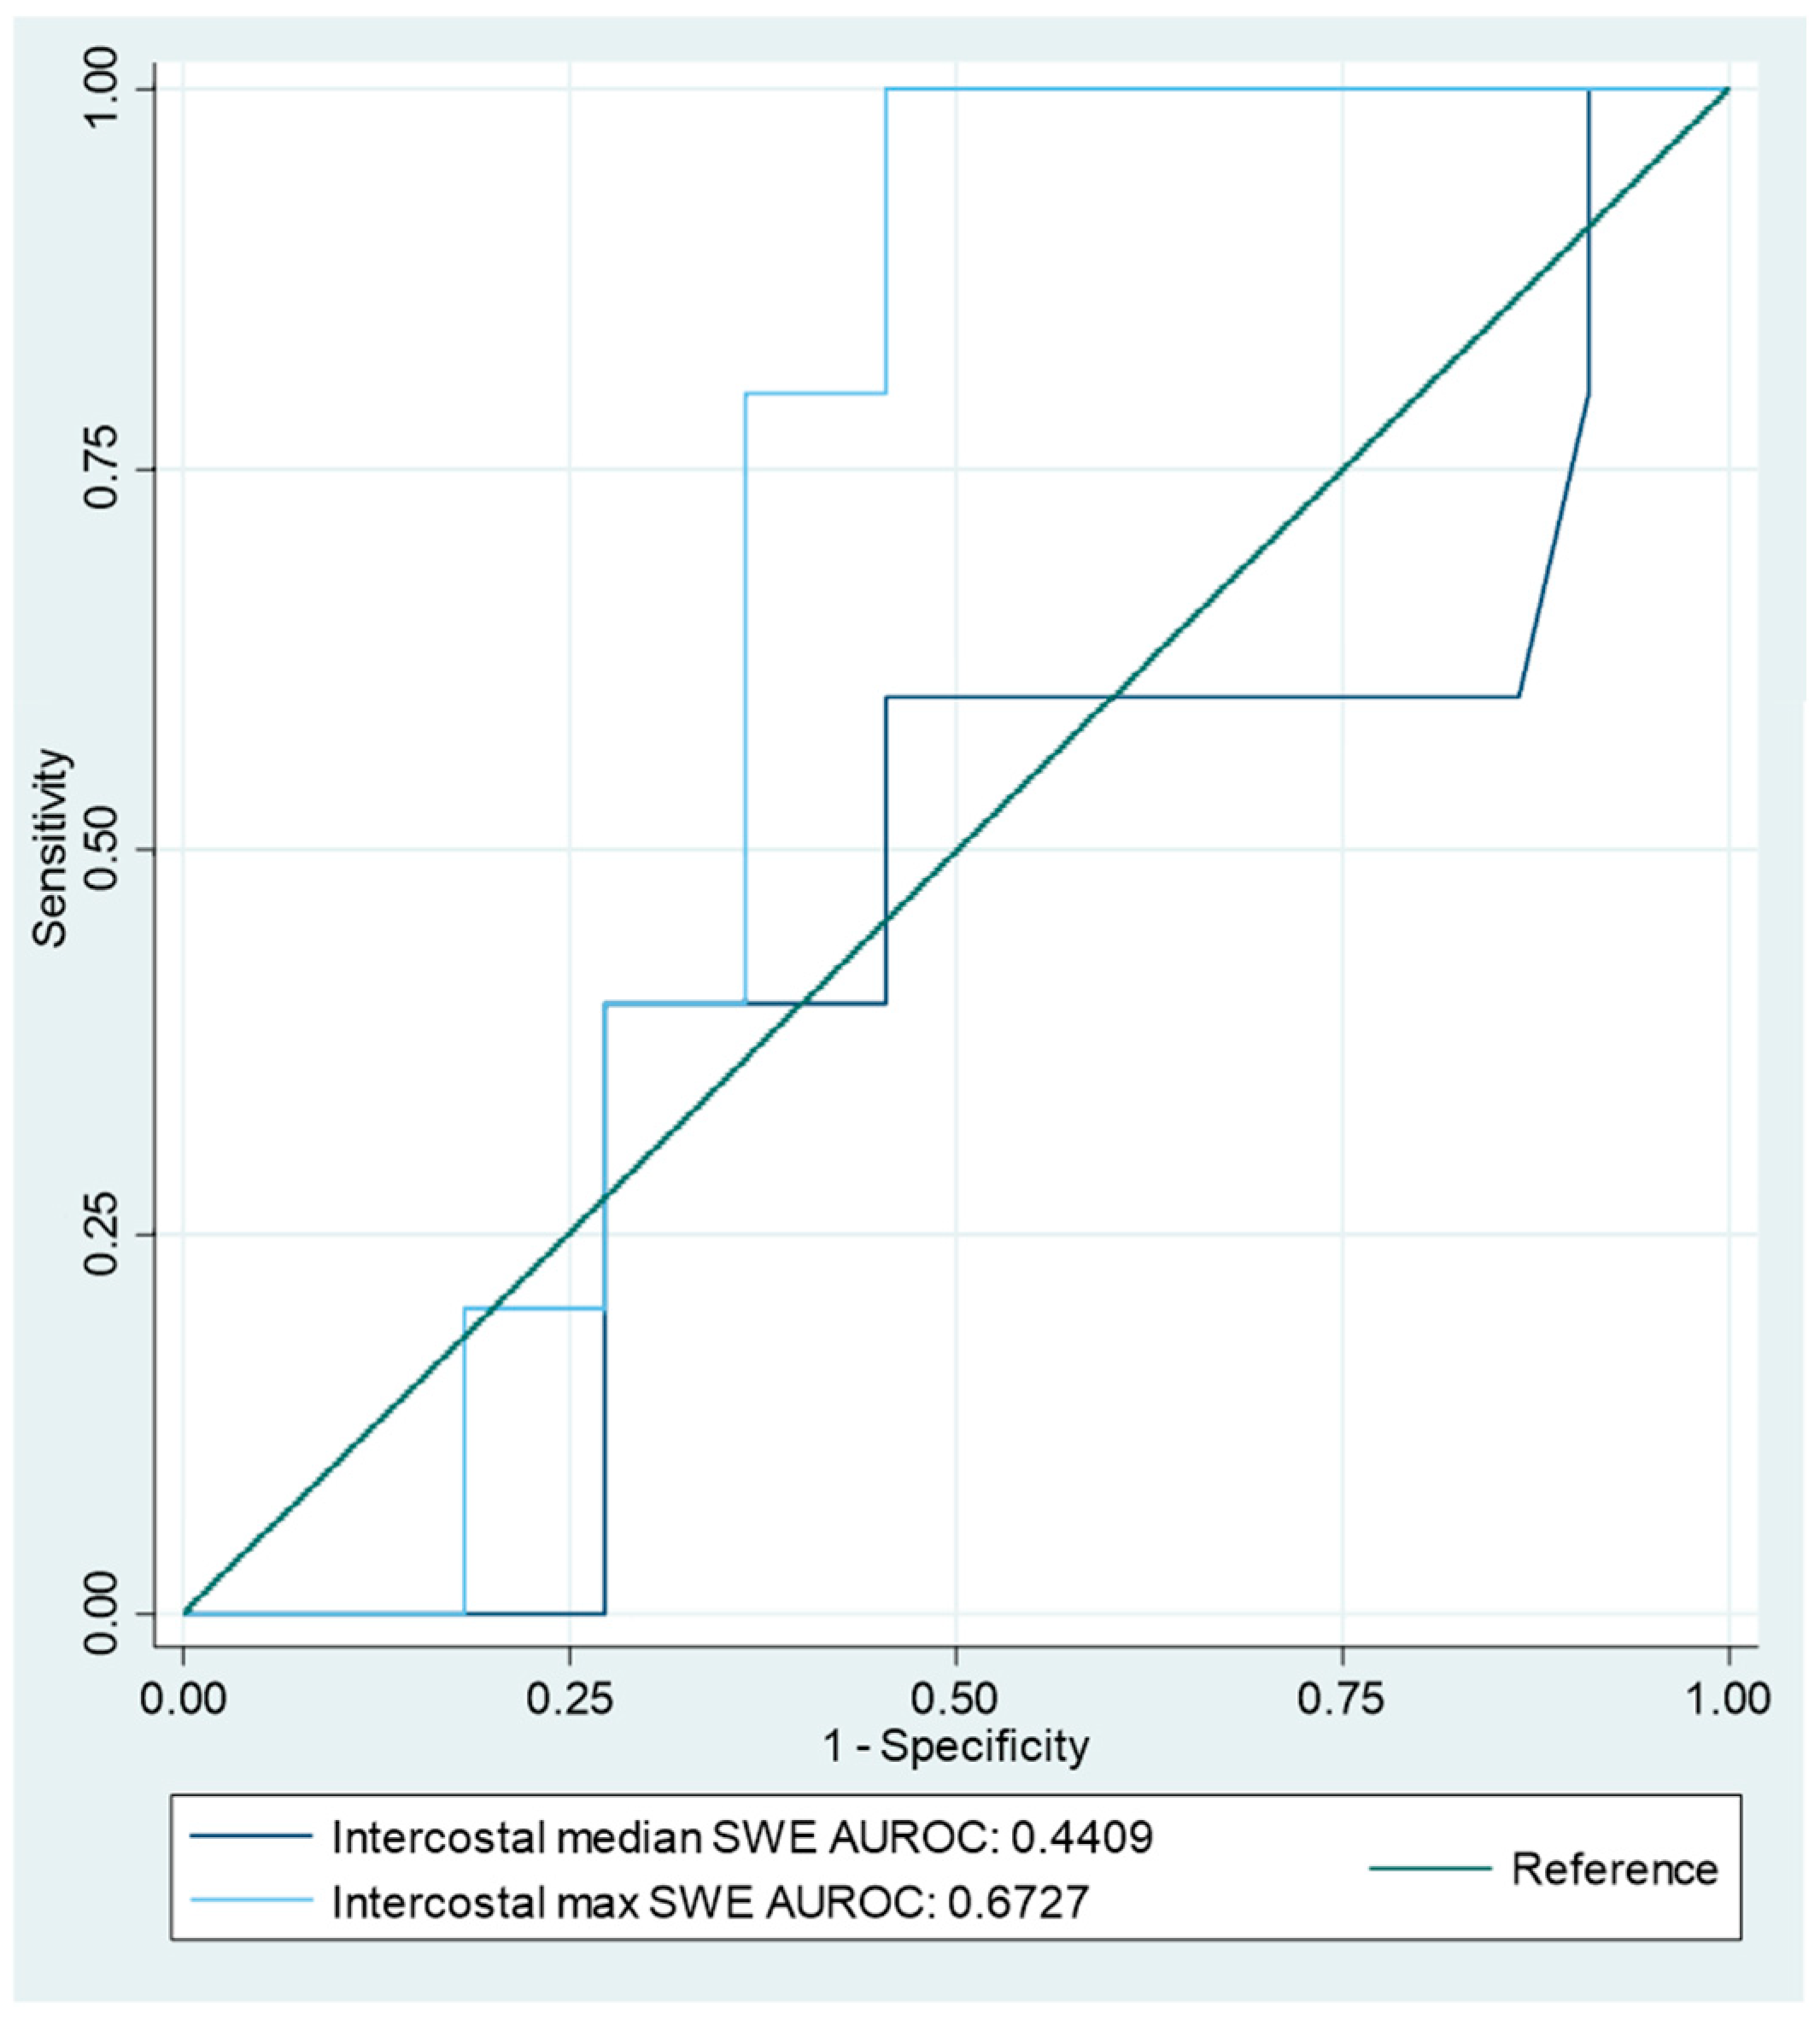
| Intercostal velocity median | 5/22 | 1.68 | 60% (15–95%) | 55% (32–76%) | 0.57 | 0.145 | 23% (11–41%) | 86% (66–95%) | 1.32 (0.56–3.1) | 0.73 (0.23–2.29) | 56% (35–75%) |
| Intercostal velocity max | 2.01 | 100% (48–100%) | 59% (36–79%) | 0.77 | 0.545 | 36% (25–48%) | 100% | 2.44 (1.5–4) | 0 | 67% (46–84%) | |
| Intercostal difference median | 4/15 | −0.18 | 75% (19–99%) | 73% (45–92%) | 0.74 | 0.483 | 43% (21–67%) | 92% (66–98%) | 2.81 (1–7.7) | 0.34 (0.06–1.91) | 74% (49–91%) |
| Intercostal difference max | −0.65 | 100% (40–100%) | 53% (27–79%) | 0.77 | 0.533 | 36% (25–50%) | 100% | 2.14 (1.3–3.7) | 0 | 63% (38–84%) | |
| Effusion velocity median | 3/10 | 1.77 | 67% (9–99%) | 80% (44–98%) | 0.73 | 0.467 | 50% (19–81%) | 89% (61–98%) | 3.33 (0.8–14.6) | 0.42 (0.08–2.13) | 77% (46–95%) |
| Effusion velocity max | 2.54 | 67% (9–99%) | 90% (56–100%) | 0.78 | 0.567 | 67% (21–94%) | 90% (64–98%) | 6.67 (0.9–50.5) | 0.37 (0.07–1.86) | 85% (55–98%) | |
| Lung consolidation velocity median | 3/19 | 0.945 | 100% (29–100%) | 100% (82–100%) | 1 | 1 | 100% | 100% | - | 0 | 100% (85–100%) |
| Lung consolidation velocity max | 1.525 | 100% (29–100%) | 68% (44–87%) | 0.84 | 0.684 | 33% (21–49%) | 100% | 3.17 (1.6–6.1) | 0 | 73% (50–89%) | |
| Pleural velocity median | 0/3 |
| |||||||||
| Pleural velocity max | |||||||||||
References
- Sahn, S.A.; Heffner, J.E. Pleural fluid analysis. In Textbook of Pleural Diseases, 2nd ed.; Light, R.W., Lee, Y.C.G., Eds.; CRC Press: Boca Raton, FL, USA, 2008; pp. 209–226. [Google Scholar]
- Hooper, C.; Lee, Y.C.G.; Maskell, N. Investigation of a unilateral pleural effusion in adults: British Thoracic Society pleural disease guideline 2010. Thorax 2010, 65, ii4–ii17. [Google Scholar] [CrossRef] [PubMed]
- Porcel, J.M.; Light, R.W. Diagnostic approach to pleural effusion in adults. Am. Fam. Physician 2006, 73, 1211–1220. [Google Scholar] [PubMed]
- Skok, K.; Hladnik, G.; Grm, A.; Crnjac, A. Malignant Pleural Effusion and Its Current Management: A Review. Medicina 2019, 55, 490. [Google Scholar] [CrossRef]
- Light, R.W. Pleural effusions. Med. Clin. N. Am. 2011, 95, 1055–1070. [Google Scholar] [CrossRef]
- Aboudara, M.; Maldonado, F. Update in the Management of Pleural Effusions. Med. Clin. N. Am. 2019, 103, 475–485. [Google Scholar] [CrossRef] [PubMed]
- Roberts, M.E.; Neville, E.; Berrisford, R.G.; Antunes, G.; Ali, N.J. Management of a malignant pleural effusion: British Thoracic Society pleural disease guideline 2010. Thorax 2010, 65, ii32–ii40. [Google Scholar] [CrossRef]
- McCracken, D.J.; Laursen, C.B.; Barker, G.; Gleeson, F.V.; Cullen, K.M.; Rahman, N.M. Thoracic ultrasound competence for ultrasound-guided pleural procedures. Eur. Respir. Rev. 2019, 28, 190090. [Google Scholar] [CrossRef]
- Laursen, C.B.; Bhatnagar, R.; Juul, A.D. A Stepwise Approach for Performing Ultrasound Guided Transthoracic Lung Biopsy. J. Vis. Exp. 2023, 201, e65769. [Google Scholar] [CrossRef]
- Falster, C.; Noël-Savina, E.; Gille, T.; Pietersen, P. Thoracic ultrasound for pneumothorax and infectious effusion: From equine beginnings to clinical cornerstone. Breathe 2023, 19, 230153. [Google Scholar] [CrossRef]
- Falster, C.; Mørkenborg, M.D.; Thrane, M.; Clausen, J.; Arvig, M.; Brockhattingen, K.; Biesenbach, P.; Paludan, L.; Nielsen, R.W.; Nhi Huynh, T.A.; et al. Utility of ultrasound in the diagnostic work-up of suspected pulmonary embolism: An open-label multicentre randomized controlled trial (the PRIME study). Lancet Reg. Health Eur. 2024, 42, 100941. [Google Scholar] [CrossRef]
- Qureshi, N.R.; Rahman, N.M.; Gleeson, F.V. Thoracic ultrasound in the diagnosis of malignant pleural effusion. Thorax 2009, 64, 139–143. [Google Scholar] [CrossRef] [PubMed]
- Jiang, B.; Li, X.-L.; Yin, Y.; Zhang, Q.; Zang, T.; Song, W.-S.; Wang, X.-M.; Kang, J.; Herth, F.J.F.; Hou, G. Ultrasound elastography: A novel tool for the differential diagnosis of pleural effusion. Eur. Respir. J. 2019, 54, 1802018. [Google Scholar] [CrossRef] [PubMed]
- Taljanovic, M.S.; Gimber, L.H.; Becker, G.W.; Latt, L.D.; Klauser, A.S.; Melville, D.M.; Gao, L.; Witte, R.S. Shear-Wave Elastography: Basic Physics and Musculoskeletal Applications. Radiographics 2017, 37, 855–870. [Google Scholar] [CrossRef] [PubMed]
- Moore, C.L.; Copel, J.A. Point-of-Care Ultrasonography. N. Engl. J. Med. 2011, 364, 749–757. [Google Scholar] [CrossRef] [PubMed]
- Ovesen, S.H.; Clausen, A.H.; Kirkegaard, H.; Løfgren, B.; Aagaard, R.; Skaarup, S.H.; Arvig, M.D.; Lorentzen, M.H.; Kristensen, A.H.; Cartuliares, M.B.; et al. Point-of-Care Lung Ultrasound in Emergency Medicine: A Scoping Review with an Interactive Database. Chest 2024, 166, 544–560. [Google Scholar] [CrossRef]
- Laursen, C.B.; Sloth, E.; Lassen, A.T.; Christensen, R.; Lambrechtsen, J.; Madsen, P.H.; Henriksen, D.P.; Davidsen, J.R.; Rasmussen, F. Point-of-care ultrasonography in patients admitted with respiratory symptoms: A single-blind, randomised controlled trial. Lancet Respir. Med. 2014, 2, 638–646. [Google Scholar] [CrossRef]
- Laursen, C.B.; Rømhild Davidsen, J.; Gleeson, F. Technique and protocols. In Thoracic Ultrasound; Laursen, C.B., Rahman, N.M., Volpicelli, G., Eds.; ERS Monograph; European Respiratory Society: Sheffield, UK, 2018; Volume 2018, pp. 14–30. [Google Scholar]
- Lorentzen, M.J.; Kristensen, A.H.; Kaldan, F.P.; Cartuliares, M.B.; Hertz, M.A.; Specht, J.J.; Posth, S.; Lindberg, M.J.H.; Skaarup, S.H.; Hansen, M.R.; et al. Handheld Ultrasound Devices Used by Newly Certified Operators for Pneumonia in the Emergency Department-A Diagnostic Accuracy Study. Diagnostics 2024, 14, 1921. [Google Scholar] [CrossRef]
- Ökmen, K.; Yildiz, D.K.; Soyaslan, E.; Ceylan, İ.; Sayan, H.E.; Aytünür, C.S. Comparison of two different lung ultrasound imaging protocols in COVID-19 pneumonia. Ultrasonography 2022, 41, 212–221. [Google Scholar] [CrossRef]
- Lim, C.K.; Chung, C.L.; Lin, Y.T.; Chang, C.H.; Lai, Y.C.; Wang, H.C.; Yu, C.J. Transthoracic Ultrasound Elastography in Pulmonary Lesions and Diseases. Ultrasound Med. Biol. 2017, 43, 145–152. [Google Scholar] [CrossRef]
- Safai Zadeh, E.; Görg, C.; Prosch, H.; Jenssen, C.; Blaivas, M.; Laursen, C.B.; Jacobsen, N.; Dietrich, C.F. Wfumb Technological Review: How to Perform Contrast-Enhanced Ultrasound of the Lung. Ultrasound Med. Biol. 2022, 48, 598–616. [Google Scholar] [CrossRef]
- Rednic, N.; Orasan, O. Subpleural lung tumors ultrasonography. Med. Ultrason. 2010, 12, 81–87. [Google Scholar] [PubMed]
- Kooraki, S.; Abtin, F. Image-Guided Biopsies and Interventions of Mediastinal Lesions. Radiol. Clin. N. Am. 2021, 59, 291–303. [Google Scholar] [CrossRef] [PubMed]
- Yang, P.C.; Luh, K.T.; Chang, D.B.; Wu, H.D.; Yu, C.J.; Kuo, S.H. Value of sonography in determining the nature of pleural effusion: Analysis of 320 cases. Am. J. Roentgenol. 1992, 159, 29–33. [Google Scholar] [CrossRef] [PubMed]
- Patel, K.M.; Ullah, K.; Patail, H.; Ahmad, S. Ultrasound for Pleural Disease. Beyond a Pocket of Pleural Fluid. Ann. Am. Thorac. Soc. 2021, 18, 749–756. [Google Scholar] [CrossRef]
- Altman, D.G.; Machin, D.; Bryant, T.N.; Gardner, M.J. Statistics with Confidence, 2nd ed.; Altman, D., Ed.; BMJ Books: London, UK, 2000. [Google Scholar]
- Mercaldo, N.D.; Lau, K.F.; Zhou, X.H. Confidence intervals for predictive values with an emphasis to case–control studies. Stat. Med. 2007, 26, 2170–2183. [Google Scholar] [CrossRef]
- Alhyari, A.; Görg, C.; Dietrich, C.F.; Trenker, C.; Ludwig, M.; Safai Zadeh, E. Diagnostic Performance of Point Shear Wave Elastography Using Acoustic Radiation Force Impulse Technology in Peripheral Pulmonary Consolidations: A Feasibility Study. Ultrasound Med. Biol. 2022, 48, 778–785. [Google Scholar] [CrossRef]
- Quarato, C.M.I.; Venuti, M.; Dimitri, L.; Lacedonia, D.; Simeone, A.; Mirijello, A.; De Cosmo, S.; Maiello, E.; Taurchini, M.; Scioscia, G.; et al. Transthoracic ultrasound shear wave elastography for the study of subpleural lung lesions. Ultrasonography 2022, 41, 93–105. [Google Scholar] [CrossRef]
- Sigrist, R.M.S.; Liau, J.; Kaffas, A.E.; Chammas, M.C.; Willmann, J.K. Ultrasound Elastography: Review of Techniques and Clinical Applications. Theranostics 2017, 7, 1303–1329. [Google Scholar] [CrossRef]

| TUS | TUS + Elastography | |
|---|---|---|
| Patients (n) | 39 | 33 |
| Mean age, years (+/−SD) | 80.3 (+/−8.1) | 80.72 (+/−8.43) |
| Male/Female | 19/20 | 16/17 |
| Total MPE, n (%) | 7 (18) | 6 (18.2) |
| Lung cancer | 4 (10.3) | 4 (12.1) |
| Breast cancer | 2 (5.1) | 1 (3) |
| Lymphoma | 1 (2.6) | 1 (3) |
| Total benign pleural effusion, n (%) | 32 (82.1) | 27 (81.8) |
| Pneumonia | 6 (15.4) | 6 (18.2) |
| Pleural empyema | 1 (2.6) | 1 (3) |
| Heart disease | 8 (20.5) | 7 (21.2) |
| Pulmonary embolism | 2 (5.1) | 2 (6.1) |
| Sarcoidosis | 1 (2.6) | |
| Interstitial lung disease | 1 (2.6) | 1 (3) |
| Hepatopulmonary syndrome | 1 (2.6) | 1 (3) |
| Liver cirrhosis | 1 (2.6) | 1 (3) |
| Nephrogenic | 1 (2.6) | 1 (3) |
| Diabetic nephropathy | 1 (2.6) | |
| Fractured rib | 1 (2.6) | 1 (3) |
| Unclear/Idiopathic | 8 (20.5) | 6 (18.2) |
| B-Mode Index Test: | True Positive/Total Positive | True Negative/Total Negative | Sensitivity | Specificity | PPV | NPV | PLR | NLR | Accuracy |
|---|---|---|---|---|---|---|---|---|---|
| B-mode index test of malignancy | 2/5 | 29/34 | 29% (3.7–71%) | 90.6% (75–98%) | 40% (12–77%) | 85% (78–90%) | 3.05 (0.62–15) | 0.79 (0.49–1.3) | 79.5% (64–91%) |
| B-mode index test of exudates | 3/7 | 4/6 | 43% (9.9–82%) | 33% (4.3–78%) | 43% (21–68%) | 33% (12–65%) | 0.64 (0.23–1.8) | 1.71 (0.47–6.3) | 39% (14–68%) |
| SWE-Based Index Test | Malign n/Benign n | Cutoff | Sensitivity | Specificity | AUROC | Youden | PPV | NPV | PLR | NLR | Accuracy |
|---|---|---|---|---|---|---|---|---|---|---|---|
| Intercostal velocity median | 5/22 | 1.68 m/s | 60% (15–95%) | 55% (32–76%) | 0.57 | 0.145 | 23% (11–41%) | 86% (66–95%) | 1.32 (0.56–3.1) | 0.73 (0.23–2.3) | 56% (35–75%) |
| Intercostal velocity max | 2.01 m/s | 100% (48–100%) | 59% (36–79%) | 0.77 | 0.545 | 36% (25–48%) | 100% | 2.44 (1.5–4) | 0 | 67% (46–84%) | |
| Lung consolidation velocity median | 3/19 | 0.945 m/s | 100% (29–100%) | 100% (82–100%) | 1 | 1 | 100% | 100% | - | 0 | 100% (85–100%) |
| Lung consolidation velocity max | 1.525 m/s | 100% (29–100%) | 68% (44–87%) | 0.84 | 0.684 | 33% (21–49%) | 100% | 3.2 (1.6–6.1) | 0 | 73% (50–89%) |
Disclaimer/Publisher’s Note: The statements, opinions and data contained in all publications are solely those of the individual author(s) and contributor(s) and not of MDPI and/or the editor(s). MDPI and/or the editor(s) disclaim responsibility for any injury to people or property resulting from any ideas, methods, instructions or products referred to in the content. |
© 2025 by the authors. Licensee MDPI, Basel, Switzerland. This article is an open access article distributed under the terms and conditions of the Creative Commons Attribution (CC BY) license (https://creativecommons.org/licenses/by/4.0/).
Share and Cite
Nielsen, R.W.; Falster, C.; Posth, S.; Jacobsen, N.; Licht, A.E.; Bhatnagar, R.; Laursen, C.B. Diagnostic Accuracy of Shear Wave Elastography in Predicting Malignant Origins of Pleural Effusions in Emergency Departments. Diagnostics 2025, 15, 225. https://doi.org/10.3390/diagnostics15020225
Nielsen RW, Falster C, Posth S, Jacobsen N, Licht AE, Bhatnagar R, Laursen CB. Diagnostic Accuracy of Shear Wave Elastography in Predicting Malignant Origins of Pleural Effusions in Emergency Departments. Diagnostics. 2025; 15(2):225. https://doi.org/10.3390/diagnostics15020225
Chicago/Turabian StyleNielsen, Rune Wiig, Casper Falster, Stefan Posth, Niels Jacobsen, August Emil Licht, Rahul Bhatnagar, and Christian Borbjerg Laursen. 2025. "Diagnostic Accuracy of Shear Wave Elastography in Predicting Malignant Origins of Pleural Effusions in Emergency Departments" Diagnostics 15, no. 2: 225. https://doi.org/10.3390/diagnostics15020225
APA StyleNielsen, R. W., Falster, C., Posth, S., Jacobsen, N., Licht, A. E., Bhatnagar, R., & Laursen, C. B. (2025). Diagnostic Accuracy of Shear Wave Elastography in Predicting Malignant Origins of Pleural Effusions in Emergency Departments. Diagnostics, 15(2), 225. https://doi.org/10.3390/diagnostics15020225