AI-Guided Delineation of Gross Tumor Volume for Body Tumors: A Systematic Review

 ,
,  ,
,  and
and
Abstract
:1. Introduction
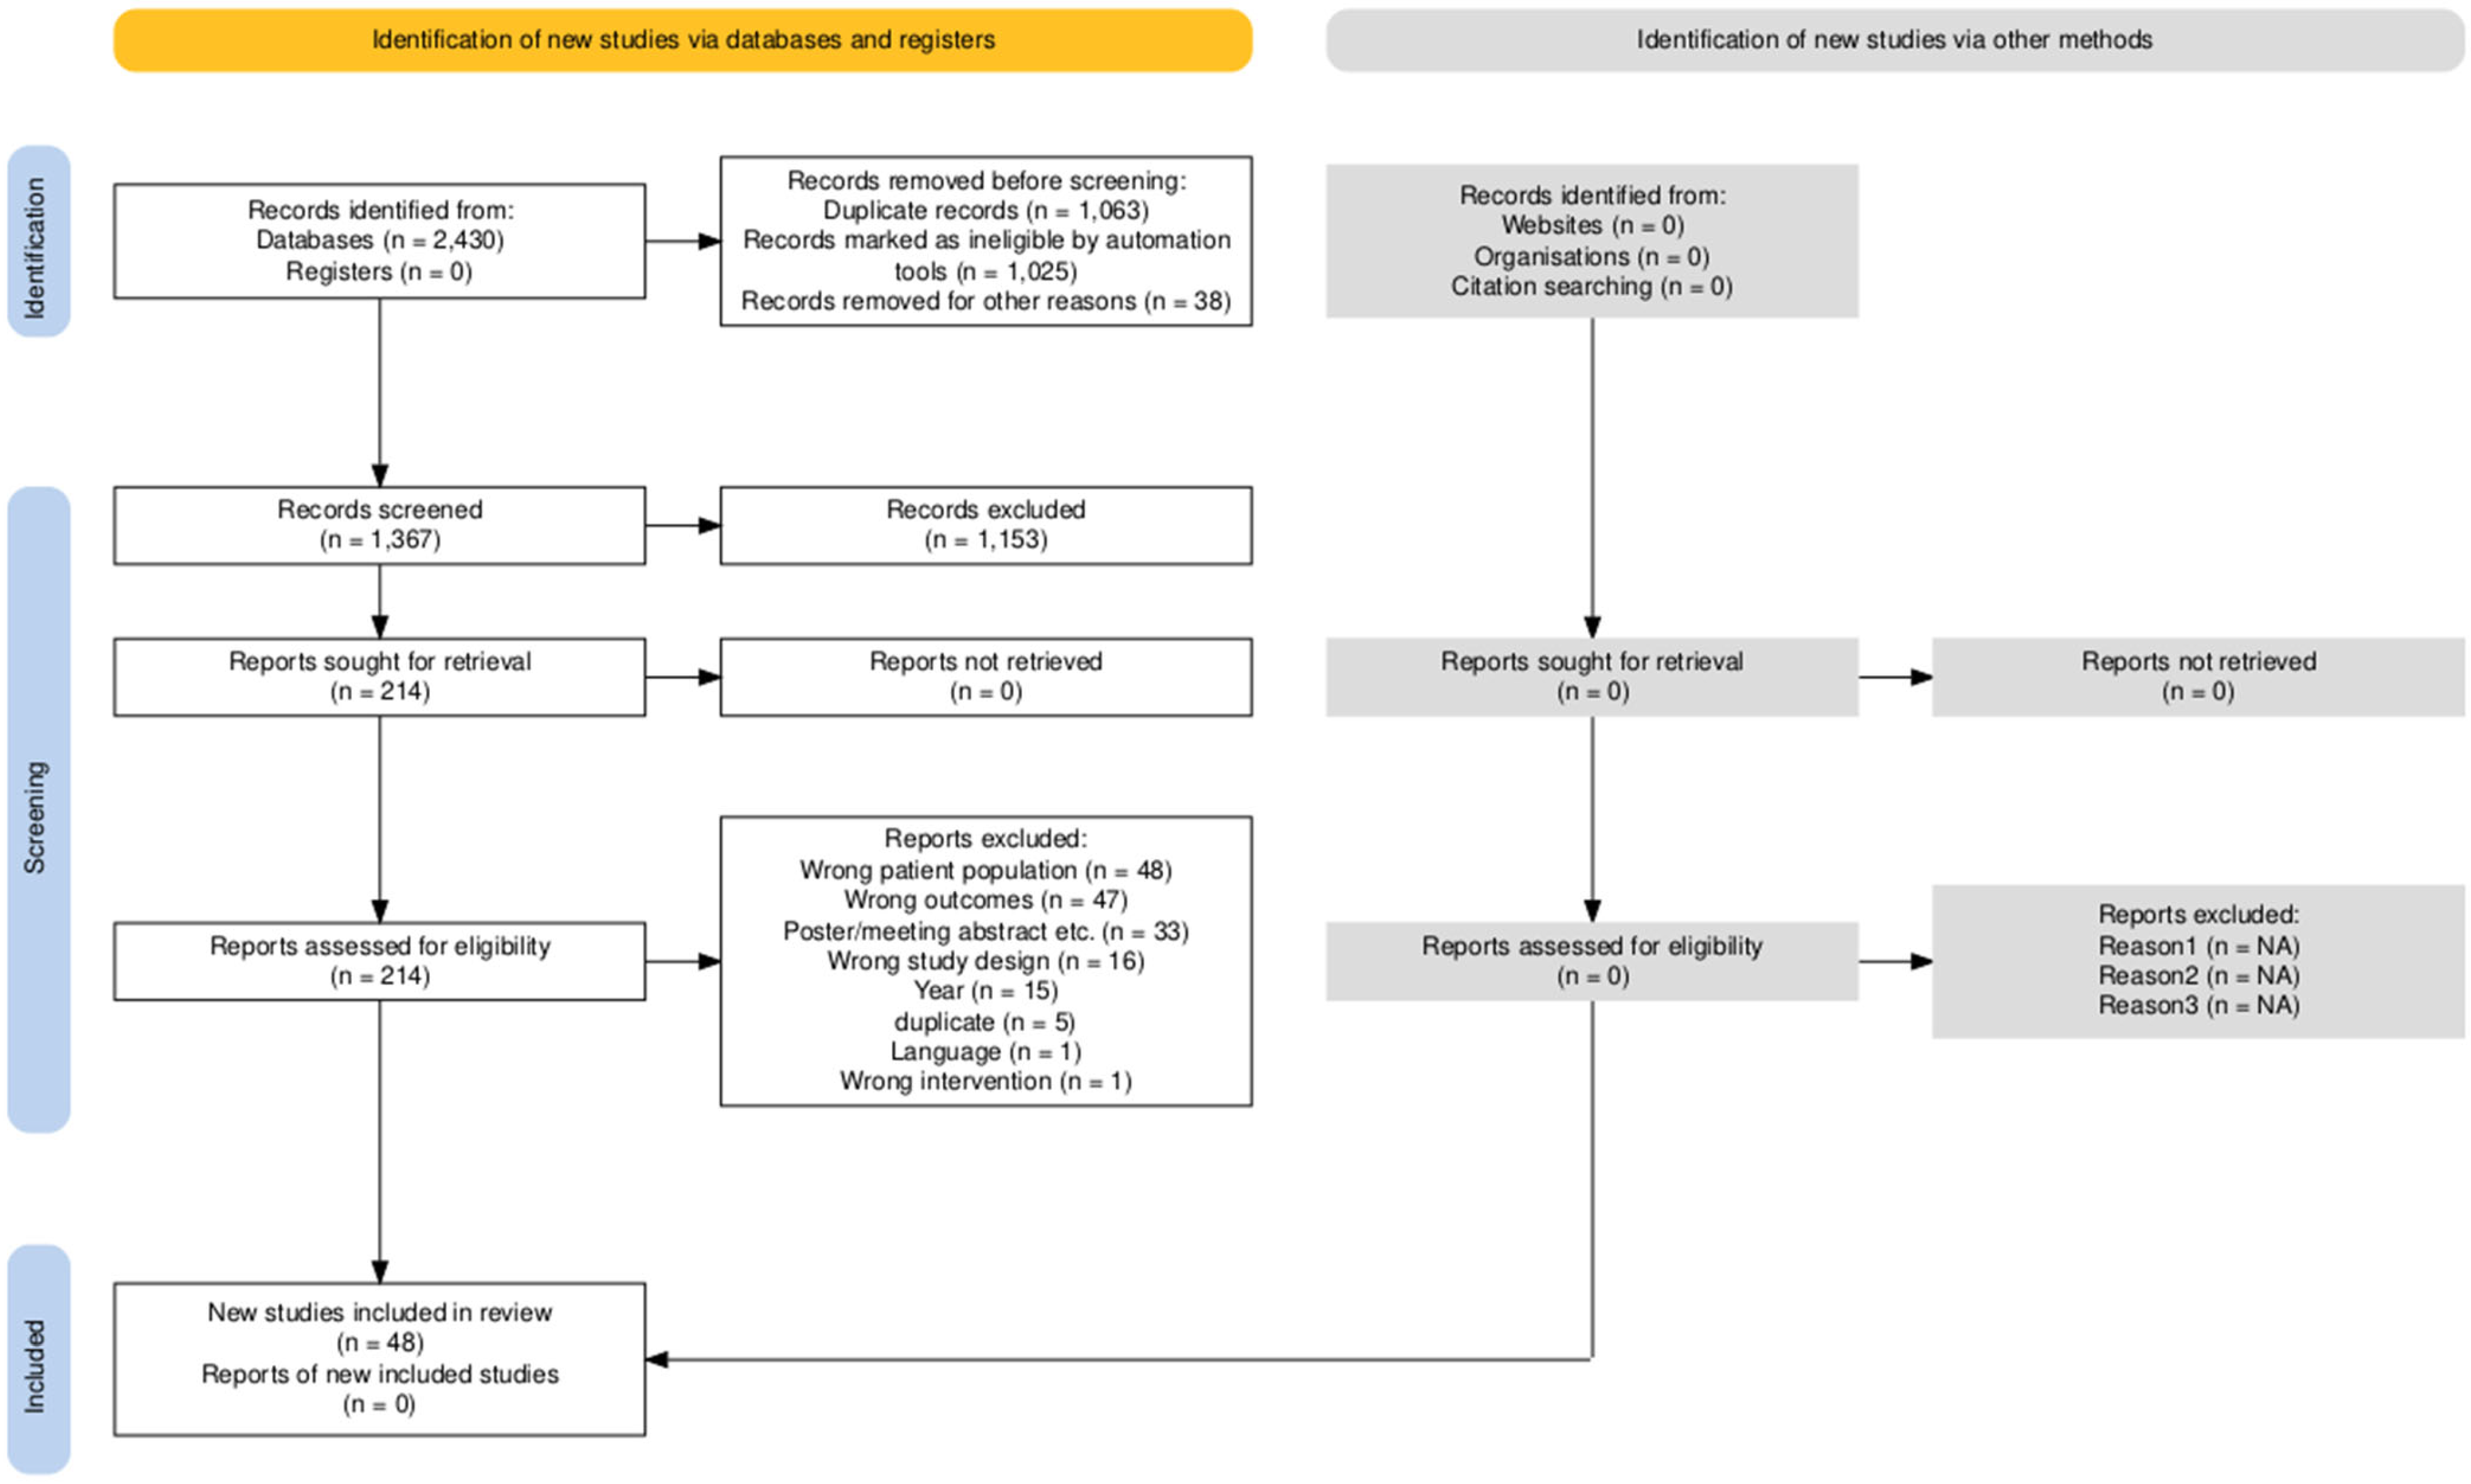
2. Materials and Methods
3. Results
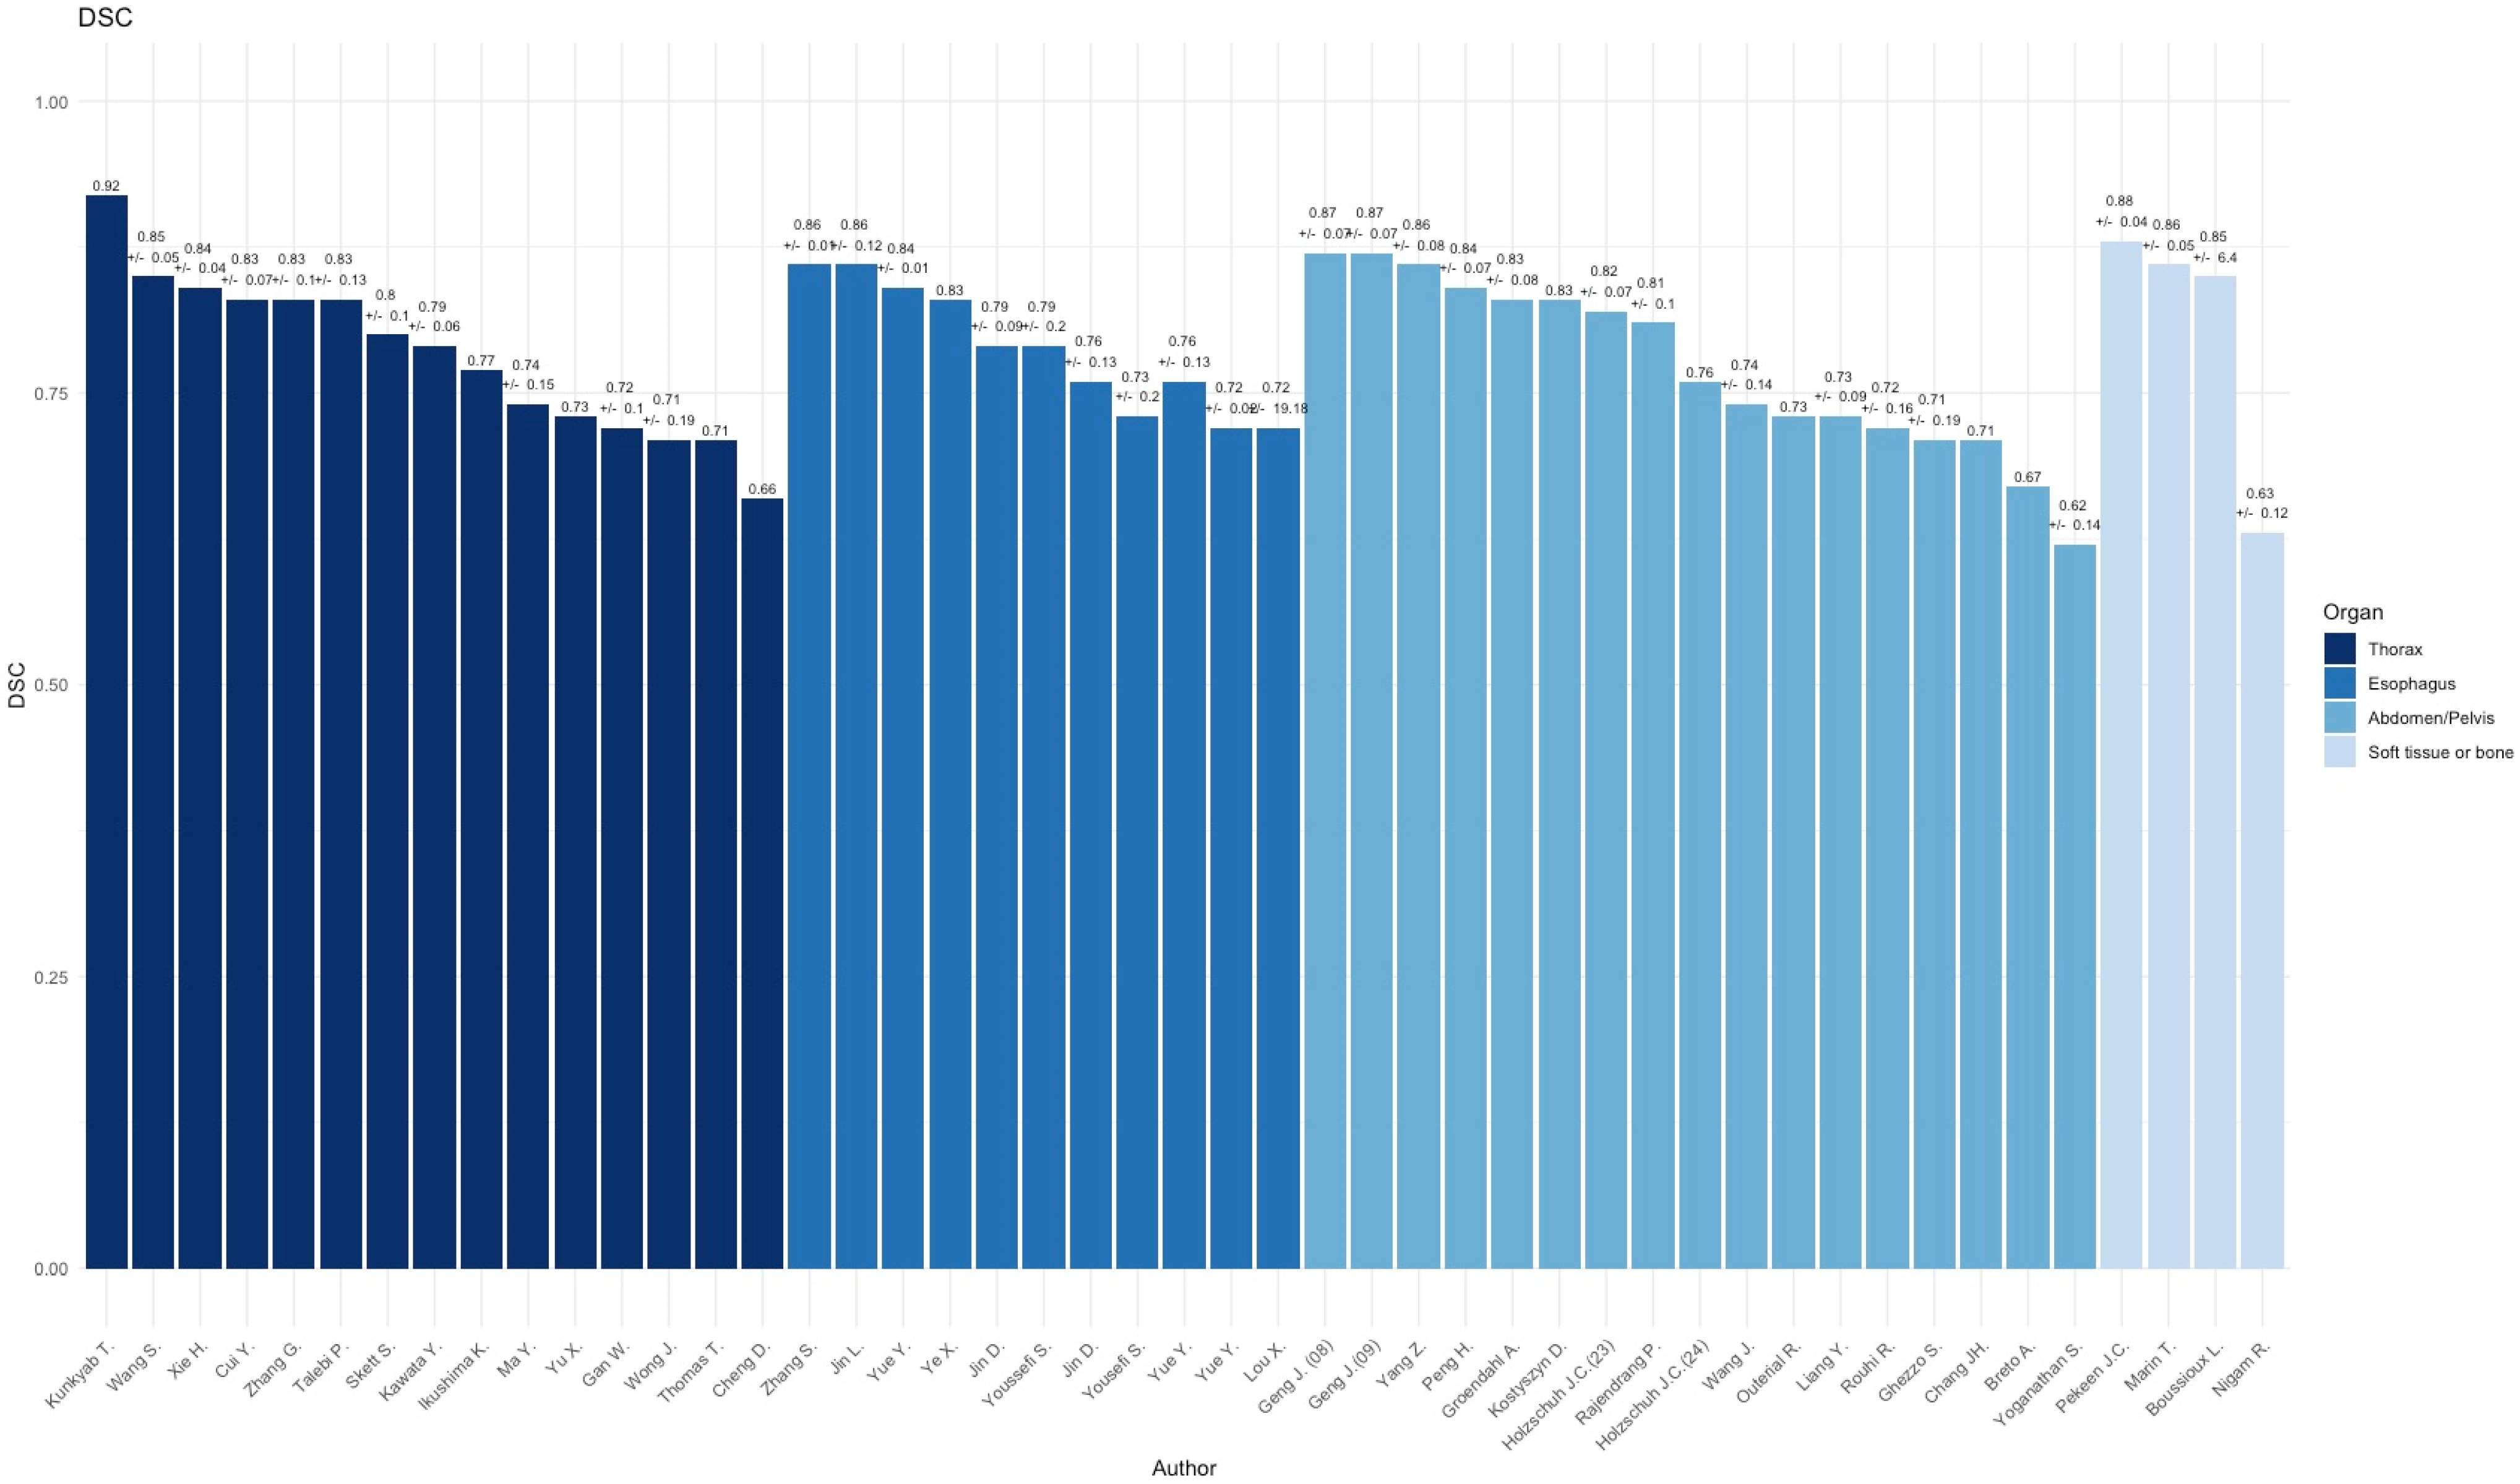
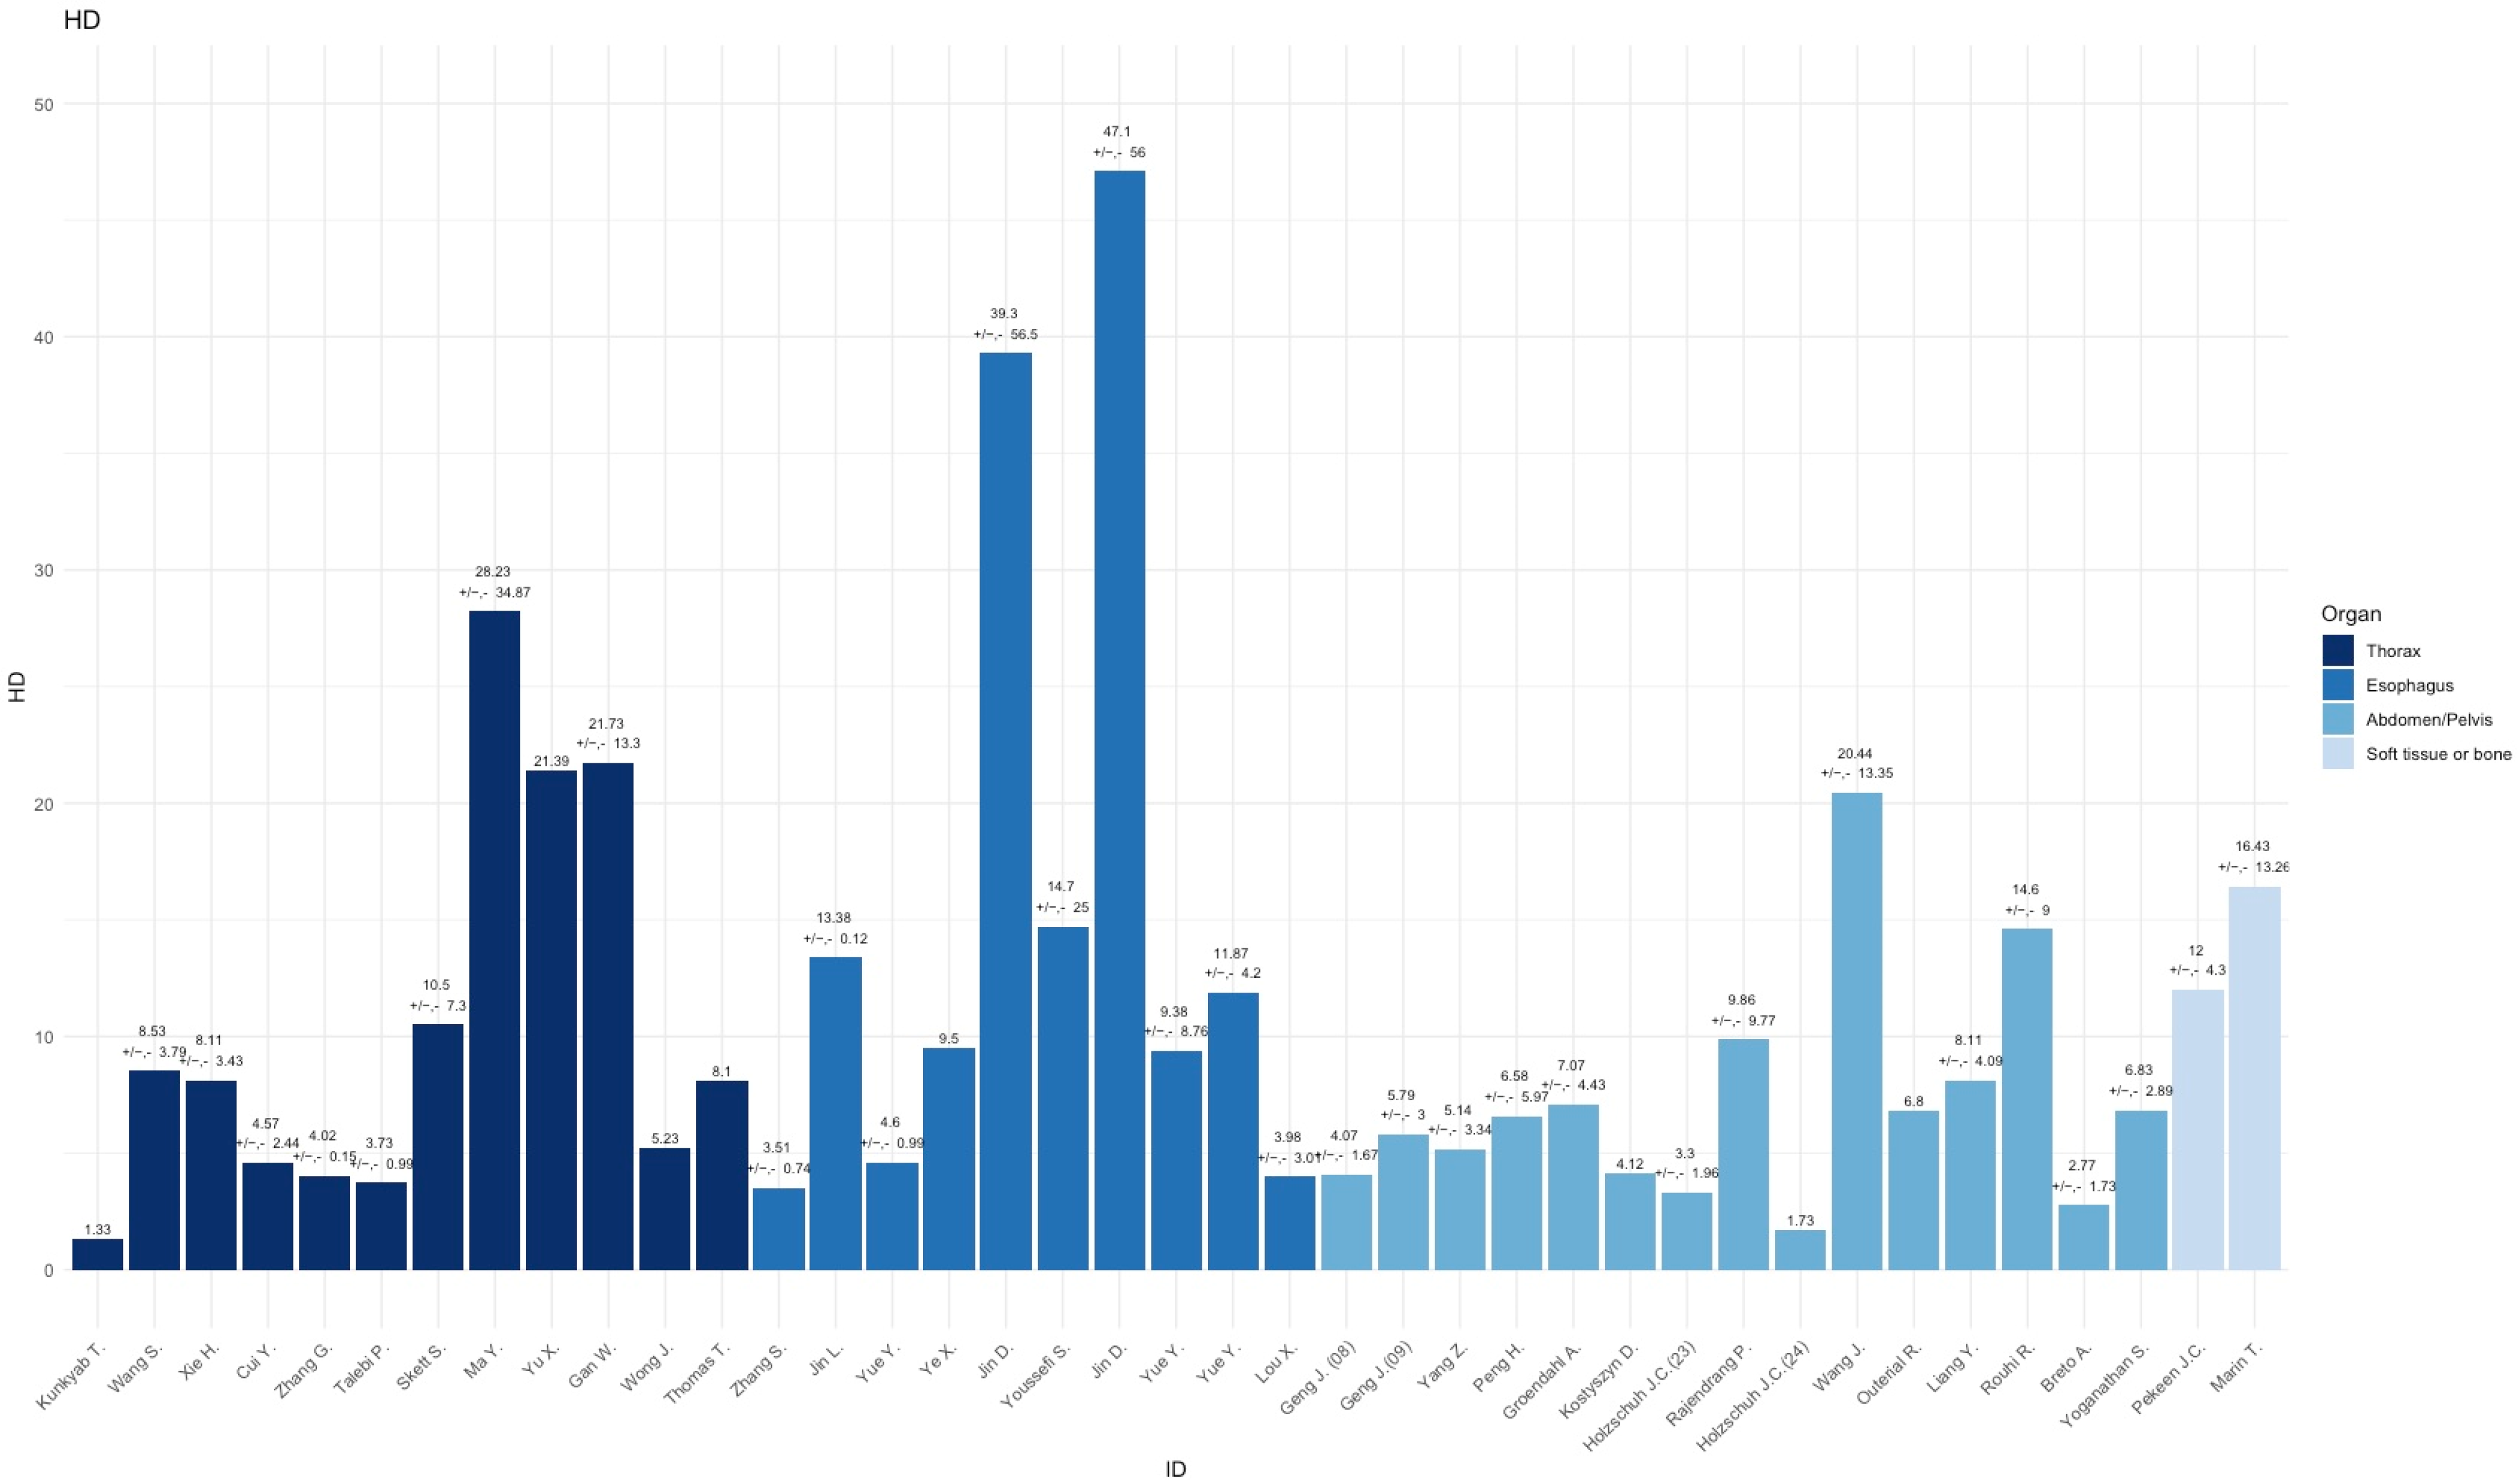
3.1. Thorax
3.2. Esophagus

| Author (Year) | Modality | DSC/HD | Cancer Type (N) | Model | Backbone | Delineation Staff |
|---|---|---|---|---|---|---|
| Zhang S. et al. [23] (2024) | CT | 0.869 ± 0.006/ 3.51 ± 0.74 | Esophageal cancer (580) | 3D nn-U-Net | skip connections between the encoder and decoder improved the segmentation | Four oncologists and eight radiologists |
| Jin L. et al. [24] (2022) | CT | 0.86 ± 0.12/ 13.38 ± 0.12 | Esophageal cancer (215) | 3D VUMix-Net | 3D V-Net for localization, 2D U-Net for segmentation | One radiation oncologist |
| Yue Y. et al. [25] (2022) | CT, PET | 0.84 + 0.009/ 4.60 ±0.99 | Esophageal cancer (164) | GloD-LoATU-Net | ConV-Transformer with GloDAT and LoAT blocks | Two nuclear clinicians, one chief oncologist. |
| Ye X. et al. [26] (2022) | CT, PET | 0.83/ 9.50 | Esophageal cancer (606) | Two-Stream 3D PSNN | 3D Progressive Semantically Nested Network | Two expert healthcare professionals |
| Jin D. et al. [27] (2021) | CT, PET | 0.79 ± 0.09/ 39.30 ± 56.5 | Esophageal cancer (148) | Two-Stream 3D PSNN | 3D Progressive Semantically Nested Network | Two experienced radiation oncologists |
| Youssefi S. et al. [28] (2021) | CT | 0.79 ± 0.20/ 14.7 ± 25.0 | Esophageal Cancer (288) | DDAU-Net | Dilated Dense Attention U-Net | N/A |
| Jin D. et al. [29] (2019) | CT, PET | 0.76 ± 0.13/ 47.10 ± 56.0 | Esophageal cancer (110) | Two-Stream 3D PSNN | 3D Progressive Semantically Nested Network | Two experienced radiation oncologists |
| Yousefi S. et al. [30] (2018) | CT | 0.73 ± 0.20/ N/A | Esophageal cancer (49) | 3D Dense U-NET | 3D U-NET network with dense blocks | N/A |
| Yue Y. et al. [31] (2024) | CT, PET | 0.76 ± 0.13/ 9.38 ± 8.76 | Esophageal Cancer (164) | TransAttPSNN | Two-stream Attention Progressive Semantically-Nested Network | Two nuclear medicine physicians |
| Yue Y. et al. [32] (2022) | CT, PET | 0.72 ± 0.02/ 11.87 ± 4.20 | Esophageal cancer (166) | Two-Stream 3D PSNN | 3D Progressive Semantically Nested Network | Two experienced nuclear medicine physicians |
| Lou X. et al. [33] (2024) | CT | 0.72 ± 19.18/ 3.98 ± 3.01 | Esophageal Cancer (124) | Modified U-Net architecture | Enhanced attention and frequency-aware U-Net variant optimized for advanced feature extraction and fusion | Three radiation oncologists |
3.3. Abdomen/Pelvis
| Author (Year) | Modality | DSC/HD | Cancer Type (N) | Model | Architecture | Delineation Staff |
|---|---|---|---|---|---|---|
| Geng J et al. [34] (2023) (August) | MRI | 0.87 ± 0.07/ 4.07 ± 1.67 | Rectal Cancer (141) | DpuU-Net | U-Net with dual-path-network modules (DPN92). | Eight radiation oncologists |
| Geng J. et al. [35] (2023) (September) | MRI | 0.87 ± 0.07/ 5.79 ± 3.00 | Rectal Cancer (88) | DpuU-Net | U-Net with dual-path-network modules (DPN92). | Two oncologists |
| Yang Z. et al. [36] (2023) | (4D)-CT | 0.86 ± 0.08/ 5.14 ± 3.34 | Hepatocellular carcinoma (26) | Spatial-temporal dual path U-Net | Dual-path network with spatial-temporal features, and a feature fusion module | Radiation oncologist |
| Peng H. et al. [37] (2024) | CT | 0.84 ± 0.07/ 6.58 ± 5.97 | Cervical Cancer (71) | MDSSL 3D-U-Net | Multi-decoder and semi-supervised learning (MDSSL) | Radiation oncologists |
| Groendahl A. et al. [38] (2022) | CT, PET | 0.83 ± 0.08/ 7.07 ± 4.43 | Anal squamous cell carcinoma (36) | 2D U-NET | U-NET | One oncologist, one radiologist. |
| Kostyszyn D. et al. [39] (2020) | CT, PET | 0.83/ 4.12 | Prostate cancer (209) | 3D U-NET | U-NET | N/A |
| Holzschuh J.C. et al. [40] (2023) | CT, PET | 0.82 ± 0.07/ 3.30 ± 1.96 | Prostate Cancer (52) | 3D-U-Net | 3D-U-Net with decoder and encoder consisting of 3 layers | Two readers (radiation oncology, radiology or nuclear medicine) |
| Rajendrang P. et al. [41] (2024) | MRI | 0.81 ± 0.10/ 9.86 ± 9.77 | Prostate Cancer (133) | Medformer (w. LAVE) | Dual-channel 3D Swin Transformer backbone with visual-language attention and a CNN-based decoder | Radiation oncologist and professional trainee |
| Holzschuh J.C. et al. [42] (2024) | CT, PET | 0.76/ 1.73 | Prostate Cancer (161) | nn-U-Net | Dynamically configuration based on input, without fixed backbone. | Two radiation oncologists |
| Wang J. et al. [43] (2018) | MRI | 0.74 ± 0.14/ 20.44 ± 13.35 | Rectal cancer (93) | 2D U-NET | U-NET | N/A |
| Outeiral R. et al. [44] (2023) | MRI | 0.73/ 6.80 | Cervical cancer (195) | 3D nn-U-NET | nn-U-NET | One radiation oncologist |
| Liang Y. et al. [45] (2020) | MRI | 0.73 ± 0.09/ 8.11 ± 4.09 | Pancreas cancer (56) | Square-window based convolutional neural network | Custom CNN | One oncologist, one radiologist. |
| Rouhi R. et al. [46] (2024) | MRI | 0.72 ± 0.16/ 14.6 ± 9.0 | Cervical Cancer (166) | SegResNet | Asymmetrically larger encoder using ResNet blocks, strided convolutions, and a decoder with skip connections | Two radiation oncologists |
| Ghezzo S. et al. [47] (2023) | CT, PET | 0.71 ± 0.19/ N/A | Prostate cancer (85) | 3D U-NET (Kostyszyn D. et al. [39]) | U-NET | Two nuclear medicine physicians |
| Chang, JH. et al. [48] (2021) | CT | 0.71/ N/A | Cervical cancer (51) | 3D U-NET + Long Short-Term Memory | 3D U-NET + Long Short-Term Memory | One radiation oncologist |
| Breto A. et al. [49] (2022) | MRI | 0.67/ 2.77 ± 1.73 | Cervical cancer (15) | Mask R-CNN | Faster R-CNN (ImageNet) + segmentation | One radiation oncologist |
| Yoganathan S. et al. [50] (2022) | MRI | 0.62 ± 0.14/ 6.83 ± 2.89 | Cervical cancer (71) | 2.5D DeepLabv3+ | ResNet50, InceptionResNetv2 | One radiation oncologist |
3.4. Soft TISSUE and Bone
| Author (Year) | Modality | DSC/HD | Cancer Type (N) | Model | Architecture | Delineation Staff |
|---|---|---|---|---|---|---|
| Peeken JC. et al. [51] (2024) | MRI | 0.88 ± 0.04/ 12.0 ± 4.3 | Soft tissue sarcoma (244) | DLBAS 3D-U-Net | 3D U-Net with squeeze and excitation blocks, residual blocks, and multi-head self-attention | Two radiation oncologists |
| Marin T. et al. [52] (2021) | CT | 0.86 ± 0.05/ 16.43 ± 13.26 | Soft tissue and bone sarcoma (68) | 2.5D U-NET | U-NET | Four radiation oncologists or radiologists |
| Boussioux L. et al. [53] (2024) | CT | 0.85 ± 6.4/ NA | Sacral chordoma (48) | Residual 3D U-Net | Optimal ensemble of residual 3D U-Net | One radiologist |
| Nigam R. et al. [54] (2023) | CT, PET | 0.63 ± 0.12/ NA | NSCLC Bone metastasis (9) | Auto segmentation on SUV thresholding | Custom PET/CT segmentation pipeline | One radiation oncologist |
4. Discussion
4.1. CLAIM and TRIPOD Assessment
4.2. Clinical Relevance
4.3. Methodical Considerations
4.4. Future Directions for Research
Author Contributions
Funding
Institutional Review Board Statement
Informed Consent Statement
Data Availability Statement
Conflicts of Interest
References
- Burnet, N.G.; Thomas, S.J.; Burton, K.E.; Jefferies, S.J. Defining the tumour and target volumes for radiotherapy. Cancer Imaging 2004, 4, 153–161. [Google Scholar] [CrossRef]
- Jaffray, D.; Gospodarowicz, M. Disease Control Priorities Third Edition; World Bank Group: Washington, DC, USA, 2014; Volume 3. [Google Scholar] [CrossRef]
- Cahan, E.M.; Hernandez-Boussard, T.; Thadaney-Israni, S.; Rubin, D.L. Putting the data before the algorithm in big data addressing personalized healthcare. NPJ Digit. Med. 2019, 2, 78. [Google Scholar] [CrossRef] [PubMed]
- Page, M.J.; McKenzie, J.E.; Bossuyt, P.M.; Boutron, I.; Hoffmann, T.C.; Mulrow, C.D.; Shamseer, L.; Tetzlaff, J.M.; Akl, E.A.; Brennan, S.E.; et al. The PRISMA 2020 statement: An updated guideline for reporting systematic reviews. BMJ 2021, 372, n71. [Google Scholar] [CrossRef] [PubMed]
- Mongan, J.; Moy, L.; Kahn, C.E. Checklist for Artificial Intelligence in Medical Imaging (CLAIM): A Guide for Authors and Reviewers. Radiol. Artif. Intell. 2020, 2, e200029. [Google Scholar] [CrossRef] [PubMed]
- Collins, G.S.; Reitsma, J.B.; Altman, D.G.; Moons, K.G.M. Transparent reporting of a multivariable prediction model for individual prognosis or diagnosis (TRIPOD): The TRIPOD Statement. BMC Med. 2015, 13, 1. [Google Scholar] [CrossRef]
- Kunkyab, T.; Bahrami, Z.; Zhang, H.; Liu, Z.; Hyde, D. A deep learning-based framework (Co-ReTr) for auto-segmentation of non-small cell-lung cancer in computed tomography images. J. Appl. Clin. Med. Phys. 2024, 25, e14297. [Google Scholar] [CrossRef]
- Wang, S.; Mahon, R.; Weiss, E.; Jan, N.; Taylor, R.J.; McDonagh, P.R.; Quinn, B.; Yuan, L. Automated Lung Cancer Segmentation Using a PET and CT Dual-Modality Deep Learning Neural Network. Int. J. Radiat. Oncol. Biol. Phys. 2023, 115, 529–539. [Google Scholar] [CrossRef]
- Xie, H.; Chen, Z.; Deng, J.; Zhang, J.; Duan, H.; Li, Q. Automatic segmentation of the gross target volume in radiotherapy for lung cancer using transresSEUnet 2.5D Network. J. Transl. Med. 2022, 20, 524. [Google Scholar] [CrossRef]
- Cui, Y.; Arimura, H.; Nakano, R.; Yoshitake, T.; Shioyama, Y.; Yabuuchi, H. Automated approach for segmenting gross tumor volumes for lung cancer stereotactic body radiation therapy using CT-based dense V-networks. J. Radiat. Res. 2021, 62, 346–355. [Google Scholar] [CrossRef]
- Zhang, G.; Yang, Z.; Jiang, S. Automatic lung tumor segmentation from CT images using improved 3D densely connected UNet. Med. Biol. Eng. Comput. 2022, 60, 3311–3323. [Google Scholar] [CrossRef]
- Talebi, P.; Saeedzadeh, E.; Bakhshandeh, M.; Arabi, H. A Novel Attention-based Neural Network for Automated Lung Lesion Delineation from 4DCT Images. In Proceedings of the 2022 IEEE Nuclear Science Symposium and Medical Imaging Conference (NSS/MIC), Milano, Italy, 5–12 November 2022. [Google Scholar] [CrossRef]
- Skett, S.; Patel, T.; Duprez, D.; Gupta, S.; Netherton, T.; Trauernicht, C.; Aldridge, S.; Eaton, D.; Cardenas, C.; Court, L.E.; et al. Autocontouring of primary lung lesions and nodal disease for radiotherapy based only on computed tomography images. Phys. Imaging Radiat. Oncol. 2024, 31, 100637. [Google Scholar] [CrossRef] [PubMed]
- Kawata, Y.; Arimura, H.; Ikushima, K.; Jin, Z.; Morita, K.; Tokunaga, C.; Yabu-Uchi, H.; Shioyama, Y.; Sasaki, T.; Honda, H.; et al. Impact of pixel-based machine-learning techniques on automated frameworks for delineation of gross tumor volume regions for stereotactic body radiation therapy. Phys. Med. 2017, 42, 141–149. [Google Scholar] [CrossRef] [PubMed]
- Ikushima, K.; Arimura, H.; Jin, Z.; Yabu-Uchi, H.; Kuwazuru, J.; Shioyama, Y.; Sasaki, T.; Honda, H.; Sasaki, M. Computer-assisted framework for machine-learning-based delineation of GTV regions on datasets of planning CT and PET/CT images. J. Radiat. Res. 2017, 58, 123–134. [Google Scholar] [CrossRef] [PubMed]
- Ma, Y.; Mao, J.; Liu, X.; Dai, Z.; Zhang, H.; Zhang, X.; Li, Q. Deep learning-based internal gross target volume definition in 4D CT images of lung cancer patients. Med. Phys. 2022, 50, 2303–2316. [Google Scholar] [CrossRef]
- Yu, X.; Jin, F.; Luo, H.L.; Lei, Q.; Wu, Y. Gross Tumor Volume Segmentation for Stage III NSCLC Radiotherapy Using 3D ResSE-Unet. Technol. Cancer Res. Treat. 2022, 21, 15330338221090847. [Google Scholar] [CrossRef]
- Gan, W.; Wang, H.; Gu, H.; Duan, Y.; Shao, Y.; Chen, H.; Feng, A.; Huang, Y.; Fu, X.; Ying, Y.; et al. Automatic segmentation of lung tumors on CT images based on a 2D & 3D hybrid convolutional neural network. Br. J. Radiol. 2021, 94, 20210038. [Google Scholar]
- Wong, J.; Huang, V.; Giambattista, J.A.; Teke, T.; Kolbeck, C.; Atrchian, S. Training and Validation of Deep Learning-Based Auto-Segmentation Models for Lung Stereotactic Ablative Radiotherapy Using Retrospective Radiotherapy Planning Contours. Front. Oncol. 2021, 11, 626499. [Google Scholar] [CrossRef]
- Thomas, H.M.T.; Devakumar, D.; Sasidharan, B.; Bowen, S.R.; Heck, D.K.; Samuel, E.J.J. Hybrid positron emission tomography segmentation of heterogeneous lung tumors using 3D Slicer: Improved GrowCut algorithm with threshold initialization. J. Med. Imaging 2017, 4, 011009. [Google Scholar] [CrossRef]
- Cheng, D.C.; Chi, J.H.; Yang, S.N.; Liu, S.H. Organ contouring for lung cancer patients with a seed generation scheme and random walks. Sensors 2020, 20, 4823. [Google Scholar] [CrossRef]
- Nishino, M.; Hatabu, H.; Johnson, B.E.; McLoud, T.C. State of the art: Response assessment in lung cancer in the era of genomic medicine. Radiology 2014, 271, 6–27. [Google Scholar] [CrossRef]
- Zhang, S.; Li, K.; Sun, Y.; Wan, Y.; Ao, Y.; Zhong, Y.; Liang, M.; Wang, L.; Chen, X.; Pei, X.; et al. Deep Learning for Automatic Gross Tumor Volumes Contouring in Esophageal Cancer Based on Contrast-Enhanced Computed Tomography Images: A Multi-Institutional Study. Int. J. Radiat. Oncol. 2024, 119, 1590–1600. [Google Scholar] [CrossRef]
- Jin, L.; Chen, Q.; Shi, A.; Wang, X.; Ren, R.; Zheng, A.; Song, P.; Zhang, Y.; Wang, N.; Wang, C.; et al. Deep Learning for Automated Contouring of Gross Tumor Volumes in Esophageal Cancer. Front. Oncol. 2022, 12, 892171. [Google Scholar] [CrossRef]
- Yue, Y.; Li, N.; Zhang, G.; Zhu, Z.; Liu, X.; Song, S.; Ta, D. Automatic segmentation of esophageal gross tumor volume in 18F-FDG PET/CT images via GloD-LoATUNet. Comput. Methods Programs Biomed. 2022, 229, 107266. [Google Scholar] [CrossRef] [PubMed]
- Ye, X.; Guo, D.; Tseng, C.-K.; Ge, J.; Hung, T.-M.; Pai, P.-C.; Ren, Y.; Zheng, L.; Zhu, X.; Peng, L.; et al. Multi-Institutional Validation of Two-Streamed Deep Learning Method for Automated Delineation of Esophageal Gross Tumor Volume Using Planning CT and FDG-PET/CT. Front. Oncol. 2022, 11, 785788. [Google Scholar] [CrossRef]
- Jin, D.; Guo, D.; Ho, T.-Y.; Harrison, A.P.; Xiao, J.; Tseng, C.-K.; Lu, L. DeepTarget: Gross tumor and clinical target volume segmentation in esophageal cancer radiotherapy. Med. Image Anal. 2021, 68, 101909. [Google Scholar] [CrossRef]
- Yousefi, S.; Sokooti, H.; Elmahdy, M.S.; Lips, I.M.; Shalmani, M.T.M.; Zinkstok, R.T.; Dankers, F.J.W.M.; Staring, M. Esophageal Tumor Segmentation in CT Images Using a Dilated Dense Attention Unet (DDAUnet). IEEE Access 2021, 9, 99235–99248. [Google Scholar] [CrossRef]
- Jin, D.; Guo, D.; Ho, T.-Y.; Harrison, A.P.; Xiao, J.; Tseng, C.-K.; Lu, L. Accurate Esophageal Gross Tumor Volume Segmentation in PET/CT using Two-Stream Chained 3D Deep Network Fusion 2019. In Proceedings of the Medical Image Computing and Computer Assisted Intervention—MICCAI 2019, Shenzhen, China, 13–17 October 2019. [Google Scholar]
- Yousefi, S.; Sokooti, H.; Elmahdy, M.S.; Peters, F.P.; Shalmani, M.T.M.; Zinkstok, R.T.; Staring, M. Esophageal Gross Tumor Volume Segmentation Using a 3D Convolutional Neural Network. In Lecture Notes in Computer Science (Including Subseries Lecture Notes in Artificial Intelligence and Lecture Notes in Bioinformatics); Springer: Berlin/Heidelberg, Germany, 2018; Volume 11073, pp. 343–351. [Google Scholar] [CrossRef]
- Yue, Y.; Li, N.; Zhang, G.; Xing, W.; Zhu, Z.; Liu, X.; Song, S.; Ta, D. A transformer-guided cross-modality adaptive feature fusion framework for esophageal gross tumor volume segmentation. Comput. Methods Programs Biomed. 2024, 251, 108216. [Google Scholar] [CrossRef]
- Yue, Y.; Li, N.; Shahid, H.; Bi, D.; Liu, X.; Song, S.; Ta, D. Gross Tumor Volume Definition and Comparative Assessment for Esophageal Squamous Cell Carcinoma From 3D 18F-FDG PET/CT by Deep Learning-Based Method. Front. Oncol. 2022, 12, 799207. [Google Scholar] [CrossRef]
- Lou, X.; Zhu, J.; Yang, J.; Zhu, Y.; Shu, H.; Li, B. Enhanced Cross-stage-attention U-Net for esophageal target volume segmentation. BMC Med. Imaging 2024, 24, 339. [Google Scholar] [CrossRef]
- Geng, J.; Zhu, X.; Liu, Z.; Chen, Q.; Bai, L.; Wang, S.; Li, Y.; Wu, H.; Yue, H.; Du, Y. Towards deep-learning (DL) based fully automated target delineation for rectal cancer neoadjuvant radiotherapy using a divide-and-conquer strategy: A study with multicenter blind and randomized validation. Radiat. Oncol. 2023, 18, 164. [Google Scholar] [CrossRef]
- Geng, J.; Zhang, S.; Wang, R.; Bai, L.; Chen, Q.; Wang, S.; Zhu, X.; Liu, Z.; Yue, H.; Wu, H.; et al. Deep-learning based triple-stage framework for MRI-CT cross-modality gross tumor volume (GTV) segmentation for rectal cancer neoadjuvant radiotherapy. Biomed. Signal Process. Control 2023, 89, 105715. [Google Scholar] [CrossRef]
- Yang, Z.; Yang, X.; Cao, Y.; Shao, Q.; Tang, D.; Peng, Z.; Di, S.; Zhao, Y.; Li, S. Deep learning based automatic internal gross target volume delineation from 4D-CT of hepatocellular carcinoma patients. J. Appl. Clin. Med. Phys. 2023, 25, e14211. [Google Scholar] [CrossRef] [PubMed]
- Peng, H.; Liu, T.; Li, P.; Yang, F.; Luo, X.; Sun, X.; Gao, D.; Lin, F.; Jia, L.; Xu, N.; et al. Automatic delineation of cervical cancer target volumes in small samples based on multi-decoder and semi-supervised learning and clinical application. Sci. Rep. 2024, 14, 26937. [Google Scholar] [CrossRef] [PubMed]
- Groendahl, A.R.; Moe, Y.M.; Kaushal, C.K.; Huynh, B.N.; Rusten, E.; Tomic, O.; Hernes, E.; Hanekamp, B.; Undseth, C.; Guren, M.G.; et al. Deep learning-based automatic delineation of anal cancer gross tumour volume: A multimodality comparison of CT, PET and MRI. Acta Oncol. 2021, 61, 89–96. [Google Scholar] [CrossRef]
- Kostyszyn, D.; Fechter, T.; Bartl, N.; Grosu, A.L.; Gratzke, C.; Sigle, A.; Mix, M.; Ruf, J.; Fassbender, T.F.; Kiefer, S.; et al. Intraprostatic Tumor Segmentation on PSMA PET Images in Patients with Primary Prostate Cancer with a Convolutional Neural Network. J. Nucl. Med. 2021, 62, 823–828. [Google Scholar] [CrossRef]
- Holzschuh, J.C.; Mix, M.; Ruf, J.; Hölscher, T.; Kotzerke, J.; Vrachimis, A.; Doolan, P.; Ilhan, H.; Marinescu, I.M.; Spohn, S.K.; et al. Deep learning based automated delineation of the intraprostatic gross tumour volume in PSMA-PET for patients with primary prostate cancer. Radiother. Oncol. 2023, 188, 109774. [Google Scholar] [CrossRef]
- Rajendran, P.; Chen, Y.; Qiu, L.; Niedermayr, T.; Liu, W.; Buyyounouski, M.; Bagshaw, H.; Han, B.; Yang, Y.; Kovalchuk, N.; et al. Auto-delineation of treatment target volume for radiation therapy using large language model-aided multimodal learning. Int. J. Radiat. Oncol. 2024, 121, 230–240. [Google Scholar] [CrossRef]
- Holzschuh, J.C.; Mix, M.; Freitag, M.T.; Hölscher, T.; Braune, A.; Kotzerke, J.; Vrachimis, A.; Doolan, P.; Ilhan, H.; Marinescu, I.M.; et al. The impact of multicentric datasets for the automated tumor delineation in primary prostate cancer using convolutional neural networks on 18F-PSMA-1007 PET. Radiat. Oncol. 2024, 19, 106. [Google Scholar] [CrossRef]
- Wang, J.; Lu, J.; Qin, G.; Shen, L.; Sun, Y.; Ying, H.; Zhang, Z.; Hu, W. Technical Note: A deep learning-based autosegmentation of rectal tumors in MR images. Med. Phys. 2018, 45, 2560–2564. [Google Scholar] [CrossRef]
- Rodríguez Outeiral, R.; González, P.J.; Schaake, E.E.; van der Heide, U.A.; Simões, R. Deep learning for segmentation of the cervical cancer gross tumor volume on magnetic resonance imaging for brachytherapy. Radiat. Oncol. 2023, 18, 91. [Google Scholar] [CrossRef]
- Liang, Y.; Schott, D.; Zhang, Y.; Wang, Z.; Nasief, H.; Paulson, E.; Hall, W.; Knechtges, P.; Erickson, B.; Li, X.A. Auto-segmentation of pancreatic tumor in multi-parametric MRI using deep convolutional neural networks. Radiother. Oncol. 2020, 145, 193–200. [Google Scholar] [CrossRef] [PubMed]
- Rouhi, R.; Niyoteka, S.; Carré, A.; Achkar, S.; Laurent, P.-A.; Ba, M.B.; Veres, C.; Henry, T.; Vakalopoulou, M.; Sun, R.; et al. Automatic gross tumor volume segmentation with failure detection for safe implementation in locally advanced cervical cancer. Phys. Imaging Radiat. Oncol. 2024, 30, 100578. [Google Scholar] [CrossRef] [PubMed]
- Ghezzo, S.; Mongardi, S.; Bezzi, C.; Gajate, A.M.S.; Preza, E.; Gotuzzo, I.; Baldassi, F.; Jonghi-Lavarini, L.; Neri, I.; Russo, T.; et al. External validation of a convolutional neural network for the automatic segmentation of intraprostatic tumor lesions on 68Ga-PSMA PET images. Front. Med. 2023, 10, 1133269. [Google Scholar] [CrossRef] [PubMed]
- Chang, J.H.; Lin, K.H.; Wang, T.H.; Zhou, Y.K.; Chung, P.C. Image Segmentation in 3D Brachytherapy Using Convolutional LSTM. J. Med. Biol. Eng. 2021, 41, 636–651. [Google Scholar] [CrossRef]
- Breto, A.L.; Spieler, B.; Zavala-Romero, O.; Alhusseini, M.; Patel, N.V.; Asher, D.A.; Xu, I.R.; Baikovitz, J.B.; Mellon, E.A.; Ford, J.C.; et al. Deep Learning for Per-Fraction Automatic Segmentation of Gross Tumor Volume (GTV) and Organs at Risk (OARs) in Adaptive Radiotherapy of Cervical Cancer. Front. Oncol. 2022, 12, 854349. [Google Scholar] [CrossRef]
- Yoganathan, S.; Paul, S.N.; Paloor, S.; Torfeh, T.; Chandramouli, S.H.; Hammoud, R.; Al-Hammadi, N. Automatic segmentation of magnetic resonance images for high-dose-rate cervical cancer brachytherapy using deep learning. Med. Phys. 2022, 49, 1571–1584. [Google Scholar] [CrossRef]
- Peeken, J.C.; Etzel, L.; Tomov, T.; Münch, S.; Schüttrumpf, L.; Shaktour, J.H.; Kiechle, J.; Knebel, C.; Schaub, S.K.; Mayr, N.A.; et al. Development and benchmarking of a Deep Learning-based MRI-guided gross tumor segmentation algorithm for Radiomics analyses in extremity soft tissue sarcomas. Radiother. Oncol. 2024, 197, 110338. [Google Scholar] [CrossRef]
- Marin, T.; Zhuo, Y.; Lahoud, R.M.; Tian, F.; Ma, X.; Xing, F.; Moteabbed, M.; Liu, X.; Grogg, K.; Shusharina, N.; et al. Deep learning-based GTV contouring modeling inter- and intra-observer variability in sarcomas 2021. Radiother. Oncol. 2022, 167, 269–276. [Google Scholar] [CrossRef]
- Boussioux, L.; Ma, Y.; Thomas, N.K.; Bertsimas, D.; Shusharina, N.; Pursley, J.; Chen, Y.-L.; DeLaney, T.F.; Qian, J.; Bortfeld, T. Automated Segmentation of Sacral Chordoma and Surrounding Muscles Using Deep Learning Ensemble. Int. J. Radiat. Oncol. 2023, 117, 738–749. [Google Scholar] [CrossRef]
- Nigam, R.; Field, M.; Harris, G.; Barton, M.; Carolan, M.; Metcalfe, P.; Holloway, L. Automated detection, delineation and quantification of whole-body bone metastasis using FDG-PET/CT images. Phys. Eng. Sci. Med. 2023, 46, 851–863. [Google Scholar] [CrossRef]
- Zając, H.D.; Ribeiro, J.M.N.; Ingala, S.; Gentile, S.; Wanjohi, R.; Gitau, S.N.; Carlsen, J.F.; Nielsen, M.B.; Andersen, T.O. “It depends”: Configuring AI to Improve Clinical Usefulness Across Contexts. In Proceedings of the 2024 ACM Designing Interactive Systems Conference, New York, NY, USA, 1–5 July 2024; Association for Computing Machinery, Inc.: New York, NY, USA, 2024; pp. 874–889. [Google Scholar] [CrossRef]

| Author (Year) | Modality | DSC/HD | Cancer Type (N Patients) | Model | Backbone | Delineation STAFF |
|---|---|---|---|---|---|---|
| Kunkyab T. et al. [7] (2024) | CT | 0.92 1.33 | Lung Cancer (676) | Co-ReTr | CNN with multi resolution input, and Transformers module | Radiation oncologist |
| Wang S. et al. [8] (2022) | CT, PET | 0.85 ± 0.05/ 8.53 ± 3.79 | NSCLC (280) | 3D CNN Dual-Modality Network | Independent convolution for PET/CT and encoder-decoder architecture | Four radiation oncologists |
| Xie H. et al. [9] (2022) | CT | 0.84 ± 0.0/ 8.11 ±3.43 | Lung cancer (127) | TransResSEU-NET 2.5D | 3D U-NET with 2D and 3D Res-SE Modules | One radiation oncologist, two radiotherapists |
| Cui Y. et al. [10] (2021) | CT | 0.83 ± 0.07/ 4.57 ± 2.44 | NSCLC (192) | Dense V-Networks | Combination of DenseNet and V-Network Structures | Two radiation oncologists |
| Zhang G. et al. [11] (2022) | CT | 0.83 ± 0.10/ 4.02 ± 0.15 | Lung Cancer (871) | I-3D DenseU-NET | Nested Dense Skip Connection between Encoder and Decoder Blocks | One radiation oncologist |
| Talebi P. et al. [12] (2022) | (4D-) CT | 0.83 ± 0.13 3.73 ± 0.99 | NSCLC (20) | 3D-U-Net w. attention module | 3D-U-Net with an added attention module | One radiation oncologist |
| Skett S. et al. [13] (2024) | CT | 0.80 ± 0.10/ 10.5 ± 7.3 | Lung Cancer (379) | nnU-Net | Anchor-point-based post- processing | Two oncologists |
| Kawata Y. et al. [14] (2017) | CT, PET | 0.79 ± 0.06/ N/A | NSCLC (16) | Automated ML Framework for GTV Segmentation | Pixel-based ML Techniques: FCM, ANN, SVM | Two radiation oncologists |
| Ikushima K. et al. [15] (2017) | CT, PET | 0.77/ N/A | Lung cancer (14) | PET/CT and Diagnostic CT Registration | SVM with Gaussian kernel for classification | Two radiation oncologists |
| Ma Y. et al. [16] (2022) | CT | 0.74 ± 0.15/ 28.23 ± 34.87 | Lung cancer (70) | GruU-NET-add | Convolutional GRU-based 3D U-NET | One radiation oncologist |
| Yu X. et al. [17] (2022) | CT | 0.73/ 21.39 | Stage III NSCLC (214) | 3D ResSE-U-NET | 3D U-NET with Residual and SE Blocks | Radiation oncologist |
| Gan W. et al. [18] (2021) | CT | 0.72 ± 0.10/ 21.73 ± 13.30 | Lung cancer (260) | Hybrid 2D + 3D CNN | V-Net for 3D CNN; Dense Blocks for 2D CNN | Two radiation oncologists |
| Wong J. et al. [19] (2021) | CT | 0.71 ± 0.19/ 5.23 | Lung cancer (96) | Limbus Contour v1.0.22 | U-NET | One radiation oncologist |
| Thomas T. et al. [20] (2017) | CT, PET | 0.71/ 8.10 | NSCLC (9) | Improved GrowCut | GrowCut Algorithm | N/A |
| Cheng D. et al. [21] (2020) | CT | 0.66/ N/A | NSCLC (25) | Random Walks Algorithm | Graph-based algorithm | One clinical oncologist |
Disclaimer/Publisher’s Note: The statements, opinions and data contained in all publications are solely those of the individual author(s) and contributor(s) and not of MDPI and/or the editor(s). MDPI and/or the editor(s) disclaim responsibility for any injury to people or property resulting from any ideas, methods, instructions or products referred to in the content. |
© 2025 by the authors. Licensee MDPI, Basel, Switzerland. This article is an open access article distributed under the terms and conditions of the Creative Commons Attribution (CC BY) license (https://creativecommons.org/licenses/by/4.0/).
Share and Cite
Pehrson, L.M.; Petersen, J.; Panduro, N.S.; Lauridsen, C.A.; Carlsen, J.F.; Darkner, S.; Nielsen, M.B.; Ingala, S. AI-Guided Delineation of Gross Tumor Volume for Body Tumors: A Systematic Review. Diagnostics 2025, 15, 846. https://doi.org/10.3390/diagnostics15070846
Pehrson LM, Petersen J, Panduro NS, Lauridsen CA, Carlsen JF, Darkner S, Nielsen MB, Ingala S. AI-Guided Delineation of Gross Tumor Volume for Body Tumors: A Systematic Review. Diagnostics. 2025; 15(7):846. https://doi.org/10.3390/diagnostics15070846
Chicago/Turabian StylePehrson, Lea Marie, Jens Petersen, Nathalie Sarup Panduro, Carsten Ammitzbøl Lauridsen, Jonathan Frederik Carlsen, Sune Darkner, Michael Bachmann Nielsen, and Silvia Ingala. 2025. "AI-Guided Delineation of Gross Tumor Volume for Body Tumors: A Systematic Review" Diagnostics 15, no. 7: 846. https://doi.org/10.3390/diagnostics15070846
APA StylePehrson, L. M., Petersen, J., Panduro, N. S., Lauridsen, C. A., Carlsen, J. F., Darkner, S., Nielsen, M. B., & Ingala, S. (2025). AI-Guided Delineation of Gross Tumor Volume for Body Tumors: A Systematic Review. Diagnostics, 15(7), 846. https://doi.org/10.3390/diagnostics15070846