
Clinical TNM Lung Cancer Staging: A Diagnostic Algorithm with a Pictorial Review
 , , ,
, , ,
Abstract
1. Introduction
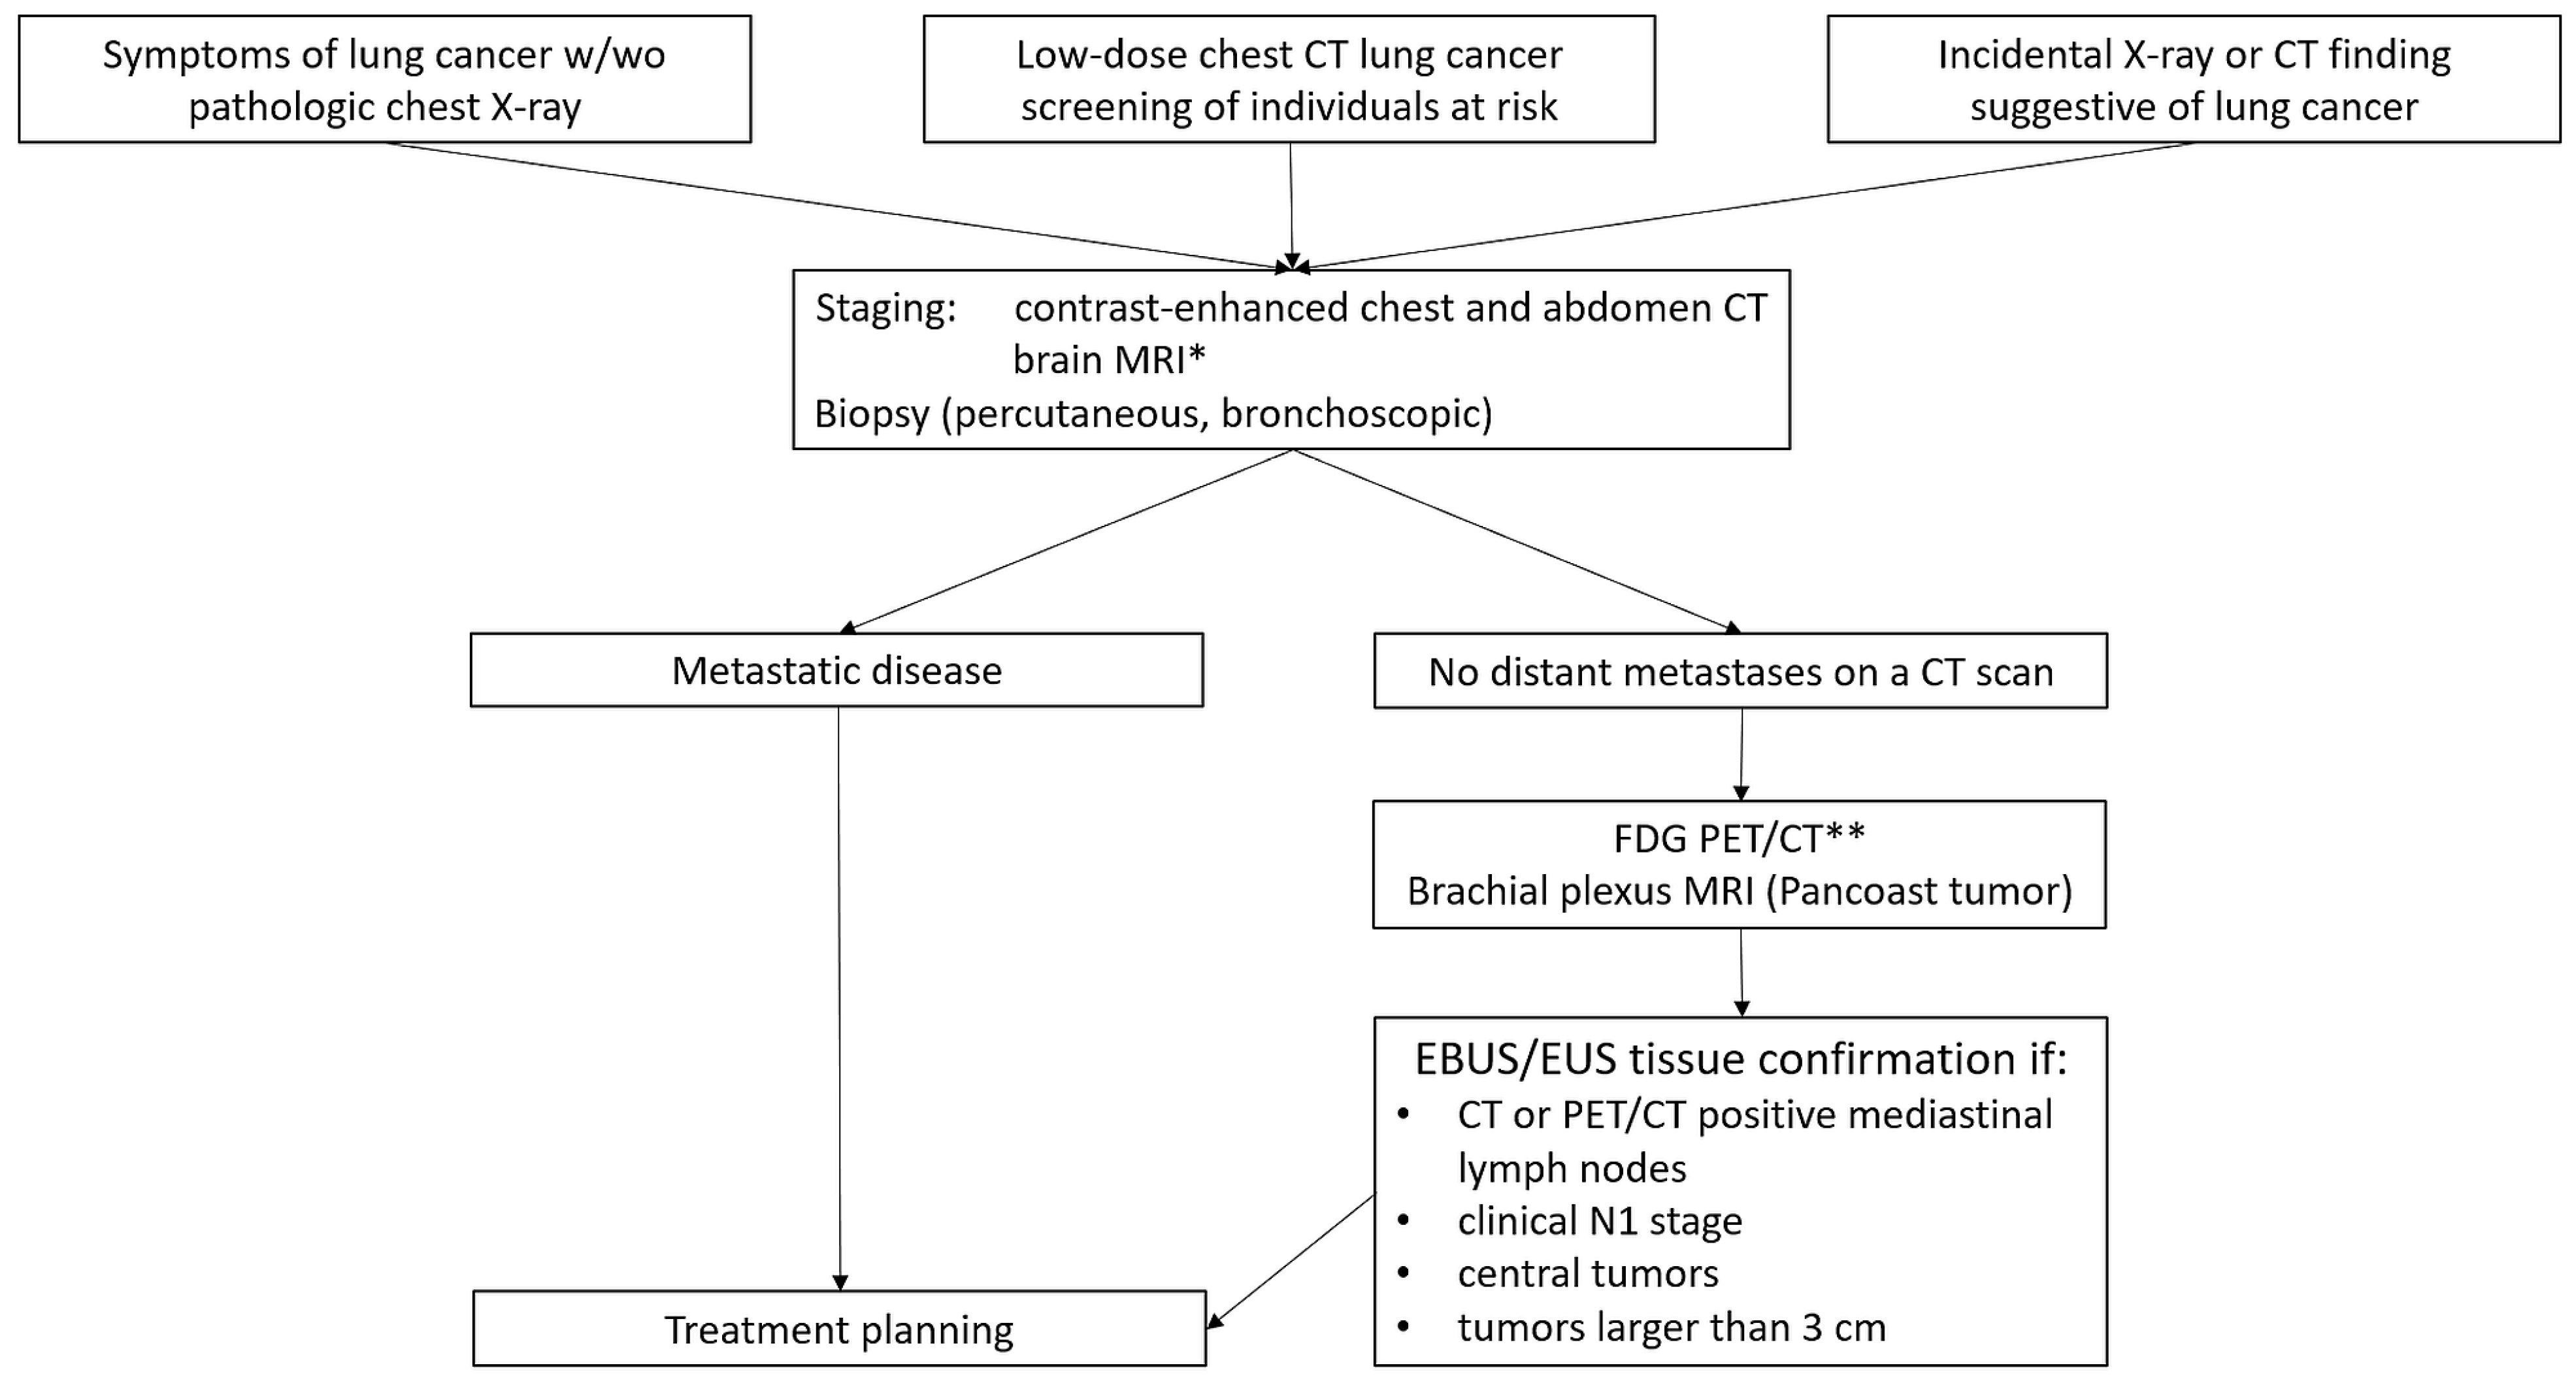
2. Diagnostic Algorithm
3. T Descriptors

| Descriptor | Description [30] | Comment |
|---|---|---|
| Tx | Primary tumor cannot be visualized by imaging or bronchoscopy | Tumor proven by the presence of malignant cells in sputum or bronchial washings [30] |
| T0 | No evidence of a primary tumor | |
| Tis | Carcinoma in situ | |
| T1 | Tumor ≤ 3 cm in the greatest dimension surrounded by lung or visceral pleura, or in a lobar or more peripheral bronchus | No bronchoscopic evidence of invasion more proximal than the lobar bronchus |
| T1mi | Minimally invasive adenocarcinoma | Solitary adenocarcinoma ≤ 3 cm in the greatest dimension, with a predominantly lepidic pattern and no more than 5 mm solid component in the greatest dimension [30] |
| T1a | Tumor ≤ 1 cm in the greatest dimension | |
| T1b | Tumor > 1 cm but ≤2 cm in the greatest dimension | |
| T1c | Tumor > 2 cm but ≤3 cm in the greatest dimension | |
| T2 | ||
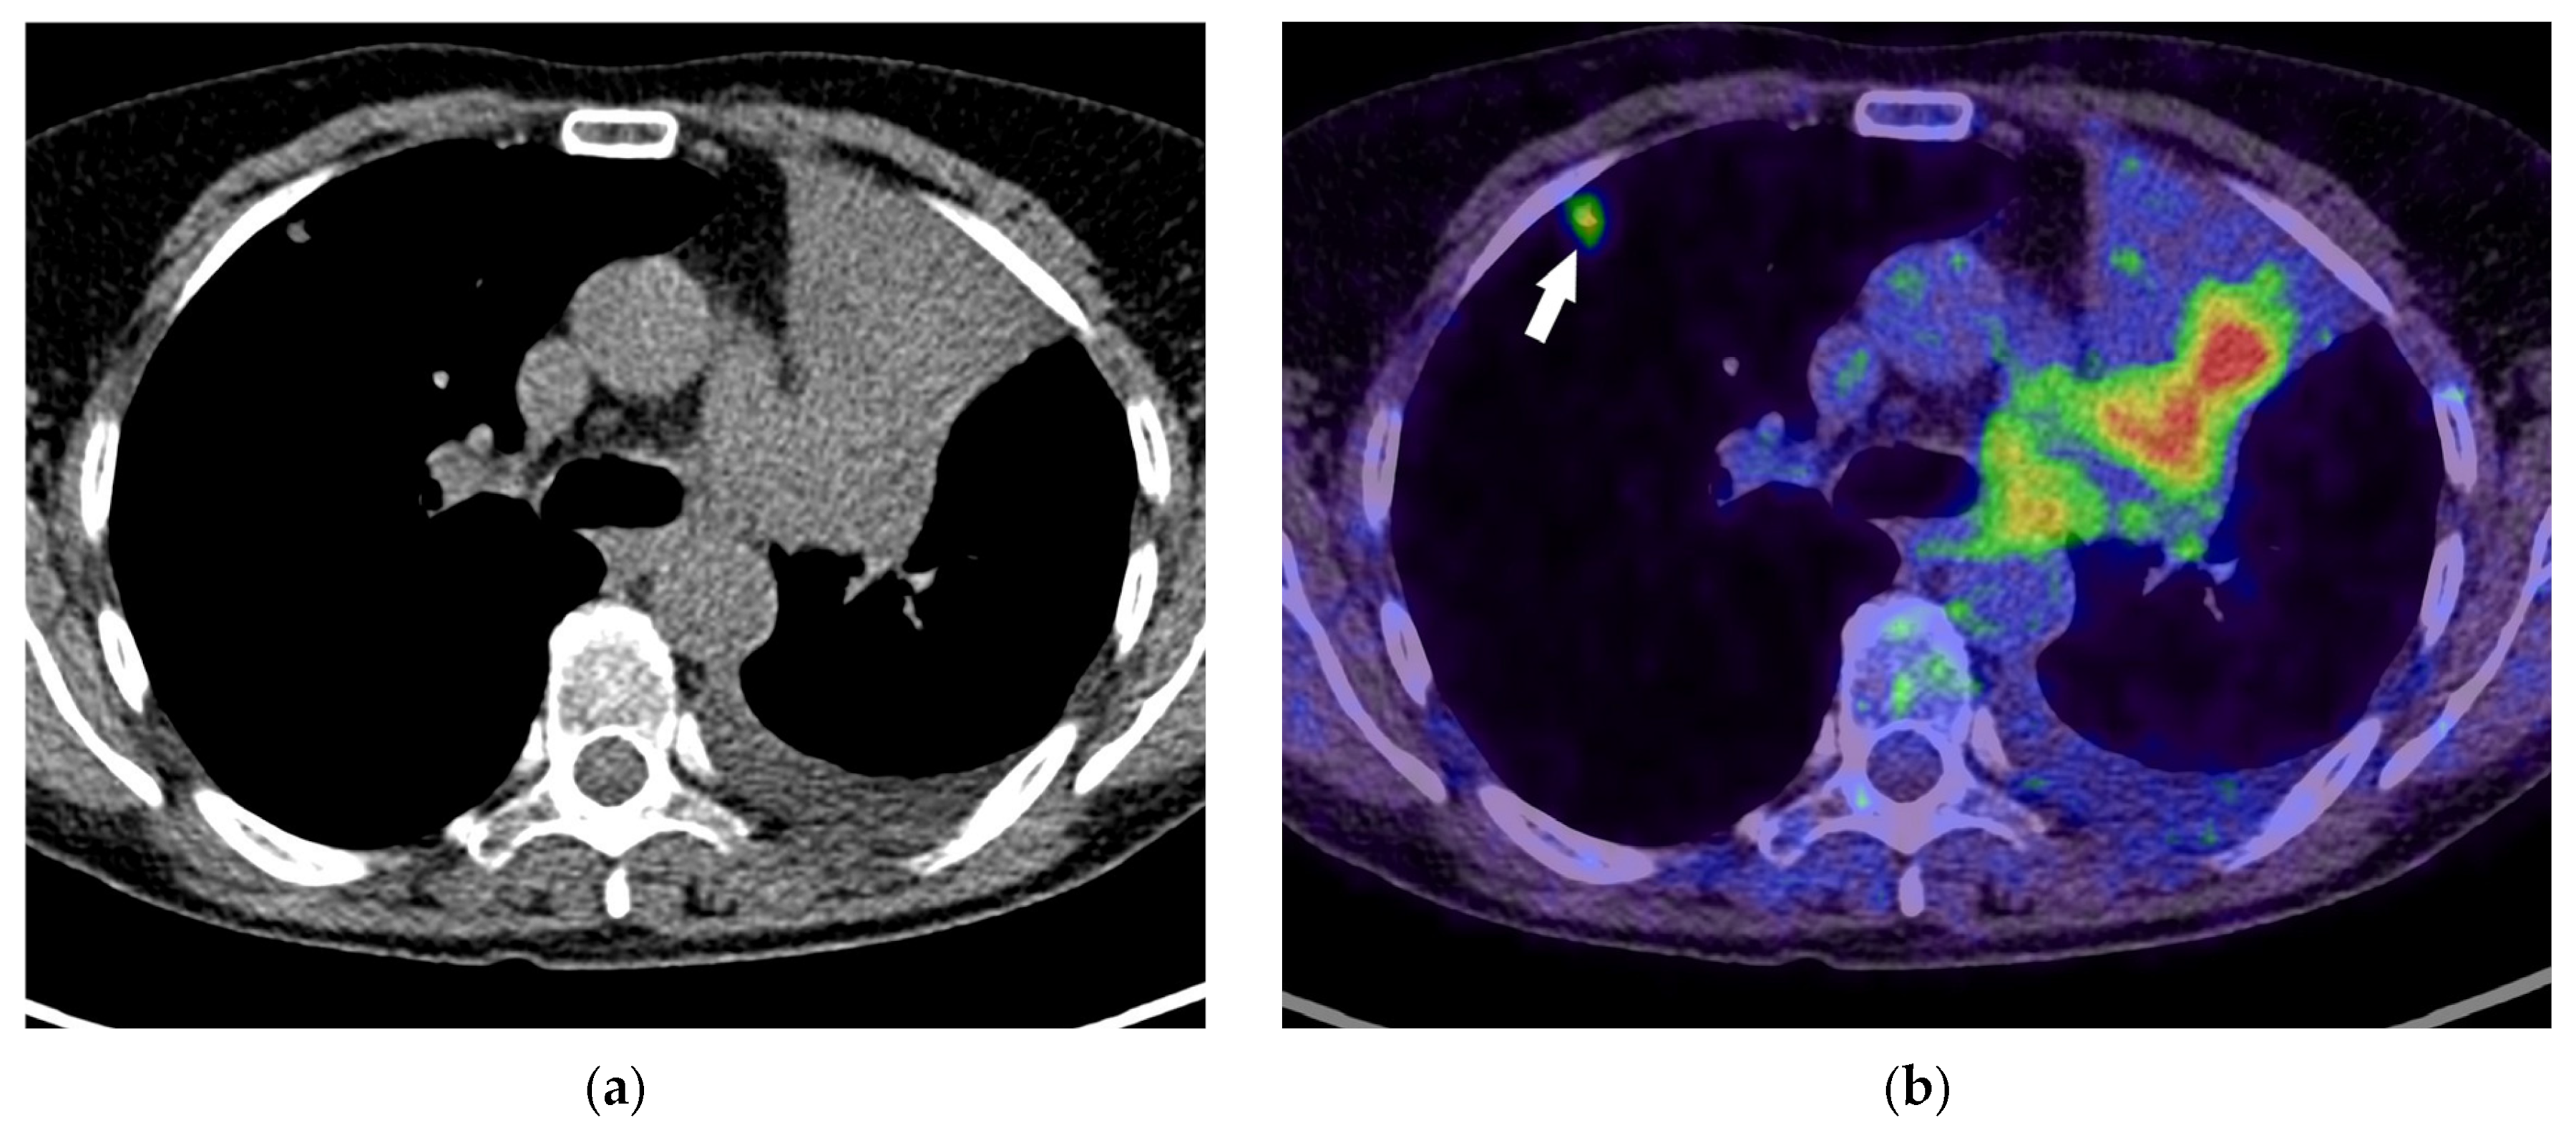
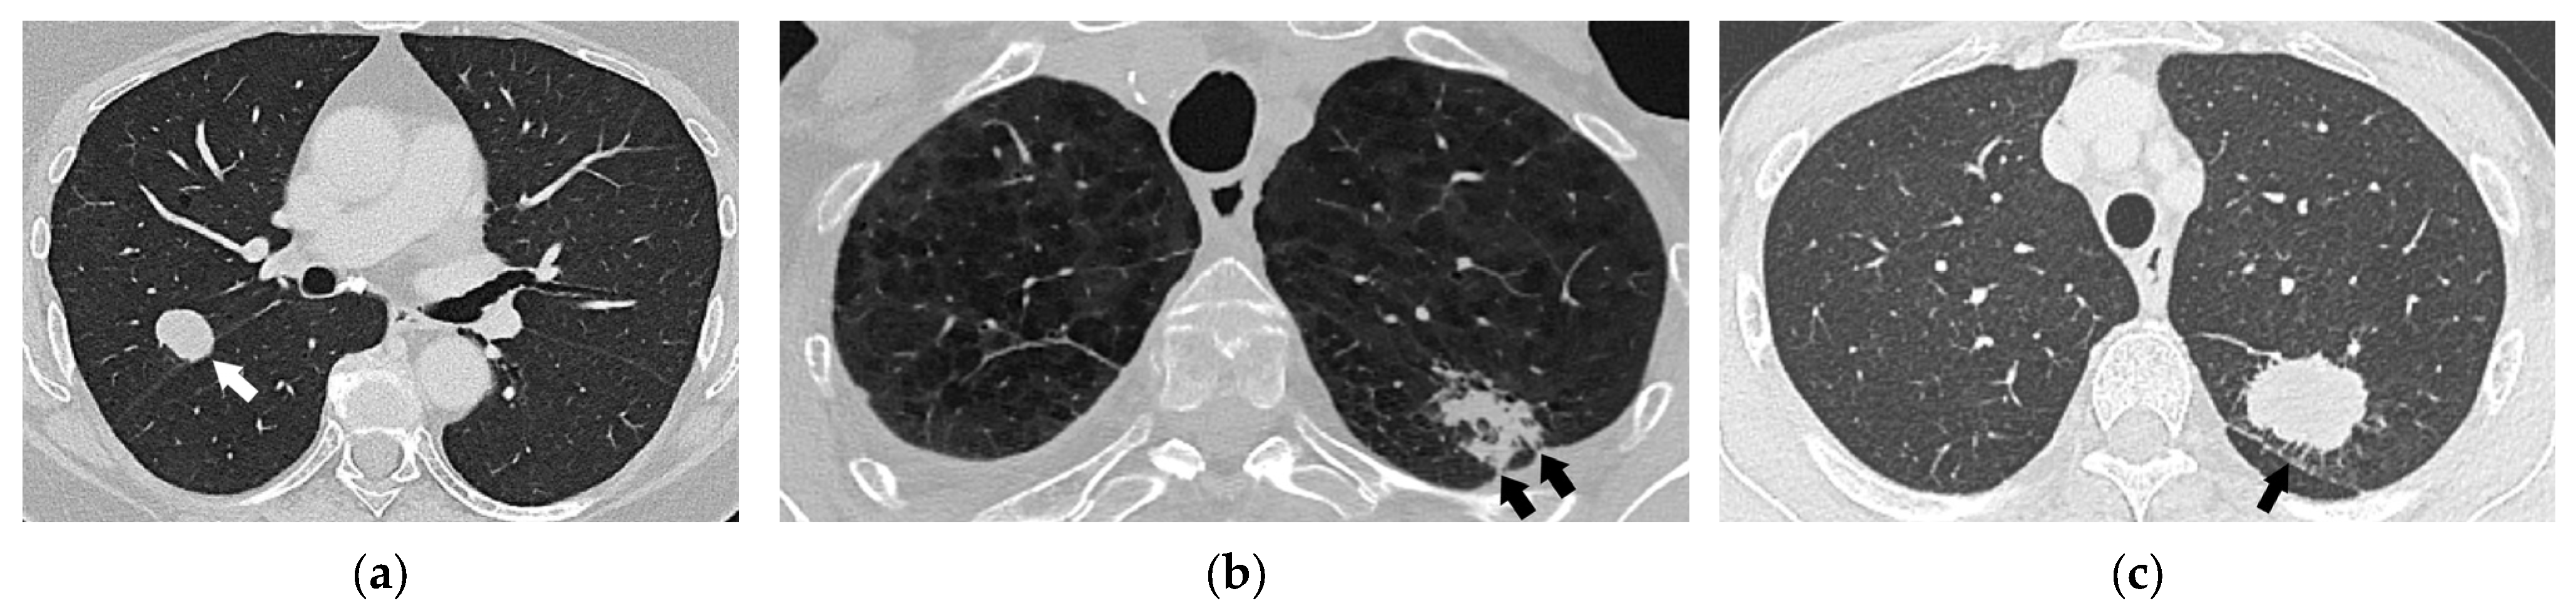
| T2a | Tumor > 3 cm but ≤4 cm in the greatest dimension Invasion of visceral pleura Invasion of an adjacent lobe Involvement of the main bronchus (up to but not including the carina) Tumor associated with atelectasis or obstructive pneumonitis extending to the hilar region, involving either a part of or the entire lung | Visceral pleural invasion should be considered for pleural-attached nodules and pleural-tag nodules [40] PET/CT can better differentiate the obstructing tumor from the tumor-associated atelectasis than CT [26,37] |
| T2b | Tumor > 4 cm but ≤5 cm in the greatest dimension | |
| T3 | Tumor > 5 cm but ≤7 cm in the greatest dimension Invasion of parietal pleura or chest wall Invasion of the pericardium, phrenic nerve, or azygos vein Invasion of thoracic nerve roots (T1, T2) or stellate ganglion Separate tumor nodule(s) in the same lobe as the primary | The degree of mediastinal penetration by the tumor needed to invade these T3 structures is not counted as T4 [30] |
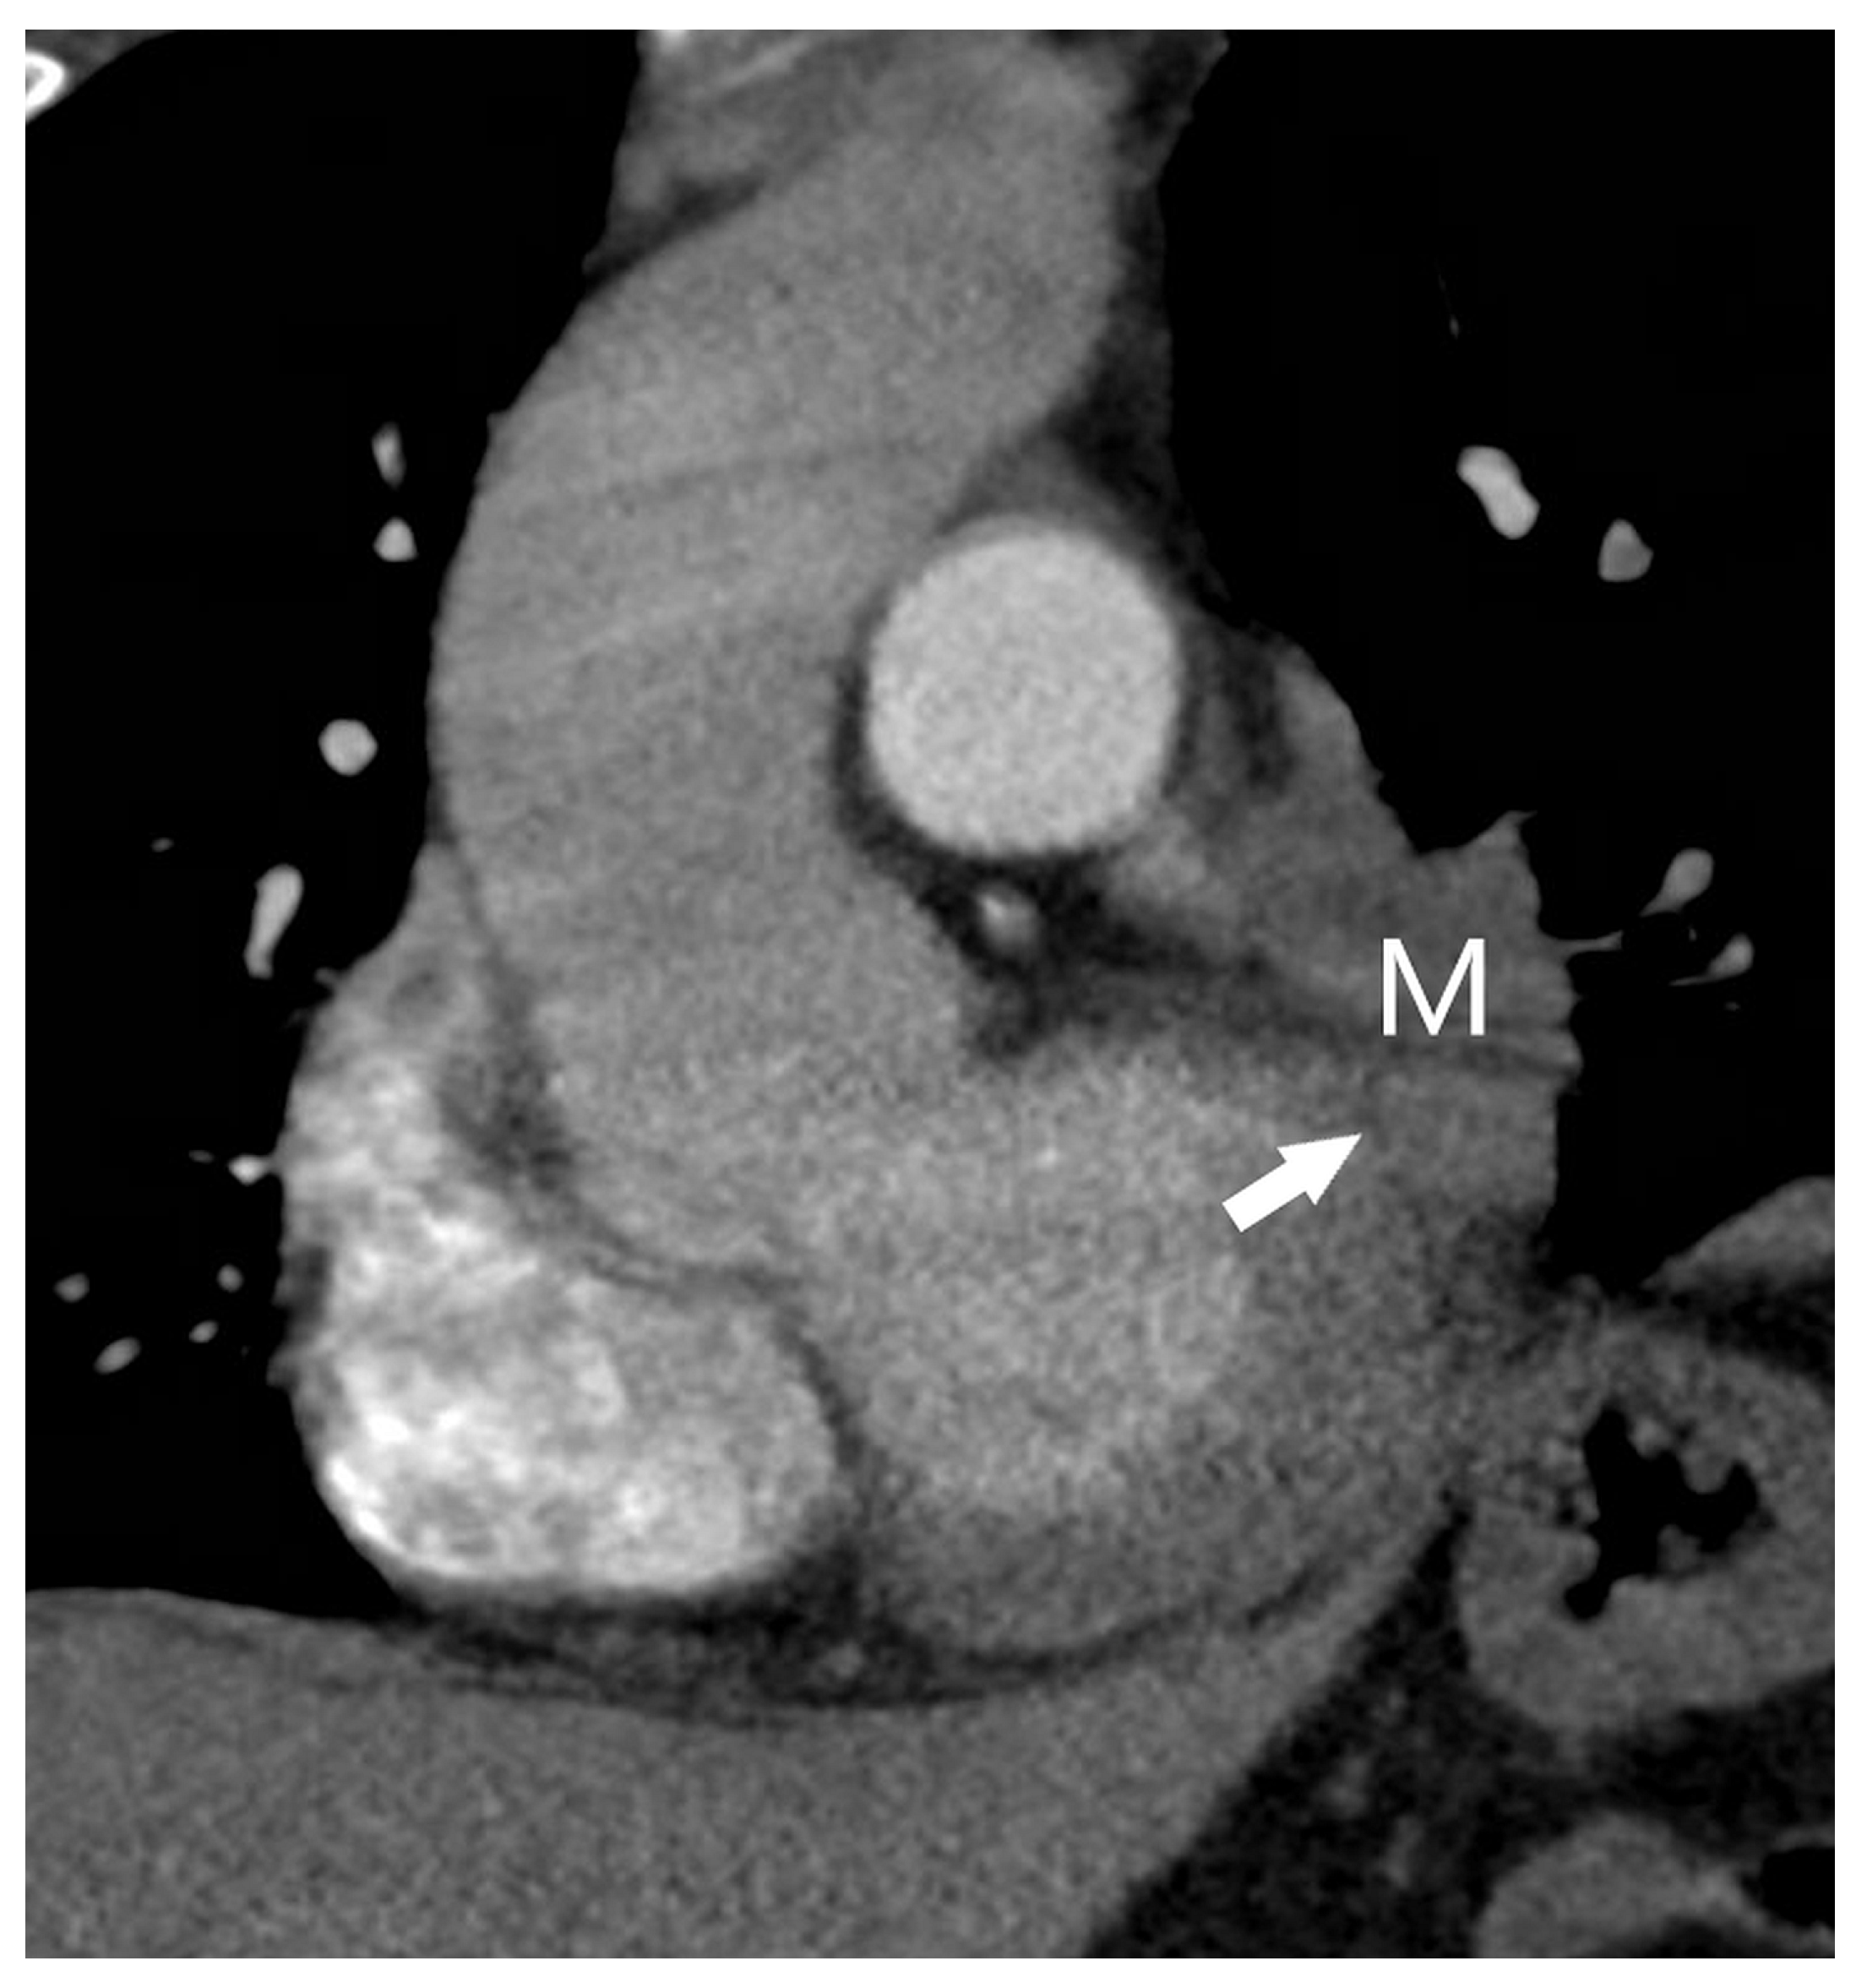
| T4 | Tumor > 7 cm in the greatest dimension Invasion of the mediastinum, thymus, trachea, carina, recurrent laryngeal nerve, vagus nerve, esophagus, or diaphragm Invasion of the heart, great vessels (aorta, superior or inferior vena cava, intrapericardial pulmonary arteries or veins), supra-aortic arteries, or brachiocephalic veins Invasion of subclavian vessels, vertebral body, lamina, spinal canal, cervical nerve roots, or brachial plexus Separate tumor nodule(s) in a different ipsilateral lobe than that of the primary | Signs of mediastinal invasion: infiltration of the mediastinal fat or structures that indicate the T4 stage, tumor–mediastinum contact length of more than 3 cm, an obtuse angle between the tumor and the mediastinum [37] Signs of vascular invasion: disappearance of the fat layer between the mass and the vessel, the angle between the mass and vessel wall >90°, a stenosis or deformation of the vascular lumen [41,42] |
3.1. Tumor Size
3.2. Presence of Atelectasis and/or Post-Obstructive Pneumonitis
3.3. Involvement of the Main Bronchus, Carina, and Trachea
3.4. Invasion of Adjacent Structures
3.4.1. T2a Category
3.4.2. T3 and T4 Categories
3.5. The Location of Additional Tumor Nodules to the Primary Tumor
- 1.
- If a patient has two separate, histologically different lung cancers, separate TNM staging should be performed for each tumor.
- 2.
- In patients with a solid primary lung cancer with one or more separate solid tumor nodule(s) of the same histological type, separate nodules are considered to be intrapulmonary metastases (Figure 15). The presence of separate tumor nodule(s) in the same lobe as the primary tumor indicates T3 disease. If there are separate tumor nodules in a different ipsilateral lobe than that of the primary tumor, stage T4 should be determined. Lung nodules in the contralateral lung indicate distant metastases (M1a disease). Although the classification of multiple lung nodules in lung cancer patients may appear simple, it may lead to overstaging if lesions are not confirmed histologically, since the majority of lung nodules identified in patients with lung cancer are benign [37].
- 3.
- Multiple lung cancer nodules with prominent ground-glass or lepidic features should be classified according to the highest T lesion. The lesion size is determined by the largest diameter of the solid component at CT. The number of lesions (#), or simply (m) for multiplicity, should be indicated in parentheses after the T descriptor of the highest lesion. This approach should be applied equally for lesions with ground-glass or lepidic features located in the same lobe or different ipsilateral or contralateral lobes. An N and M category should be applied to all lesions collectively with a single N and M stage.
- 4.
- Pneumonic-type lung cancer has a consolidative pattern on CT in the absence of an obstructed bronchus. It should be categorized as T3 if confined to a single lobe, T4 if different ipsilateral lobes are involved, or M1a if contralateral lobes are involved. A T4 designation should be applied both if there is a direct extension into another lobe and when there is a discrete separate area of involvement in an adjacent lobe. Again, a single N and M category should be assigned for all lesions.
4. N Descriptors
5. M Descriptors
6. Conclusions
- The detailed knowledge of the updated TNM system with its imaging correlation is essential for staging lung cancer, including NSCLC, SCLC, and lung neuroendocrine neoplasms. An accurate radiological report is critical for accurate clinical staging and guiding treatment strategies to optimize outcomes.
- Contrast-enhanced CT is a fundamental tool in the diagnosis and staging of lung cancer, but its sensitivity for detecting local invasion and regional or distant metastases can be suboptimal compared to advanced modalities.
- FDG PET/CT offers improved sensitivity and specificity over CT but is not effective for cancers with low FDG avidity or for the detection of brain metastases. PET/CT can also produce false positive results in conditions like infections or inflammatory diseases that are FDG-avid.
- Familiarity with the capabilities and limitations of each imaging modality is essential for accurate TNM staging. A multimodal imaging approach, combined with a deep understanding of the TNM classification system and potential diagnostic challenges, is key to ensuring precise lung cancer staging and effective patient management.
Author Contributions
Funding
Institutional Review Board Statement
Informed Consent Statement
Data Availability Statement
Conflicts of Interest
References
- Bray, F.; Laversanne, M.; Sung, H.; Ferlay, J.; Siegel, R.L.; Soerjomataram, I.; Jemal, A. Global cancer statistics 2022: GLOBOCAN estimates of incidence and mortality worldwide for 36 cancers in 185 countries. CA Cancer J. Clin. 2024, 74, 229–263. [Google Scholar] [CrossRef] [PubMed]
- Siegel, R.L.; Giaquinto, A.N.; Jemal, A. Cancer statistics, 2024. CA Cancer J. Clin. 2024, 74, 12–49. [Google Scholar] [CrossRef] [PubMed]
- Santucci, C.; Mignozzi, S.; Malvezzi, M.; Boffetta, P.; Collatuzzo, G.; Levi, F.; La Vecchia, C.; Negri, E. European cancer mortality predictions for the year 2024 with focus on colorectal cancer. Ann. Oncol. 2024, 35, 308–316. [Google Scholar] [CrossRef] [PubMed]
- Malhotra, J.; Malvezzi, M.; Negri, E.; La Vecchia, C.; Boffetta, P. Risk factors for lung cancer worldwide. Eur. Respir. J. 2016, 48, 889–902. [Google Scholar] [CrossRef]
- Dela Cruz, C.S.; Tanoue, L.T.; Matthay, R.A. Lung cancer: Epidemiology, etiology, and prevention. Clin. Chest Med. 2011, 32, 605–644. [Google Scholar] [CrossRef]
- Couraud, S.; Zalcman, G.; Milleron, B.; Morin, F.; Souquet, P.J. Lung cancer in never smokers—A review. Eur. J. Cancer 2012, 48, 1299–1311. [Google Scholar] [CrossRef]
- Sigel, K.; Wisnivesky, J.; Gordon, K.; Dubrow, R.; Justice, A.; Brown, S.T.; Goulet, J.; Butt, A.A.; Crystal, S.; Rimland, D.; et al. HIV as an independent risk factor for incident lung cancer. Aids 2012, 26, 1017–1025. [Google Scholar] [CrossRef]
- Abu Qubo, A.; Numan, J.; Snijder, J.; Padilla, M.; Austin, J.H.M.; Capaccione, K.M.; Pernia, M.; Bustamante, J.; O’Connor, T.; Salvatore, M.M. Idiopathic pulmonary fibrosis and lung cancer: Future directions and challenges. Breathe 2022, 18, 220147. [Google Scholar] [CrossRef]
- Troche, J.R.; Mayne, S.T.; Freedman, N.D.; Shebl, F.M.; Abnet, C.C. The Association Between Alcohol Consumption and Lung Carcinoma by Histological Subtype. Am. J. Epidemiol. 2016, 183, 110–121. [Google Scholar] [CrossRef]
- Li, C.; Wang, H.; Jiang, Y.; Fu, W.; Liu, X.; Zhong, R.; Cheng, B.; Zhu, F.; Xiang, Y.; He, J.; et al. Advances in lung cancer screening and early detection. Cancer Biol. Med. 2022, 19, 591–608. [Google Scholar] [CrossRef]
- Wolf, A.M.D.; Oeffinger, K.C.; Shih, T.Y.; Walter, L.C.; Church, T.R.; Fontham, E.T.H.; Elkin, E.B.; Etzioni, R.D.; Guerra, C.E.; Perkins, R.B.; et al. Screening for lung cancer: 2023 guideline update from the American Cancer Society. CA Cancer J. Clin. 2024, 74, 50–81. [Google Scholar] [CrossRef] [PubMed]
- Kauczor, H.U.; von Stackelberg, O.; Nischwitz, E.; Chorostowska-Wynimko, J.; Hierath, M.; Mathonier, C.; Prosch, H.; Zolda, P.; Revel, M.P.; Horváth, I.; et al. Strengthening lung cancer screening in Europe: Fostering participation, improving outcomes, and addressing health inequalities through collaborative initiatives in the SOLACE consortium. Insights Imaging 2024, 15, 252. [Google Scholar] [CrossRef] [PubMed]
- Kratzer, T.B.; Bandi, P.; Freedman, N.D.; Smith, R.A.; Travis, W.D.; Jemal, A.; Siegel, R.L. Lung cancer statistics, 2023. Cancer 2024, 130, 1330–1348. [Google Scholar] [CrossRef] [PubMed]
- Kim, W.; Lee, S.C.; Lee, W.R.; Chun, S. The effect of the introduction of the national lung cancer screening program on short-term mortality in Korea. Lung Cancer 2023, 186, 107412. [Google Scholar] [CrossRef]
- Andolfi, M.; Potenza, R.; Capozzi, R.; Liparulo, V.; Puma, F.; Yasufuku, K. The role of bronchoscopy in the diagnosis of early lung cancer: A review. J. Thorac. Dis. 2016, 8, 3329–3337. [Google Scholar] [CrossRef]
- Ho, A.T.N.; Gorthi, R.; Lee, R.; Chawla, M.; Patolia, S. Solitary Lung Nodule: CT-Guided Transthoracic Biopsy vs Transbronchial Biopsy With Endobronchial Ultrasound and Flexible Bronchoscope, a Meta-Analysis of Randomized Controlled Trials. Lung 2023, 201, 85–93. [Google Scholar] [CrossRef]
- Ali, M.S.; Sethi, J.; Taneja, A.; Musani, A.; Maldonado, F. Computed Tomography Bronchus Sign and the Diagnostic Yield of Guided Bronchoscopy for Peripheral Pulmonary Lesions. A Systematic Review and Meta-Analysis. Ann. Am. Thorac. Soc. 2018, 15, 978–987. [Google Scholar] [CrossRef]
- Sainz Zuñiga, P.V.; Vakil, E.; Molina, S.; Bassett, R.L.; Ost, D.E. Sensitivity of Radial Endobronchial Ultrasound-Guided Bronchoscopy for Lung Cancer in Patients With Peripheral Pulmonary Lesions: An Updated Meta-analysis. Chest 2020, 157, 994–1011. [Google Scholar] [CrossRef]
- Li, T.; Ma, W.; Al-Obeidi, E. Evolving Precision First-Line Systemic Treatment for Patients with Unresectable Non-Small Cell Lung Cancer. Cancers 2024, 16, 2350. [Google Scholar] [CrossRef]
- McLean, A.E.B.; Barnes, D.J.; Troy, L.K. Diagnosing Lung Cancer: The Complexities of Obtaining a Tissue Diagnosis in the Era of Minimally Invasive and Personalised Medicine. J. Clin. Med. 2018, 7, 163. [Google Scholar] [CrossRef]
- Remon, J.; Soria, J.C.; Peters, S.; ESMO Guidelines Committee. Early and locally advanced non-small-cell lung cancer: An update of the ESMO Clinical Practice Guidelines focusing on diagnosis, staging, systemic and local therapy. Ann. Oncol. 2021, 32, 1637–1642. [Google Scholar] [CrossRef] [PubMed]
- Rami-Porta, R.; Call, S.; Dooms, C.; Obiols, C.; Sánchez, M.; Travis, W.D.; Vollmer, I. Lung cancer staging: A concise update. Eur. Respir. J. 2018, 51, 1800190. [Google Scholar] [CrossRef] [PubMed]
- Sanz-Santos, J.; Almagro, P.; Malik, K.; Martinez-Camblor, P.; Caro, C.; Rami-Porta, R. Confirmatory Mediastinoscopy after Negative Endobronchial Ultrasound-guided Transbronchial Needle Aspiration for Mediastinal Staging of Lung Cancer: Systematic Review and Meta-analysis. Ann. Am. Thorac. Soc. 2022, 19, 1581–1590. [Google Scholar] [CrossRef] [PubMed]
- de Groot, P.M.; Chung, J.H.; Ackman, J.B.; Berry, M.F.; Carter, B.W.; Colletti, P.M.; Hobbs, S.B.; McComb, B.L.; Movsas, B.; Tong, B.C.; et al. ACR Appropriateness Criteria. J. Am. Coll. Radiol. 2019, 16, S184–S195. [Google Scholar] [CrossRef]
- Daly, M.E.; Singh, N.; Ismaila, N.; Antonoff, M.B.; Arenberg, D.A.; Bradley, J.; David, E.; Detterbeck, F.; Früh, M.; Gubens, M.A.; et al. Management of Stage III Non-Small-Cell Lung Cancer: ASCO Guideline. J. Clin. Oncol. 2022, 40, 1356–1384. [Google Scholar] [CrossRef]
- Kandathil, A.; Kay, F.U.; Butt, Y.M.; Wachsmann, J.W.; Subramaniam, R.M. Role of FDG PET/CT in the Eighth Edition of TNM Staging of Non-Small Cell Lung Cancer. Radiographics 2018, 38, 2134–2149. [Google Scholar] [CrossRef]
- Erasmus, L.T.; Strange, T.A.; Agrawal, R.; Strange, C.D.; Ahuja, J.; Shroff, G.S.; Truong, M.T. Lung Cancer Staging: Imaging and Potential Pitfalls. Diagnostics 2023, 13, 3359. [Google Scholar] [CrossRef]
- Jaykel, T.J.; Clark, M.S.; Adamo, D.A.; Welch, B.T.; Thompson, S.M.; Young, J.R.; Ehman, E.C. Thoracic positron emission tomography: 18F-fluorodeoxyglucose and beyond. J. Thorac. Dis. 2020, 12, 6978–6991. [Google Scholar] [CrossRef]
- Postmus, P.E.; Kerr, K.M.; Oudkerk, M.; Senan, S.; Waller, D.A.; Vansteenkiste, J.; Escriu, C.; Peters, S.; Committee, E.G. Early and locally advanced non-small-cell lung cancer (NSCLC): ESMO Clinical Practice Guidelines for diagnosis, treatment and follow-up. Ann. Oncol. 2017, 28, iv1–iv21. [Google Scholar] [CrossRef]
- Rami-Porta, R.; Nishimura, K.K.; Giroux, D.J.; Detterbeck, F.; Cardillo, G.; Edwards, J.G.; Fong, K.M.; Giuliani, M.; Huang, J.; Kernstine, K.H.; et al. The International Association for the Study of Lung Cancer Lung Cancer Staging Project: Proposals for Revision of the TNM Stage Groups in the Forthcoming (Ninth) Edition of the TNM Classification for Lung Cancer. J. Thorac. Oncol. 2024, 19, 1007–1027. [Google Scholar] [CrossRef]
- Hardavella, G.; Frille, A.; Theochari, C.; Keramida, E.; Bellou, E.; Fotineas, A.; Bracka, I.; Pappa, L.; Zagana, V.; Palamiotou, M.; et al. Multidisciplinary care models for patients with lung cancer. Breathe 2020, 16, 200076. [Google Scholar] [CrossRef] [PubMed]
- Ashrafi, A.; Akter, Z.; Modareszadeh, P.; Berisha, E.; Alemi, P.S.; Chacon Castro, M.D.C.; Deese, A.R.; Zhang, L. Current Landscape of Therapeutic Resistance in Lung Cancer and Promising Strategies to Overcome Resistance. Cancers 2022, 14, 4562. [Google Scholar] [CrossRef] [PubMed]
- Gill, A.; Hirst, A.L.; Rowshanfarzad, P.; Gill, S.; Bucknell, N.; Dass, J.; Sabet, M. Stereotactic body radiotherapy for early-stage lung cancer: A systematic review on the choice of photon energy and linac flattened/unflattened beams. Radiat. Oncol. 2024, 19, 1. [Google Scholar] [CrossRef]
- Viani, G.A.; Gouveia, A.G.; Louie, A.V.; Arcidiacono, F.; Simone, C.B.; Tsakiridis, T.; Carolina Hamamura, A.; Anselmo, P.; Moraes, F.Y. Stereotactic ablative radiotherapy for locally advanced non-small cell lung cancer: A systematic review and meta-analysis. Radiother. Oncol. 2024, 201, 110439. [Google Scholar] [CrossRef]
- Van Schil, P.E.; Asamura, H.; Nishimura, K.K.; Rami-Porta, R.; Kim, Y.T.; Bertoglio, P.; Cangir, A.K.; Donington, J.; Fang, W.; Giroux, D.J.; et al. The International Association for the Study of Lung Cancer Lung Cancer Staging Project: Proposals for the Revisions of the T-Descriptors in the Forthcoming Ninth Edition of the TNM Classification for Lung Cancer. J. Thorac. Oncol. 2024, 19, 749–765. [Google Scholar] [CrossRef]
- Panunzio, A.; Sartori, P. Lung Cancer and Radiological Imaging. Curr. Radiopharm. 2020, 13, 238–242. [Google Scholar] [CrossRef]
- Beer, L.; Jajodia, A.; Prosch, H. Pearls and pitfalls in lung cancer staging. BJR Open 2020, 2, 20200019. [Google Scholar] [CrossRef]
- Sim, A.J.; Kaza, E.; Singer, L.; Rosenberg, S.A. A review of the role of MRI in diagnosis and treatment of early stage lung cancer. Clin. Transl. Radiat. Oncol. 2020, 24, 16–22. [Google Scholar] [CrossRef]
- Owens, C.; Hindocha, S.; Lee, R.; Millard, T.; Sharma, B. The lung cancers: Staging and response, CT, 18F-FDG PET/CT, MRI, DWI: Review and new perspectives. Br. J. Radiol. 2023, 96, 20220339. [Google Scholar] [CrossRef]
- Sun, Q.; Li, P.; Zhang, J.; Yip, R.; Zhu, Y.; Yankelevitz, D.F.; Henschke, C.I. CT Predictors of Visceral Pleural Invasion in Patients with Non-Small Cell Lung Cancers 30 mm or Smaller. Radiology 2024, 310, e231611. [Google Scholar] [CrossRef]
- Herman, S.J.; Winton, T.L.; Weisbrod, G.L.; Towers, M.J.; Mentzer, S.J. Mediastinal invasion by bronchogenic carcinoma: CT signs. Radiology 1994, 190, 841–846. [Google Scholar] [CrossRef] [PubMed]
- Oka, S.; Shinohara, S.; Kuwata, T.; Takenaka, M.; Chikaishi, Y.; Hirai, A.; Ichiki, Y.; Shimajiri, S.; Aoki, T.; Tanaka, F. The major thoracic vascular invasion of lung cancer. Ann. Med. Surg. 2017, 20, 13–18. [Google Scholar] [CrossRef]
- Klug, M.; Kirshenboim, Z.; Truong, M.T.; Sorin, V.; Ofek, E.; Agrawal, R.; Marom, E.M. Proposed Ninth Edition TNM Staging System for Lung Cancer: Guide for Radiologists. Radiographics 2024, 44, e240057. [Google Scholar] [CrossRef] [PubMed]
- Travis, W.D.; Asamura, H.; Bankier, A.A.; Beasley, M.B.; Detterbeck, F.; Flieder, D.B.; Goo, J.M.; MacMahon, H.; Naidich, D.; Nicholson, A.G.; et al. The IASLC Lung Cancer Staging Project: Proposals for Coding T Categories for Subsolid Nodules and Assessment of Tumor Size in Part-Solid Tumors in the Forthcoming Eighth Edition of the TNM Classification of Lung Cancer. J. Thorac. Oncol. 2016, 11, 1204–1223. [Google Scholar] [CrossRef]
- Bankier, A.A.; MacMahon, H.; Goo, J.M.; Rubin, G.D.; Schaefer-Prokop, C.M.; Naidich, D.P. Recommendations for Measuring Pulmonary Nodules at CT: A Statement from the Fleischner Society. Radiology 2017, 285, 584–600. [Google Scholar] [CrossRef]
- Feng, S.H.; Yang, S.T. The new 8th TNM staging system of lung cancer and its potential imaging interpretation pitfalls and limitations with CT image demonstrations. Diagn. Interv. Radiol. 2019, 25, 270–279. [Google Scholar] [CrossRef]
- Chen, H.; Kim, A.W.; Hsin, M.; Shrager, J.B.; Prosper, A.E.; Wahidi, M.M.; Wigle, D.A.; Wu, C.C.; Huang, J.; Yasufuku, K.; et al. The 2023 American Association for Thoracic Surgery (AATS) Expert Consensus Document: Management of subsolid lung nodules. J. Thorac. Cardiovasc. Surg. 2024, 168, 631–647.e11. [Google Scholar] [CrossRef]
- Sun, J.D.; Sugarbaker, E.; Byrne, S.C.; Gagné, A.; Leo, R.; Swanson, S.J.; Hammer, M.M. Clinical Outcomes of Resected Pure Ground-Glass, Heterogeneous Ground-Glass, and Part-Solid Pulmonary Nodules. Am. J. Roentgenol. 2024, 222, e2330504. [Google Scholar] [CrossRef]
- Snoeckx, A.; Reyntiens, P.; Carp, L.; Spinhoven, M.J.; El Addouli, H.; Van Hoyweghen, A.; Nicolay, S.; Van Schil, P.E.; Pauwels, P.; van Meerbeeck, J.P.; et al. Diagnostic and clinical features of lung cancer associated with cystic airspaces. J. Thorac. Dis. 2019, 11, 987–1004. [Google Scholar] [CrossRef]
- Mets, O.M.; Schaefer-Prokop, C.M.; de Jong, P.A. Cyst-related primary lung malignancies: An important and relatively unknown imaging appearance of (early) lung cancer. Eur. Respir. Rev. 2018, 27, 180079. [Google Scholar] [CrossRef]
- Yang, X.; Sun, F.; Chen, L.; Shi, M.; Shi, Y.; Lin, Z.; Feng, M.; Zhan, C.; Jiang, W.; Wang, Q. Prognostic value of visceral pleural invasion in non-small cell lung cancer: A propensity score matching study based on the SEER registry. J. Surg. Oncol. 2017, 116, 398–406. [Google Scholar] [CrossRef] [PubMed]
- Song, X.; Xie, Y.; Zhu, Y.; Lou, Y. Is lobectomy superior to sub-lobectomy in non-small cell lung cancer with pleural invasion? A population-based competing risk analysis. BMC Cancer 2022, 22, 541. [Google Scholar] [CrossRef]
- Yu, Y.; Huang, R.; Wang, P.; Wang, S.; Ling, X.; Zhang, P.; Yu, J.; Wang, J.; Xiao, J.; Wang, Z. Sublobectomy versus lobectomy for long-term survival outcomes of early-stage non-small cell lung cancer with a tumor size ≤2 cm accompanied by visceral pleural invasion: A SEER population-based study. J. Thorac. Dis. 2020, 12, 592–604. [Google Scholar] [CrossRef] [PubMed]
- Ruan, Z.; Zhuo, X.; Xu, C. Diagnosis, treatment, and prognosis of stage IB non-small cell lung cancer with visceral pleural invasion. Front. Oncol. 2023, 13, 1310471. [Google Scholar] [CrossRef]
- Zhao, Q.; Wang, J.W.; Yang, L.; Xue, L.Y.; Lu, W.W. CT diagnosis of pleural and stromal invasion in malignant subpleural pure ground-glass nodules: An exploratory study. Eur. Radiol. 2019, 29, 279–286. [Google Scholar] [CrossRef]
- Heidinger, B.H.; Schwarz-Nemec, U.; Anderson, K.R.; de Margerie-Mellon, C.; Monteiro Filho, A.C.; Chen, Y.; Mayerhoefer, M.E.; VanderLaan, P.A.; Bankier, A.A. Visceral Pleural Invasion in Pulmonary Adenocarcinoma: Differences in CT Patterns between Solid and Subsolid Cancers. Radiol. Cardiothorac. Imaging 2019, 1, e190071. [Google Scholar] [CrossRef]
- Liu, M.; Wigle, D.; Wampfler, J.A.; Dai, J.; Stoddard, S.M.; Xue, Z.; Nichols, F.C.; Jiang, G.; Yang, P. T category of non-small cell lung cancer invading the fissure to the adjacent lobe. J. Thorac. Cardiovasc. Surg. 2017, 154, 1777–1783.e3. [Google Scholar] [CrossRef]
- Andreetti, C.; Poggi, C.; Ibrahim, M.; D’Andrilli, A.; Maurizi, G.; Tiracorrendo, M.; Peritore, V.; Rendina, E.A.; Venuta, F.; Anile, M.; et al. Surgical treatment of lung cancer with adjacent lobe invasion in relation to fissure integrity. Thorac. Cancer 2020, 11, 232–242. [Google Scholar] [CrossRef]
- Beigelman-Aubry, C.; Dunet, V.; Brun, A.L. CT imaging in pre-therapeutic assessment of lung cancer. Diagn. Interv. Imaging 2016, 97, 973–989. [Google Scholar] [CrossRef]
- Cummings, K.W.; Sridhar, S.; Parsons, M.S.; Javidan-Nejad, C.; Bhalla, S. Cross-sectional Imaging Anatomy and Pathologic Conditions Affecting Thoracic Nerves. Radiographics 2017, 37, 73–92. [Google Scholar] [CrossRef]
- MacManus, M.; Everitt, S.; Schimek-Jasch, T.; Li, X.A.; Nestle, U.; Kong, F.S. Anatomic, functional and molecular imaging in lung cancer precision radiation therapy: Treatment response assessment and radiation therapy personalization. Transl. Lung Cancer Res. 2017, 6, 670–688. [Google Scholar] [CrossRef] [PubMed]
- Piciucchi, S.; Barone, D.; Sanna, S.; Dubini, A.; Goodman, L.R.; Oboldi, D.; Bertocco, M.; Ciccotosto, C.; Gavelli, G.; Carloni, A.; et al. The azygos vein pathway: An overview from anatomical variations to pathological changes. Insights Imaging 2014, 5, 619–628. [Google Scholar] [CrossRef] [PubMed]
- Riquet, M.; Grand, B.; Arame, A.; Pricopi, C.F.; Foucault, C.; Dujon, A.; Le Pimpec Barthes, F. Lung cancer invading the pericardium: Quantum of lymph nodes. Ann. Thorac. Surg. 2010, 90, 1773–1777. [Google Scholar] [CrossRef] [PubMed]
- Campisi, A.; Dell’Amore, A.; Chen, C.; Gabryel, P.; Bertolaccini, L.; Ciarrocchi, A.P.; Ji, C.; Piwkowski, C.; Spaggiari, L.; Fang, W.; et al. Should we distinguish between intra and extrapericardial pulmonary artery involvement in NSCLC? A multicenter retrospective case-control study. Eur. J. Surg. Oncol. 2021, 47, 2982–2988. [Google Scholar] [CrossRef]
- Zhong, Y.; Li, C.; Sheng, Y.; Wang, J.; Wang, G. Prognostic Implication of Direct Cardiac Invasion from Lung Cancer in Non-Operatively Treated Patients Based on Lung Computed Tomography Imaging. Heart Lung Circ. 2022, 31, 733–741. [Google Scholar] [CrossRef]
- Aquino, S.L.; Duncan, G.R.; Hayman, L.A. Nerves of the thorax: Atlas of normal and pathologic findings. Radiographics 2001, 21, 1275–1281. [Google Scholar] [CrossRef]
- Lin, Y.P.; Chang, T.S.; Wu, F.Z. Small cell lung cancer presenting with hoarseness. Postgrad. Med. J. 2019, 95, 218. [Google Scholar] [CrossRef]
- Oner, A.O.; Boz, A.; Surer Budak, E.; Kaplan Kurt, G.H. Left Vocal Cord Paralysis Detected by PET/CT in a Case of Lung Cancer. Case Rep. Oncol. Med. 2015, 2015, 617294. [Google Scholar] [CrossRef]
- Gale, M.E.; Birnbaum, S.B.; Gale, D.R.; Vincent, M.E. Esophageal invasion by lung cancer: CT diagnosis. J. Comput. Assist. Tomogr. 1984, 8, 694–698. [Google Scholar] [CrossRef]
- Haruki, T.; Nakamura, H.; Kishimoto, S.; Yurugi, Y.; Fujioka, S.; Miwa, K.; Taniguchi, Y. Squamous cell carcinoma of the lung invaded to esophagus: A case report of successful surgical treatment after preoperative transesophageal echographic evaluation. Gen. Thorac. Cardiovasc. Surg. 2012, 60, 465–467. [Google Scholar] [CrossRef]
- Tárnoki, Á.; Tárnoki, D.L.; Dąbrowska, M.; Knetki-Wróblewska, M.; Frille, A.; Stubbs, H.; Blyth, K.G.; Juul, A.D. New developments in the imaging of lung cancer. Breathe 2024, 20, 230176. [Google Scholar] [CrossRef] [PubMed]
- Detterbeck, F.C.; Nicholson, A.G.; Franklin, W.A.; Marom, E.M.; Travis, W.D.; Girard, N.; Arenberg, D.A.; Bolejack, V.; Donington, J.S.; Mazzone, P.J.; et al. The IASLC Lung Cancer Staging Project: Summary of Proposals for Revisions of the Classification of Lung Cancers with Multiple Pulmonary Sites of Involvement in the Forthcoming Eighth Edition of the TNM Classification. J. Thorac. Oncol. 2016, 11, 639–650. [Google Scholar] [CrossRef] [PubMed]
- Rusch, V.W.; Asamura, H.; Watanabe, H.; Giroux, D.J.; Rami-Porta, R.; Goldstraw, P.; Committee, M.o.I.S. The IASLC lung cancer staging project: A proposal for a new international lymph node map in the forthcoming seventh edition of the TNM classification for lung cancer. J. Thorac. Oncol. 2009, 4, 568–577. [Google Scholar] [CrossRef] [PubMed]
- Huang, J.; Osarogiagbon, R.U.; Giroux, D.J.; Nishimura, K.K.; Bille, A.; Cardillo, G.; Detterbeck, F.; Kernstine, K.; Kim, H.K.; Lievens, Y.; et al. The International Association for the Study of Lung Cancer Staging Project for Lung Cancer: Proposals for the Revision of the N Descriptors in the Forthcoming Ninth Edition of the TNM Classification for Lung Cancer. J. Thorac. Oncol. 2024, 19, 766–785. [Google Scholar] [CrossRef]
- Lee, D.; Rho, J.Y.; Kang, S.; Yoo, K.J.; Choi, H.J. CT findings of small cell lung carcinoma: Can recognizable features be found? Medicine 2016, 95, e5426. [Google Scholar] [CrossRef]
- Archer, J.M.; Truong, M.T.; Shroff, G.S.; Godoy, M.C.B.; Marom, E.M. Imaging of Lung Cancer Staging. Semin. Respir. Crit. Care Med. 2022, 43, 862–873. [Google Scholar] [CrossRef]
- Yun, J.K.; Lee, G.D.; Choi, S.; Kim, H.R.; Kim, Y.H.; Kim, D.K.; Park, S.I. Comparison between lymph node station- and zone-based classification for the future revision of node descriptors proposed by the International Association for the Study of Lung Cancer in surgically resected patients with non-small-cell lung cancer. Eur. J. Cardiothorac. Surg. 2019, 56, 849–857. [Google Scholar] [CrossRef]
- Detterbeck, F.C.; Woodard, G.A.; Bader, A.S.; Dacic, S.; Grant, M.J.; Park, H.S.; Tanoue, L.T. The Proposed Ninth Edition TNM Classification of Lung Cancer. Chest 2024, 166, 882–895. [Google Scholar] [CrossRef]
- Osarogiagbon, R.U.; Van Schil, P.; Giroux, D.J.; Lim, E.; Putora, P.M.; Lievens, Y.; Cardillo, G.; Kim, H.K.; Rocco, G.; Bille, A.; et al. The International Association for the Study of Lung Cancer Lung Cancer Staging Project: Overview of Challenges and Opportunities in Revising the Nodal Classification of Lung Cancer. J. Thorac. Oncol. 2023, 18, 410–418. [Google Scholar] [CrossRef]
- Leiro-Fernández, V.; Fernández-Villar, A. Mediastinal staging for non-small cell lung cancer. Transl. Lung Cancer Res. 2021, 10, 496–505. [Google Scholar] [CrossRef]
- Putora, P.M.; Leskow, P.; McDonald, F.; Batchelor, T.; Evison, M. International guidelines on stage III N2 nonsmall cell lung cancer: Surgery or radiotherapy? ERJ Open Res. 2020, 6, 00159-2019. [Google Scholar] [CrossRef] [PubMed]
- Fong, K.M.; Rosenthal, A.; Giroux, D.J.; Nishimura, K.K.; Erasmus, J.; Lievens, Y.; Marino, M.; Marom, E.M.; Putora, P.M.; Singh, N.; et al. The International Association for the Study of Lung Cancer Staging Project for Lung Cancer: Proposals for the Revision of the M Descriptors in the Forthcoming Ninth Edition of the TNM Classification for Lung Cancer. J. Thorac. Oncol. 2024, 19, 786–802. [Google Scholar] [CrossRef] [PubMed]
- Xie, T.; Qiu, B.M.; Luo, J.; Diao, Y.F.; Hu, L.W.; Liu, X.L.; Shen, Y. Distant metastasis patterns among lung cancer subtypes and impact of primary tumor resection on survival in metastatic lung cancer using SEER database. Sci. Rep. 2024, 14, 22445. [Google Scholar] [CrossRef]
- Planchard, D.; Popat, S.; Kerr, K.; Novello, S.; Smit, E.F.; Faivre-Finn, C.; Mok, T.S.; Reck, M.; Van Schil, P.E.; Hellmann, M.D.; et al. Metastatic non-small cell lung cancer: ESMO Clinical Practice Guidelines for diagnosis, treatment and follow-up. Ann. Oncol. 2018, 29, iv192–iv237. [Google Scholar] [CrossRef]
- Gallamini, A.; Zwarthoed, C.; Borra, A. Positron Emission Tomography (PET) in Oncology. Cancers 2014, 6, 1821–1889. [Google Scholar] [CrossRef]
- Nayak, L.; Lee, E.Q.; Wen, P.Y. Epidemiology of brain metastases. Curr. Oncol. Rep. 2012, 14, 48–54. [Google Scholar] [CrossRef]
- Diaz, M.E.; Debowski, M.; Hukins, C.; Fielding, D.; Fong, K.M.; Bettington, C.S. Non-small cell lung cancer brain metastasis screening in the era of positron emission tomography-CT staging: Current practice and outcomes. J. Med. Imaging Radiat. Oncol. 2018, 62, 383–388. [Google Scholar] [CrossRef]
- Hendriks, L.E.; Bootsma, G.P.; de Ruysscher, D.K.; Scheppers, N.A.; Hofman, P.A.; Brans, B.T.; Dingemans, A.M. Screening for brain metastases in patients with stage III non-small cell lung cancer: Is there additive value of magnetic resonance imaging above a contrast-enhanced computed tomography of the brain? Lung Cancer 2013, 80, 293–297. [Google Scholar] [CrossRef]
- Hochstenbag, M.M.; Twijnstra, A.; Hofman, P.; Wouters, E.F.; ten Velde, G.P. MR-imaging of the brain of neurologic asymptomatic patients with large cell or adenocarcinoma of the lung. Does it influence prognosis and treatment? Lung Cancer 2003, 42, 189–193. [Google Scholar] [CrossRef]
- Ostrom, Q.T.; Wright, C.H.; Barnholtz-Sloan, J.S. Brain metastases: Epidemiology. Handb. Clin. Neurol. 2018, 149, 27–42. [Google Scholar] [CrossRef]
- Schoenmaekers, J.J.A.O.; Dingemans, A.C.; Hendriks, L.E.L. Brain imaging in early stage non-small cell lung cancer: Still a controversial topic? J. Thorac. Dis. 2018, 10, S2168–S2171. [Google Scholar] [CrossRef]
- Derks, S.H.A.E.; van der Veldt, A.A.M.; Smits, M. Brain metastases: The role of clinical imaging. Br. J. Radiol. 2022, 95, 20210944. [Google Scholar] [CrossRef] [PubMed]
- Dingemans, A.C.; Früh, M.; Ardizzoni, A.; Besse, B.; Faivre-Finn, C.; Hendriks, L.E.; Lantuejoul, S.; Peters, S.; Reguart, N.; Rudin, C.M.; et al. Small-cell lung cancer: ESMO Clinical Practice Guidelines for diagnosis, treatment and follow-up. Ann. Oncol. 2021, 32, 839–853. [Google Scholar] [CrossRef] [PubMed]
- D’Antonio, C.; Passaro, A.; Gori, B.; Del Signore, E.; Migliorino, M.R.; Ricciardi, S.; Fulvi, A.; de Marinis, F. Bone and brain metastasis in lung cancer: Recent advances in therapeutic strategies. Ther. Adv. Med. Oncol. 2014, 6, 101–114. [Google Scholar] [CrossRef] [PubMed]
- O’Sullivan, G.J.; Carty, F.L.; Cronin, C.G. Imaging of bone metastasis: An update. World J. Radiol. 2015, 7, 202–211. [Google Scholar] [CrossRef]
- Qu, X.; Huang, X.; Yan, W.; Wu, L.; Dai, K. A meta-analysis of ¹⁸FDG-PET-CT, ¹⁸FDG-PET, MRI and bone scintigraphy for diagnosis of bone metastases in patients with lung cancer. Eur. J. Radiol. 2012, 81, 1007–1015. [Google Scholar] [CrossRef]
- Confavreux, C.B.; Pialat, J.B.; Bellière, A.; Brevet, M.; Decroisette, C.; Tescaru, A.; Wegrzyn, J.; Barrey, C.; Mornex, F.; Souquet, P.J.; et al. Bone metastases from lung cancer: A paradigm for multidisciplinary onco-rheumatology management. Joint Bone Spine 2019, 86, 185–194. [Google Scholar] [CrossRef]
- Tan, M.T.; Lloyd, T.B. Utility of dual energy computed tomography in the evaluation of infiltrative skeletal lesions and metastasis: A literature review. Skeletal Radiol. 2022, 51, 1731–1741. [Google Scholar] [CrossRef]
- Knapp, B.J.; Devarakonda, S.; Govindan, R. Bone metastases in non-small cell lung cancer: A narrative review. J. Thorac. Dis. 2022, 14, 1696–1712. [Google Scholar] [CrossRef]
- Schieda, N.; Siegelman, E.S. Update on CT and MRI of Adrenal Nodules. Am. J. Roentgenol. 2017, 208, 1206–1217. [Google Scholar] [CrossRef]
- Metser, U.; Miller, E.; Lerman, H.; Lievshitz, G.; Avital, S.; Even-Sapir, E. 18F-FDG PET/CT in the evaluation of adrenal masses. J. Nucl. Med. 2006, 47, 32–37. [Google Scholar] [PubMed]
- Martin, S.S.; Weidinger, S.; Czwikla, R.; Kaltenbach, B.; Albrecht, M.H.; Lenga, L.; Vogl, T.J.; Wichmann, J.L. Iodine and Fat Quantification for Differentiation of Adrenal Gland Adenomas From Metastases Using Third-Generation Dual-Source Dual-Energy Computed Tomography. Investig. Radiol. 2018, 53, 173–178. [Google Scholar] [CrossRef]
- Albano, D.; Agnello, F.; Midiri, F.; Pecoraro, G.; Bruno, A.; Alongi, P.; Toia, P.; Di Buono, G.; Agrusa, A.; Sconfienza, L.M.; et al. Imaging features of adrenal masses. Insights Imaging 2019, 10, 1. [Google Scholar] [CrossRef] [PubMed]
- Gore, R.M.; Thakrar, K.H.; Wenzke, D.R.; Newmark, G.M.; Mehta, U.K.; Berlin, J.W. That liver lesion on MDCT in the oncology patient: Is it important? Cancer Imaging 2012, 12, 373–384. [Google Scholar] [CrossRef]
- Gulpinar, B.; Peker, E.; Kul, M.; Elhan, A.H.; Haliloglu, N. Liver metastases of neuroendocrine tumors: Is it possible to diagnose different histologic subtypes depending on multiphasic CT features? Abdom. Radiol. 2019, 44, 2147–2155. [Google Scholar] [CrossRef]
- Maino, C.; Vernuccio, F.; Cannella, R.; Cortese, F.; Franco, P.N.; Gaetani, C.; Giannini, V.; Inchingolo, R.; Ippolito, D.; Defeudis, A.; et al. Liver metastases: The role of magnetic resonance imaging. World J. Gastroenterol. 2023, 29, 5180–5197. [Google Scholar] [CrossRef]
- Ozaki, K.; Higuchi, S.; Kimura, H.; Gabata, T. Liver Metastases: Correlation between Imaging Features and Pathomolecular Environments. Radiographics 2022, 42, 1994–2013. [Google Scholar] [CrossRef]


| Imaging Method | Advantages | Limitations |
|---|---|---|
| PET/CT |
|
|
| MRI |
|
|
| Parameter | Recommendations |
|---|---|
| Slice thickness | Use contiguous thin sections (≤1 mm) |
| Measurement settings | Perform all measurements using a lung window setting (width 1500, level −600) with a sharp filter |
| Recording dimensions | Document nodule dimensions in centimeters, including millimeter increments |
| Solid and pure ground-glass nodules | Measure the maximum long-axis diameter in the axial, sagittal, and coronal planes |
| Part-solid nodules | Measure the maximum long-axis diameter of the nodule, including the ground-glass (GG) component, in the axial, sagittal, and coronal planes. Also, measure the maximum long-axis dimension of the largest solid component. Report both dimensions; however, for staging purposes, use only the largest solid component dimension |
| Station | Anatomical Region | Borders on a CT Scan [73] |
|---|---|---|
| 1R and 1L | Lower cervical, supraclavicular, and sternal notch nodes | The lower margin of the cricoid cartilage (superiorly), clavicles and the upper border of the manubrium (inferiorly), the midline of the trachea serves as the border between 1R and 1L |
| 2R and 2L | Upper paratracheal nodes | Bilateral superior border: apex of the right lung and pleural space, and in the midline, the upper border of the manubrium 2R inferior border: the intersection of the caudal margin of the left brachiocephalic (innominate) vein with the trachea 2L inferior border: superior border of the aortic arch The border between 2R and 2L is the left lateral border of the trachea |
| 3 | Pre-vascular nodes (3a) Retrotracheal nodes (3b) | Pre-vascular: chest apex (superiorly), level of carina (inferiorly), posterior aspect of sternum (anteriorly), anterior border of superior vena cava (posteriorly, right side), left carotid artery (posteriorly, left side) Retrotracheal: chest apex (superiorly), level of carina (inferiorly) Midline nodes are considered to be ipsilateral |
| 4R and 4L | Lower paratracheal nodes | 4R: the intersection of the caudal margin of the left brachiocephalic (innominate) vein with the trachea (superiorly), lower border of azygos vein (inferiorly) 4L: superior border of the aortic arch (superiorly), upper rim of the left main pulmonary artery (inferiorly), ligamentum arteriosum (laterally) The border between 4R and 4L is the left lateral border of the trachea |
| 5 | Subaortic nodes | Ligamentum arteriosum and aorta (medially), the lower border of the aortic arch (superiorly), the upper rim of the left main pulmonary artery (inferiorly), proximal to the first branch of the left pulmonary artery |
| 6 | Para-aortic nodes | Anterior and lateral to the ascending aorta, aortic arch, and the brachiocephalic trunk (innominate artery). Superior border: the upper border of the aortic arch Inferior border: the lower border of the aortic arch |
| 7 | Subcarinal nodes | Superior border: the carina Inferior border: the lower border of the bronchus intermedius (right side), the upper border of the lower lobe bronchus (left side) |
| 8 | Paraesophageal nodes | Adjacent to the esophageal wall to the right or left of the midline, excluding subcarinal nodes Superior border: the lower border of the bronchus intermedius (right side), the upper border of the lower lobe bronchus (left side) Inferior border: the diaphragm |
| 9 | Pulmonary ligament | Within the pulmonary ligament Superior border: the inferior pulmonary vein Inferior border: the diaphragm |
| 10 | Hilar | Nodes adjacent to the mainstem bronchus, proximal portions of the pulmonary veins, and the pulmonary artery Superior border: the lower rim of the azygos vein (right side), the upper rim of the pulmonary artery (left side) Inferior border: interlobar region |
| 11 | Interlobar | Between origins of lobar bronchi |
| 12 | Lobar | Adjacent to lobar bronchi |
| 13 | Segmental | Adjacent to segmental bronchi |
| 14 | Subsegmental | Adjacent to subsegmental bronchi |
| Descriptor | Description [30] | Comment |
|---|---|---|
| Nx | Regional lymph nodes cannot be assessed | |
| N0 | No regional lymph node metastasis | |
| N1 | Metastasis(es) in ipsilateral peribronchial or ipsilateral hilar or intrapulmonary lymph nodes | Ipsilateral stations 10–14 [73] Direct extension of primary tumor included [30] |
| N2 | Metastasis(es) in the ipsilateral mediastinal or subcarinal nodal station(s) | The border between 2R and 2L, as well as between 4R and 4L is the left lateral tracheal border For other stations, midline nodes are considered to be ipsilateral [73] |
| N2a | Metastasis(es) in a single ipsilateral mediastinal or subcarinal nodal station | Includes metastasis(es) both in single or multiple lymph nodes in the same single nodal station |
| N2b | Metastases in multiple ipsilateral mediastinal nodal stations with or without involvement of the subcarinal nodal station | |
| N3 | Metastasis(es) in contralateral mediastinal, contralateral hilar, ipsilateral or contralateral scalene or supraclavicular lymph node(s) | Metastases to non-regional intrathoracic lymph nodes are considered distant metastases [24,27,76] |
| Descriptor | Description [30] | Comment |
|---|---|---|
| M0 | No distant metastasis | |
| M1 | Distant metastasis(es) | |
| M1a | Pleural or pericardial nodules or malignant pleural or pericardial effusions Separate tumor nodule(s) in a contralateral lobe | The pleural or pericardial effusions should be excluded as staging descriptors if multiple microscopic fluid examinations are negative for tumor and the fluid is non-bloody and is not an exudate [30] |
| M1b | Single extrathoracic metastasis in a single organ system | Includes involvement of a single non-regional intrathoracic or extrathoracic lymph node [24,27,30,76] |
| M1c1 | Multiple extrathoracic metastases in a single organ system | The organ system may be a solitary organ, paired organ, or diffuse throughout the body. The skeleton is considered to be one organ [82] |
| M1c2 | Multiple extrathoracic metastases in multiple organ systems |
Disclaimer/Publisher’s Note: The statements, opinions and data contained in all publications are solely those of the individual author(s) and contributor(s) and not of MDPI and/or the editor(s). MDPI and/or the editor(s) disclaim responsibility for any injury to people or property resulting from any ideas, methods, instructions or products referred to in the content. |
© 2025 by the authors. Licensee MDPI, Basel, Switzerland. This article is an open access article distributed under the terms and conditions of the Creative Commons Attribution (CC BY) license (https://creativecommons.org/licenses/by/4.0/).
Share and Cite
Kuhtić, I.; Mandić Paulić, T.; Kovačević, L.; Badovinac, S.; Jakopović, M.; Dobrenić, M.; Hrabak-Paar, M. Clinical TNM Lung Cancer Staging: A Diagnostic Algorithm with a Pictorial Review. Diagnostics 2025, 15, 908. https://doi.org/10.3390/diagnostics15070908
Kuhtić I, Mandić Paulić T, Kovačević L, Badovinac S, Jakopović M, Dobrenić M, Hrabak-Paar M. Clinical TNM Lung Cancer Staging: A Diagnostic Algorithm with a Pictorial Review. Diagnostics. 2025; 15(7):908. https://doi.org/10.3390/diagnostics15070908
Chicago/Turabian StyleKuhtić, Ivana, Tinamarel Mandić Paulić, Lucija Kovačević, Sonja Badovinac, Marko Jakopović, Margareta Dobrenić, and Maja Hrabak-Paar. 2025. "Clinical TNM Lung Cancer Staging: A Diagnostic Algorithm with a Pictorial Review" Diagnostics 15, no. 7: 908. https://doi.org/10.3390/diagnostics15070908
APA StyleKuhtić, I., Mandić Paulić, T., Kovačević, L., Badovinac, S., Jakopović, M., Dobrenić, M., & Hrabak-Paar, M. (2025). Clinical TNM Lung Cancer Staging: A Diagnostic Algorithm with a Pictorial Review. Diagnostics, 15(7), 908. https://doi.org/10.3390/diagnostics15070908