Analytical Validation of MyProstateScore 2.0
Abstract
1. Introduction
2. Materials and Methods
2.1. RNA Extraction and Reverse Transcription
2.2. Pre-Amplification and Quantitative PCR (qPCR)
2.3. Determination of Linear Range and Upper Limit of Quantification
2.4. Determination of Limit of Detection and Lower Limit of Quantification
2.5. Precision
2.6. Interfering Substances
2.7. MPS2 Score Reproducibility
3. Results
3.1. Linear Range and Upper Limit of Quantitation
3.2. Limit of Detection and Lower Limit of Quantitation
3.3. Precision
3.4. Interfering Substances
3.5. MPS2 Score Reproducibility (Non-DRE and Post-DRE Methods)
4. Discussion
Author Contributions
Funding
Institutional Review Board Statement
Informed Consent Statement
Data Availability Statement
Conflicts of Interest
Abbreviations
| Crt | Relative cycle threshold |
| csPCa | Clinically significant prostate cancer |
| DRE | Digital rectal exam |
| LLOQ | Lower limit of quantitation |
| LOD | Limit of detection |
| MPS2 | MyProstateScore 2.0 |
| PCa | Prostate cancer |
| PSA | Prostate-specific antigen |
| qPCR | Quantitative polymerase chain reaction |
| ULOQ | Upper limit of quantitation |
| USPSTF | United States Preventive Services Task Force |
References
- Siegel, R.L.; Miller, K.D.; Fuchs, H.; Jemal, A. Cancer statistics, 2021. CA Cancer J. Clin. 2021, 71, 7–33. [Google Scholar] [CrossRef] [PubMed]
- Siegel, D.A.; O’Neil, M.E.; Richards, T.B.; Dowling, N.F.; Weir, H.K. Prostate cancer incidence and survival, by stage and race/ethnicity—United States, 2001–2017. MMWR Morb. Mortal. Wkly. Rep. 2020, 69, 1473–1480. [Google Scholar] [CrossRef] [PubMed]
- US Preventive Services Task Force; Grossman, D.C.; Curry, S.J.; Owens, D.K.; Bibbins-Domingo, K.; Caughey, A.B.; Davidson, K.W.; Doubeni, C.A.; Ebell, M.; Epling, J.W.; et al. Screening for prostate cancer: US Preventive Services Task Force recommendation statement. JAMA 2018, 319, 1901–1913. [Google Scholar] [CrossRef] [PubMed]
- Ilic, D.; Djulbegovic, M.; Jung, J.H.; Hwang, E.C.; Zhou, Q.; Cleves, A.; Agoritsas, T.; Dahm, P. Prostate cancer screening with prostate-specific antigen (PSA) test: A systematic review and meta-analysis. BMJ 2018, 362, k3519. [Google Scholar] [CrossRef] [PubMed]
- Lin, K.; Lipsitz, R.; Miller, T.; Janakiraman, S.; U.S. Preventive Services Task Force. Benefits and harms of prostate-specific antigen screening for prostate cancer: An evidence update for the U.S. Preventive Services Task Force. Ann. Intern. Med. 2008, 149, 192–199. [Google Scholar] [CrossRef] [PubMed]
- Vickers, A.J. Prostate cancer screening: Time to question how to optimize the ratio of benefits and harms. Ann. Intern. Med. 2017, 167, 509–510. [Google Scholar] [CrossRef] [PubMed]
- Tosoian, J.J.; Ross, A.E.; Sokoll, L.J.; Partin, A.W.; Pavlovich, C.P. Urinary biomarkers for prostate cancer. Urol. Clin. N. Am. 2016, 43, 17–38. [Google Scholar] [CrossRef]
- Tosoian, J.J.; Zhang, Y.; Xiao, L.; Xie, C.; Samora, N.L.; Niknafs, Y.S.; Chopra, Z.; Siddiqui, J.; Zheng, H.; Herron, G.; et al. Development and validation of an 18-gene urine test for high-grade prostate cancer. JAMA Oncol. 2024, 10, 726–736. [Google Scholar] [CrossRef] [PubMed]
- Tosoian, J.J.; Zhang, Y.; Meyers, J.I.; Heaton, S.; Siddiqui, J.; Xiao, L.; Assani, K.; Barocas, D.A.; Ross, A.E.; Chopra, E.; et al. Clinical validation of MyProstateScore 2.0 testing using first-catch, non-DRE urine. J. Urol. 2025, 10-1097. [Google Scholar] [CrossRef]
- Warf, M.; Reid, J.; Brown, K.; Kimbrell, H.; Kolquist, K.; Stone, S. Analytical validation of a cell cycle progression signature used as a prognostic marker in prostate cancer. J. Mol. Biomark. Diagn. 2015, 6, 1000239. [Google Scholar] [CrossRef]
- Sesler, C.L.; Grigorenko, E.V. Analytical validation of qPCR-based multivariate index assays in a clinical laboratory: Practical challenges and limitations. J. Appl. Lab. Med. 2018, 3, 267–281. [Google Scholar] [CrossRef] [PubMed]
- Clinical and Laboratory Standards Institute (CLSI). EP05-A3: Evaluation of Precision of Quantitative Measurement Procedures, 3rd ed.; CLSI: Wayne, PA, USA, 2014; Available online: https://clsi.org/standards/products/method-evaluation/documents/ep05/ (accessed on 2 August 2024).
- Clinical and Laboratory Standards Institute (CLSI). EP07: Interference Testing in Clinical Chemistry, 3rd ed.; CLSI: Wayne, PA, USA, 2018; Available online: https://clsi.org/standards/products/method-evaluation/documents/ep07/ (accessed on 2 August 2024).
- Clinical and Laboratory Standards Institute (CLSI). EP17-A2: Evaluation of Detection Capability for Clinical Laboratory Measurement Procedures, 2nd ed.; CLSI: Wayne, PA, USA, 2012; Available online: https://clsi.org/standards/products/method-evaluation/documents/ep17/ (accessed on 2 August 2024).
- Clinical and Laboratory Standards Institute (CLSI). EP37: Supplemental Tables for Interference Testing in Clinical Chemistry, 1st ed.; CLSI: Wayne, PA, USA, 2018; Available online: https://clsi.org/standards/products/method-evaluation/documents/ep07/ (accessed on 2 August 2024).
- Kretschmer, A.; Kajau, H.; Margolis, E.; Tutrone, R.; Grimm, T.; Trottmann, M.; Stief, C.; Stoll, G.; Fischer, C.A.; Flinspach, C.; et al. Validation of a CE-IVD, urine exosomal RNA expression assay for risk assessment of prostate cancer prior to biopsy. Sci. Rep. 2022, 12, 4777. [Google Scholar] [CrossRef] [PubMed]
- Hessels, D.; de Jong, H.; Jannink, S.A.; Carter, M.; Krispin, M.; Van Criekinge, W.; Van Neste, L.; Schalken, J.A. Analytical validation of an mRNA-based urine test to predict the presence of high-grade prostate cancer. Transl. Med. Commun. 2017, 2, 5. [Google Scholar] [CrossRef][Green Version]
- Ohashi, A.; Murata, A.; Cho, Y.; Ichinose, S.; Sakamaki, Y.; Nishio, M.; Hoshi, O.; Fischer, S.; Preissner, K.T.; Koyama, T. The expression and localization of RNase and RNase inhibitor in blood cells and vascular endothelial cells in homeostasis of the vascular system. PLoS ONE 2017, 12, e0174237. [Google Scholar] [CrossRef] [PubMed]
- Bruyninckx, R.; Buntinx, F.; Aertgeerts, B.; Van Casteren, V. The diagnostic value of macroscopic haematuria for the diagnosis of urological cancer in general practice. Br. J. Gen. Pract. 2003, 53, 31–35. [Google Scholar] [PubMed]
- Courtemanche, K.; Chan, P.; Kassouf, W. Prevalence and associated factors for dipstick microscopic hematuria in men. BMC Urol. 2019, 19, 76. [Google Scholar] [CrossRef]
- Hansen, R.S.; Biørn, S.H.; Birk-Korch, J.B.; Sheikh, S.P.; Poulsen, M.H.; Vinholt, P.J. Prevalence of prostate cancer in men with haematuria: A systematic review and meta-analysis. BJU Int. 2023, 131, 530–539. [Google Scholar] [CrossRef] [PubMed]
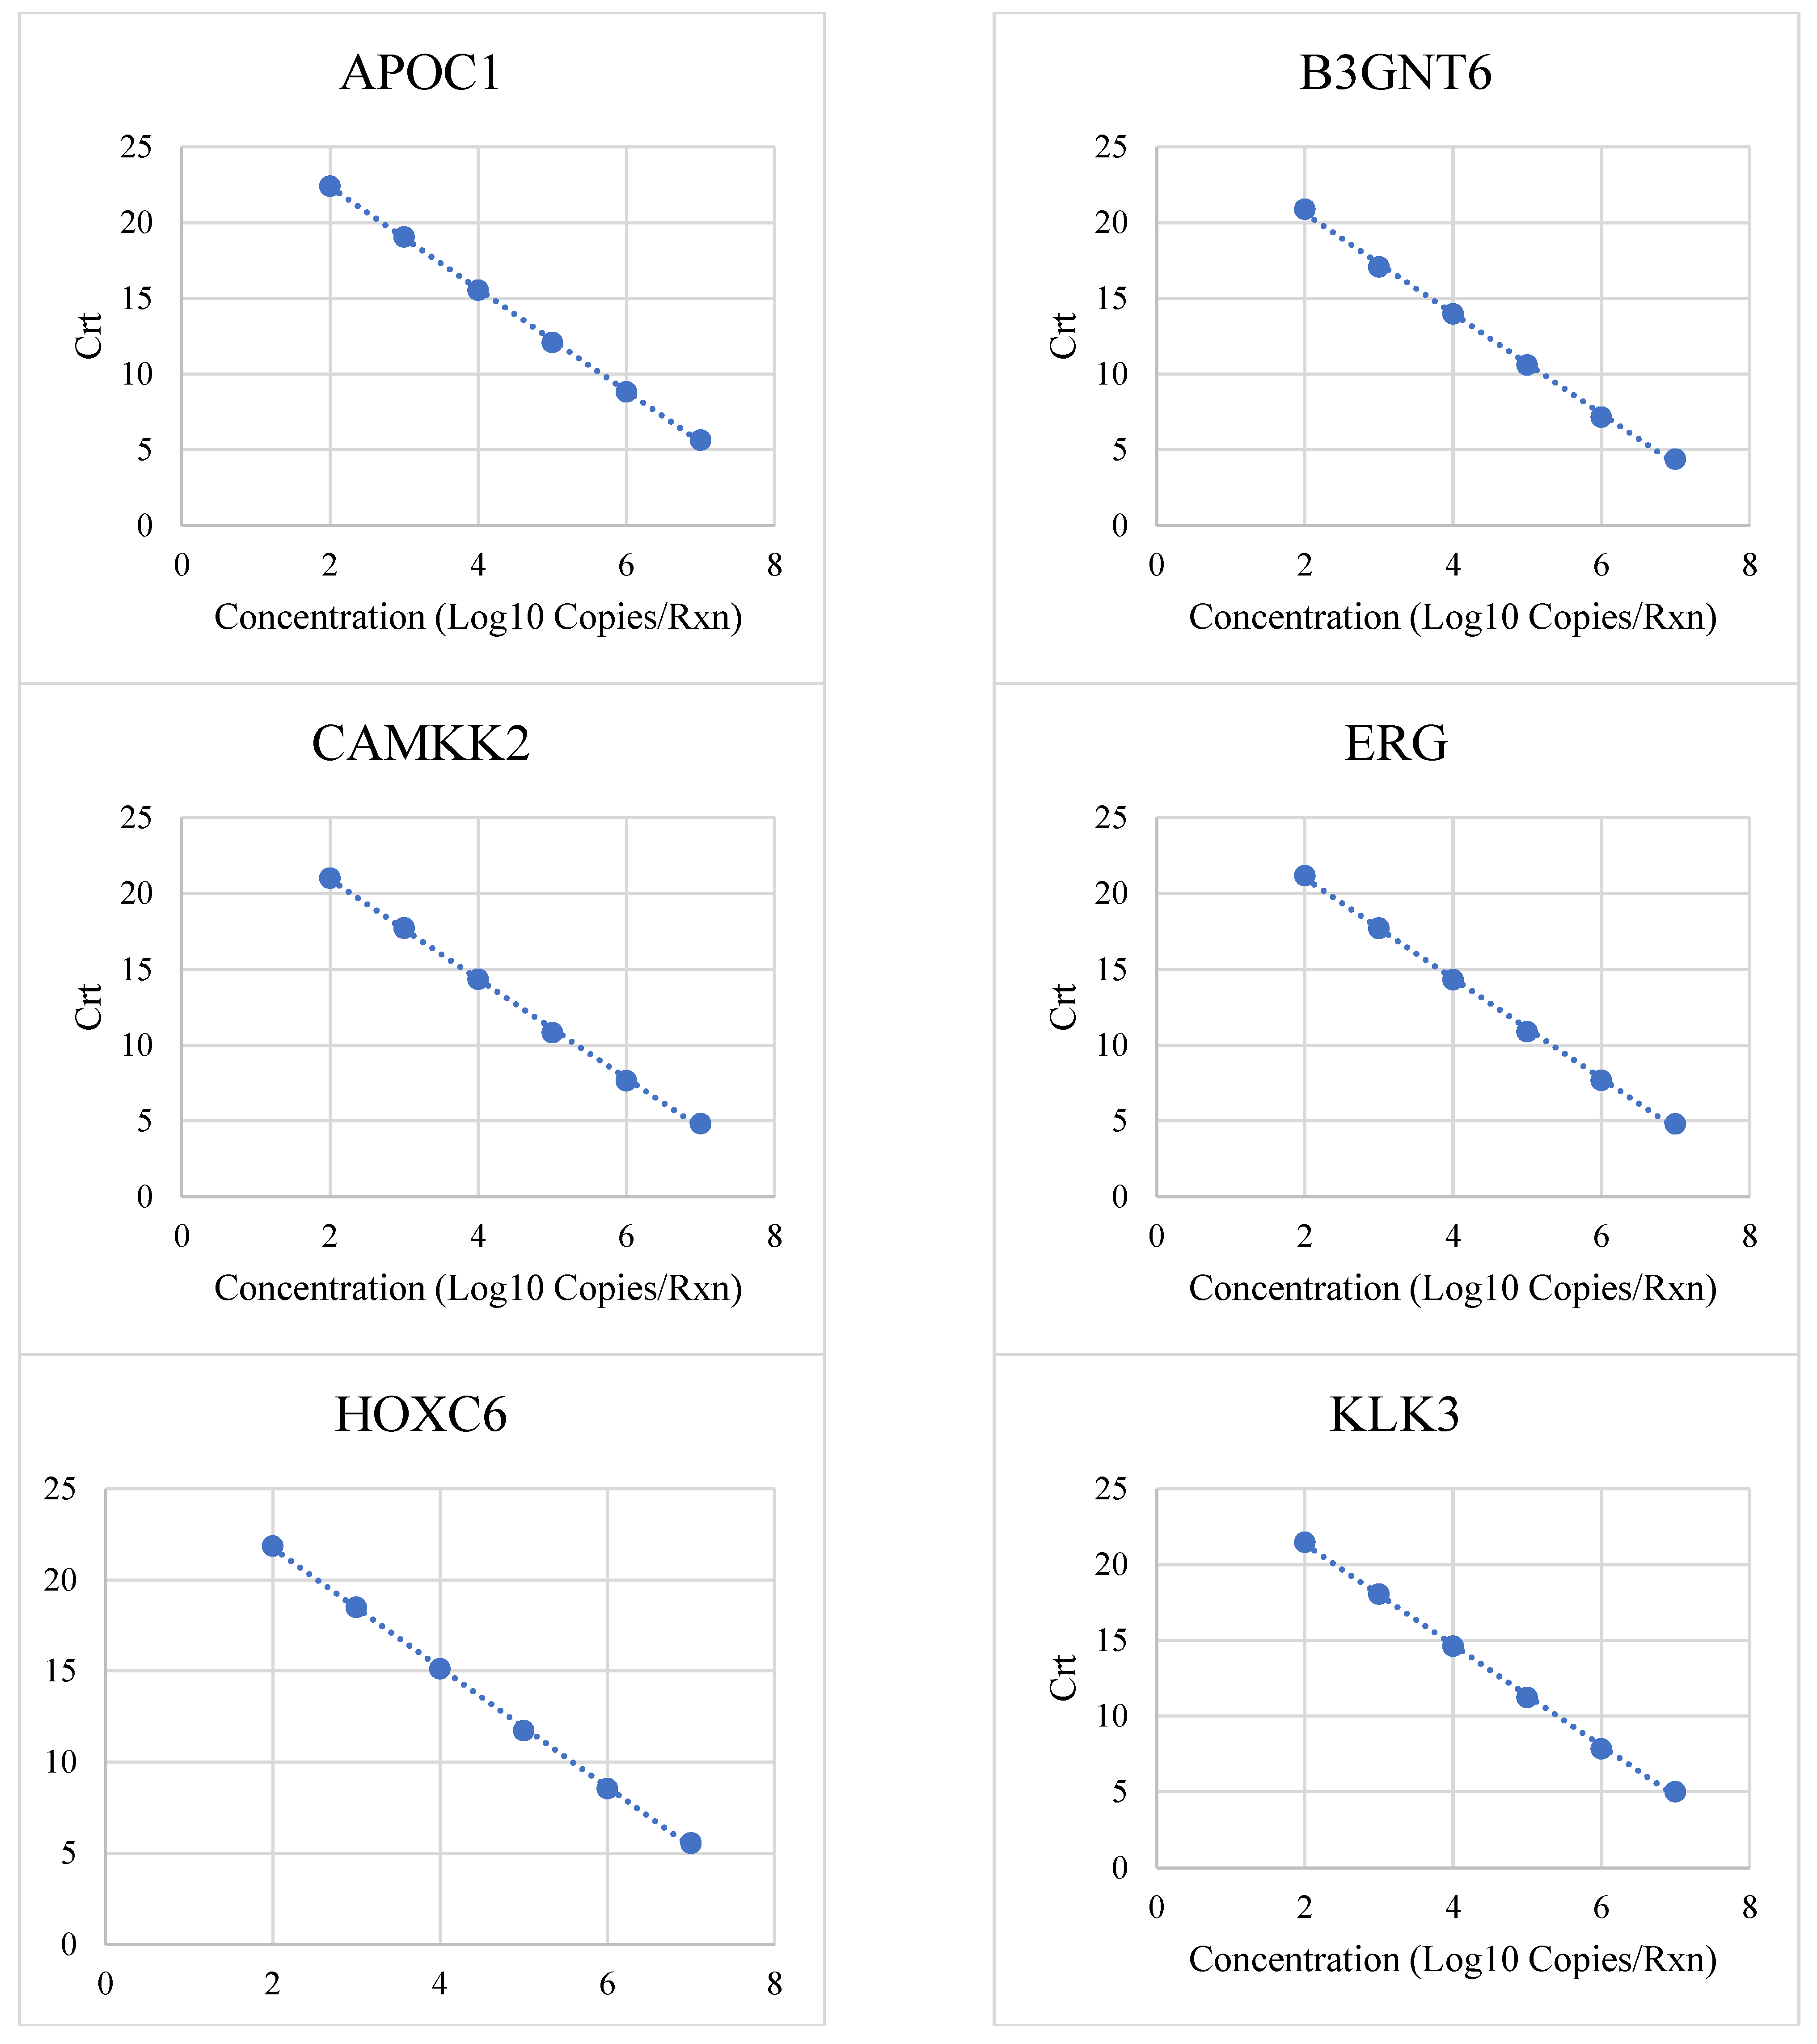
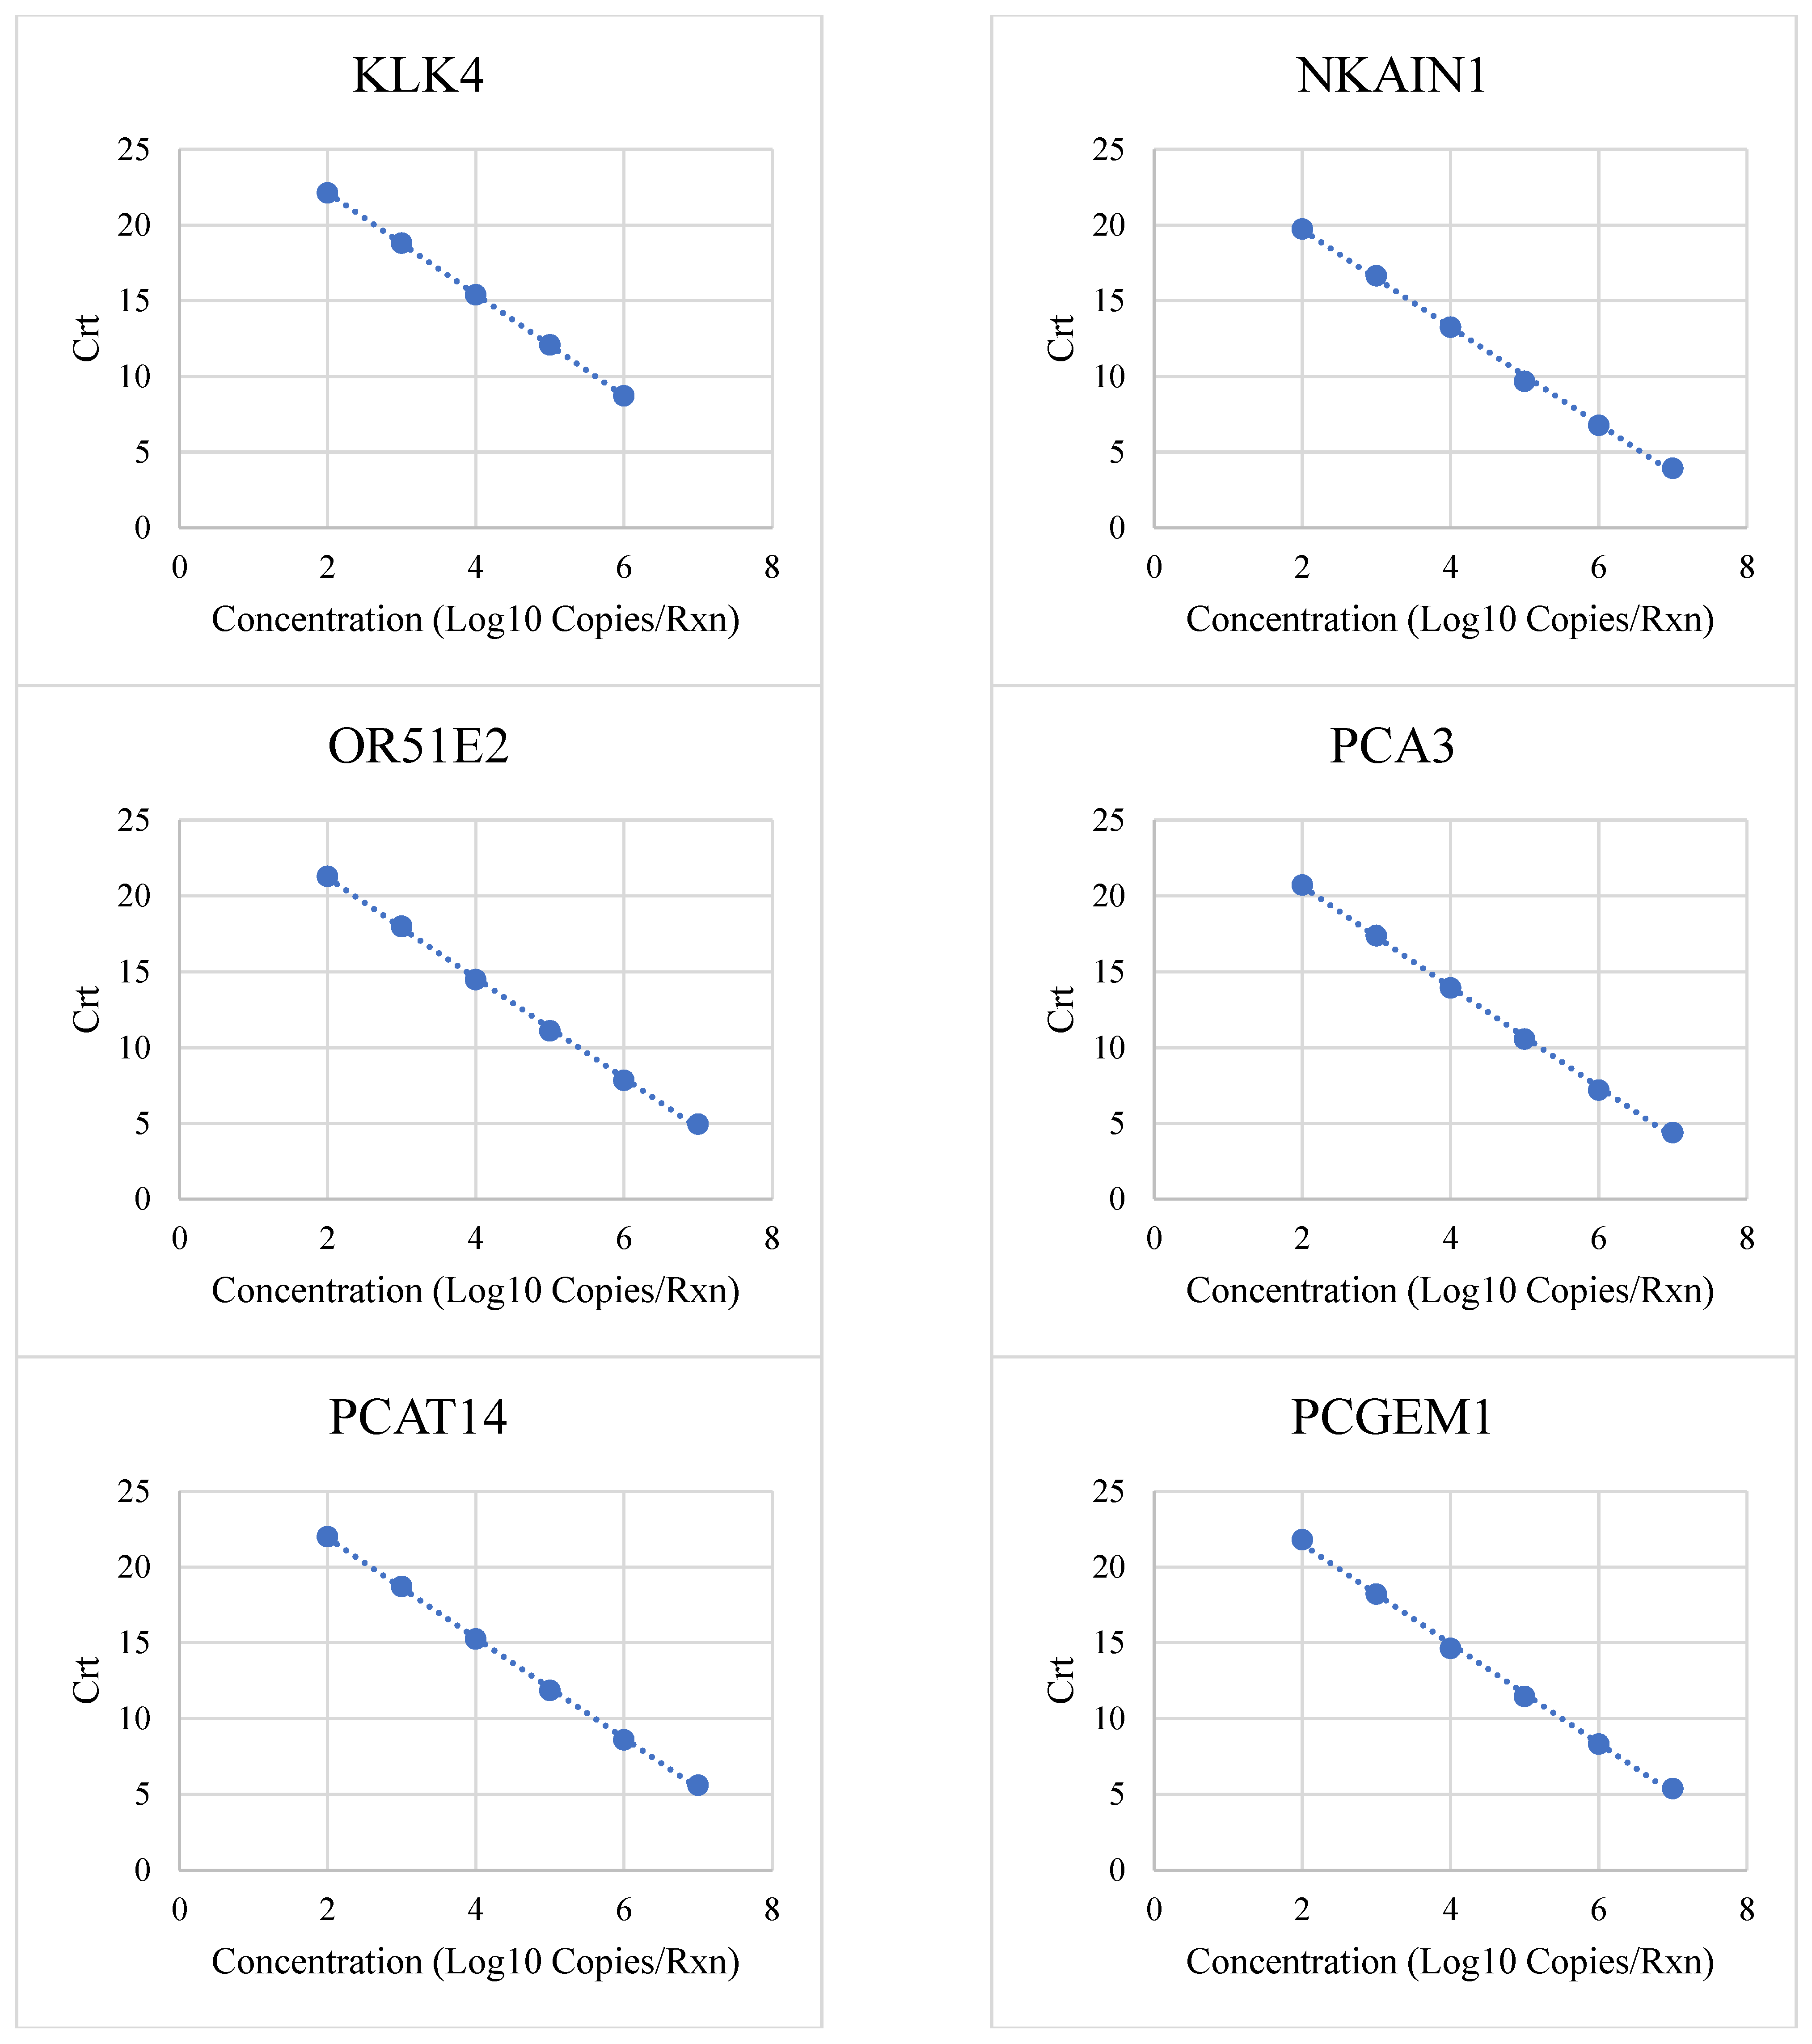
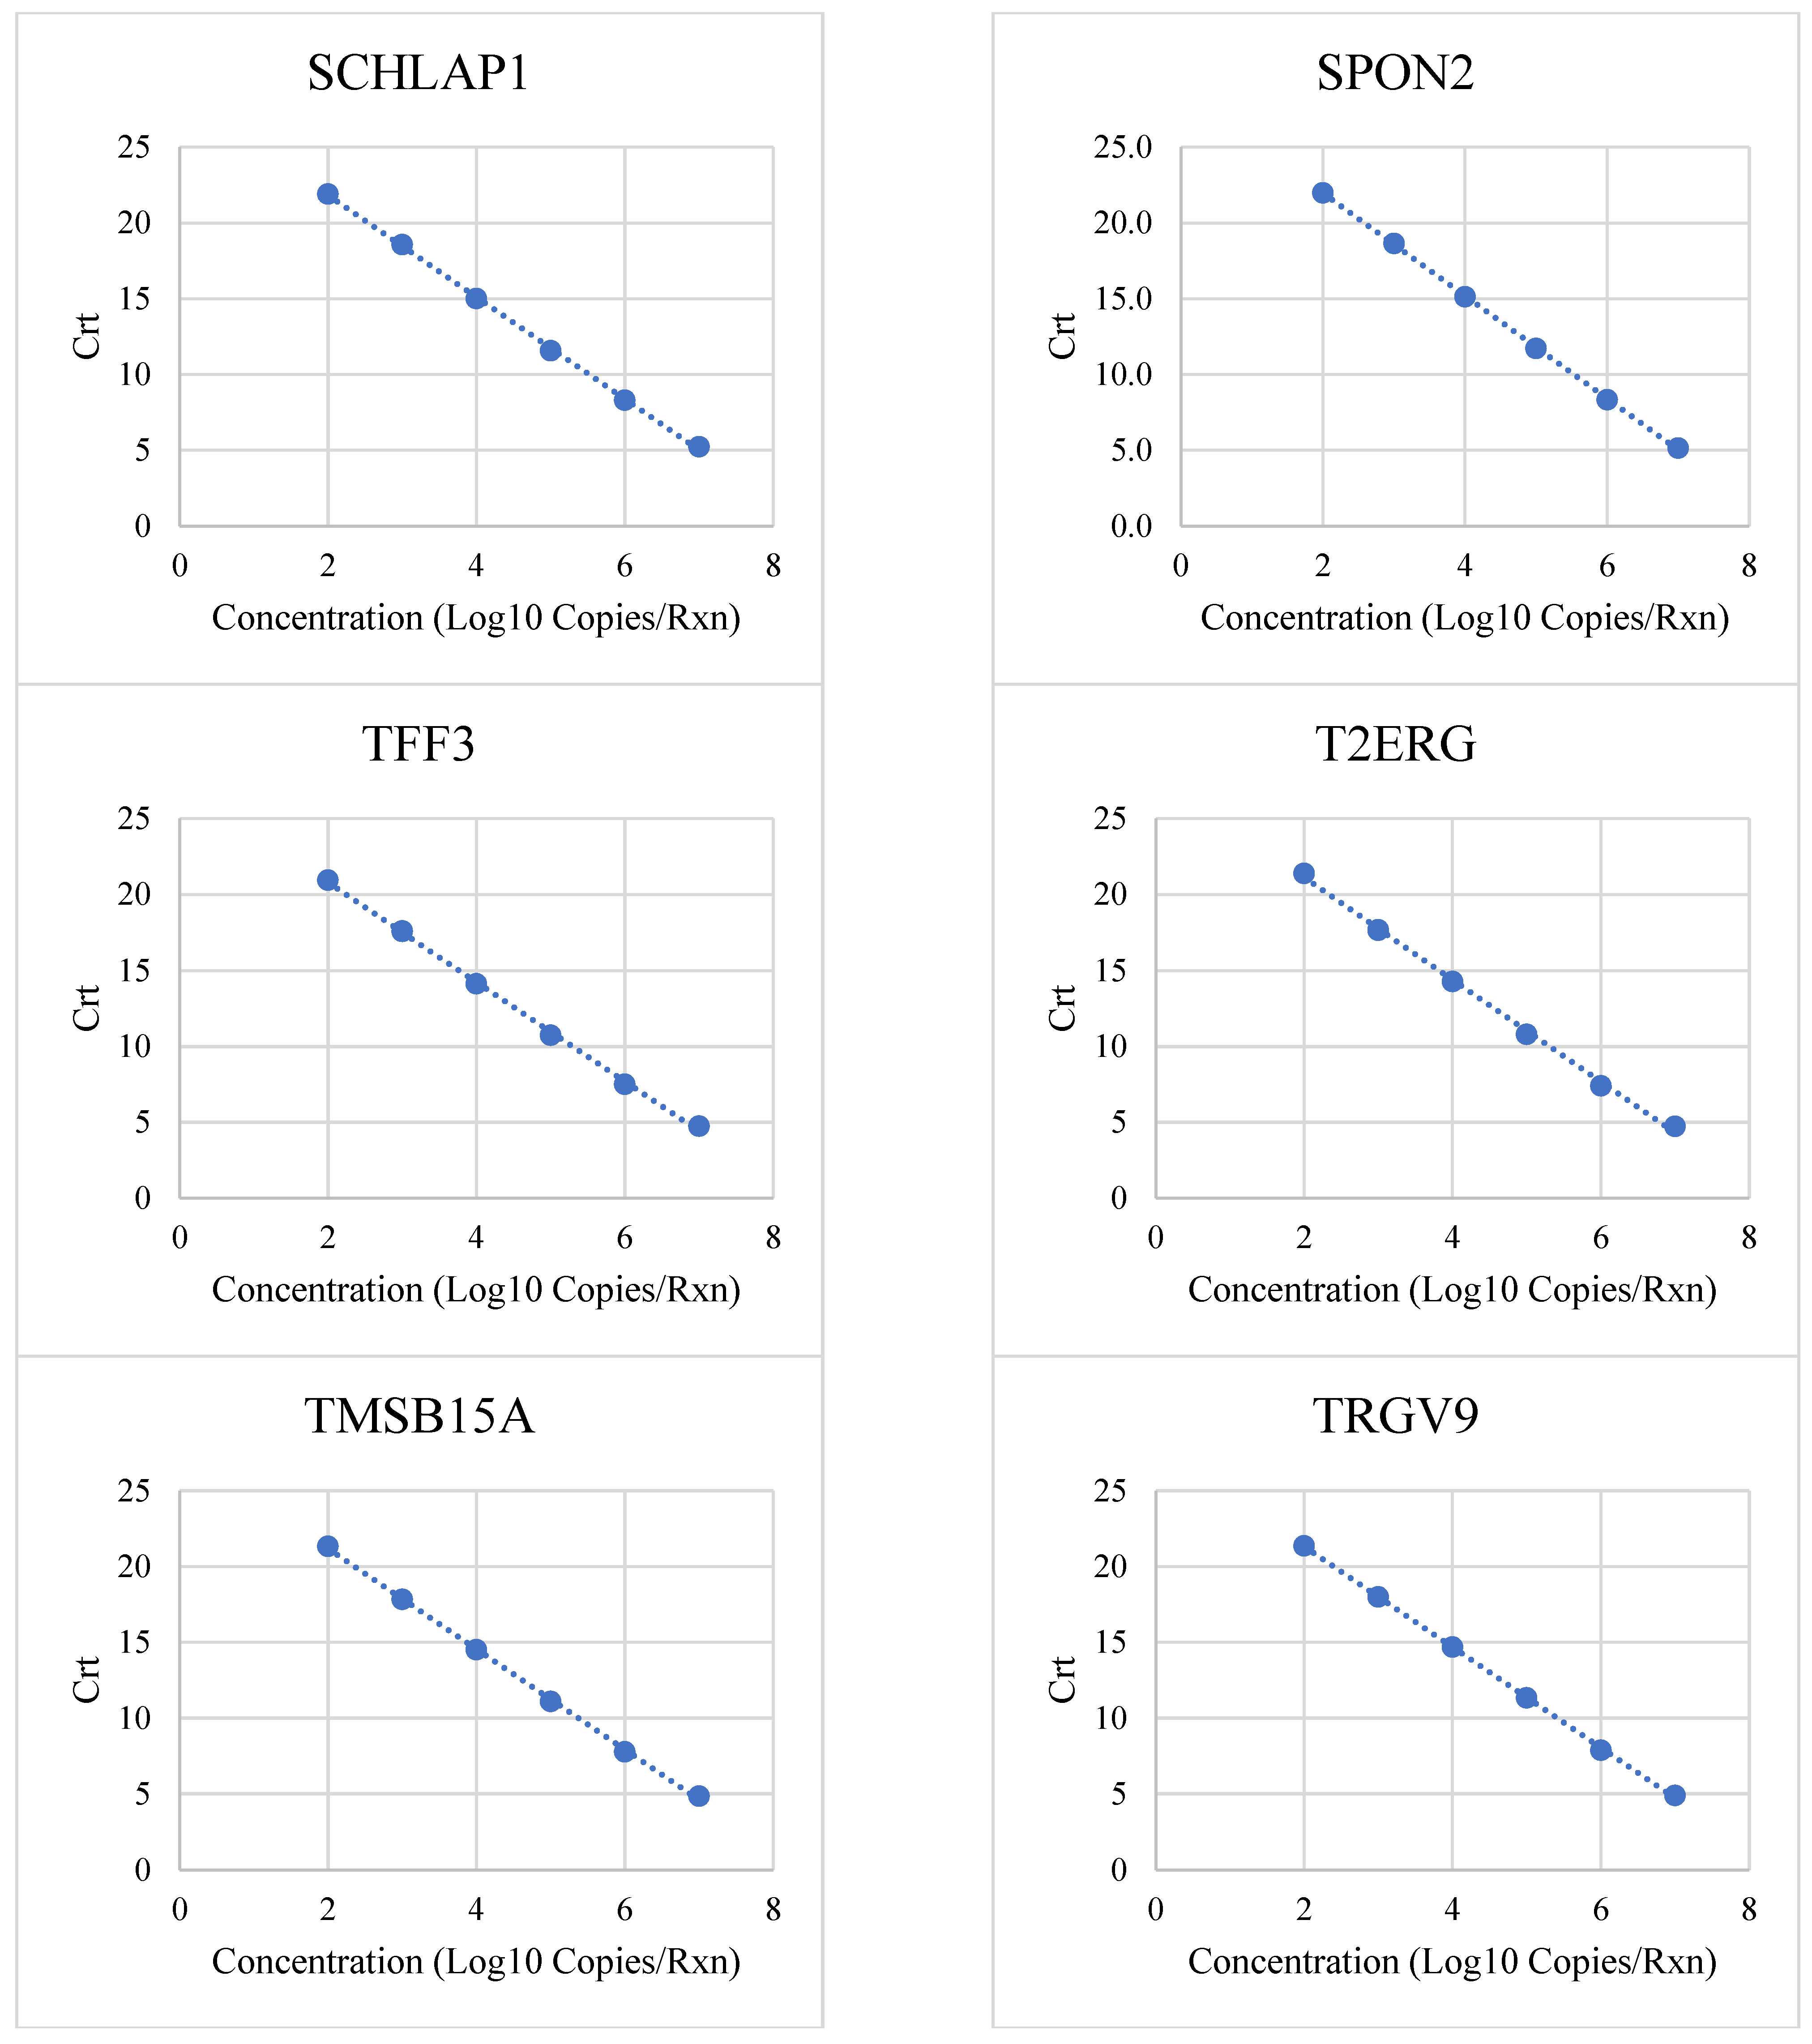
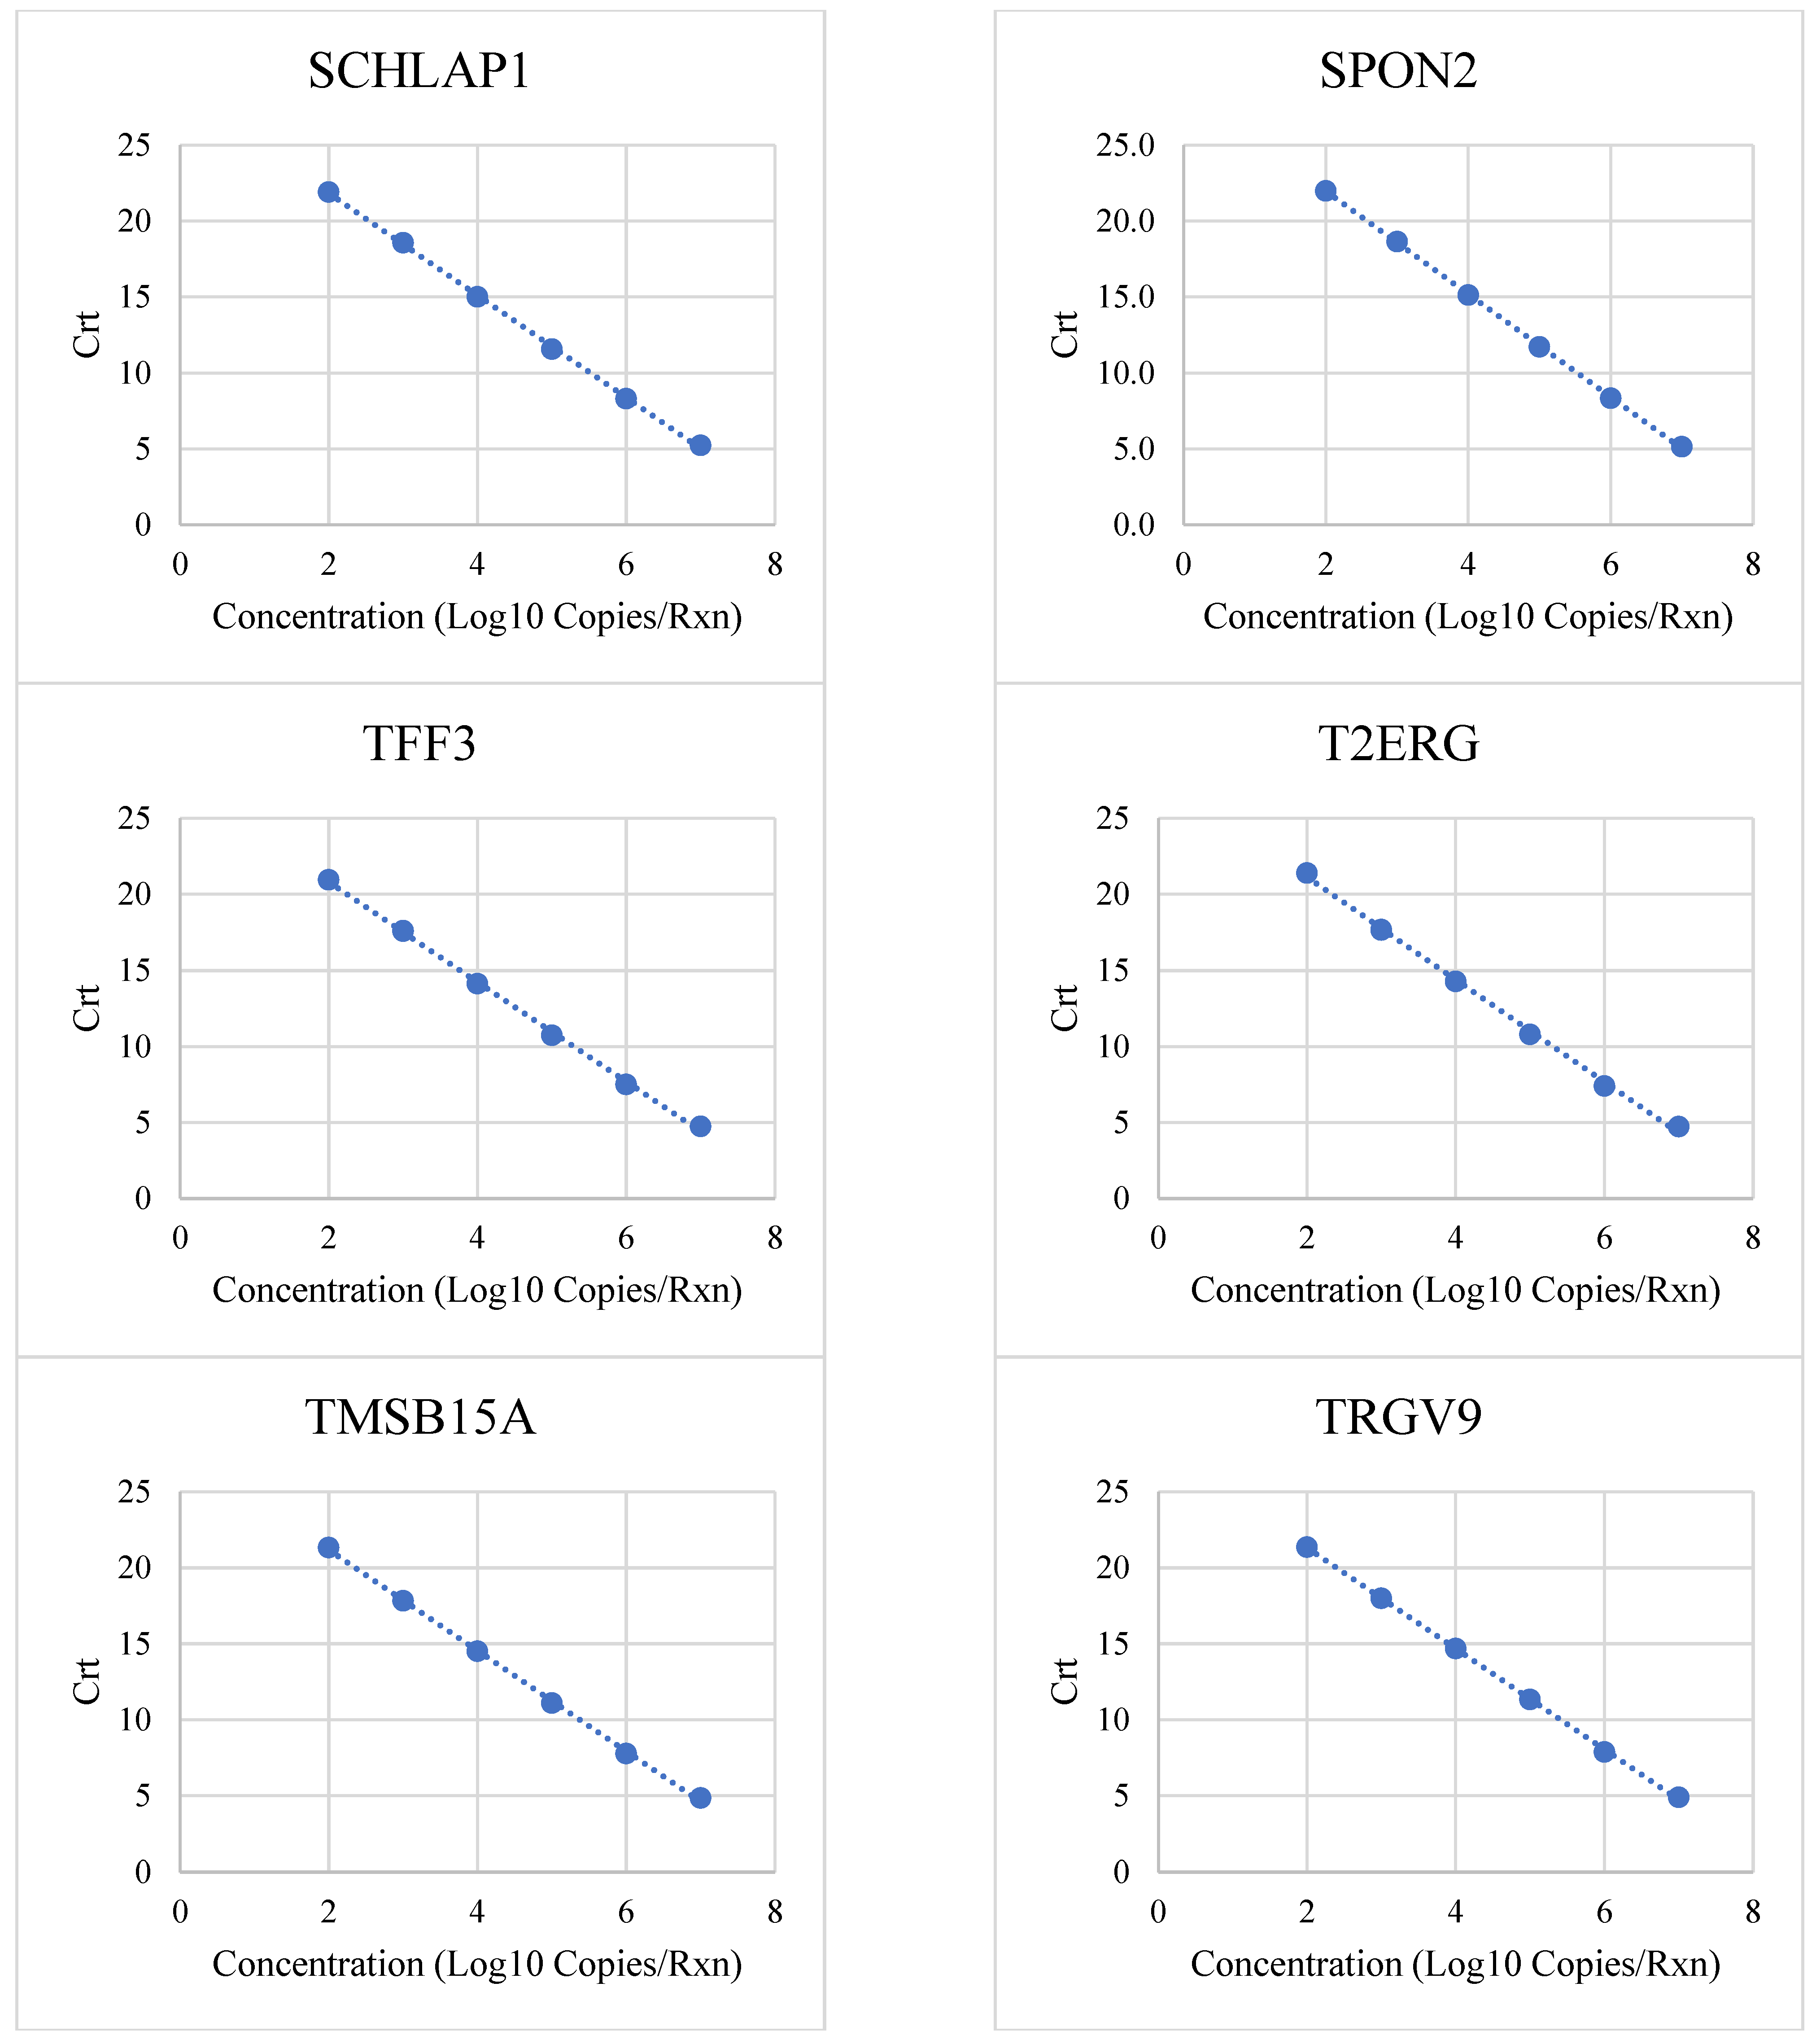
| Target | Low (Copies/Rxn) | High (Copies/Rxn) | R2 | PCR Efficiency |
|---|---|---|---|---|
| APOC1 | 100 | 10,000,000 | 0.9997 | 98% |
| B3GNT6 | 100 | 10,000,000 | 0.9986 | 101% |
| CAMKK2 | 100 | 10,000,000 | 0.999 | 102% |
| ERG | 100 | 10,000,000 | 0.999 | 101% |
| HOXC6 | 100 | 10,000,000 | 0.9994 | 102% |
| KLK3 | 100 | 10,000,000 | 0.9991 | 100% |
| KLK4 | 100 | 1,000,000 | 1 | 99% |
| NKAIN1 | 100 | 10,000,000 | 0.9985 | 105% |
| OR51E2 | 100 | 10,000,000 | 0.9992 | 101% |
| PCA3 | 100 | 10,000,000 | 0.9991 | 101% |
| PCAT14 | 100 | 10,000,000 | 0.9995 | 101% |
| PCGEM1 | 100 | 10,000,000 | 0.98 | 98% |
| SCHLAP1 | 100 | 10,000,000 | 0.9994 | 98% |
| SPON2 | 100 | 10,000,000 | 0.9998 | 97% |
| TFF3 | 100 | 10,000,000 | 0.9988 | 102% |
| T2ERG | 100 | 10,000,000 | 0.998 | 98% |
| TMSB15A | 100 | 10,000,000 | 0.9994 | 100% |
| TRGV9 | 100 | 10,000,000 | 0.9997 | 100% |
| MPS2 Analyte | LOD in Copies/Reaction (% Detection) | LLOQ in Copies/Reaction (SD) | ULOQ in Copies/Reaction (SD) |
|---|---|---|---|
| APOC1 | 80 (100%) | 160 (0.43) | 10,000,000 (0.17) |
| B3GNT6 | 80 (100%) | 160 (0.53) | 10,000,000 (0.08) |
| CAMKK2 | 40 (95%) | 160 (0.45) | 10,000,000 (0.08) |
| ERG | 80 (97%) | 80 (0.69) | 10,000,000 (0.06) |
| HOXC6 | 80 (100%) | 320 (0.43) | 10,000,000 (0.07) |
| KLK3 | 160 (100%) | 160 (0.53) | 10,000,000 (0.06) |
| KLK4 | 40 (100%) | 320 (0.40) | 1,000,000 (0.34) |
| NKAIN1 | 80 (97%) | 80 (0.59) | 10,000,000 (0.16) |
| OR51E2 | 80 (100%) | 320 (0.27) | 10,000,000 (0.13) |
| PCA3 | 80 (100%) | 320 (0.33) | 10,000,000 (0.10) |
| PCAT14 | 80 (98%) | 160 (0.45) | 10,000,000 (0.12) |
| PCGEM1 | 40 (95%) | 160 (0.46) | 10,000,000 (0.11) |
| SCHLAP1 | 160 (100%) | 160 (0.74) | 10,000,000 (0.12) |
| SPON2 | 40 (95%) | 80 (0.60) | 10,000,000 (0.06) |
| TFF3 | 40 (95%) | 160 (0.37) | 10,000,000 (0.05) |
| T2ERG | 80 (100%) | 160 (0.69) | 10,000,000 (0.04) |
| TMSB15A | 40 (95%) | 160 (0.53) | 10,000,000 (0.08) |
| TRGV9 | 40 (96%) | 160 (0.35) | 10,000,000 (0.12) |
| Target | Copies/Reaction | Overall Precision | Intra-Run (Repeatability) | Inter-Run (Reproducibility) | Inter-Instrument (QuantStudio) | Inter-Instrument (VeritiPro) | Inter-Technician |
|---|---|---|---|---|---|---|---|
| APOC1 | 3200 | 16.6 ± 0.2 | 16.6 ± 0.2 | 16.7 ± 0.2 | 16.5 ± 0.2 | 16.7 ± 0.1 | 16.7 ± 0.2 |
| 1600 | 17.8 ± 0.2 | 17.9 ± 0.1 | 17.9 ± 0.2 | 17.9 ± 0.1 | 17.8 ± 0.2 | 17.8 ± 0.2 | |
| 800 | 18.8 ± 0.3 | 18.8 ± 0.2 | 18.9 ± 0.2 | 18.8 ± 0.2 | 18.8 ± 0.3 | 18.9 ± 0.2 | |
| B3GNT6 | 3200 | 15.5 ± 0.2 | 15.3 ± 0.1 | 15.6 ± 0.2 | 15.3 ± 0.1 | 15.6 ± 0.2 | 15.5 ± 0.3 |
| 1600 | 16.7 ± 0.2 | 16.7 ± 0.1 | 16.8 ± 0.1 | 16.7 ± 0.1 | 16.7 ± 0.2 | 16.8 ± 0.1 | |
| 800 | 17.6 ± 0.3 | 17.6 ± 0.2 | 17.8 ± 0.2 | 17.5 ± 0.2 | 17.6 ± 0.3 | 17.7 ± 0.3 | |
| CAMKK2 | 3200 | 15.7 ± 0.2 | 15.5 ± 0.1 | 15.7 ± 0.2 | 15.5 ± 0.1 | 15.7 ± 0.2 | 15.7 ± 0.2 |
| 1600 | 16.8 ± 0.2 | 16.8 ± 0.1 | 16.9 ± 0.1 | 16.8 ± 0.1 | 16.9 ± 0.2 | 16.9 ± 0.1 | |
| 800 | 17.8 ± 0.2 | 17.7 ± 0.2 | 17.9 ± 0.2 | 17.7 ± 0.1 | 17.8 ± 0.2 | 17.9 ± 0.2 | |
| ERG | 3200 | 15.7 ± 0.2 | 15.6 ± 0.1 | 15.8 ± 0.2 | 15.6 ± 0.1 | 15.8 ± 0.2 | 15.7 ± 0.2 |
| 1600 | 16.9 ± 0.2 | 16.9 ± 0.1 | 17.0 ± 0.1 | 16.9 ± 0.1 | 17.0 ± 0.2 | 17.0 ± 0.1 | |
| 800 | 17.8 ± 0.3 | 17.8 ± 0.2 | 18.0 ± 0.2 | 17.8 ± 0.1 | 17.9 ± 0.3 | 18 ± 0.2 | |
| HOXC6 | 3200 | 16.3 ± 0.2 | 16.2 ± 0.2 | 16.4 ± 0.2 | 16.1 ± 0.2 | 16.4 ± 0.2 | 16.3 ± 0.2 |
| 1600 | 17.6 ± 0.2 | 17.6 ± 0.1 | 17.6 ± 0.1 | 17.6 ± 0.1 | 17.6 ± 0.2 | 17.6 ± 0.1 | |
| 800 | 18.4 ± 0.3 | 18.5 ± 0.2 | 18.6 ± 0.2 | 18.4 ± 0.2 | 18.5 ± 0.3 | 18.6 ± 0.2 | |
| KLK3 | 3200 | 16.0 ± 0.2 | 15.8 ± 0.1 | 16.1 ± 0.2 | 15.8 ± 0.1 | 16.1 ± 0.2 | 16 ± 0.2 |
| 1600 | 17.3 ± 0.2 | 17.3 ± 0.2 | 17.4 ± 0.1 | 17.3 ± 0.2 | 17.3 ± 0.2 | 17.4 ± 0.2 | |
| 800 | 18.1 ± 0.3 | 18.2 ± 0.2 | 18.3 ± 0.2 | 18.1 ± 0.2 | 18.2 ± 0.3 | 18.3 ± 0.2 | |
| KLK4 | 3200 | 16.7 ± 0.2 | 16.6 ± 0.2 | 16.7 ± 0.1 | 16.5 ± 0.2 | 16.7 ± 0.1 | 16.7 ± 0.2 |
| 1600 | 18.0 ± 0.2 | 18.0 ± 0.1 | 18.0 ± 0.1 | 18.0 ± 0.1 | 18.0 ± 0.2 | 18.0 ± 0.1 | |
| 800 | 18.9 ± 0.3 | 18.9 ± 0.3 | 19.1 ± 0.2 | 18.9 ± 0.3 | 19.0 ± 0.3 | 19.0 ± 0.3 | |
| NKAIN1 | 3200 | 14.5 ± 0.2 | 14.4 ± 0.3 | 14.4 ± 0.2 | 14.3 ± 0.2 | 14.5 ± 0.2 | 14.4 ± 0.2 |
| 1600 | 15.7 ± 0.2 | 15.8 ± 0.1 | 15.7 ± 0.1 | 15.8 ± 0.1 | 15.7 ± 0.2 | 15.7 ± 0.1 | |
| 800 | 16.5 ± 0.3 | 16.6 ± 0.2 | 16.7 ± 0.2 | 16.6 ± 0.2 | 16.5 ± 0.3 | 16.6 ± 0.2 | |
| OR51E2 | 3200 | 15.7 ± 0.1 | 15.6 ± 0.1 | 15.7 ± 0.1 | 15.6 ± 0.1 | 15.7 ± 0.1 | 15.7 ± 0.1 |
| 1600 | 16.9 ± 0.1 | 17.0 ± 0.1 | 17.0 ± 0.1 | 17.0 ± 0.1 | 17.0 ± 0.1 | 17.0 ± 0.1 | |
| 800 | 17.8 ± 0.2 | 17.9 ± 0.2 | 18.0 ± 0.2 | 17.8 ± 0.2 | 17.9 ± 0.2 | 17.9 ± 0.2 | |
| PCA3 | 3200 | 15.5 ± 0.2 | 15.3 ± 0.2 | 15.6 ± 0.2 | 15.3 ± 0.2 | 15.5 ± 0.2 | 15.5 ± 0.2 |
| 1600 | 16.7 ± 0.2 | 16.7 ± 0.1 | 16.8 ± 0.1 | 16.7 ± 0.1 | 16.7 ± 0.2 | 16.8 ± 0.1 | |
| 800 | 17.7 ± 0.3 | 17.7 ± 0.2 | 17.9 ± 0.2 | 17.7 ± 0.2 | 17.7 ± 0.3 | 17.8 ± 0.2 | |
| PCAT14 | 3200 | 16.6 ± 0.2 | 16.4 ± 0.1 | 16.6 ± 0.2 | 16.5 ± 0.1 | 16.6 ± 0.2 | 16.6 ± 0.2 |
| 1600 | 17.8 ± 0.2 | 17.8 ± 0.1 | 17.8 ± 0.1 | 17.8 ± 0.1 | 17.8 ± 0.2 | 17.8 ± 0.1 | |
| 800 | 18.7 ± 0.2 | 18.6 ± 0.2 | 18.8 ± 0.2 | 18.6 ± 0.2 | 18.7 ± 0.2 | 18.8 ± 0.2 | |
| PCGEM1 | 3200 | 16.4 ± 0.2 | 16.2 ± 0.1 | 16.5 ± 0.2 | 16.2 ± 0.1 | 16.4 ± 0.2 | 16.4 ± 0.2 |
| 1600 | 17.6 ± 0.2 | 17.7 ± 0.1 | 17.7 ± 0.1 | 17.7 ± 0.1 | 17.6 ± 0.2 | 17.7 ± 0.1 | |
| 800 | 18.5 ± 0.3 | 18.5 ± 0.2 | 18.7 ± 0.2 | 18.5 ± 0.2 | 18.6 ± 0.3 | 18.7 ± 0.3 | |
| SCHLAP1 | 3200 | 16.3 ± 0.2 | 16.2 ± 0.1 | 16.4 ± 0.2 | 16.2 ± 0.1 | 16.4 ± 0.2 | 16.3 ± 0.2 |
| 1600 | 17.6 ± 0.2 | 17.6 ± 0.1 | 17.7 ± 0.1 | 17.6 ± 0.1 | 17.6 ± 0.2 | 17.6 ± 0.1 | |
| 800 | 18.4 ± 0.3 | 18.4 ± 0.2 | 18.6 ± 0.2 | 18.4 ± 0.2 | 18.5 ± 0.3 | 18.5 ± 0.2 | |
| SPON2 | 3200 | 16.6 ± 0.2 | 16.4 ± 0.1 | 16.6 ± 0.2 | 16.4 ± 0.2 | 16.6 ± 0.2 | 16.6 ± 0.2 |
| 1600 | 17.8 ± 0.2 | 17.9 ± 0.1 | 17.9 ± 0.2 | 17.8 ± 0.1 | 17.9 ± 0.2 | 17.9 ± 0.2 | |
| 800 | 18.8 ± 0.3 | 18.8 ± 0.2 | 19.0 ± 0.2 | 18.8 ± 0.2 | 18.9 ± 0.3 | 19.0 ± 0.3 | |
| TFF3 | 3200 | 15.6 ± 0.1 | 15.5 ± 0.1 | 15.6 ± 0.2 | 15.5 ± 0.1 | 15.6 ± 0.2 | 15.6 ± 0.2 |
| 1600 | 16.8 ± 0.2 | 16.8 ± 0.1 | 16.8 ± 0.1 | 16.8 ± 0.1 | 16.8 ± 0.2 | 16.9 ± 0.1 | |
| 800 | 17.7 ± 0.2 | 17.7 ± 0.2 | 17.8 ± 0.2 | 17.6 ± 0.2 | 17.7 ± 0.2 | 17.8 ± 0.2 | |
| T2ERG | 3200 | 15.4 ± 0.2 | 15.1 ± 0.2 | 15.4 ± 0.3 | 15.2 ± 0.2 | 15.4 ± 0.2 | 15.4 ± 0.3 |
| 1600 | 16.6 ± 0.2 | 16.6 ± 0.2 | 16.7 ± 0.1 | 16.6 ± 0.1 | 16.6 ± 0.2 | 16.7 ± 0.2 | |
| 800 | 17.5 ± 0.3 | 17.4 ± 0.2 | 17.7 ± 0.2 | 17.4 ± 0.2 | 17.6 ± 0.3 | 17.6 ± 0.3 | |
| TMSB15A | 3200 | 15.8 ± 0.2 | 15.7 ± 0.1 | 15.9 ± 0.2 | 15.7 ± 0.1 | 15.9 ± 0.2 | 15.8 ± 0.2 |
| 1600 | 17.1 ± 0.2 | 17.1 ± 0.1 | 17.2 ± 0.1 | 17.1 ± 0.1 | 17.1 ± 0.2 | 17.2 ± 0.2 | |
| 800 | 17.9 ± 0.3 | 17.9 ± 0.2 | 18.1 ± 0.2 | 17.9 ± 0.2 | 18.0 ± 0.3 | 18.0 ± 0.3 | |
| TRGV9 | 3200 | 16.0 ± 0.2 | 15.9 ± 0.1 | 16.1 ± 0.2 | 15.9 ± 0.1 | 16.1 ± 0.2 | 16.0 ± 0.2 |
| 1600 | 17.3 ± 0.2 | 17.3 ± 0.2 | 17.4 ± 0.2 | 17.3 ± 0.2 | 17.3 ± 0.2 | 17.4 ± 0.2 | |
| 800 | 18.2 ± 0.3 | 18.1 ± 0.3 | 18.4 ± 0.3 | 18.1 ± 0.2 | 18.2 ± 0.3 | 18.3 ± 0.3 |
| Substance | Concentration | APOC1 | B3GNT6 | CAMKK2 | ERG | HOXC6 | KLK3 | KLK4 | NKAIN1 | OR51E2 | PCA3 | PCAT14 | PCGEM1 | SCHLAP1 | SPON2 | TFF3 | T2ERG | TMSB15A | TRGV9 |
|---|---|---|---|---|---|---|---|---|---|---|---|---|---|---|---|---|---|---|---|
| Whole Blood | 0.05% | 0.0 | 3.1 | −0.3 | −2.7 | 1.5 | 0.0 | 0.4 | −0.6 | 1.4 | 3.6 | 0.7 | −1.1 | −4.4 | 5.1 | 1.8 | 0.2 | 3.1 | 0.8 |
| Alcohol (100% ethanol) | 2.5% | 0.2 | 0.0 | 0.1 | −0.2 | 0.0 | 0.0 | 0.1 | 0.2 | 0.2 | 0.0 | 0.0 | 0.1 | −0.3 | 0.0 | −0.1 | −0.2 | −0.3 | −0.2 |
| Triglycerides | 15,000 mg/L | 0.4 | 0.0 | 0.1 | 0.2 | 0.1 | 0.0 | 0.2 | 0.3 | 0.2 | 0.1 | 0.0 | 0.2 | 0.1 | 0.0 | −0.1 | −0.1 | −0.1 | 0.1 |
| Hemoglobin | 2000 mg/L | 0.0 | 0.3 | 0.0 | 0.0 | −0.1 | 0.0 | 0.2 | −0.1 | 0.1 | 0.1 | 0.0 | 0.0 | 0.1 | −0.1 | −0.2 | 0.1 | −0.1 | 0.0 |
| Calcium (CaCl) | 800 mg/L | 0.0 | 0.3 | 0.3 | 0.1 | −0.1 | 0.0 | 0.2 | 0.2 | 0.0 | 0.1 | 0.0 | 0.0 | 0.1 | −0.1 | −0.1 | 0.1 | −0.1 | 0.1 |
| Cholesterol | 700 mg/L | 0.2 | 0.3 | 0.2 | 0.1 | −0.1 | 0.0 | 0.2 | 0.2 | 0.0 | 0.1 | 0.0 | 0.2 | 0.0 | −0.1 | −0.1 | 0.0 | −0.2 | −0.1 |
| Glucose | 400 mg/L | −0.2 | 0.1 | 0.0 | 0.0 | −0.2 | 0.0 | 0.0 | −0.1 | 0.0 | 0.0 | −0.2 | 0.0 | −0.3 | −0.3 | −0.3 | −0.2 | −0.3 | −0.1 |
| Sodium (NaCl) | 8000 mg/L | −0.1 | 0.2 | 0.1 | 0.1 | −0.1 | 0.0 | 0.1 | 0.0 | 0.0 | 0.1 | −0.1 | −0.1 | −0.1 | −0.1 | −0.2 | 0.1 | −0.2 | 0.0 |
| Albumin | 400 mg/L | −0.5 | −0.2 | 0.0 | −0.5 | −0.3 | 0.0 | −0.4 | −0.2 | 0.0 | 0.2 | 0.0 | −0.1 | −0.1 | −0.4 | 0.2 | −0.4 | −0.2 | −0.4 |
| Microorganisms | 257 cfu/mL | 0.0 | 0.2 | 0.1 | 0.0 | −0.2 | 0.0 | −0.1 | 0.0 | 0.0 | 0.1 | −0.1 | 0.1 | 0.2 | −0.1 | 0.0 | 0.0 | −0.1 | −0.1 |
| Free Bilirubin | 60 mg/L | 0.2 | 0.0 | 0.1 | 0.1 | 0.1 | 0.0 | 0.2 | 0.0 | 0.1 | −0.1 | 0.0 | −0.2 | 0.1 | 0.1 | −0.2 | 0.3 | 0.2 | 0.1 |
| Total Proteins | 1 mg/L | 0.1 | 0.1 | 0.1 | 0.0 | 0.1 | 0.0 | 0.1 | 0.1 | −0.1 | −0.1 | 0.0 | 0.0 | 0.2 | 0.1 | 0.0 | 0.2 | 0.2 | 0.0 |
| Substance | Concentration | APOC1 | B3GNT6 | CAMKK2 | ERG | HOXC6 | KLK3 | KLK4 | NKAIN1 | OR51E2 | PCA3 | PCAT14 | PCGEM1 | SCHLAP1 | SPON2 | TFF3 | T2ERG | TMSB15A | TRGV9 |
|---|---|---|---|---|---|---|---|---|---|---|---|---|---|---|---|---|---|---|---|
| Whole Blood | 0.05% | 1.0 | 0.4 | 1.8 | −1.0 | 1.0 | 0.0 | 0.5 | 0.2 | 1.4 | 2.7 | 0.7 | 0.3 | −0.6 | 8.5 | 3.1 | 1.1 | 0.9 | 4.2 |
| Alcohol (100% ethanol) | 2.5% | −0.1 | −0.5 | −0.1 | −0.1 | 0.1 | 0.0 | 0.0 | −0.3 | −0.3 | −0.2 | −0.2 | −0.2 | −0.1 | −0.2 | −0.3 | 0.1 | 0.0 | 0.0 |
| Triglycerides | 15,000 mg/L | −0.1 | −0.3 | −0.1 | −0.1 | −0.1 | 0.0 | −0.4 | 0.0 | −0.1 | 0.0 | 0.1 | 0.0 | −0.1 | 0.0 | −0.1 | 0.0 | 0.1 | 0.1 |
| Hemoglobin | 2000 mg/L | −0.1 | −0.1 | −0.1 | −0.1 | 0.0 | 0.0 | −0.1 | 0.1 | 0.0 | 0.0 | 0.2 | −0.1 | 0.0 | −0.1 | −0.2 | 0.3 | 0.3 | 0.1 |
| Calcium (CaCl) | 800 mg/L | −0.1 | −0.3 | −0.2 | 0.0 | −0.1 | 0.0 | −0.2 | 0.2 | 0.0 | −0.1 | 0.1 | 0.0 | 0.2 | −0.1 | −0.1 | 0.1 | 0.3 | 0.1 |
| Cholesterol | 700 mg/L | −0.4 | −0.4 | −0.2 | −0.1 | 0.0 | 0.0 | −0.3 | −0.1 | −0.4 | 0.0 | 0.0 | −0.2 | −0.2 | −0.1 | −0.1 | 0.1 | 0.0 | 0.0 |
| Glucose | 400 mg/L | −0.2 | −0.3 | −0.1 | −0.1 | 0.0 | 0.0 | −0.1 | −0.1 | −0.2 | 0.0 | 0.0 | −0.1 | −0.3 | 0.2 | 0.0 | 0.1 | −0.1 | 0.1 |
| Sodium (NaCl) | 8000 mg/L | −0.2 | −0.2 | 0.0 | 0.2 | 0.2 | 0.0 | 0.0 | 0.0 | 0.0 | 0.2 | 0.3 | 0.0 | 0.2 | 0.1 | 0.0 | −0.3 | 0.2 | 0.3 |
| Albumin | 400 mg/L | −0.3 | −0.1 | 0.2 | −0.1 | −0.1 | 0.0 | −0.1 | 0.1 | 0.3 | 0.3 | 0.3 | 0.1 | −0.3 | 0.1 | 0.3 | 0.4 | 0.2 | 0.2 |
| Microorganisms | 257 cfu/mL | −0.1 | −0.1 | 0.0 | 0.1 | 0.0 | 0.0 | −0.1 | 0.1 | 0.1 | 0.0 | 0.1 | 0.0 | −0.1 | 0.0 | −0.1 | −0.2 | 0.0 | 0.3 |
| Free Bilirubin | 60 mg/L | −0.1 | −0.3 | −0.1 | −0.1 | 0.1 | 0.0 | −0.2 | −0.2 | −0.1 | −0.1 | 0.0 | −0.1 | −0.1 | 0.0 | −0.1 | 0.2 | 0.2 | 0.4 |
| Total Proteins | 1 mg/L | −0.3 | −0.2 | −0.2 | −0.1 | −0.1 | 0.0 | −0.1 | −0.1 | −0.3 | −0.1 | 0.0 | 0.0 | −0.1 | 0.0 | −0.1 | 0.1 | 0.1 | −0.1 |
| RNA Extraction Method | Pool | MPS2 Score (Mean ± SD) |
|---|---|---|
| non-DRE Urine | 1 | 40% ± 4% |
| 2 | 82% ± 2% | |
| 3 | 9% ± 1% | |
| 4 | 7% ± 3% | |
| 5 | 38% ± 5% | |
| 6 | 79% ± 4% | |
| 7 | 3% ± 2% | |
| 8 | 63% ± 4% | |
| 9 | 4% ± 2% | |
| 10 | 28% ± 4% | |
| post-DRE Urine | 1 | 5% ± 1% |
| 2 | 48% ± 7% | |
| 3 | 61% ± 4% | |
| 4 | 73% ± 3% | |
| 5 | 23% ± 5% | |
| 6 | 11% ± 3% | |
| 7 | 19% ± 4% | |
| 8 | 7% ± 2% | |
| 9 | 26% ± 6% | |
| 10 | 7% ± 2% |
Disclaimer/Publisher’s Note: The statements, opinions and data contained in all publications are solely those of the individual author(s) and contributor(s) and not of MDPI and/or the editor(s). MDPI and/or the editor(s) disclaim responsibility for any injury to people or property resulting from any ideas, methods, instructions or products referred to in the content. |
© 2025 by the authors. Licensee MDPI, Basel, Switzerland. This article is an open access article distributed under the terms and conditions of the Creative Commons Attribution (CC BY) license (https://creativecommons.org/licenses/by/4.0/).
Share and Cite
Meyers, J.I.; Schatz, T.M.; Seitz, C.J.; Botbyl, R.; Moore, B.S.; Crafts, B.G.; Kitchen, J.R.; Heaton, S. Analytical Validation of MyProstateScore 2.0. Diagnostics 2025, 15, 923. https://doi.org/10.3390/diagnostics15070923
Meyers JI, Schatz TM, Seitz CJ, Botbyl R, Moore BS, Crafts BG, Kitchen JR, Heaton S. Analytical Validation of MyProstateScore 2.0. Diagnostics. 2025; 15(7):923. https://doi.org/10.3390/diagnostics15070923
Chicago/Turabian StyleMeyers, Jacob I., Tabea M. Schatz, Cameron J. Seitz, Rachel Botbyl, Bradley S. Moore, Bill G. Crafts, John R. Kitchen, and Spencer Heaton. 2025. "Analytical Validation of MyProstateScore 2.0" Diagnostics 15, no. 7: 923. https://doi.org/10.3390/diagnostics15070923
APA StyleMeyers, J. I., Schatz, T. M., Seitz, C. J., Botbyl, R., Moore, B. S., Crafts, B. G., Kitchen, J. R., & Heaton, S. (2025). Analytical Validation of MyProstateScore 2.0. Diagnostics, 15(7), 923. https://doi.org/10.3390/diagnostics15070923


