


Automatic Analysis of Ultrasound Images to Estimate Subcutaneous and Visceral Fat and Muscle Tissue in Patients with Suspected Malnutrition

 , , ,
, , ,  ,
,  and
and
Abstract
1. Introduction
2. Materials and Methods
2.1. Data
Image Acquisition Procedure
2.2. Data Analysis and Processing
2.2.1. Image Segmentation
2.2.2. Image Correction
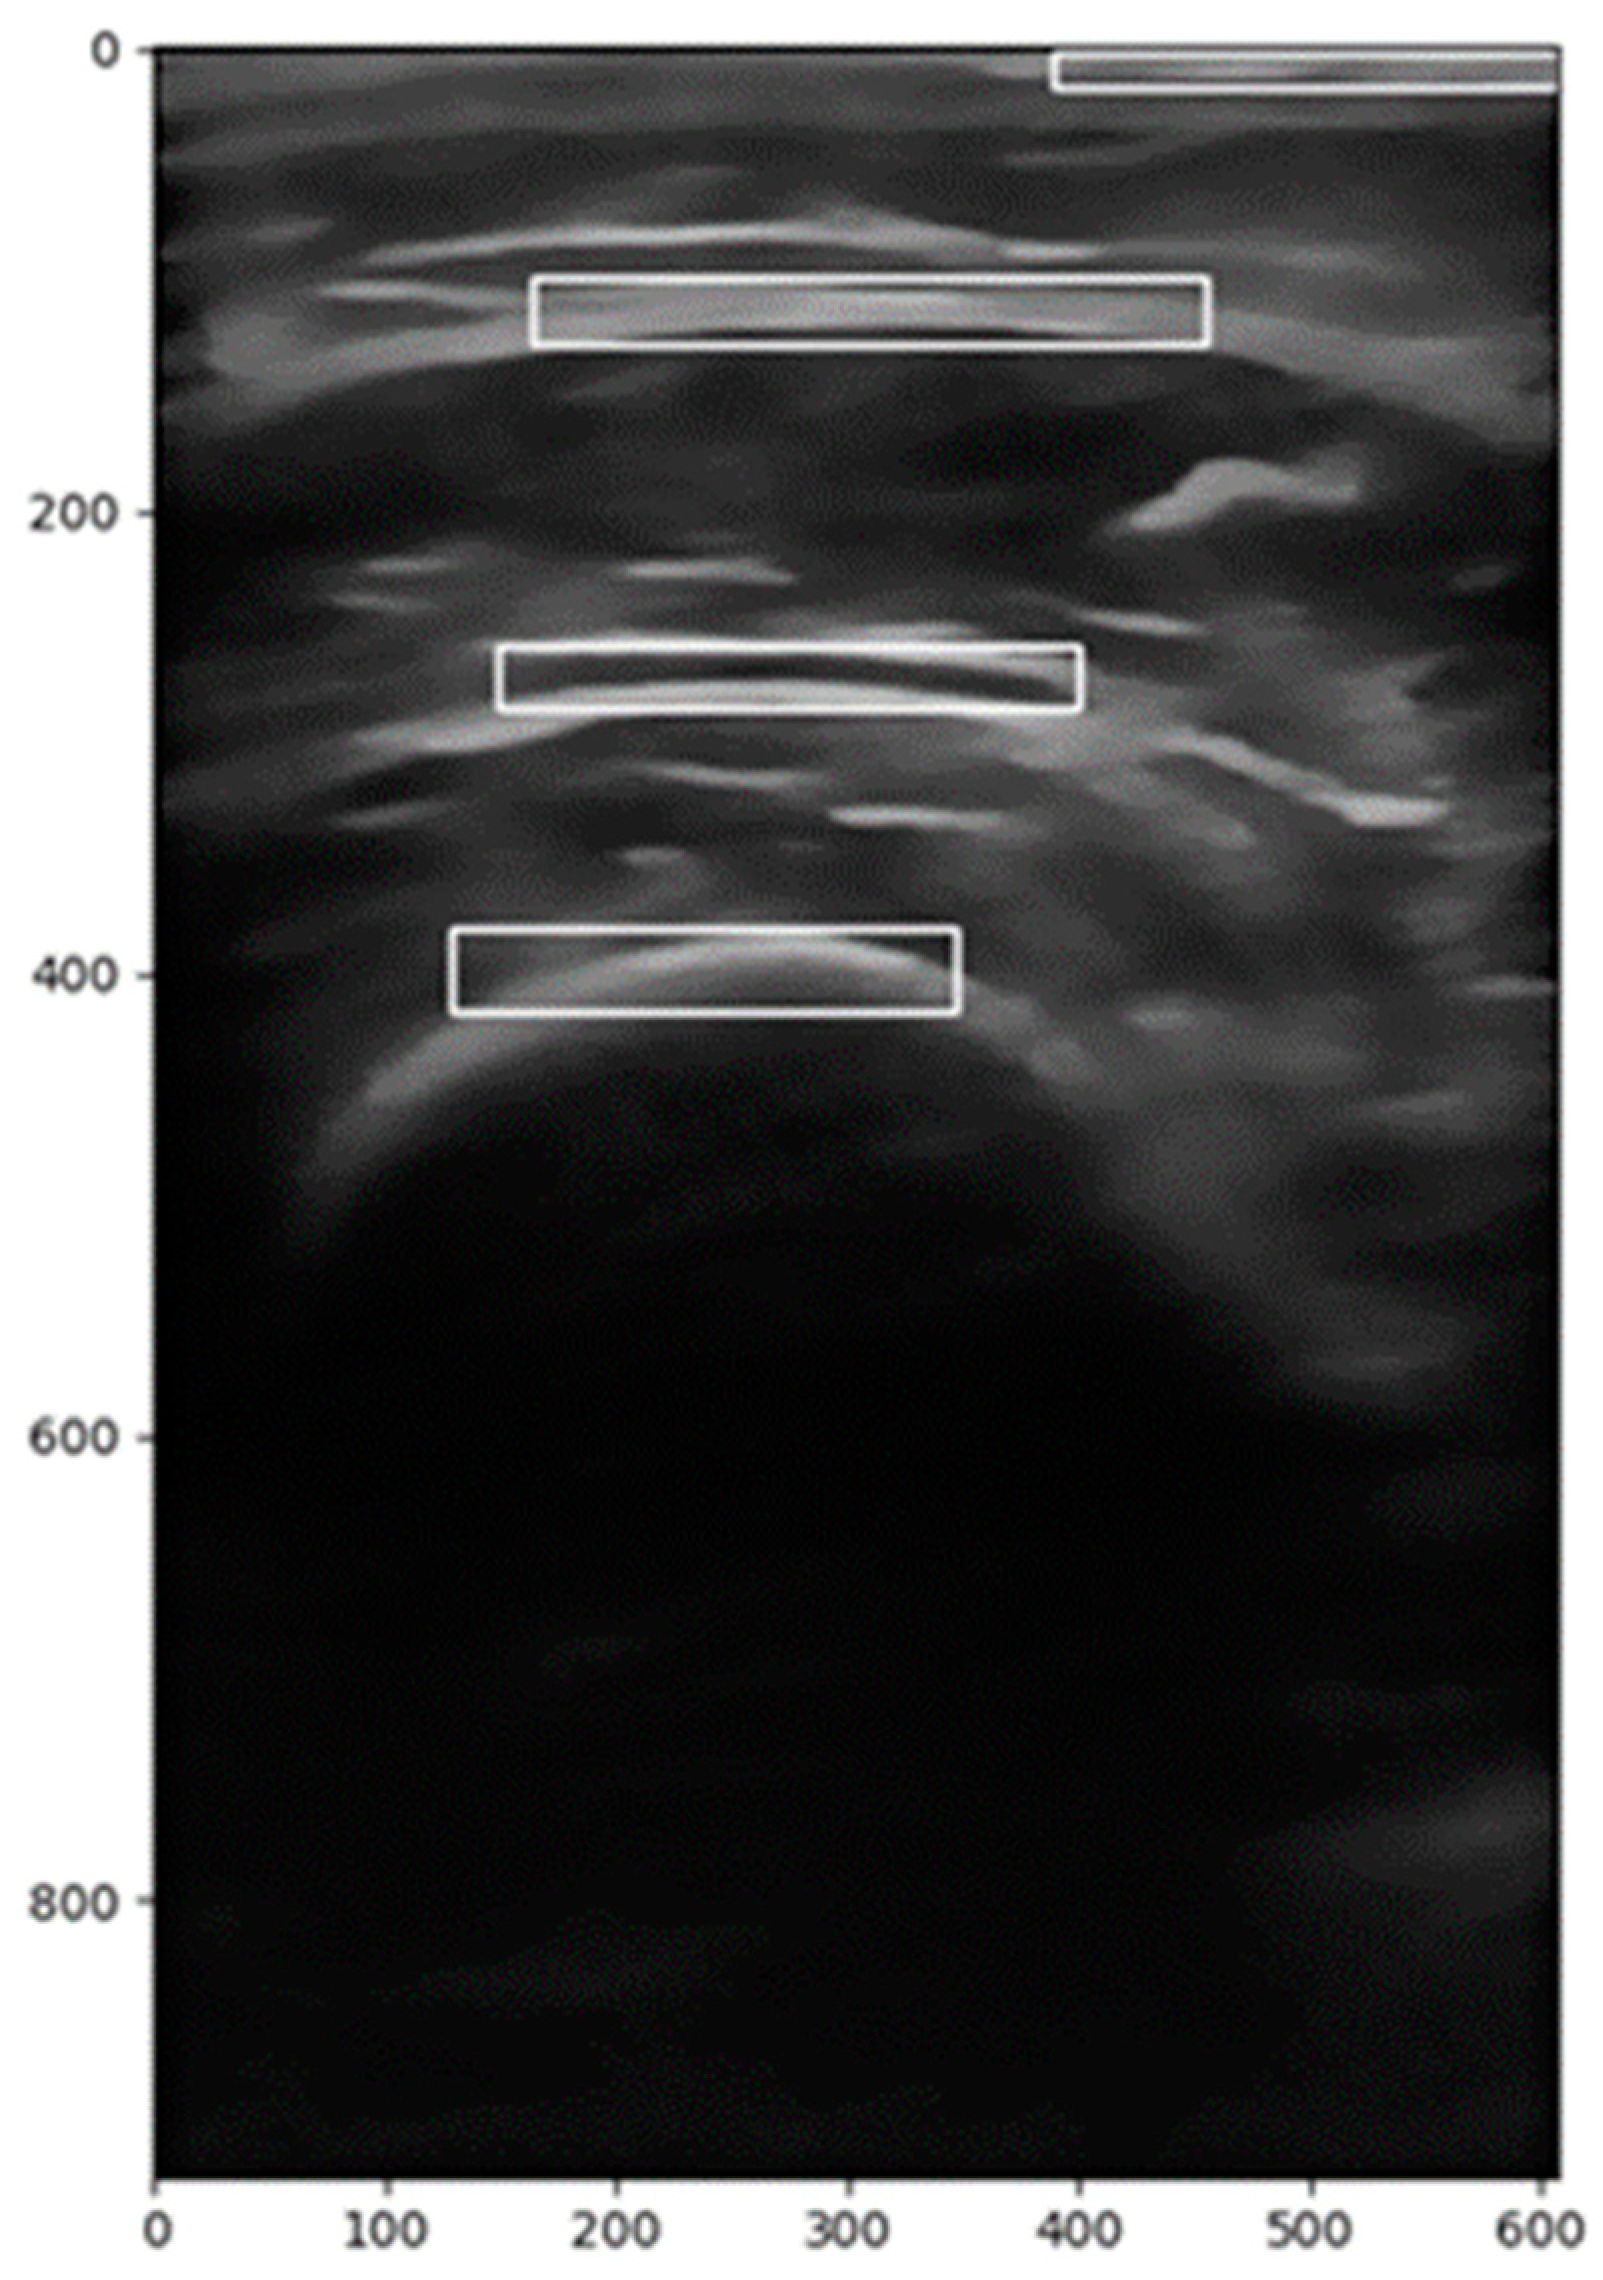
2.2.3. Calculation of the Region of Interest (ROI)
- A vertical range is selected to focus on the relevant anatomical structures.
- A backward scan (from the middle to the left) is performed to find the first column where pixel intensity exceeds a predefined threshold.
- A forward scan (from the middle to the right) is performed to find the last column where the pixel intensity is above the threshold.
- These two indices define the horizontal extent of the ROI.
- The midpoint of the image height is used as a reference.
- A downward scan is conducted to determine the lower boundary, which is the last row where significant pixel intensity is detected.
- An upward scan is performed to establish the upper boundary, where meaningful image data start.
2.2.4. Image Filtering
2.2.5. Image Transformation
2.2.6. Calculation of Distances and Areas
2.2.7. Feature Extraction
2.3. Variables of Interest
2.3.1. Length and Area Variables
2.3.2. Image Characteristic Variables
- Angular Second Moment (ASM): Also known as uniformity or energy, this measure evaluates the repetition and uniformity of gray levels. A high ASM value indicates greater uniformity.
- Contrast: This measures the variation in gray levels between neighboring pixels. High contrast indicates a clear distinction between light and dark areas.
- Correlation: This assesses the linear dependence between the gray levels of pixels in a specific direction. A value of 0 indicates no correlation.
- Dissimilarity: This measures the difference between the gray levels of adjacent pixels. A high value reflects greater variability.
- Entropy: This is used to evaluate the lack of uniformity in the image texture. Higher entropy indicates lower uniformity.
- Histogram: This represents the normalized distribution of gray levels in the image, providing the mean of these levels.
- Homogeneity: This indicates the similarity between the gray levels of the pixels in the image, being a measure of textural uniformity.
2.4. Data Storage
Interface
2.5. Statistical Methods
3. Results
4. Discussion
5. Conclusions
Author Contributions
Funding
Institutional Review Board Statement
Informed Consent Statement
Data Availability Statement
Acknowledgments
Conflicts of Interest
References
- Holmes, C.J.; Racette, S.B. The Utility of Body Composition Assessment in Nutrition and Clinical Practice: An Overview of Current Methodology. Nutrients 2021, 13, 2493. [Google Scholar] [CrossRef]
- García-Almeida, J.M.; García-García, C.; Vegas-Aguilar, I.M.; Ballesteros Pomar, M.D.; Cornejo-Pareja, I.M.; Fernández Medina, B.; de Luis Román, D.A.; Bellido Guerrero, D.; Bretón Lesmes, I.; Tinahones Madueño, F.J. Nutritional ultrasound: Conceptualisation, technical considerations and standardisation Endocrinología. Diabetes Nutr. 2023, 70, S74–S84. [Google Scholar]
- Cederholm, T.; Jensen, G.L.; Correia, M.I.T.D.; Gonzalez, M.C.; Fukushima, R.; Higashiguchi, T.; Baptista, G.; Barazzoni, R.; Blaauw, R.; Coats, A.; et al. GLIM Core Leadership Committee; GLIM Working Group. GLIM criteria for the diagnosis of malnutrition—A consensus report from the global clinical nutrition community. Clin. Nutr. 2019, 38, 207–217. [Google Scholar] [CrossRef] [PubMed]
- Bazzocchi, A.; Filonzi, G.; Ponti, F.; Albisinni, U.; Guglielmi, G.; Battista, G. Ultrasound: Which role in body composition? Eur. J. Radiol. 2016, 85, 1469–1480. [Google Scholar] [CrossRef] [PubMed]
- García-Almeida, J.M.; García-García, C.; Ballesteros-Pomar, M.D.; Olveira, G.; Lopez-Gomez, J.J.; Bellido, V.; Bretón Lesmes, I.; Burgos, R.; Sanz-Paris, A.; Matia-Martin, P.; et al. Expert Consensus on Morphofunctional Assessment in Disease-Related Malnutrition. Grade Review and Delphi Study. Nutrients 2023, 15, 612. [Google Scholar] [CrossRef] [PubMed]
- Ozçakar, L.; Tok, F.; De Muynck, M.; Vanderstraeten, G. Musculoskeletal ultrasonography in physical and rehabilitation medicine. J. Rehabil. Med. 2012, 44, 310–318. [Google Scholar] [CrossRef]
- Escriche-Escuder, A.; Trinidad-Fernández, M.; Pajares, B.; Iglesias-Campos, M.; Alba, E.; García-Almeida, J.M.; Roldán-Jiménez, C.; Cuesta-Vargas, A.I. Responsiveness of the new index muscular echotexture in women with metastatic breast cancer: An exercise intervention study. Sci. Rep. 2022, 12, 15148. [Google Scholar] [CrossRef]
- Kawai, H.; Kera, T.; Hirayama, R.; Hirano, H.; Fujiwara, Y.; Ihara, K.; Kojima, M.; Obuchi, S. Morphological and qualitative characteristics of the quadriceps muscle of community-dwelling older adults based on ultrasound imaging: Classification using latent class analysis. Aging Clin. Exp. Res. 2018, 30, 283–291. [Google Scholar] [CrossRef]
- Ríos-Díaz, J.; Del Baño-Aledo, M.E.; Tembl-Ferrairó, J.I.; Chumillas, M.J.; Vázquez-Costa, J.F.; Martínez-Payá, J.J. Quantitative neuromuscular ultrasound analysis as biomarkers in amyotrophic lateral sclerosis. Eur. Radiol. 2019, 29, 4266–4275. [Google Scholar] [CrossRef]
- Escriche-Escuder, A.; Trinidad-Fernández, M.; Pajares, B.; Iglesias-Campos, M.; Alba, E.; Cuesta-Vargas, A.I.; Roldán-Jiménez, C. Ultrasound use in metastatic breast cancer to measure body composition changes following an exercise intervention. Sci. Rep. 2021, 11, 8858. [Google Scholar] [CrossRef]
- Guirado-Peláez, P.; Fernández-Jiménez, R.; Sánchez-Torralvo, F.J.; Mucarzel Suárez-Arana, F.; Palmas-Candia, F.X.; Vegas-Aguilar, I.; Amaya-Campos, M.d.M.; Martínez Tamés, G.; Soria-Utrilla, V.; Tinahones-Madueño, F.; et al. Multiparametric Approach to the Colorectal Cancer Phenotypes Integrating Morphofunctional Assessment and Computer Tomography. Cancers 2024, 16, 3493. [Google Scholar] [CrossRef]
- de Luis Roman, D.; García Almeida, J.M.; Bellido Guerrero, D.; Guzmán Rolo, G.; Martín, A.; Primo Martín, D.; García-Delgado, Y.; Guirado-Peláez, P.; Palmas, F.; Tejera Pérez, C.; et al. Ultrasound Cut-Off Values for Rectus Femoris for Detecting Sarcopenia in Patients with Nutritional Risk. Nutrients 2024, 16, 1552. [Google Scholar] [CrossRef] [PubMed]
- Caresio, C.; Salvi, M.; Molinari, F.; Meiburger, K.M.; Minetto, M.A. Fully Automated Muscle Ultrasound Analysis (MUSA): Robust and Accurate Muscle Thickness Measurement. Ultrasound Med. Biol. 2017, 43, 195–205. [Google Scholar] [CrossRef] [PubMed]
- Salvi, M.; Caresio, C.; Meiburger, K.M.; De Santi, B.; Molinari, F.; Minetto, M.A. Transverse Muscle Ultrasound Analysis (TRAMA): Robust and Accurate Segmentation of Muscle Cross-Sectional Area. Ultrasound Med. Biol. 2019, 45, 672–683. [Google Scholar] [CrossRef] [PubMed]
- Zheng, W.; Zhou, L.; Chai, Q.; Xu, J.; Liu, S. Fully Automatic Analysis of Muscle B-Mode Ultrasound Images Based on the Deep Residual Shrinkage U-Net. Electronics 2022, 11, 1093. [Google Scholar] [CrossRef]
- Burlina, P.; Billings, S.; Joshi, N.; Albayda, J. Automated diagnosis of myositis from muscle ultrasound: Exploring the use of machine learning and deep learning methods. PLoS ONE 2017, 12, e0184059. [Google Scholar] [CrossRef]
- Marzola, F.; van Alfen, N.; Doorduin, J.; Meiburger, K.M. Deep learning segmentation of transverse musculoskeletal ultrasound images for neuromuscular disease assessment. Comput. Biol. Med. 2021, 135, 104623. [Google Scholar] [CrossRef]
- Zhou, L.; Liu, S.; Zheng, W. Automatic Analysis of Transverse Musculoskeletal Ultrasound Images Based on the Multi-Task Learning Model. Entropy 2023, 25, 662. [Google Scholar] [CrossRef]
- García Almeida, J.M.; Bellido, D.; De Luis, D.; Guzmán Rolo, G.; Olveira, G. Protocol for a prospective cohort study on the feasibility of application of nutritional ultrasound in the diagnosis and follow-up of patients with nutritional risk at hospital discharge: Study on body composition and function (DRECO). BMJ Open 2023, 13, e074945. [Google Scholar] [CrossRef] [PubMed] [PubMed Central]
- Fitzgibbon, A.; Pilu, M.; Fisher, R.B. Direct least square fitting of ellipses. IEEE Trans. Pattern Anal. Mach. Intell. 1999, 21, 476–480. [Google Scholar] [CrossRef]
- Onakpojeruo, E.P.; Mustapha, M.T.; Ozsahin, D.U.; Ozsahin, I. Enhanced MRI-based brain tumour classification with a novel Pix2pix generative adversarial network augmentation framework. Brain Commun. 2024, 6, fcae372. [Google Scholar] [CrossRef] [PubMed]
- Onakpojeruo, E.P.; Mustapha, M.T.; Ozsahin, D.U.; Ozsahin, I. A Comparative Analysis of the Novel Conditional Deep Convolutional Neural Network Model, Using Conditional Deep Convolutional Generative Adversarial Network-Generated Synthetic and Augmented Brain Tumor Datasets for Image Classification. Brain Sci. 2024, 14, 559. [Google Scholar] [CrossRef] [PubMed]
- Ritsche, P.; Franchi, M.V.; Faude, O.; Finni, T.; Seynnes, O.; Cronin, N.J. Fully Automated Analysis of Muscle Architecture from B-Mode Ultrasound Images with DL_Track_US. Ultrasound Med. Biol. 2024, 50, 258–267. [Google Scholar] [CrossRef] [PubMed]
- García-Herreros, S.; López Gómez, J.J.; Cebria, A.; Izaola, O.; Salvador Coloma, P.; Nozal, S.; Cano, J.; Primo, D.; Godoy, E.J.; de Luis, D. Validation of an Artificial Intelligence-Based Ultrasound Imaging System for Quantifying Muscle Architecture Parameters of the Rectus Femoris in Disease-Related Malnutrition (DRM). Nutrients 2024, 16, 1806. [Google Scholar] [CrossRef] [PubMed] [PubMed Central]

| Abdomen | Leg | |
|---|---|---|
| Longitudinal | Total Subcutaneous Fat Superficial Subcutaneous Fat Peritoneal Fat | Y-axis Anterior Rectus X-axis Anterior Rectus Anterior Rectus Area Y-axis Vastus Intermedius X-axis Vastus Intermedius Vastus Intermedius Area |
| Transverse | Total Subcutaneous Fat Superficial Subcutaneous Fat Peritoneal Fat | Y-axis Anterior Rectus X-axis Anterior Rectus Anterior Rectus Area Y-axis Vastus Intermedius X-axis Vastus Intermedius Vastus Intermedius Area |
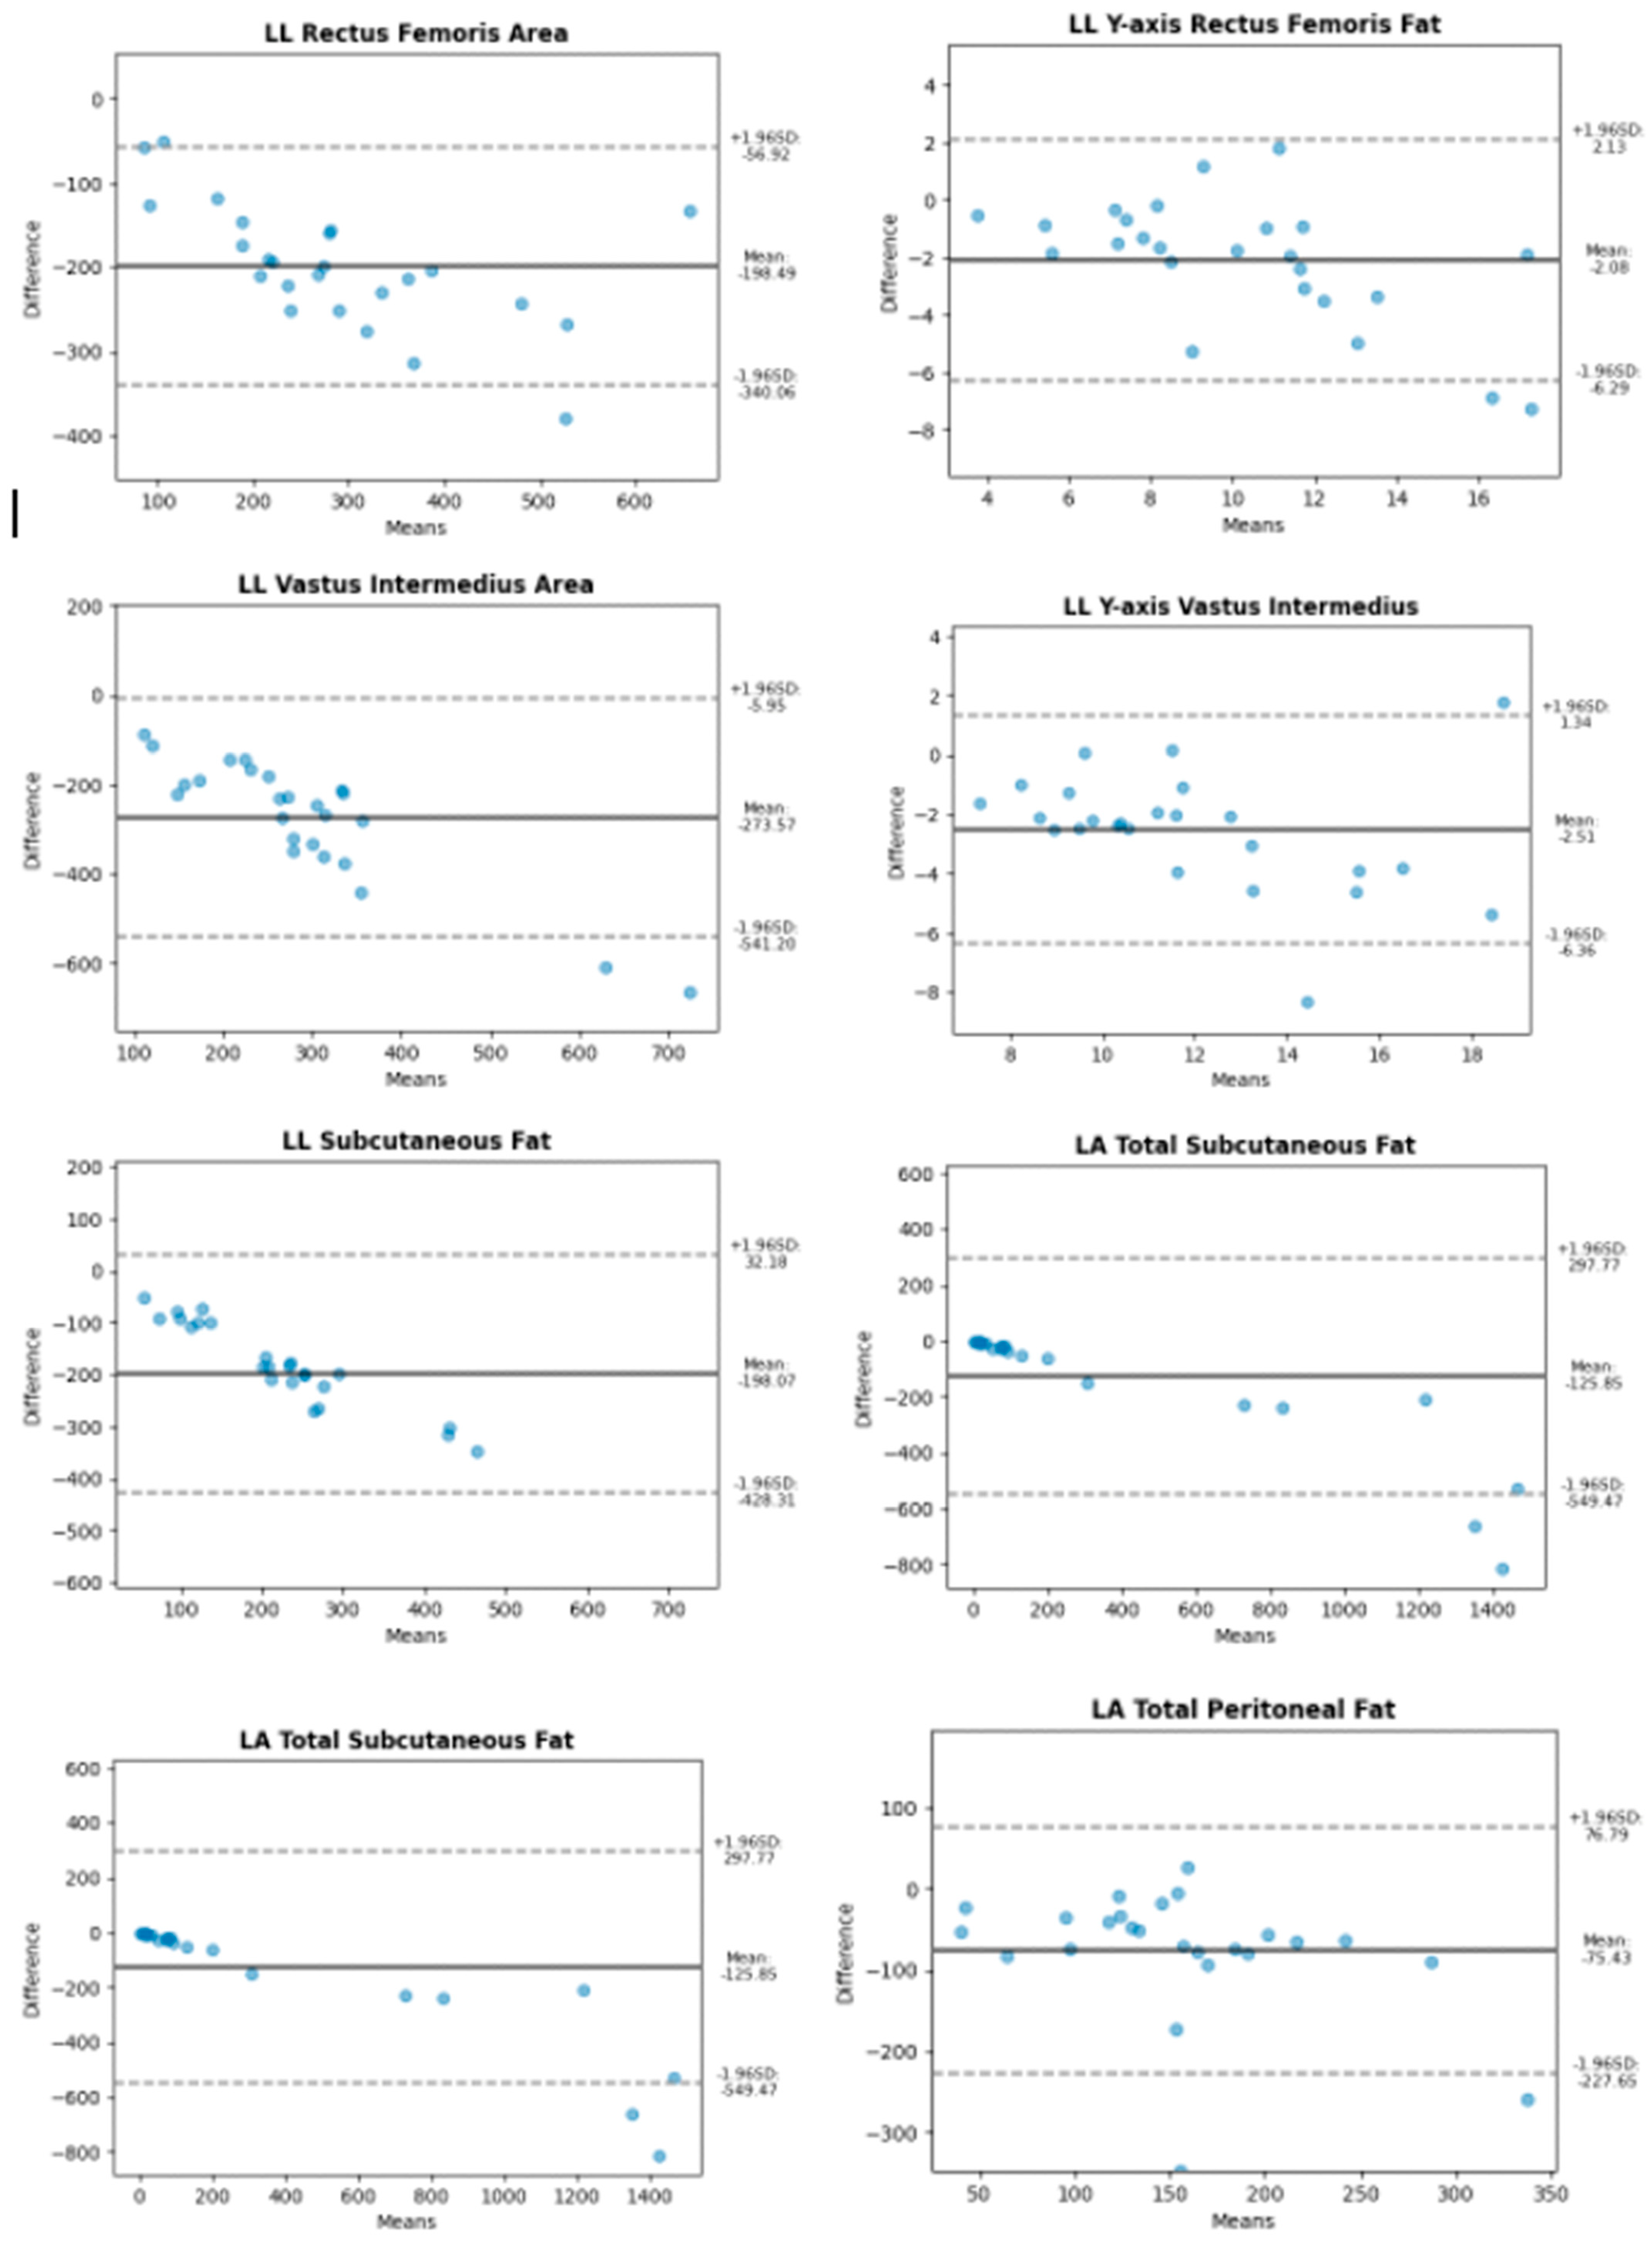
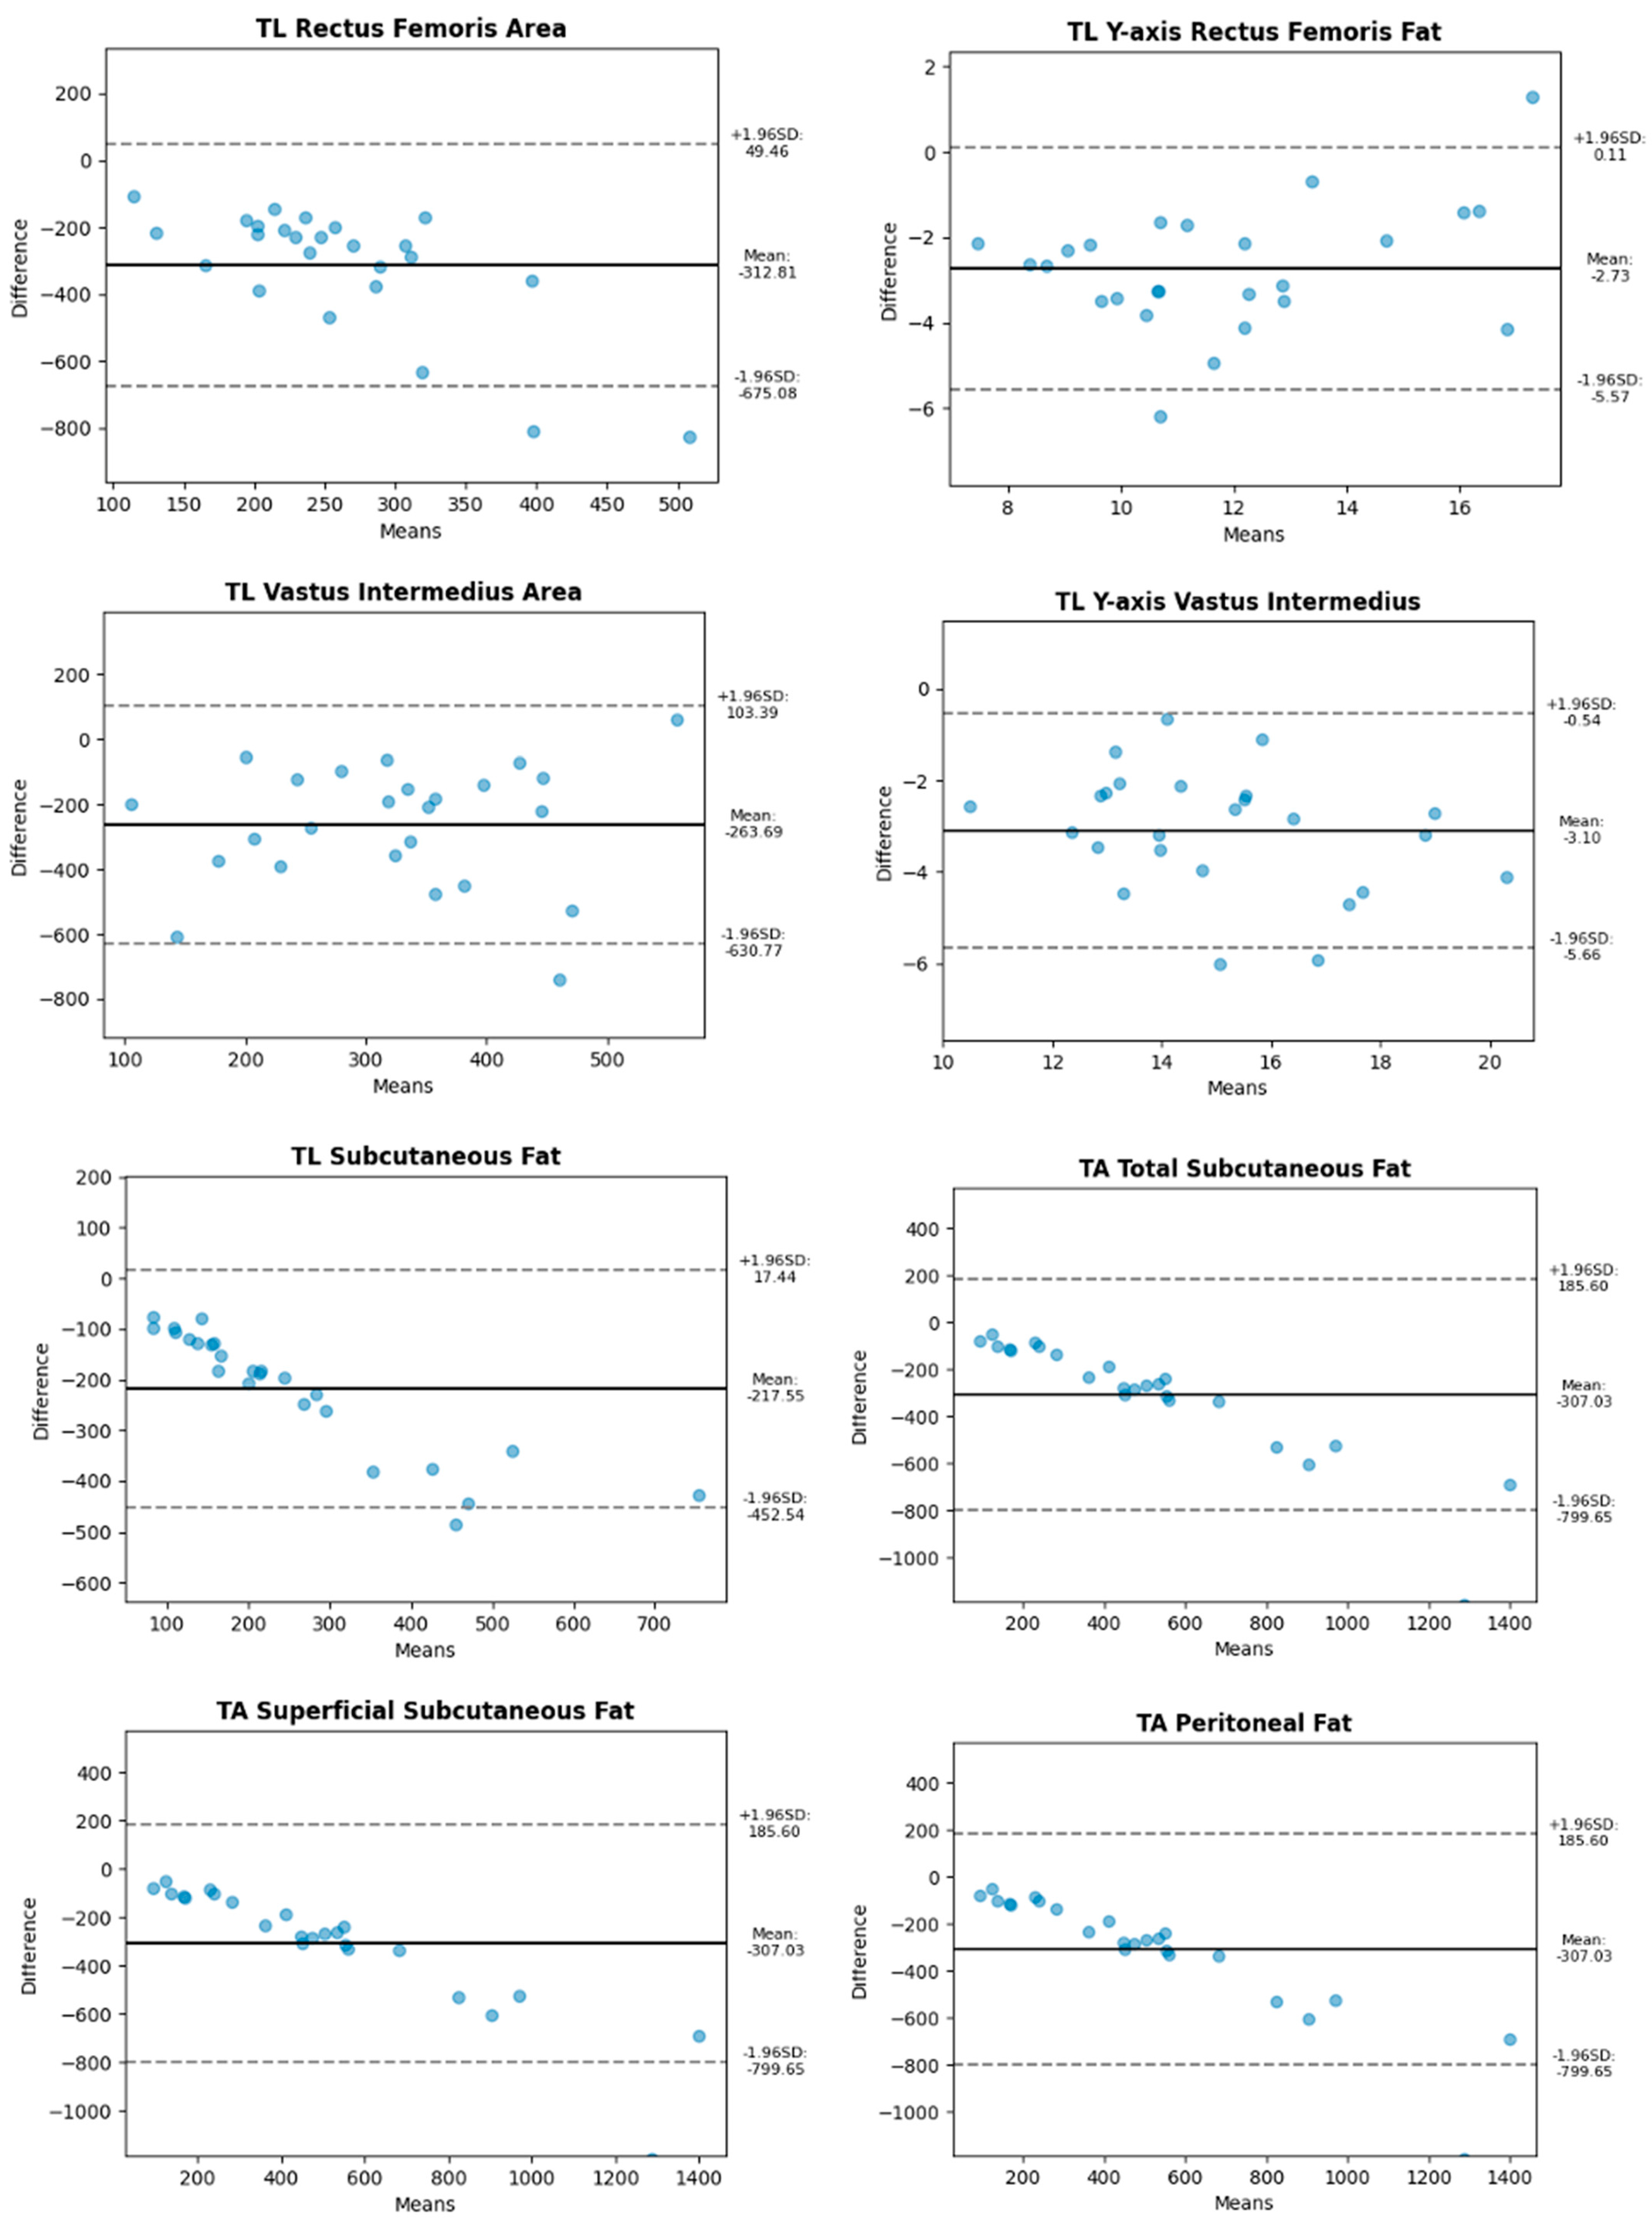
| Member | Section | Type | Accuracy |
|---|---|---|---|
| Abdomen | Longitudinal | Subcutaneous fat, total | 71.42 |
| Subcutaneous fat, superficial | 68.77 | ||
| Peritoneal fat | 63.0 | ||
| Transversal | Subcutaneous fat, total | 54.3 | |
| Subcutaneous fat, superficial | 55.65 | ||
| Peritoneal fat | 51.02 | ||
| Leg | Transversal | Y-axis Rectus femoris | 78.73 |
| Rectus femoris area | 28.09 | ||
| Y-axis Vastus intermediate | 81.65 | ||
| Vastus intermediate area | 43.31 | ||
| Longitudinal | Subcutaneous fat | 40.82 | |
| Y-axis Rectus femoris | 83.85 | ||
| Rectus femoris area | 46.33 | ||
| Y-axis Vastus intermediate | 81.39 | ||
| Vastus intermediate area | 36.52 |
Disclaimer/Publisher’s Note: The statements, opinions and data contained in all publications are solely those of the individual author(s) and contributor(s) and not of MDPI and/or the editor(s). MDPI and/or the editor(s) disclaim responsibility for any injury to people or property resulting from any ideas, methods, instructions or products referred to in the content. |
© 2025 by the authors. Licensee MDPI, Basel, Switzerland. This article is an open access article distributed under the terms and conditions of the Creative Commons Attribution (CC BY) license (https://creativecommons.org/licenses/by/4.0/).
Share and Cite
Cuesta-Vargas, A.; Arjona-Caballero, J.M.; Olveira, G.; de Luis Román, D.; Bellido-Guerrero, D.; García-Almeida, J.M. Automatic Analysis of Ultrasound Images to Estimate Subcutaneous and Visceral Fat and Muscle Tissue in Patients with Suspected Malnutrition. Diagnostics 2025, 15, 988. https://doi.org/10.3390/diagnostics15080988
Cuesta-Vargas A, Arjona-Caballero JM, Olveira G, de Luis Román D, Bellido-Guerrero D, García-Almeida JM. Automatic Analysis of Ultrasound Images to Estimate Subcutaneous and Visceral Fat and Muscle Tissue in Patients with Suspected Malnutrition. Diagnostics. 2025; 15(8):988. https://doi.org/10.3390/diagnostics15080988
Chicago/Turabian StyleCuesta-Vargas, Antonio, José María Arjona-Caballero, Gabriel Olveira, Daniel de Luis Román, Diego Bellido-Guerrero, and Jose Manuel García-Almeida. 2025. "Automatic Analysis of Ultrasound Images to Estimate Subcutaneous and Visceral Fat and Muscle Tissue in Patients with Suspected Malnutrition" Diagnostics 15, no. 8: 988. https://doi.org/10.3390/diagnostics15080988
APA StyleCuesta-Vargas, A., Arjona-Caballero, J. M., Olveira, G., de Luis Román, D., Bellido-Guerrero, D., & García-Almeida, J. M. (2025). Automatic Analysis of Ultrasound Images to Estimate Subcutaneous and Visceral Fat and Muscle Tissue in Patients with Suspected Malnutrition. Diagnostics, 15(8), 988. https://doi.org/10.3390/diagnostics15080988