Article

Association between Gut Microbiota and Emotional-Behavioral Symptoms in Children with Attention-Deficit/Hyperactivity Disorder

1
Department of Psychiatry, Chang Gung Memorial Hospital, Chiayi Branch, Chiayi 613, Taiwan
2
School of Medicine, Chang Gung University, Taoyuan 333, Taiwan
3
Department of Medical Biotechnology and Laboratory Science, College of Medicine, Chang Gung University, Taoyuan 333, Taiwan
4
Microbiota Research Center and Emerging Viral Infections Research Center, Chang Gung University, Taoyuan 333, Taiwan
5
Central Research Laboratory, Xiamen Chang Gung Hospital, Xiamen 361, China
6
Department of Laboratory Medicine, Linkou Chang Gung Memorial Hospital, Taoyuan 333, Taiwan
7
Research Center for Chinese Herbal Medicine and Research Center for Food and Cosmetic Safety, College of Human Ecology, Chang Gung University of Science and Technology, Taoyuan 333, Taiwan
8
Biotools Co., Ltd., New Taipei City 221, Taiwan
*
Author to whom correspondence should be addressed.
J. Pers. Med. 2022, 12(10), 1634; https://doi.org/10.3390/jpm12101634
Submission received: 4 June 2022 / Revised: 27 September 2022 / Accepted: 29 September 2022 / Published: 2 October 2022
(This article belongs to the Section Clinical Medicine, Cell, and Organism Physiology)

Abstract

:
Previous studies have explored the role of the microbiome in attention-deficit/hyperactivity disorder (ADHD). However, whether the microbiome is correlated with emotional–behavioral disturbances, the most common comorbid symptom of ADHD, remains unclear. We established a cross-sectional study in which 6- to 18-year-old children with ADHD who were receiving no medication and a healthy control group of children without ADHD were recruited to analyze their microbiome composition. Microbiota of fecal samples were collected and analyzed using a 16s rRNA gene sequencing approach. In comparison with the healthy control group, the gut microbiota in children with ADHD exhibited significantly lower beta diversity. The abundance of the phylum Proteobacteria and the genera Agathobacter, Phascolarctobacterium, Prevotella_2, Acidaminococcus, Roseburia, and Ruminococcus gnavus group was increased in the ADHD group compared with the healthy group. Linear discriminant effect size (LEfSe) analysis was used to highlight specific bacteria phylotypes that were differentially altered between the ADHD and control groups. A regression analysis was performed to investigate the association between microbiota and emotional–behavioral symptoms in children with ADHD. A significant association was noted between withdrawal and depression symptoms and Agathobacter (p = 0.044), and between rule-breaking behavior and the Ruminococcus gnavus group (p = 0.046) after adjusting for sex, age, and the ADHD core symptoms score. This study advances the knowledge of how gut microbiota composition may contribute to emotional–behavioral symptoms in children with ADHD. The detailed mechanisms underlying the role of the gut microbiota in ADHD pathophysiology still require further investigation.

1. Introduction

Attention-deficit/hyperactivity disorder (ADHD) is the most common neurodevelopmental disorder among children and adolescents, with an estimated prevalence rate of approximately 3% to 10% globally [1]. The disorder is characterized by inattention, hyperactivity, difficulties in impulse control, and impaired academic achievement, social function, and emotional management [2,3]. In addition to these core symptoms, emotional dysregulation and poor behavior control are also common symptoms in ADHD. Such emotional–behavioral disturbances, although not reaching the diagnostic criteria of psychiatric disorders, still strongly affect patients with the disorder [4]. Comorbid emotional–behavioral problems in ADHD have been correlated with poor social adjustment, less frequent marriage, unemployment, poor peer relations, and poor schooling performance [5].
ADHD is a multiple pathogenetic disorder influenced by several genes and environmental factors [6,7]. In addition, recent investigations on the linkage between the gut microbiota and brain function have suggested that the gut microbiota may play a role in the etiology of ADHD [8]. The bidirectional communication between the gut and the brain, also known as the “gut–brain axis”, has been proposed to be involved in some neuropsychiatric disorders, including depression, anxiety, and schizophrenia [9,10,11]. Furthermore, the gut microbiota has also been reported to affect host development and physiology, which is linked to autism and ADHD [12,13]. The evidence indicates that the gut microbiota may release neuromodulators, including dopamine and serotonin, which affect emotional regulation [14,15]. However, how the gut microbiota affects emotional–behavioral symptoms in patients with ADHD still requires clarification.
Only a few studies have investigated the gut microbial profiles of patients with ADHD, with the results being inconsistent. Some research has compared patients with ADHD and healthy controls but without demonstrating significant differences in alpha and beta diversity between the two cohorts [16,17,18]. However, one study that analyzed the microbial composition of a German population of adolescents with ADHD and nonrelated controls reported the conflicting result. Alpha and beta diversity were both significantly different between the two cohorts, and alpha diversity was negatively correlated with the level of hyperactivity [19]. Another study in Taiwan revealed no differences in beta diversity between children with ADHD and healthy controls. However, ADHD children had significantly higher values of Shannon and Chao 1 indices, and the Simpson index was significantly lower compared with controls [2]. Therefore, it is difficult to draw a conclusion from these studies due to the heterogenous composition of the study populations.
Studies have examined the correlation between the gut microbiota and clinical symptoms among patients with ADHD [2,17,19,20]. However, in addition to the core symptoms of ADHD, the association between the gut microbiota and emotional–behavioral problems of patients with ADHD also require an investigation. High comorbid mood and behavior disorder has been reported but the role of the gut microbiota in emotional–behavioral symptoms among patients with ADHD has not been explored [21]. We thus performed a study to determine whether an imbalanced gut microbiota would be correlated with the emotional–behavioral symptoms in patients with ADHD. We compared the gut microbiota composition of healthy children with that of patients with ADHD and examined the correlation between the gut microbiota composition and emotional–behavioral symptoms.

2. Materials and Methods
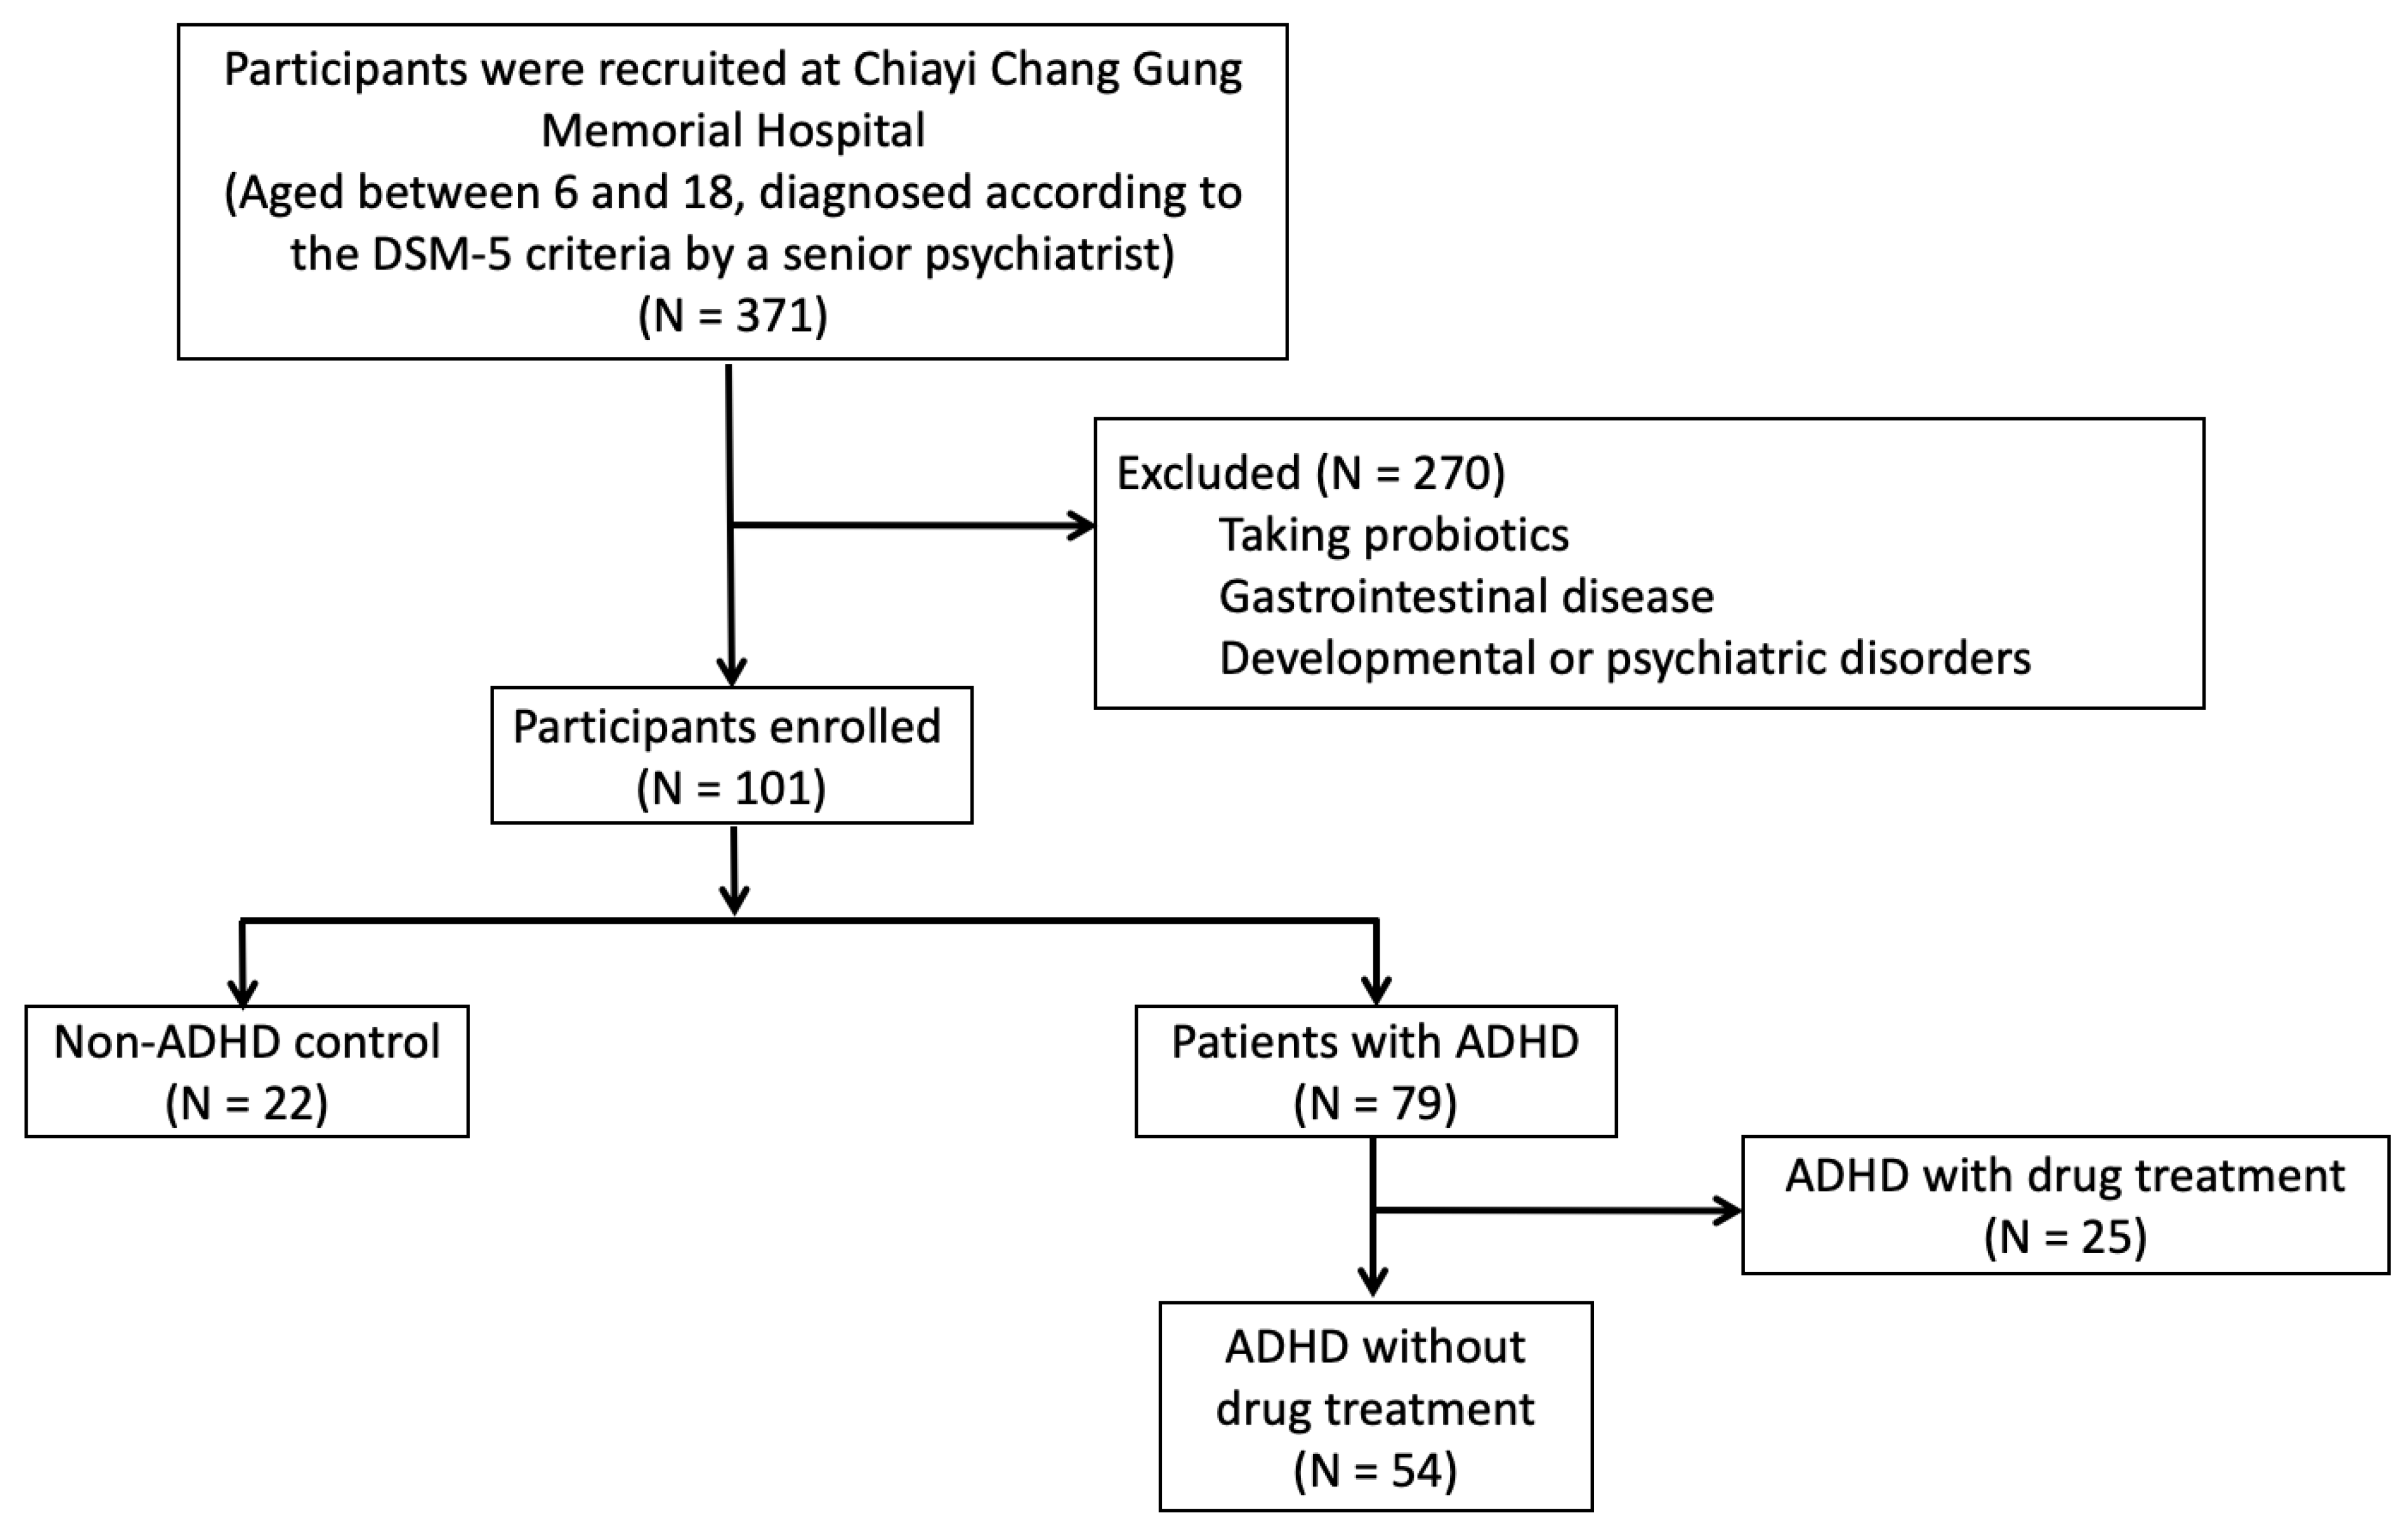
2.1. Participants

All participants were recruited at Chiayi Chang Gung Memorial Hospital. The participants were aged 6-to-18 years old, and participants and their parents agreed to provide written informed consent. Patients with ADHD were diagnosed according to the DSM-5 criteria by a senior psychiatrist [22]. All participants were assessed using the Swanson, Nolan and Pelham Parent Rating Scale. The exclusion criteria included taking probiotics in the last 2 weeks and having gastrointestinal disease or other developmental or psychiatric disorders (except oppositional defiant disorder and conduct disorder). To avoid the effect of medication, participants who received ADHD medication were also ruled out. General patient information, including sex, age, body mass index (BMI), and a history of preterm birth or rhinitis, was collected in this study. The Institutional Review Board (IRB) at Chang Gung Memorial Hospital in Taiwan approved our research protocol (IRB number: 201800402A3).

2.2. Sample Collection and DNA Extraction

To guarantee the reliability of the data, quality control was performed at each step of study process (ie, DNA sampling, PCR testing, library preparation and sequencing). Total genomic DNA from samples was extracted using the column-based method (eg, QIAamp PowerFecal DNA Kit, Qiagen, Hilden, Germany). DNA concentration was determined and adjusted to 5 ng/μL for the sequencing process.

2.3. Sequencing

For the 16S rRNA gene sequencing, the V3-V4 region was amplified by a specific primer set (314F: TCGTCGGCAGCGTCAGATGTGTATAAGAGACAGCCTACGGGNGGCWGCAG, 805R: GTCTCGTGGGCTCGGAGATGTGTATAAGAGACAGGACTACHVGGGTATCTAATCC) according to the 16S Metagenomic Sequencing Library Preparation procedure (Illumina, San Diego, CA, USA). In brief, 5 ng of gDNA was used for the PCR reaction, which was conducted using KAPA HiFi HotStart ReadyMix (Roche, Basel, Switzerland) under the following PCR conditions: 95 °C for 3 min; 25 cycles of 95 °C for 30 s, 55 °C for 30 s, and 72 °C for 30 s; 72 °C for 5 min; and hold at 4 °C. The PCR products were monitored on 1.5% agarose gel. Samples with a bright main strip at 550 bp were chosen and purified by using AMPure XP beads for the following library preparation.
The sequencing library was prepared according to the 16S Metagenomic Sequencing Library Preparation procedure (Illumina). In brief, a secondary PCR was performed using the 16S rRNA V3-V4 region PCR amplicon and Nextera DNA Indexes Kit with dual indices and Illumina sequencing adapters (Illumina). The indexed PCR product quality was assessed using the Qubit dsDNA High Sensitivity Quantification Assay (Thermo Scientific, Waltham, MA, USA) and Qubit Fluorometric 2.0. An equal amount of the indexed PCR product was mixed to generate the sequencing library. Lastly, the library was sequenced on an Illumina MiSeq platform, and paired 300-bp reads were generated.

2.4. Data Processing and Analysis

Amplicon sequencing was performed by using 300-bp paired-end raw reads, and the entire paired-end reads were assembled using FLASH v1.2.11 [23]. Demultiplexing was performed using barcode identification. As part of quality control, low-quality reads (Q < 20) were discarded in the QIIME v1.9.1 pipeline [24]. If 3 consecutive bases were Q < 20, the read was truncated and the resulting read remained in the data set only if it was at least 75% of the original length, which was determined using the split_libraries_fastq.py script in QIIME. Sequences were chimera-checked using UCHIME [25] to obtain the effective tags and were filtered from the data set before operational taxonomic unit (OTU) clustering at 97% sequence identity by using the UPARSE function in the pipeline. For each representative sequence, the RDP classifier (v2.2) [26] algorithm was employed to annotate the taxonomy classification on the basis of the information retrieved from the Silva Database v132: 2017.12 [27]/GreenGenes vgg_13_8 [28,29]/NCBI/eHOMD v15.1 [30,31]; classification was performed, and an 80% minimum confidence threshold was necessary to make an assignment. Sequences with a one-time occurrence (singletons) or that were present in only one sample were filtered out. To analyze the sequence similarities among different OTUs, a multiple sequence alignment was conducted using the PyNAST software (v1.2) [32,33]; sequences were compared against the core-set dataset in the Silva Database v132; 2017.12/GreenGenes vgg_13_8/NCBI/eHOMD v15.1. A phylogenetic tree was constructed with a set of sequences representative of the OTUs by using FastTree [34,35].

2.5. Measurements

The severity of ADHD symptoms, including inattention, hyperactivity, and impulsivity, was measured and rated by parents with the SNAP-IV parent form [22,36]. The emotional–behavioral symptoms were also measure by parents using the Child Behavior Checklist (CBCL). The CBCL is a practical instrument used by parents to evaluate the emotional and behavioral symptoms of children between 4 and 16 years old. The CBCL contains 8 narrowband syndromes (i.e., withdrawn, anxious/depressed, somatic complaints, social problems, thought problems, attention problems, aggressive behavior, and delinquency) and 2 broadband syndromes (i.e., internalizing problems and externalizing problems). A T-score of 50 in each subscale indicates average functioning in reference to other children of the same age and gender. The Chinese language version of the CBCL possesses high test-retest reliability and validity [37,38].

2.6. Statistical and Bioinformatic Analysis

Microbiome 16S sequencing data were analyzed using a combination of the software programs mothur and R v3.2.5 [39]. To compare the microbial differences between groups, alpha diversity and beta diversity were analyzed. Alpha diversity, which represents the complexity of composition within members of a group, was calculated using the metrics of Chao 1 and ACE (community richness) and the Shannon and Simpson indices (the relative abundance and evenness accounting for diversity). Beta diversity, which represents the between-subject similarity of a microbial composition and enables the identification of differences between samples within a group, was estimated using UniFrac (Unique Fraction) [40,41]. We used an unweighted UniFrac distance that considered only information on the presence and absence of a species and counted the fraction of branch length unique to either community and a weighted UniFrac distance that used species abundance information and weighted the branch length with the difference in abundance. To determine whether the UniFrac distances were on average significantly different for pairs of samples, a t test was performed on the UniFrac distance matrix. To further increase the group distinction, supervised partial-least-squares discriminant analysis (PLS-DA) was used to evaluate and visualize variance between the groups on the basis of gut microbiota composition (OTUs). PLS-DA, which is based on a least-squares regression model, indicated structural differences in the gut bacterial community between the groups. These differences were assessed by calculating UniFrac distances, a phylogenetic-based distance metric for measuring the difference between two collections of sequences.
The composition analysis was calculated using QIIME V1.9.1. We used a linear discriminant analysis effect size (LEfSe) for statistical analysis and visualizing the results [42]. LEfSe takes into account both differences in abundance and frequency and was used to identify significantly imbalanced OTUs between the ADHD and healthy groups.
Clinical data were analyzed using the statistical software package SPSS, version 20 (SPSS, Chicago, IL, USA). Data were presented as mean ± SD, median (interquartile range), or number (percentage), as appropriate. Basic characteristics of the children with ADHD and the healthy controls were compared using chi-square tests for categorical variables, independent Student’s t tests for normally distributed continuous variables, and Mann–Whitney U tests for skewed continuous variables. Pearson’s correlation analysis was performed to assess the taxonomic association between gut microbiota and clinical symptoms. Multiple linear regression was performed to analyze the relationship between the relative abundance of bacteria and the CBCL rating score after controlling for sex, age, and SNAP-IVscore.

3. Results

3.1. Demographic Data

A total 371 participants were recruited, and 270 participants were excluded due to taking probiotics, having gastrointestinal disease, developmental or psychiatric disorders. There were 79 children with ADHD enrolled and 25 children ADHD who received medication among them were excluded. Finally, a total of 54 children with ADHD (boys = 44, girls = 10) without drug treatment and 22 healthy controls (boys = 13, girls = 9) were enrolled (Figure 1). The proportion of male was significant higher in ADHD cohort than that of the healthy control group (p = 0.042). The mean age of the ADHD cohort (mean = 8.39 ± 1.75) was younger than that of the healthy control group (mean = 9.73 ± 2.23). No significant differences were apparent between the groups in terms of BMI, or a history of preterm birth or allergic rhinitis. We compared the core ADHD symptoms through SNAP-IV ratings assigned by parents. Scores for inattention, hyperactivity/impulsivity, ADHD total, opposition/defiant, and CBCL were higher in children with ADHD compared with the healthy controls. The characteristics of the children with ADHD and those of the healthy controls are summarized in Table 1.

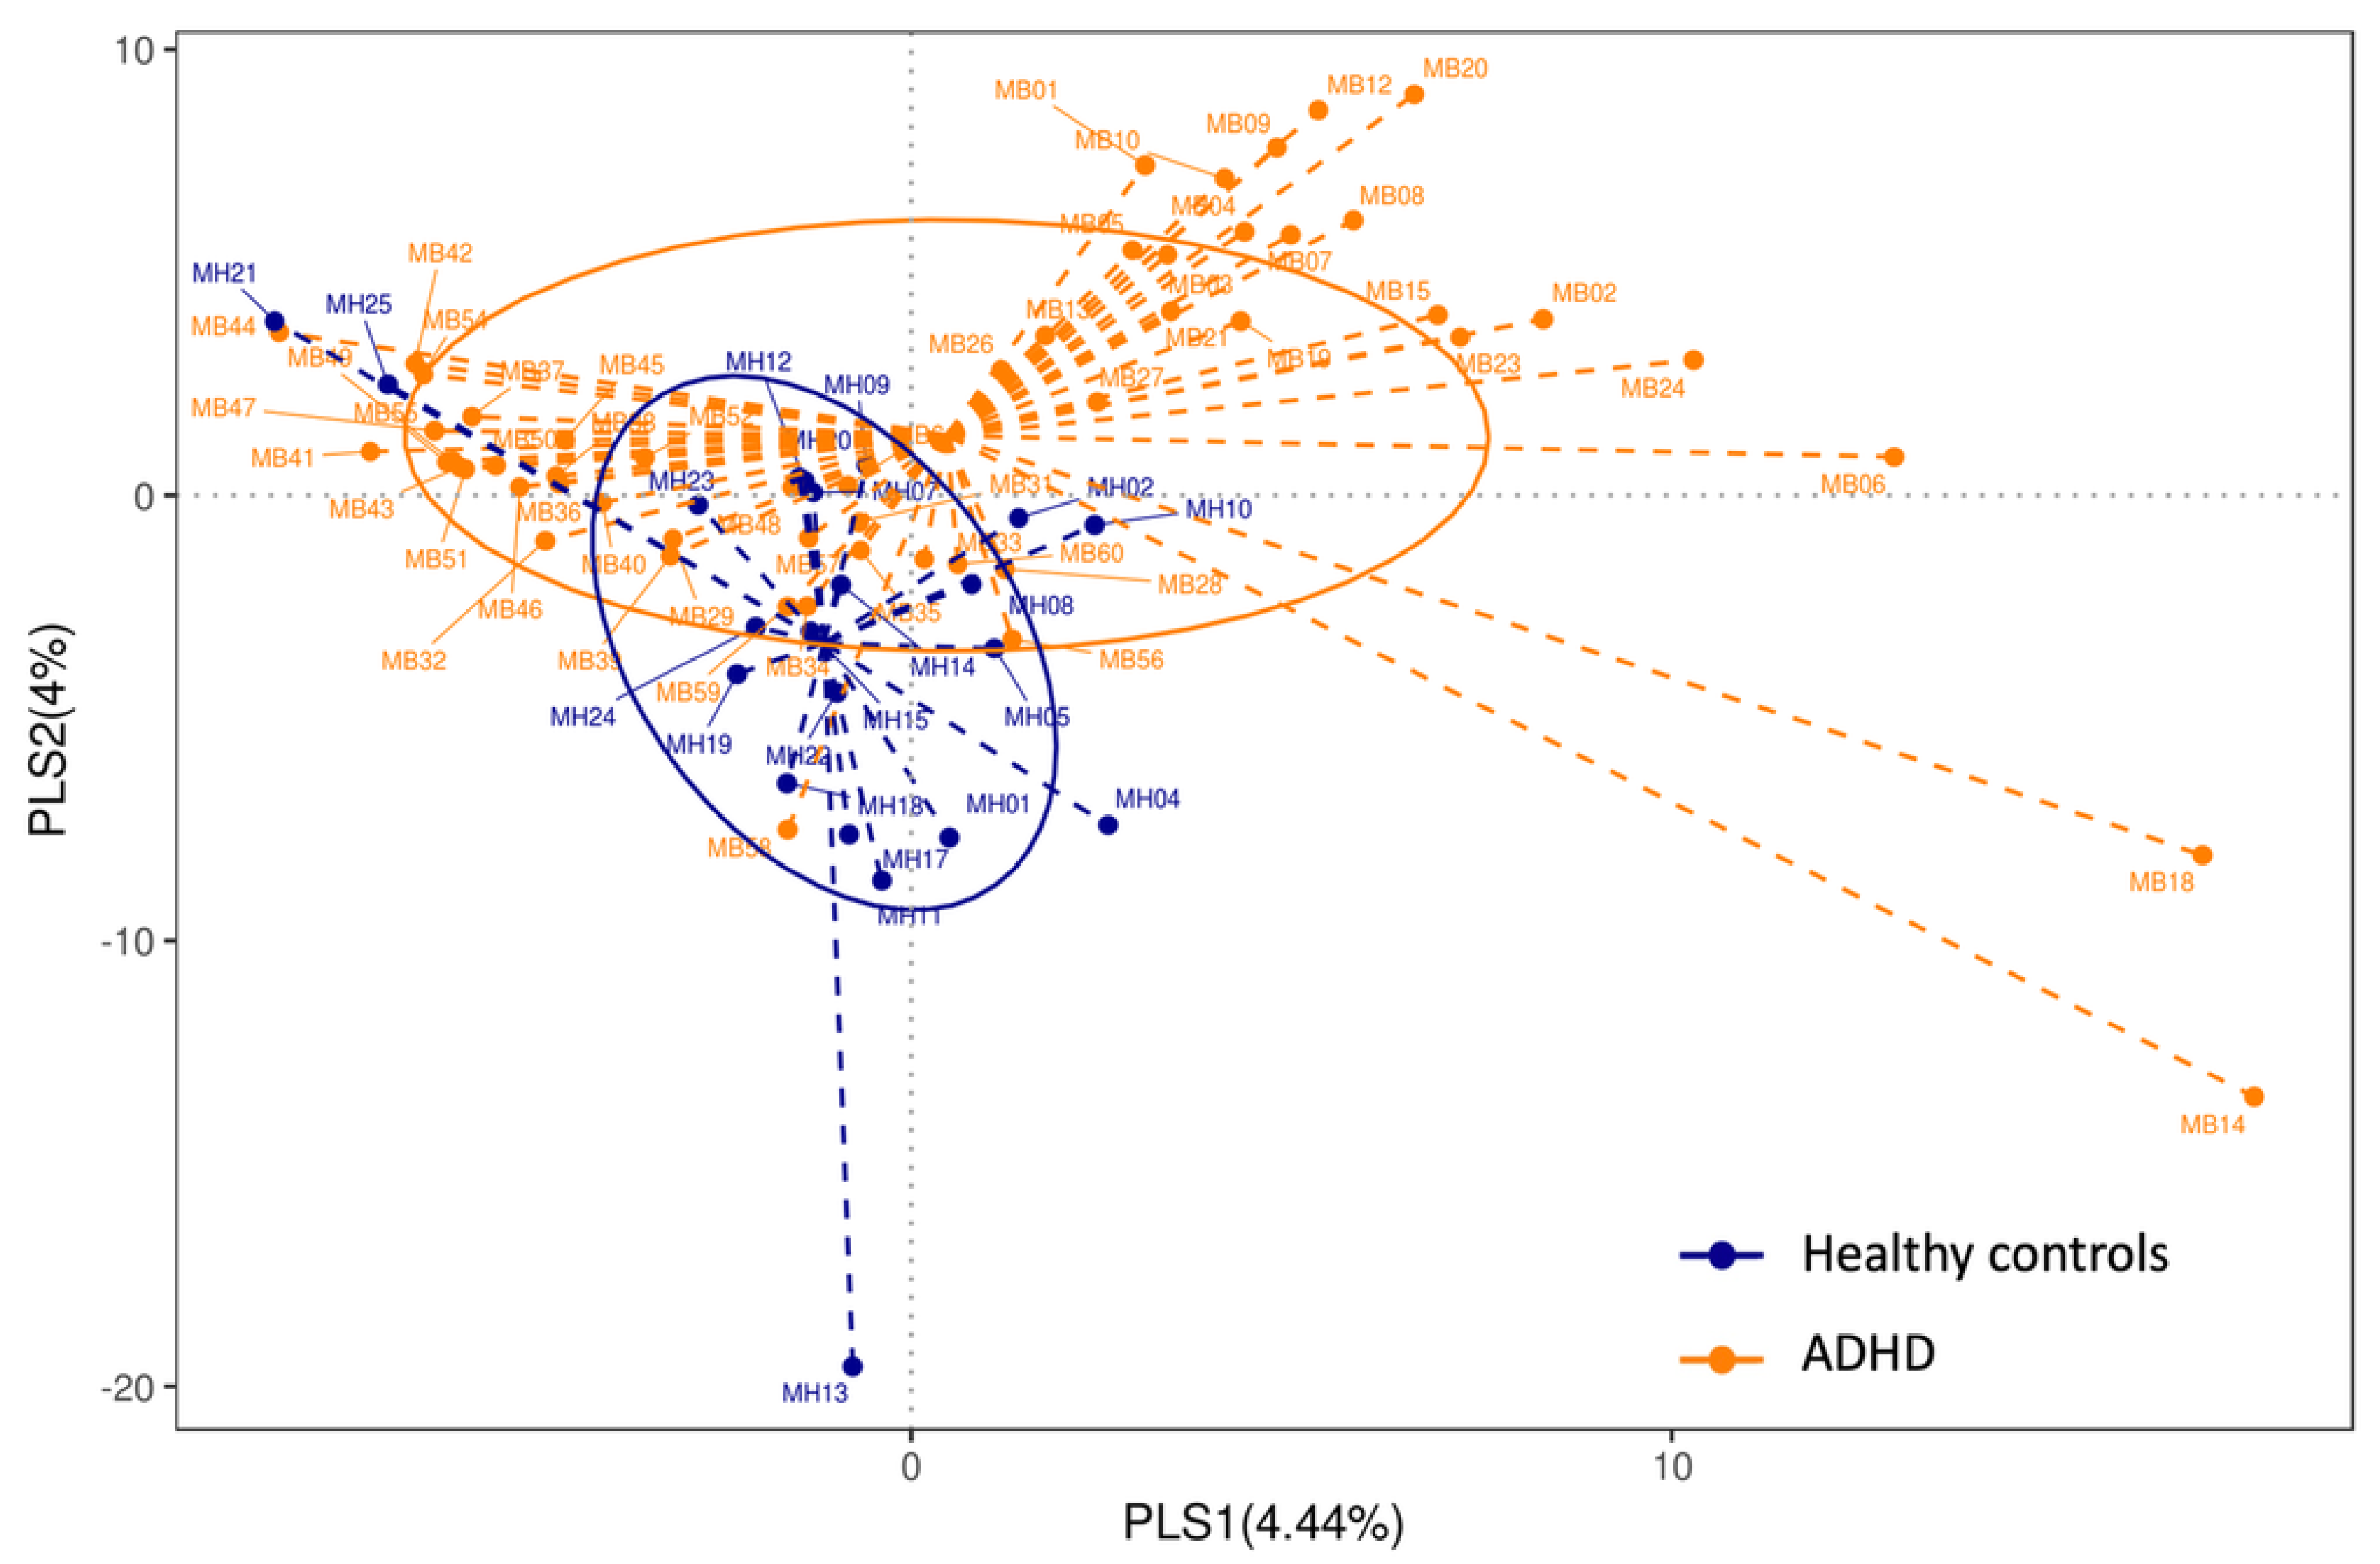
3.2. Alpha Diversity and Beta Diversity
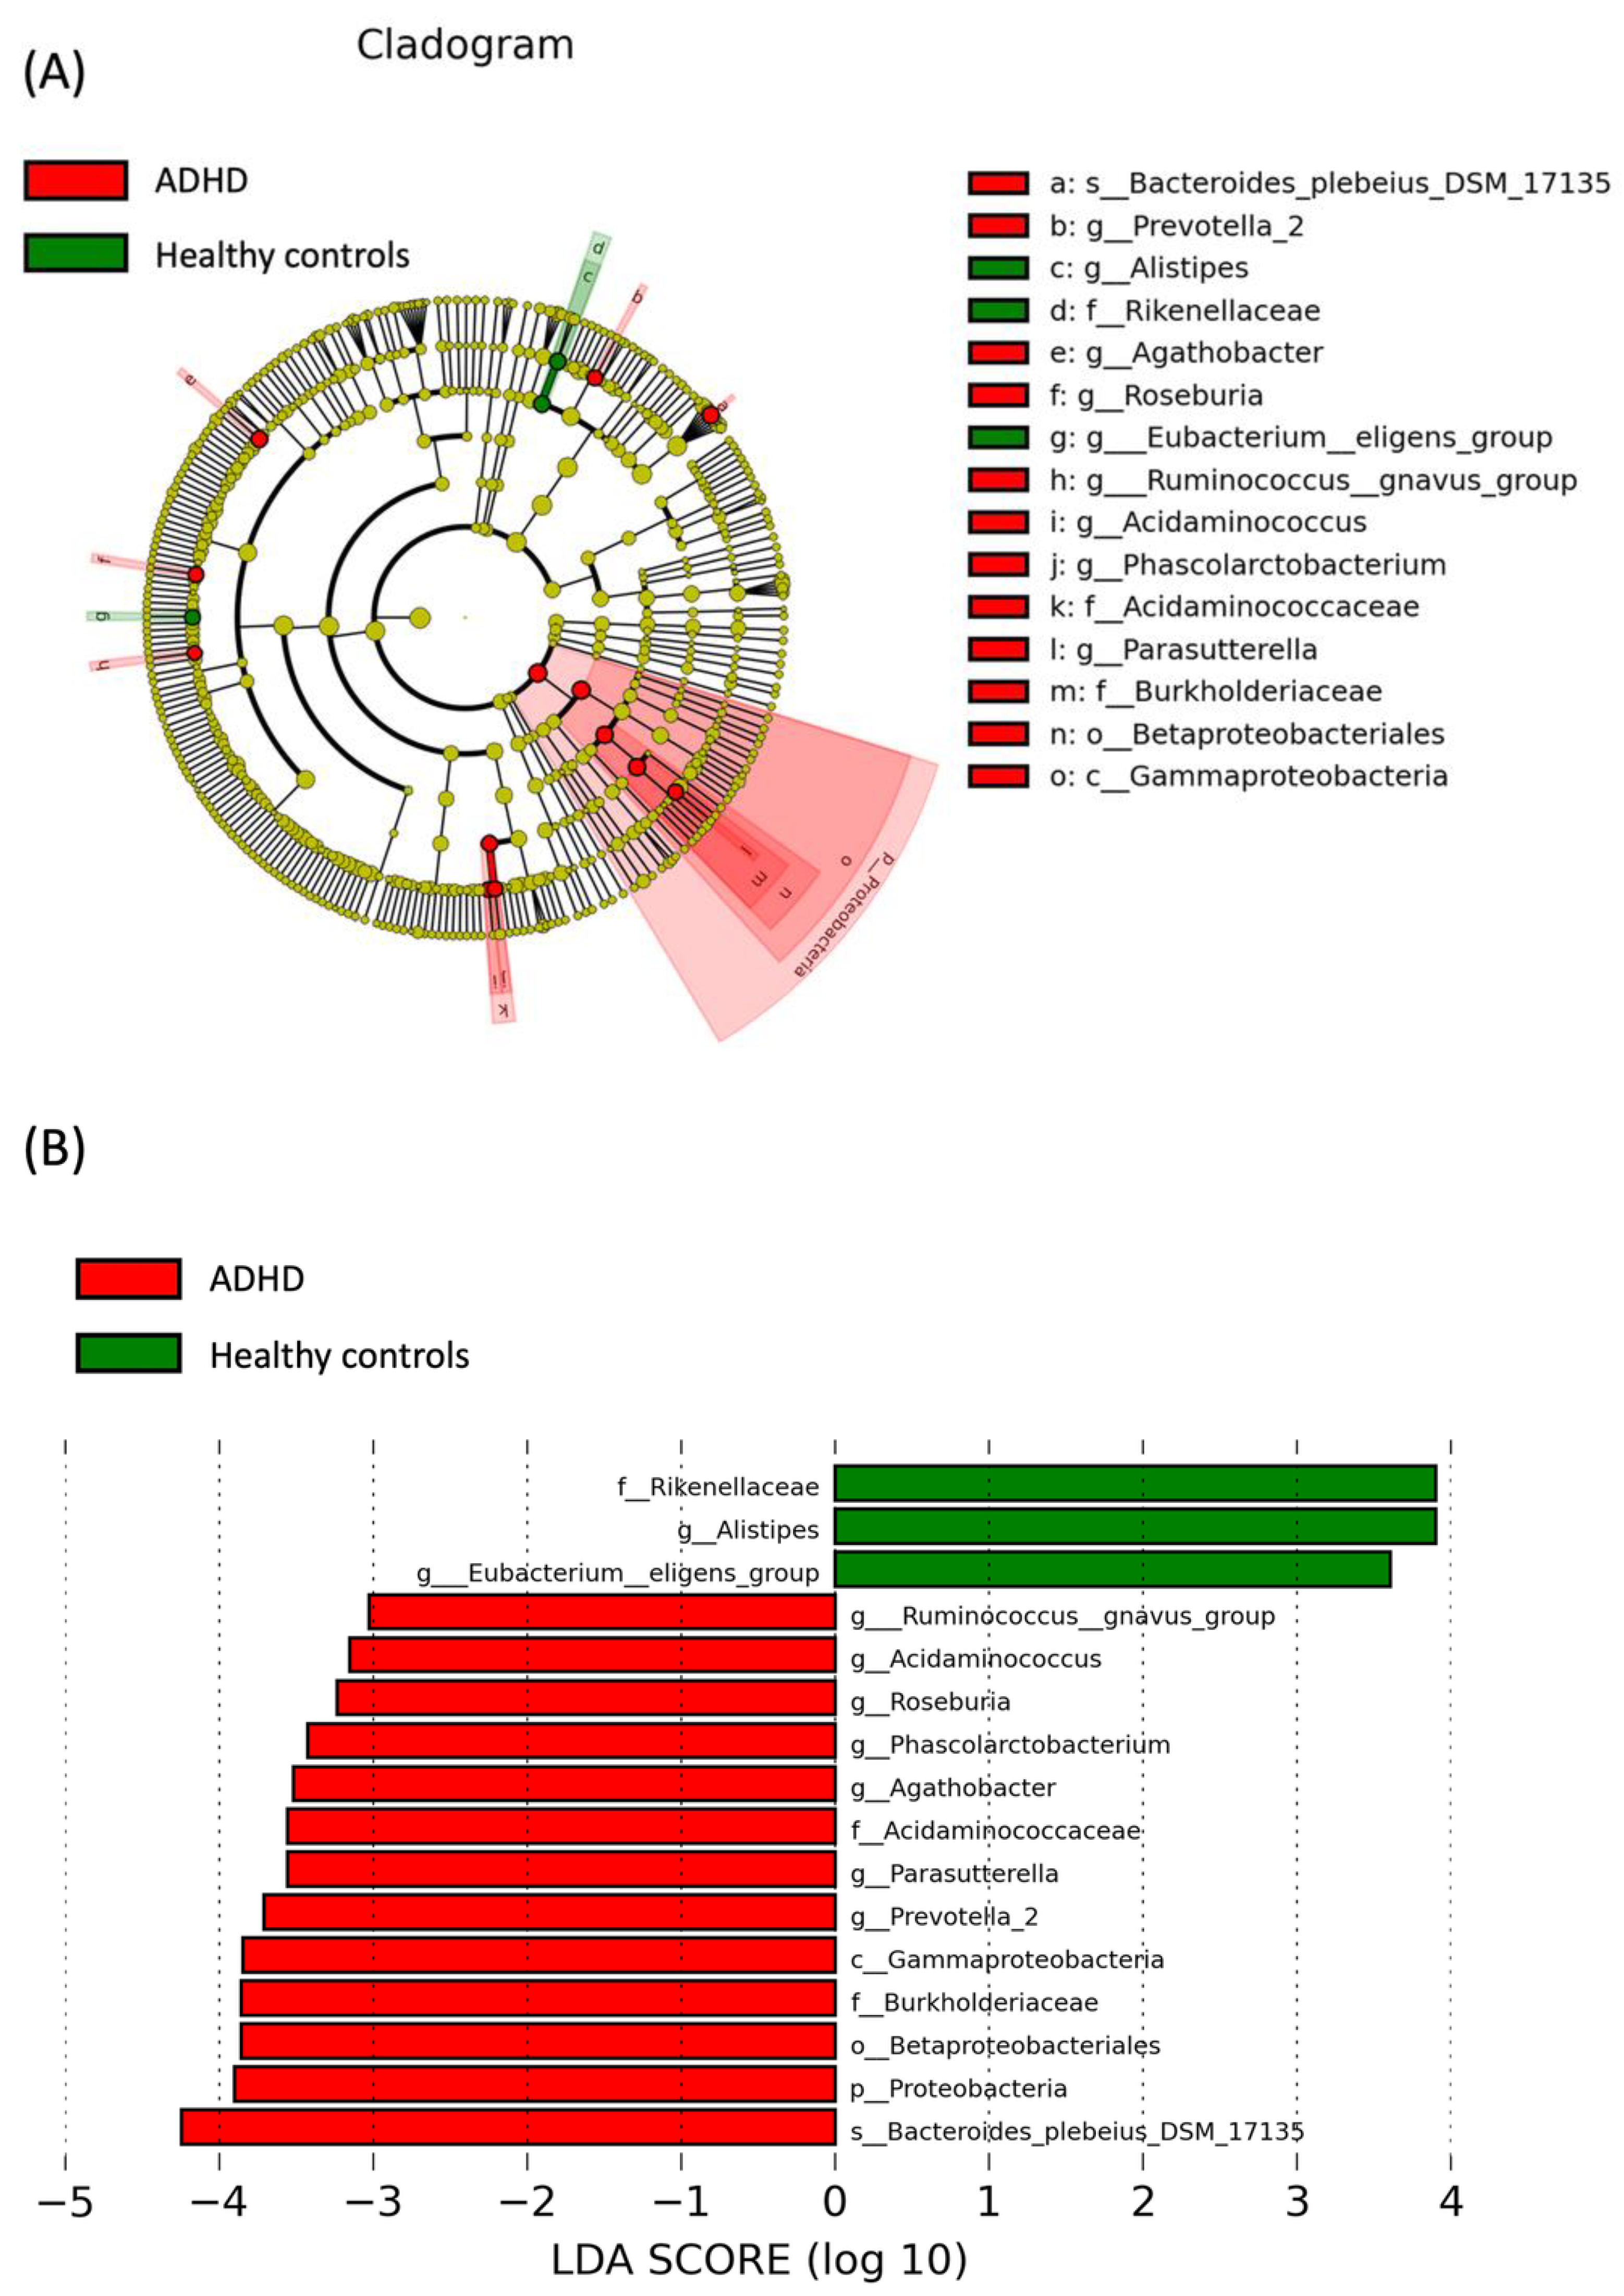
Microbial diversity was assessed either within a community (alpha diversity) or between the collection of samples (beta diversity). Alpha diversity indices, including the Simpson index, the Shannon diversity index, the ACE metric (Abundance-based Coverage Estimator), and Chao 1, were calculated using Kruskal-Wallis LSD post-hoc tests. No significant difference was evident between the children with and without ADHD in alpha diversity. Subsequently, we characterized beta diversity using UniFrac and PLS-DA and determined that the gut microbiota communities of the children with ADHD and the healthy controls were significantly different (unweighted UniFrac, p = 0.00; weighted UniFrac, p = 0.00; Figure 2 and Figure 3). Children without ADHD had larger variation in their gut microbiota composition than the ADHD children did.

3.3. LEfSe Analysis

We used LEfSe analysis to identify the specific bacteria phylotypes that were differentially altered between the ADHD and control groups (Figure 4). Significant differences were evident in the microbial community compositions of the two groups (the logarithmic LDA score threshold for discriminative features was set to 3.0). At the genus level, the relative abundance of Alistipes and the Eubacterium eligens group in the healthy group was significantly higher than in the ADHD group. At the family level, the relative abundance of Rikenellaceae in the healthy group was significantly higher than in the ADHD group. At the genus level, Acidaminococcaceae, Agathobacter, Phascolarctobacterium, Prevotella 2, Parasutterella, Acidaminococcus, Roseburia, and the Ruminococcus gnavus group were more abundant in the ADHD group than in the healthy group. Class Gammaproteobacteria, order Betaproteobacteriales, family Burkholderiaceae, and genus Parasutterella all belong to the phylum Proteobacteria (Figure 4).

3.4. Association between Clinical Symptoms and Relative Abundance of Bacteria

Table 2 shows the correlation between the relative abundance of bacteria and ADHD symptoms among participants with ADHD. No significant relationship was identified between SNAP-IV score and each bacteria taxon.
Table 3 presents the correlations between the relative abundance of bacteria and the CBCL scores of participants with ADHD. Withdrawal and depression symptoms were associated with Agathobacter (p = 0.02) and Acidaminococcus (p = 0.035). Somatic complaints were associated with Rikenellaceae (p = 0.016) and Alistipes (p = 0.016). Thought problems were associated with Acidaminococcus (p = 0.021). In addition to rule-breaking behavior, aggressive behavior and externalizing behavior were associated with the Ruminococcus gnavus group (p = 0.046, 0.031, and 0.036, respectively).
Furthermore, we examined the effect of each bacteria taxon on the CBCL symptoms among children with ADHD. We chose the bacteria which is more abundant among ADHD cohort than that of healthy control, including Agathobacter, Acidaminococcus and Ruminococcus gnavus group, and examined the association between the selected bacteria taxon and their correlated CBCL score by using a regression analysis and adjusting for sex, age, and SNAP-IV scores (Table 4). A significant association was noted between withdrawal and depression symptoms and Agathobacter (p = 0.044), and between rule-breaking behavior and the Ruminococcus gnavus group (p = 0.046).

4. Adjusted for Sex, Age and Score of SNAP-Iv Discussion

To the best of our knowledge, this is the first study to investigate the association between the selected bacteria and emotional–behavioral symptoms in children with ADHD. In the present study, we determined that Agathobacter, Acidaminococcus, Rikenellaceae, and Alistipes were associated with internalizing symptoms and the Ruminococcus gnavus group was associated with externalizing symptoms in children with ADHD. After controlling for confounding factors, including basic characteristics and SNAP-IV scores, the results indicated that Agathobacter was associated with withdrawal and depression symptoms and the Ruminococcus gnavus group was associated with rule-breaking behavior.
Previous research has reported that several bacteria were associated with clinical ADHD symptoms [2,19,20]. One Taiwanese study revealed that the relative abundance of Bacteroides was associated with clinical ADHD symptoms rated by SNAP-IV [2]. Another study from Germany also determined that Bacteroides was correlated with relatively high levels of hyperactivity and impulsivity [19]. However, they reported no significant correlations between the microbiome and the CBCL symptoms. A study in the Netherlands revealed that Ruminococcus was associated with inattention [20]. In our study, we did not identify any correlation between the bacteria and core symptoms of ADHD but did determine that Agathobacter and the Ruminococcus gnavus group were associated with CBCL symptoms. The discrepancy between our study and the Western studies may be attributed to ethnic differences and diet. The discrepancy between our study and another Taiwanese study may need further investigation with a larger sample size.
In our study, we found that the Ruminococcus gnavus group was associated with externalizing behavior (per the CBCL) in children with ADHD. Ruminococcus gnavus, an anaerobic, gram-positive microbiome, is common in the human gut [43]. Ruminococcus gnavus has been associated with several inflammatory diseases, including spondyloarthritis, eczema in infants, and Crohn disease [44,45,46,47,48,49]. Ruminococcus gnavus belongs to the family Ruminococcacceae, and the relative abundance of Ruminococcacceae has been reported to be linked to several psychiatric diseases, such as mood disorders, schizophrenia, autism, and ADHD [15,50,51,52]. One animal study reported that mice colonized with ADHD gut microbiota experienced an increase in anxious behavior and their structural and functional brain characteristics were affected [53]. Ruminococcus is involved in the metabolic pathway of complex sugar degradation and the degradation of mucin [54,55], which is vital for supplementing energy. Short-chain fatty acids (SCFAs), which are metabolites of Ruminococcus, are known to be key molecules that affect brain function and human behavior and potentially play a role in ADHD [56,57]. Further studies exploring how Ruminococcus affects emotional–behavioral symptoms in children with ADHD are required. Our study also noted that Agathobacter was associated with withdrawal and depression symptoms in children with ADHD. Agathobacter is an anaerobic, gram-positive bacterial genus from the family Lachnospiraceae. Similar to Ruminococcus, Agathobacter has been found to produce SCFAs [58,59]. Research has suggested that the level of SCFAs was relevant to inflammatory bowel conditions with comorbid depression and anxiety [60,61]. The abundance of Agathobacter has also been determined to be associated with ADHD and sleep problems in a population with autism spectrum disorder [62,63]. There is a paucity of information on the role of Agathobacter in the pathophysiology of depression. The mechanism underlying the association between Agathobacter and withdrawal and depression symptoms in children with ADHD requires further exploration.

Strengths and Limitations

This study has several limitations that should be noted. First, this study was conducted using a cross-sectional method and was unable to determine longitudinal changes and factors associated with the gut microbiota. Second, although we observed that several bacterial genera were correlated with ADHD clinical symptoms, no specific bacteria species were identified. Further gene mapping of bacteria is necessary to explore the mechanisms underpinning the association between the gut microbiota and ADHD. Third, we did not investigate diet in this study. Some specific diets (ie, vegan, gluten-free, paleo, low-carb, isoflavone intake) may influence the microbiota. Previous studies have reported that the Oriental diet is abundant in isoflavone, which may interact with microbiota and produce bioactive compounds contributing benefits including inducing nitric oxide production and anti-inflammatory effect on human health [64,65]. More research is needed to investigate the antioxidant capacity and anti-inflammatory effect of microbiota and elaborate the possible para-probiotics compounds to ameliorate emotional–behavioral symptoms in children with ADHD.

5. Conclusions

In conclusion, we determined that gut microbiome variability differs between children with ADHD and a healthy population. Two specific genera, Ruminococcu and Agathobacter, were determined to be associated with the emotional–behavioral symptoms of children with ADHD. Further study to explore the gut microbiome on ADHD should considered the effect of comorbid emotional–behavioral symptoms. The specific mechanisms responsible for the association between the gut microbiota and ADHD still require further investigation.

Author Contributions

M.-J.L.: Drafting and revising the manuscript. Accepts responsibility for the conduct of research and will give final approval. H.-C.L.: Revising the manuscript. Accepts responsibility for the conduct of research and will give final approval. Y.-L.K.: Analysis and interpretation of data. Accepts responsibility for the conduct of research and will give final approval. V.C.-H.C.: Study concept or design, and acquisition of data. Accepts responsibility for the conduct of research, study supervision, and will give final approval. All authors have read and agreed to the published version of the manuscript.

Funding

This work was supported by grants from the Chang Gung Memorial Hospital, Chiayi, Taiwan (grant number CMRPG6H0311, CMRPG6H0312).

Institutional Review Board Statement

The study was conducted according to the guidelines of the Declaration of Helsinki, and approved by the Institutional Review Board of Chang Gung Memorial Hospital in Taiwan approved our research protocol (IRB number: 201800402A3).

Informed Consent Statement

Informed consent was obtained from all subjects involved in the study.

Data Availability Statement

The data that support the findings of this study are available on request from the corresponding author. The data are not publicly available due to privacy or ethical restrictions.

Acknowledgments

The authors want to thank Chiayi Chang Gung memorial hospital for the assistance in the data analysis.

Conflicts of Interest

The authors declare no conflict of interest.

References

  1. Polanczyk, G.V.; Willcutt, E.G.; Salum, G.A.; Kieling, C.; Rohde, L.A. ADHD prevalence estimates across three decades: An updated systematic review and meta-regression analysis. Int. J. Epidemiol. 2014, 43, 434–442. [Google Scholar] [CrossRef] [PubMed]
  2. Wang, L.J.; Yang, C.Y.; Chou, W.J.; Lee, M.J.; Chou, M.C.; Kuo, H.C.; Yeh, Y.M.; Lee, S.Y.; Huang, L.H.; Li, S.C. Gut microbiota and dietary patterns in children with attention-deficit/hyperactivity disorder. Eur. Child Adolesc. Psychiatry 2020, 29, 287–297. [Google Scholar] [CrossRef] [PubMed]
  3. Chen, V.C.; Yang, Y.H.; Yu Kuo, T.; Lu, M.L.; Tseng, W.T.; Hou, T.Y.; Yeh, J.Y.; Lee, C.T.; Chen, Y.L.; Lee, M.J.; et al. Methylphenidate and the risk of burn injury among children with attention-deficit/hyperactivity disorder. Epidemiol. Psychiatr. Sci. 2020, 29, e146. [Google Scholar] [CrossRef]
  4. Faraone, S.V.; Rostain, A.L.; Blader, J.; Busch, B.; Childress, A.C.; Connor, D.F.; Newcorn, J.H. Practitioner Review: Emotional dysregulation in attention-deficit/hyperactivity disorder—Implications for clinical recognition and intervention. J. Child Psychol. Psychiatry 2019, 60, 133–150. [Google Scholar] [CrossRef]
  5. Surman, C.B.; Biederman, J.; Spencer, T.; Miller, C.A.; McDermott, K.M.; Faraone, S.V. Understanding deficient emotional self-regulation in adults with attention deficit hyperactivity disorder: A controlled study. Atten. Deficit Hyperact. Disord. 2013, 5, 273–281. [Google Scholar] [CrossRef] [Green Version]
  6. Gallo, E.F.; Posner, J. Moving towards causality in attention-deficit hyperactivity disorder: Overview of neural and genetic mechanisms. Lancet Psychiatry 2016, 3, 555–567. [Google Scholar] [CrossRef] [Green Version]
  7. Richarte, V.; Rosales, K.; Corrales, M.; Bellina, M.; Fadeuilhe, C.; Calvo, E.; Ibanez, P.; Sanchez-Mora, C.; Ribases, M.; Ramos-Quiroga, J.A. The gut-brain axis in attention deficit hyperactivity disorder: The role of the microbiota. Rev. Neurol. 2018, 66, S109–S114. [Google Scholar]
  8. Sandgren, A.M.; Brummer, R.J.M. ADHD-originating in the gut? The emergence of a new explanatory model. Med. Hypotheses 2018, 120, 135–145. [Google Scholar] [CrossRef]
  9. Lima-Ojeda, J.M.; Rupprecht, R.; Baghai, T.C. “I Am I and My Bacterial Circumstances”: Linking Gut Microbiome, Neurodevelopment, and Depression. Front. Psychiatry 2017, 8, 153. [Google Scholar] [CrossRef] [Green Version]
  10. Cenit, M.C.; Sanz, Y.; Codoñer-Franch, P. Influence of gut microbiota on neuropsychiatric disorders. World J. Gastroenterol. 2017, 23, 5486–5498. [Google Scholar] [CrossRef] [Green Version]
  11. Malan-Muller, S.; Valles-Colomer, M.; Raes, J.; Lowry, C.A.; Seedat, S.; Hemmings, S.M.J. The Gut Microbiome and Mental Health: Implications for Anxiety- and Trauma-Related Disorders. Omics 2018, 22, 90–107. [Google Scholar] [CrossRef] [PubMed]
  12. Cenit, M.C.; Nuevo, I.C.; Codoñer-Franch, P.; Dinan, T.G.; Sanz, Y. Gut microbiota and attention deficit hyperactivity disorder: New perspectives for a challenging condition. Eur. Child Adolesc. Psychiatry 2017, 26, 1081–1092. [Google Scholar] [CrossRef] [PubMed]
  13. Srikantha, P.; Mohajeri, M.H. The Possible Role of the Microbiota-Gut-Brain-Axis in Autism Spectrum Disorder. Int. J. Mol. Sci. 2019, 20, 2115. [Google Scholar] [CrossRef] [PubMed] [Green Version]
  14. Clarke, G.; Grenham, S.; Scully, P.; Fitzgerald, P.; Moloney, R.D.; Shanahan, F.; Dinan, T.G.; Cryan, J.F. The microbiome-gut-brain axis during early life regulates the hippocampal serotonergic system in a sex-dependent manner. Mol. Psychiatry 2013, 18, 666–673. [Google Scholar] [CrossRef] [Green Version]
  15. Jiang, H.; Ling, Z.; Zhang, Y.; Mao, H.; Ma, Z.; Yin, Y.; Wang, W.; Tang, W.; Tan, Z.; Shi, J.; et al. Altered fecal microbiota composition in patients with major depressive disorder. Brain Behav. Immun. 2015, 48, 186–194. [Google Scholar] [CrossRef] [Green Version]
  16. Aarts, E.; Ederveen, T.H.A.; Naaijen, J.; Zwiers, M.P.; Boekhorst, J.; Timmerman, H.M.; Smeekens, S.P.; Netea, M.G.; Buitelaar, J.K.; Franke, B.; et al. Gut microbiome in ADHD and its relation to neural reward anticipation. PLoS ONE 2017, 12, e0183509. [Google Scholar] [CrossRef] [Green Version]
  17. Jiang, H.Y.; Zhou, Y.Y.; Zhou, G.L.; Li, Y.C.; Yuan, J.; Li, X.H.; Ruan, B. Gut microbiota profiles in treatment-naïve children with attention deficit hyperactivity disorder. Behav. Brain Res. 2018, 347, 408–413. [Google Scholar] [CrossRef]
  18. Wan, L.; Ge, W.R.; Zhang, S.; Sun, Y.L.; Wang, B.; Yang, G. Case-Control Study of the Effects of Gut Microbiota Composition on Neurotransmitter Metabolic Pathways in Children With Attention Deficit Hyperactivity Disorder. Front. Neurosci. 2020, 14, 127. [Google Scholar] [CrossRef] [Green Version]
  19. Prehn-Kristensen, A.; Zimmermann, A.; Tittmann, L.; Lieb, W.; Schreiber, S.; Baving, L.; Fischer, A. Reduced microbiome alpha diversity in young patients with ADHD. PLoS ONE 2018, 13, e0200728. [Google Scholar] [CrossRef] [Green Version]
  20. Szopinska-Tokov, J.; Dam, S.; Naaijen, J.; Konstanti, P.; Rommelse, N.; Belzer, C.; Buitelaar, J.; Franke, B.; Aarts, E.; Arias Vasquez, A. Investigating the Gut Microbiota Composition of Individuals with Attention-Deficit/Hyperactivity Disorder and Association with Symptoms. Microorganisms 2020, 8, 406. [Google Scholar] [CrossRef] [Green Version]
  21. Reale, L.; Bartoli, B.; Cartabia, M.; Zanetti, M.; Costantino, M.A.; Canevini, M.P.; Termine, C.; Bonati, M. Comorbidity prevalence and treatment outcome in children and adolescents with ADHD. Eur. Child Adolesc. Psychiatry 2017, 26, 1443–1457. [Google Scholar] [CrossRef] [PubMed]
  22. Bussing, R.; Fernandez, M.; Harwood, M.; Wei, H.; Garvan, C.W.; Eyberg, S.M.; Swanson, J.M. Parent and teacher SNAP-IV ratings of attention deficit hyperactivity disorder symptoms: Psychometric properties and normative ratings from a school district sample. Assessment 2008, 15, 317–328. [Google Scholar] [CrossRef] [PubMed] [Green Version]
  23. Magoč, T.; Salzberg, S.L. FLASH: Fast length adjustment of short reads to improve genome assemblies. Bioinformatics 2011, 27, 2957–2963. [Google Scholar] [CrossRef] [PubMed] [Green Version]
  24. Caporaso, J.G.; Kuczynski, J.; Stombaugh, J.; Bittinger, K.; Bushman, F.D.; Costello, E.K.; Fierer, N.; Peña, A.G.; Goodrich, J.K.; Gordon, J.I.; et al. QIIME allows analysis of high-throughput community sequencing data. Nat. Methods 2010, 7, 335–336. [Google Scholar] [CrossRef] [Green Version]
  25. Edgar, R.C.; Haas, B.J.; Clemente, J.C.; Quince, C.; Knight, R. UCHIME improves sensitivity and speed of chimera detection. Bioinformatics 2011, 27, 2194–2200. [Google Scholar] [CrossRef] [Green Version]
  26. Wang, Q.; Garrity, G.M.; Tiedje, J.M.; Cole, J.R. Naive Bayesian classifier for rapid assignment of rRNA sequences into the new bacterial taxonomy. Appl. Environ. Microbiol. 2007, 73, 5261–5267. [Google Scholar] [CrossRef] [Green Version]
  27. Quast, C.; Pruesse, E.; Yilmaz, P.; Gerken, J.; Schweer, T.; Yarza, P.; Peplies, J.; Glöckner, F.O. The SILVA ribosomal RNA gene database project: Improved data processing and web-based tools. Nucleic Acids Res. 2013, 41, D590–D596. [Google Scholar] [CrossRef]
  28. DeSantis, T.Z.; Hugenholtz, P.; Larsen, N.; Rojas, M.; Brodie, E.L.; Keller, K.; Huber, T.; Dalevi, D.; Hu, P.; Andersen, G.L. Greengenes, a chimera-checked 16S rRNA gene database and workbench compatible with ARB. Appl. Environ. Microbiol. 2006, 72, 5069–5072. [Google Scholar] [CrossRef] [Green Version]
  29. McDonald, D.; Price, M.N.; Goodrich, J.; Nawrocki, E.P.; DeSantis, T.Z.; Probst, A.; Andersen, G.L.; Knight, R.; Hugenholtz, P. An improved Greengenes taxonomy with explicit ranks for ecological and evolutionary analyses of bacteria and archaea. ISME J. 2012, 6, 610–618. [Google Scholar] [CrossRef]
  30. Chen, T.; Yu, W.H.; Izard, J.; Baranova, O.V.; Lakshmanan, A.; Dewhirst, F.E. The Human Oral Microbiome Database: A web accessible resource for investigating oral microbe taxonomic and genomic information. Database 2010, 2010, baq013. [Google Scholar] [CrossRef] [Green Version]
  31. Escapa, I.F.; Chen, T.; Huang, Y.; Gajare, P.; Dewhirst, F.E.; Lemon, K.P. New Insights into Human Nostril Microbiome from the Expanded Human Oral Microbiome Database (eHOMD): A Resource for the Microbiome of the Human Aerodigestive Tract. mSystems 2018, 3, e00187-18. [Google Scholar] [CrossRef] [PubMed]
  32. Yilmaz, P.; Parfrey, L.W.; Yarza, P.; Gerken, J.; Pruesse, E.; Quast, C.; Schweer, T.; Peplies, J.; Ludwig, W.; Glöckner, F.O. The SILVA and “All-species Living Tree Project (LTP)” taxonomic frameworks. Nucleic Acids Res. 2014, 42, D643–D648. [Google Scholar] [CrossRef] [PubMed] [Green Version]
  33. Caporaso, J.G.; Bittinger, K.; Bushman, F.D.; DeSantis, T.Z.; Andersen, G.L.; Knight, R. PyNAST: A flexible tool for aligning sequences to a template alignment. Bioinformatics 2010, 26, 266–267. [Google Scholar] [CrossRef] [PubMed] [Green Version]
  34. Price, M.N.; Dehal, P.S.; Arkin, A.P. FastTree 2—Approximately maximum-likelihood trees for large alignments. PLoS ONE 2010, 5, e9490. [Google Scholar] [CrossRef]
  35. Price, M.N.; Dehal, P.S.; Arkin, A.P. FastTree: Computing large minimum evolution trees with profiles instead of a distance matrix. Mol. Biol. Evol. 2009, 26, 1641–1650. [Google Scholar] [CrossRef]
  36. Gau, S.S.; Shang, C.Y.; Liu, S.K.; Lin, C.H.; Swanson, J.M.; Liu, Y.C.; Tu, C.L. Psychometric properties of the Chinese version of the Swanson, Nolan, and Pelham, version IV scale–parent form. Int. J. Methods Psychiatr. Res. 2008, 17, 35–44. [Google Scholar] [CrossRef]
  37. Leung, P.W.; Kwong, S.L.; Tang, C.P.; Ho, T.P.; Hung, S.F.; Lee, C.C.; Hong, S.L.; Chiu, C.M.; Liu, W.S. Test-retest reliability and criterion validity of the Chinese version of CBCL, TRF, and YSR. J. Child Psychol. Psychiatry 2006, 47, 970–973. [Google Scholar] [CrossRef]
  38. Yang, H.J.; Soong, W.T.; Chiang, C.N.; Chen, W.J. Competence and behavioral/emotional problems among Taiwanese adolescents as reported by parents and teachers. J. Am. Acad. Child Adolesc. Psychiatry 2000, 39, 232–239. [Google Scholar] [CrossRef]
  39. Schloss, P.D.; Westcott, S.L.; Ryabin, T.; Hall, J.R.; Hartmann, M.; Hollister, E.B.; Lesniewski, R.A.; Oakley, B.B.; Parks, D.H.; Robinson, C.J.; et al. Introducing mothur: Open-source, platform-independent, community-supported software for describing and comparing microbial communities. Appl. Environ. Microbiol. 2009, 75, 7537–7541. [Google Scholar] [CrossRef] [Green Version]
  40. Lozupone, C.; Lladser, M.E.; Knights, D.; Stombaugh, J.; Knight, R. UniFrac: An effective distance metric for microbial community comparison. ISME J. 2011, 5, 169–172. [Google Scholar] [CrossRef] [Green Version]
  41. Lozupone, C.; Knight, R. UniFrac: A new phylogenetic method for comparing microbial communities. Appl. Environ. Microbiol. 2005, 71, 8228–8235. [Google Scholar] [CrossRef] [PubMed]
  42. Segata, N.; Izard, J.; Waldron, L.; Gevers, D.; Miropolsky, L.; Garrett, W.S.; Huttenhower, C. Metagenomic biomarker discovery and explanation. Genome Biol. 2011, 12, R60. [Google Scholar] [CrossRef] [PubMed] [Green Version]
  43. Qin, J.; Li, R.; Raes, J.; Arumugam, M.; Burgdorf, K.S.; Manichanh, C.; Nielsen, T.; Pons, N.; Levenez, F.; Yamada, T.; et al. A human gut microbial gene catalogue established by metagenomic sequencing. Nature 2010, 464, 59–65. [Google Scholar] [CrossRef] [PubMed] [Green Version]
  44. Breban, M.; Tap, J.; Leboime, A.; Said-Nahal, R.; Langella, P.; Chiocchia, G.; Furet, J.P.; Sokol, H. Faecal microbiota study reveals specific dysbiosis in spondyloarthritis. Ann. Rheum. Dis. 2017, 76, 1614–1622. [Google Scholar] [CrossRef] [PubMed]
  45. Zheng, H.; Liang, H.; Wang, Y.; Miao, M.; Shi, T.; Yang, F.; Liu, E.; Yuan, W.; Ji, Z.S.; Li, D.K. Altered Gut Microbiota Composition Associated with Eczema in Infants. PLoS ONE 2016, 11, e0166026. [Google Scholar] [CrossRef] [Green Version]
  46. Henke, M.T.; Kenny, D.J.; Cassilly, C.D.; Vlamakis, H.; Xavier, R.J.; Clardy, J. Ruminococcus gnavus, a member of the human gut microbiome associated with Crohn’s disease, produces an inflammatory polysaccharide. Proc. Natl. Acad. Sci. USA 2019, 116, 12672–12677. [Google Scholar] [CrossRef] [Green Version]
  47. Willing, B.P.; Dicksved, J.; Halfvarson, J.; Andersson, A.F.; Lucio, M.; Zheng, Z.; Järnerot, G.; Tysk, C.; Jansson, J.K.; Engstrand, L. A pyrosequencing study in twins shows that gastrointestinal microbial profiles vary with inflammatory bowel disease phenotypes. Gastroenterology 2010, 139, 1844–1854.e1841. [Google Scholar] [CrossRef]
  48. Joossens, M.; Huys, G.; Cnockaert, M.; De Preter, V.; Verbeke, K.; Rutgeerts, P.; Vandamme, P.; Vermeire, S. Dysbiosis of the faecal microbiota in patients with Crohn’s disease and their unaffected relatives. Gut 2011, 60, 631–637. [Google Scholar] [CrossRef] [Green Version]
  49. Hall, A.B.; Yassour, M.; Sauk, J.; Garner, A.; Jiang, X.; Arthur, T.; Lagoudas, G.K.; Vatanen, T.; Fornelos, N.; Wilson, R.; et al. A novel Ruminococcus gnavus clade enriched in inflammatory bowel disease patients. Genome Med. 2017, 9, 103. [Google Scholar] [CrossRef]
  50. Painold, A.; Mörkl, S.; Kashofer, K.; Halwachs, B.; Dalkner, N.; Bengesser, S.; Birner, A.; Fellendorf, F.; Platzer, M.; Queissner, R.; et al. A step ahead: Exploring the gut microbiota in inpatients with bipolar disorder during a depressive episode. Bipolar Disord. 2019, 21, 40–49. [Google Scholar] [CrossRef] [Green Version]
  51. Nguyen, T.T.; Kosciolek, T.; Maldonado, Y.; Daly, R.E.; Martin, A.S.; McDonald, D.; Knight, R.; Jeste, D.V. Differences in gut microbiome composition between persons with chronic schizophrenia and healthy comparison subjects. Schizophr. Res. 2019, 204, 23–29. [Google Scholar] [CrossRef]
  52. Rose, D.R.; Yang, H.; Serena, G.; Sturgeon, C.; Ma, B.; Careaga, M.; Hughes, H.K.; Angkustsiri, K.; Rose, M.; Hertz-Picciotto, I.; et al. Differential immune responses and microbiota profiles in children with autism spectrum disorders and co-morbid gastrointestinal symptoms. Brain Behav. Immun. 2018, 70, 354–368. [Google Scholar] [CrossRef] [PubMed]
  53. Tengeler, A.C.; Dam, S.A.; Wiesmann, M.; Naaijen, J.; van Bodegom, M.; Belzer, C.; Dederen, P.J.; Verweij, V.; Franke, B.; Kozicz, T.; et al. Gut microbiota from persons with attention-deficit/hyperactivity disorder affects the brain in mice. Microbiome 2020, 8, 44. [Google Scholar] [CrossRef] [PubMed] [Green Version]
  54. Cervera-Tison, M.; Tailford, L.E.; Fuell, C.; Bruel, L.; Sulzenbacher, G.; Henrissat, B.; Berrin, J.G.; Fons, M.; Giardina, T.; Juge, N. Functional analysis of family GH36 α-galactosidases from Ruminococcus gnavus E1: Insights into the metabolism of a plant oligosaccharide by a human gut symbiont. Appl. Environ. Microbiol. 2012, 78, 7720–7732. [Google Scholar] [CrossRef] [PubMed] [Green Version]
  55. Crost, E.H.; Tailford, L.E.; Le Gall, G.; Fons, M.; Henrissat, B.; Juge, N. Utilisation of mucin glycans by the human gut symbiont Ruminococcus gnavus is strain-dependent. PLoS ONE 2013, 8, e76341. [Google Scholar] [CrossRef] [Green Version]
  56. Dam, S.A.; Mostert, J.C.; Szopinska-Tokov, J.W.; Bloemendaal, M.; Amato, M.; Arias-Vasquez, A. The Role of the Gut-Brain Axis in Attention-Deficit/Hyperactivity Disorder. Gastroenterol. Clin. N. Am. 2019, 48, 407–431. [Google Scholar] [CrossRef]
  57. Liu, S.; Li, E.; Sun, Z.; Fu, D.; Duan, G.; Jiang, M.; Yu, Y.; Mei, L.; Yang, P.; Tang, Y.; et al. Altered gut microbiota and short chain fatty acids in Chinese children with autism spectrum disorder. Sci. Rep. 2019, 9, 287. [Google Scholar] [CrossRef] [PubMed] [Green Version]
  58. Rosero, J.A.; Killer, J.; Sechovcová, H.; Mrázek, J.; Benada, O.; Fliegerová, K.; Havlík, J.; Kopečný, J. Reclassification of Eubacterium rectale (Hauduroy et al. 1937) Prévot 1938 in a new genus Agathobacter gen. nov. as Agathobacter rectalis comb. nov., and description of Agathobacter ruminis sp. nov., isolated from the rumen contents of sheep and cows. Int. J. Syst. Evol. Microbiol. 2016, 66, 768–773. [Google Scholar] [CrossRef] [PubMed]
  59. Macfarlane, G.T.; Macfarlane, S. Fermentation in the human large intestine: Its physiologic consequences and the potential contribution of prebiotics. J. Clin. Gastroenterol. 2011, 45, S120–S127. [Google Scholar] [CrossRef] [Green Version]
  60. Cheung, S.G.; Goldenthal, A.R.; Uhlemann, A.C.; Mann, J.J.; Miller, J.M.; Sublette, M.E. Systematic Review of Gut Microbiota and Major Depression. Front. Psychiatry 2019, 10, 34. [Google Scholar] [CrossRef] [Green Version]
  61. Bhandari, S.; Larson, M.E.; Kumar, N.; Stein, D. Association of Inflammatory Bowel Disease (IBD) with Depressive Symptoms in the United States Population and Independent Predictors of Depressive Symptoms in an IBD Population: A NHANES Study. Gut Liver 2017, 11, 512–519. [Google Scholar] [CrossRef] [PubMed]
  62. Wang, L.J.; Li, S.C.; Li, S.W.; Kuo, H.C.; Lee, S.Y.; Huang, L.H.; Chin, C.Y.; Yang, C.Y. Gut microbiota and plasma cytokine levels in patients with attention-deficit/hyperactivity disorder. Transl. Psychiatry 2022, 12, 76. [Google Scholar] [CrossRef] [PubMed]
  63. Hua, X.; Zhu, J.; Yang, T.; Guo, M.; Li, Q.; Chen, J.; Li, T. The Gut Microbiota and Associated Metabolites Are Altered in Sleep Disorder of Children With Autism Spectrum Disorders. Front. Psychiatry 2020, 11, 855. [Google Scholar] [CrossRef] [PubMed]
  64. Ma, L.; Liu, G.; Ding, M.; Zong, G.; Hu, F.B.; Willett, W.C.; Rimm, E.B.; Manson, J.E.; Sun, Q. Isoflavone Intake and the Risk of Coronary Heart Disease in US Men and Women: Results from 3 Prospective Cohort Studies. Circulation 2020, 141, 1127–1137. [Google Scholar] [CrossRef]
  65. Curtis, P.J.; Sampson, M.; Potter, J.; Dhatariya, K.; Kroon, P.A.; Cassidy, A. Chronic ingestion of flavan-3-ols and isoflavones improves insulin sensitivity and lipoprotein status and attenuates estimated 10-year CVD risk in medicated postmenopausal women with type 2 diabetes: A 1-year, double-blind, randomized, controlled trial. Diabetes Care 2012, 35, 226–232. [Google Scholar] [CrossRef]
Figure 1. Flowchart of enrollment of the study participants.
Jpm 12 01634 g001
Figure 2. Beta diversity using unweighted and weighted uniFrac. Comparison of beta diversity measurements in ADHD children with treatment-naïve and healthy controls. Beta diversity, measured by unweighted (A) and weighted (B) unique fraction (UniFrac) is plotted for ADHD children with treatment-naïve (orange) and healthy controls (blue). The line inside the box represents the median, while the whiskers represent the lowest and highest values within the 1.5 interquartile range. Outliers as well as individual samples are shown as dots. The results indicated that there was significant difference in the gut microbiota communities between ADHD children with treatment-naïve and healthy controls.
Jpm 12 01634 g002
Figure 3. PLS−DA. Partial Least Squares Discriminant Analysis (PLS−DA) of ADHD children with treatment-naïve and healthy controls. Each point represents a sample. The orange points represent ADHD children with treatment-naïve and the blue points represent healthy controls.
Jpm 12 01634 g003
Figure 4. Linear discriminant effect size (LEfSe) analysis. Comparison of microbiota relative abundance at the genus level between ADHD children with treatment-naïve and healthy controls using LEfSe cladograms (A) and histogram of linear discriminant analysis (LDA, B). The bacterial difference was identified by Kruskal-Wallis test. Nominal significant threshold: p < 0.05.
Jpm 12 01634 g004
Table 1. Baseline characteristics of ADHD children with treatment-naïve and health controls.
ADHD Children with Treatment-Naïve
(N = 54)
Healthy Controls
(N = 22)
p-ValueEffect Size a
Sex, n (%) 0.042 *3.046
 Male44 (81.5%)13 (59.1%)
 Female10 (18.5%)9 (40.9%)
Age (mean ± SD year)8.39 (1.75)9.73 (2.23)0.007 *0.669
BMI (mean ± SD)18.32 (3.91)19.87 (3.72)0.1120.406
Preterm birth, n (%)5 (9.3%)2 (9.1%)0.6751.020
Allergic rhinitis, n (%)19 (35.2%)7 (31.8%)0.4991.163
SNAP-IV
 Inattention (SD)15.15 (5.7)4.5 (4.53)<0.001 *2.069
 Hyperactivity/Impulsivity (SD)11.65 (6.37)3.41 (4.67)<0.001 *1.475
 Opposition/defiance (SD)9.83 (6.26)5.64 (5.28)0.007 *0.724
 Total Score (SD)26.8 (10.58)7.91 (8.19)<0.001 *1.997
CBCL syndromes, median (SD)
 Anxious/Depressed59.15 (8.72)54.91 (7.09)0.047 *0.534
 Withdrawn/Depressed60.41 (9.26)55.82 (5.35)0.033 *0.607
 Somatic Complaints56.7 (5.79)53.95 (5.75)0.0640.477
 Social Problems63.72 (8.33)55.5 (8.76)<0.001 *0.962
 Thought Problems59.52 (7.91)53.45 (5.35)0.002 *0.899
 Attention Problems68.93 (9.8)55.45 (6.06)<0.001 *1.654
 Rule-Breaking Behavior62.2 (7.94)53.86 (5.33)<0.001 *1.233
 Aggressive Behavior62.59 (8.56)53.91 (5.42)<0.001 *1.212
 Internalising58.48 (10.54)51.36 (10.09)0.009 *0.690
 Externalising62.41 (9.36)49.77 (9.05)<0.001 *1.373
 Total Score64.22 (8.63)50.09 (11.21)<0.001 *1.413
* p < 0.05; a Effect size was analyzed using Cohen’s d for continuous variables and odds ratio for categorical variables.
Table 2. The correlation between relative abundance of microbiota and clinical symptoms of attention-deficit/hyperactivity disorder (ADHD) according to SNAP-IV.
GeneraInattentionHyperactivity/ImpulsivityTotal Score
rprprp
Proteobacteria0.0180.8990.0120.9320.0410.768
Gammaproteobacteria−0.0650.641−0.0300.829−0.0220.874
Betaproteobacteriales0.0780.575−0.0820.5580.0070.959
Burkholderiaceae0.0780.575−0.0820.5580.0070.959
Acidaminococcaceae−0.1070.443−0.1250.368−0.1200.389
Agathobacter0.2360.0860.1760.2040.2360.086
Phascolarctobacterium−0.0700.617−0.1090.433−0.0970.485
Prevotella_20.1340.336−0.0710.6120.0210.881
Parasutterella0.1080.437−0.0420.7620.0370.793
Acidaminococcus0.1160.4020.0820.5580.1240.372
Roseburia0.0240.8640.1340.3330.0900.518
Ruminococcus_gnavus_group−0.0540.7000.0700.6150.0160.906
Bacteroides_plebeius_DSM_171350.1570.2560.0390.7790.0940.498
Rikenellaceae−0.0740.743−0.0220.921−0.0320.888
Alistipes−0.0740.743−0.0220.921−0.0320.888
Eubacterium_eligens_group0.2890.191−0.0570.8010.1240.582
Table 3. The correlation between relative abundance of microbiota and comorbid emotional-behavioral symptoms of attention-deficit/hyperactivity disorder (ADHD) according to Child Behavior Checklist (CBCL).
GeneraWithdrawn
/Depressed
Somatic ComplaintsSocial ProblemsThought ProblemsAttention ProblemsRule-Breaking BehaviorAggressive BehaviorInternalizingExternalizingTotal Score
rprprprprprprprprprp
Proteobacteria0.2100.1270.2250.1020.1530.2680.1190.3930.1520.2730.1060.4460.1620.2420.2220.1070.1480.2840.1920.165
Gammaproteobacteria0.1970.1540.1900.1680.1800.1940.0810.5600.1260.3640.1090.4330.1550.2630.2100.1270.1500.2800.1800.193
Betaproteobacteriales0.0570.6830.0230.870−0.0710.610−0.0530.705−0.1420.305−0.0430.757−0.0670.630−0.0250.860−0.0760.586−0.0950.495
Burkholderiaceae0.0570.6830.0230.870−0.0710.610−0.0530.705−0.1420.305−0.0430.757−0.0670.630−0.0250.860−0.0760.586−0.0950.495
Acidaminococcaceae−0.0390.7790.0730.602−0.0770.5820.1220.380−0.0260.853−0.0490.726−0.0510.7160.0400.774−0.0570.680−0.0300.832
Agathobacter0.3170.020 *0.1190.3910.2410.0790.2500.0690.1200.3890.1620.2410.0830.5510.1460.2920.1090.4310.1840.184
Phascolarctobacterium−0.1390.3180.1040.454−0.1610.2440.0420.762−0.0490.727−0.1320.341−0.1350.331−0.0320.816−0.1440.299−0.1070.442
Prevotella_20.0000.999−0.0190.8940.0950.494−0.0190.890−0.0970.4850.0810.5620.0610.661−0.0380.7880.0970.4860.0290.838
Parasutterella−0.0440.7500.0060.963−0.1550.264−0.0170.901−0.1560.259−0.1600.248−0.1340.335−0.0600.668−0.1610.246−0.1480.287
Acidaminococcus0.2880.035 *0.0820.5560.2230.1050.3130.021 *0.2020.1430.2240.1040.2040.1400.1540.2650.2210.1080.2440.076
Roseburia−0.0580.678−0.1030.4610.1040.4560.0030.986−0.0730.5990.0580.6780.0300.828−0.0950.4930.0560.6850.0100.943
Ruminococcus_gnavus_group0.1950.1570.1510.2770.1750.2050.2640.0540.2420.0770.2720.046 *0.2950.031 *0.2510.0680.2850.036 *0.2910.033 *
Bacteroides_plebeius_DSM_17135−0.0330.8140.0270.845−0.0800.5670.0080.9530.0580.678−0.1040.454−0.1130.416−0.0600.664−0.0900.518−0.0350.799
Rikenellaceae−0.1310.5620.5050.016 *0.1190.5980.0880.6970.0580.799−0.1380.5400.1620.4720.3410.1210.0380.8680.2250.315
Alistipes−0.1310.5620.5050.016 *0.1190.5980.0880.6970.0580.799−0.1380.5400.1620.4720.3410.1210.0380.8680.2250.315
Eubacterium_eligens_group−0.2240.317−0.1120.6200.0480.8320.1080.634−0.0220.923−0.1120.620−0.2100.348−0.1130.615−0.2170.332−0.1000.658
* p < 0.05.
Table 4. Multiple regression analysis of the taxonomic association between gut microbiota and comorbid emotional-behavioral symptoms of attention-deficit/hyperactivity disorder (ADHD) according to Child Behavior Checklist (CBCL).
GeneraWithdrawn/DepressedThought ProblemsRule-Breaking BehaviorAggressive Behavior
BSEp ValueBSEp ValueBSEp ValueBSEp Value
Agathobacter0.0020.0010.044 *
Acidaminococcus0.0030.0020.1240.0020.0010.079
Ruminococcus_gnavus_group 0.0050.0030.046 *0.0040.0030.111
* p < 0.05.
Publisher’s Note: MDPI stays neutral with regard to jurisdictional claims in published maps and institutional affiliations.

