

Implementing the Risk Stratification and Clinical Management of Breast Cancer Families Using Polygenic Risk Score Evaluation: A Pilot Study

 , , ,
, , ,  and
and 
Abstract
:1. Introduction
2. Materials and Methods
2.1. Patients’ Selection
2.2. DNA Extraction and Whole Genome Sequencing
2.3. Polygenic Risk Score Assessment
2.4. Evaluation of Adjusted Lifetime BC Risk
3. Results
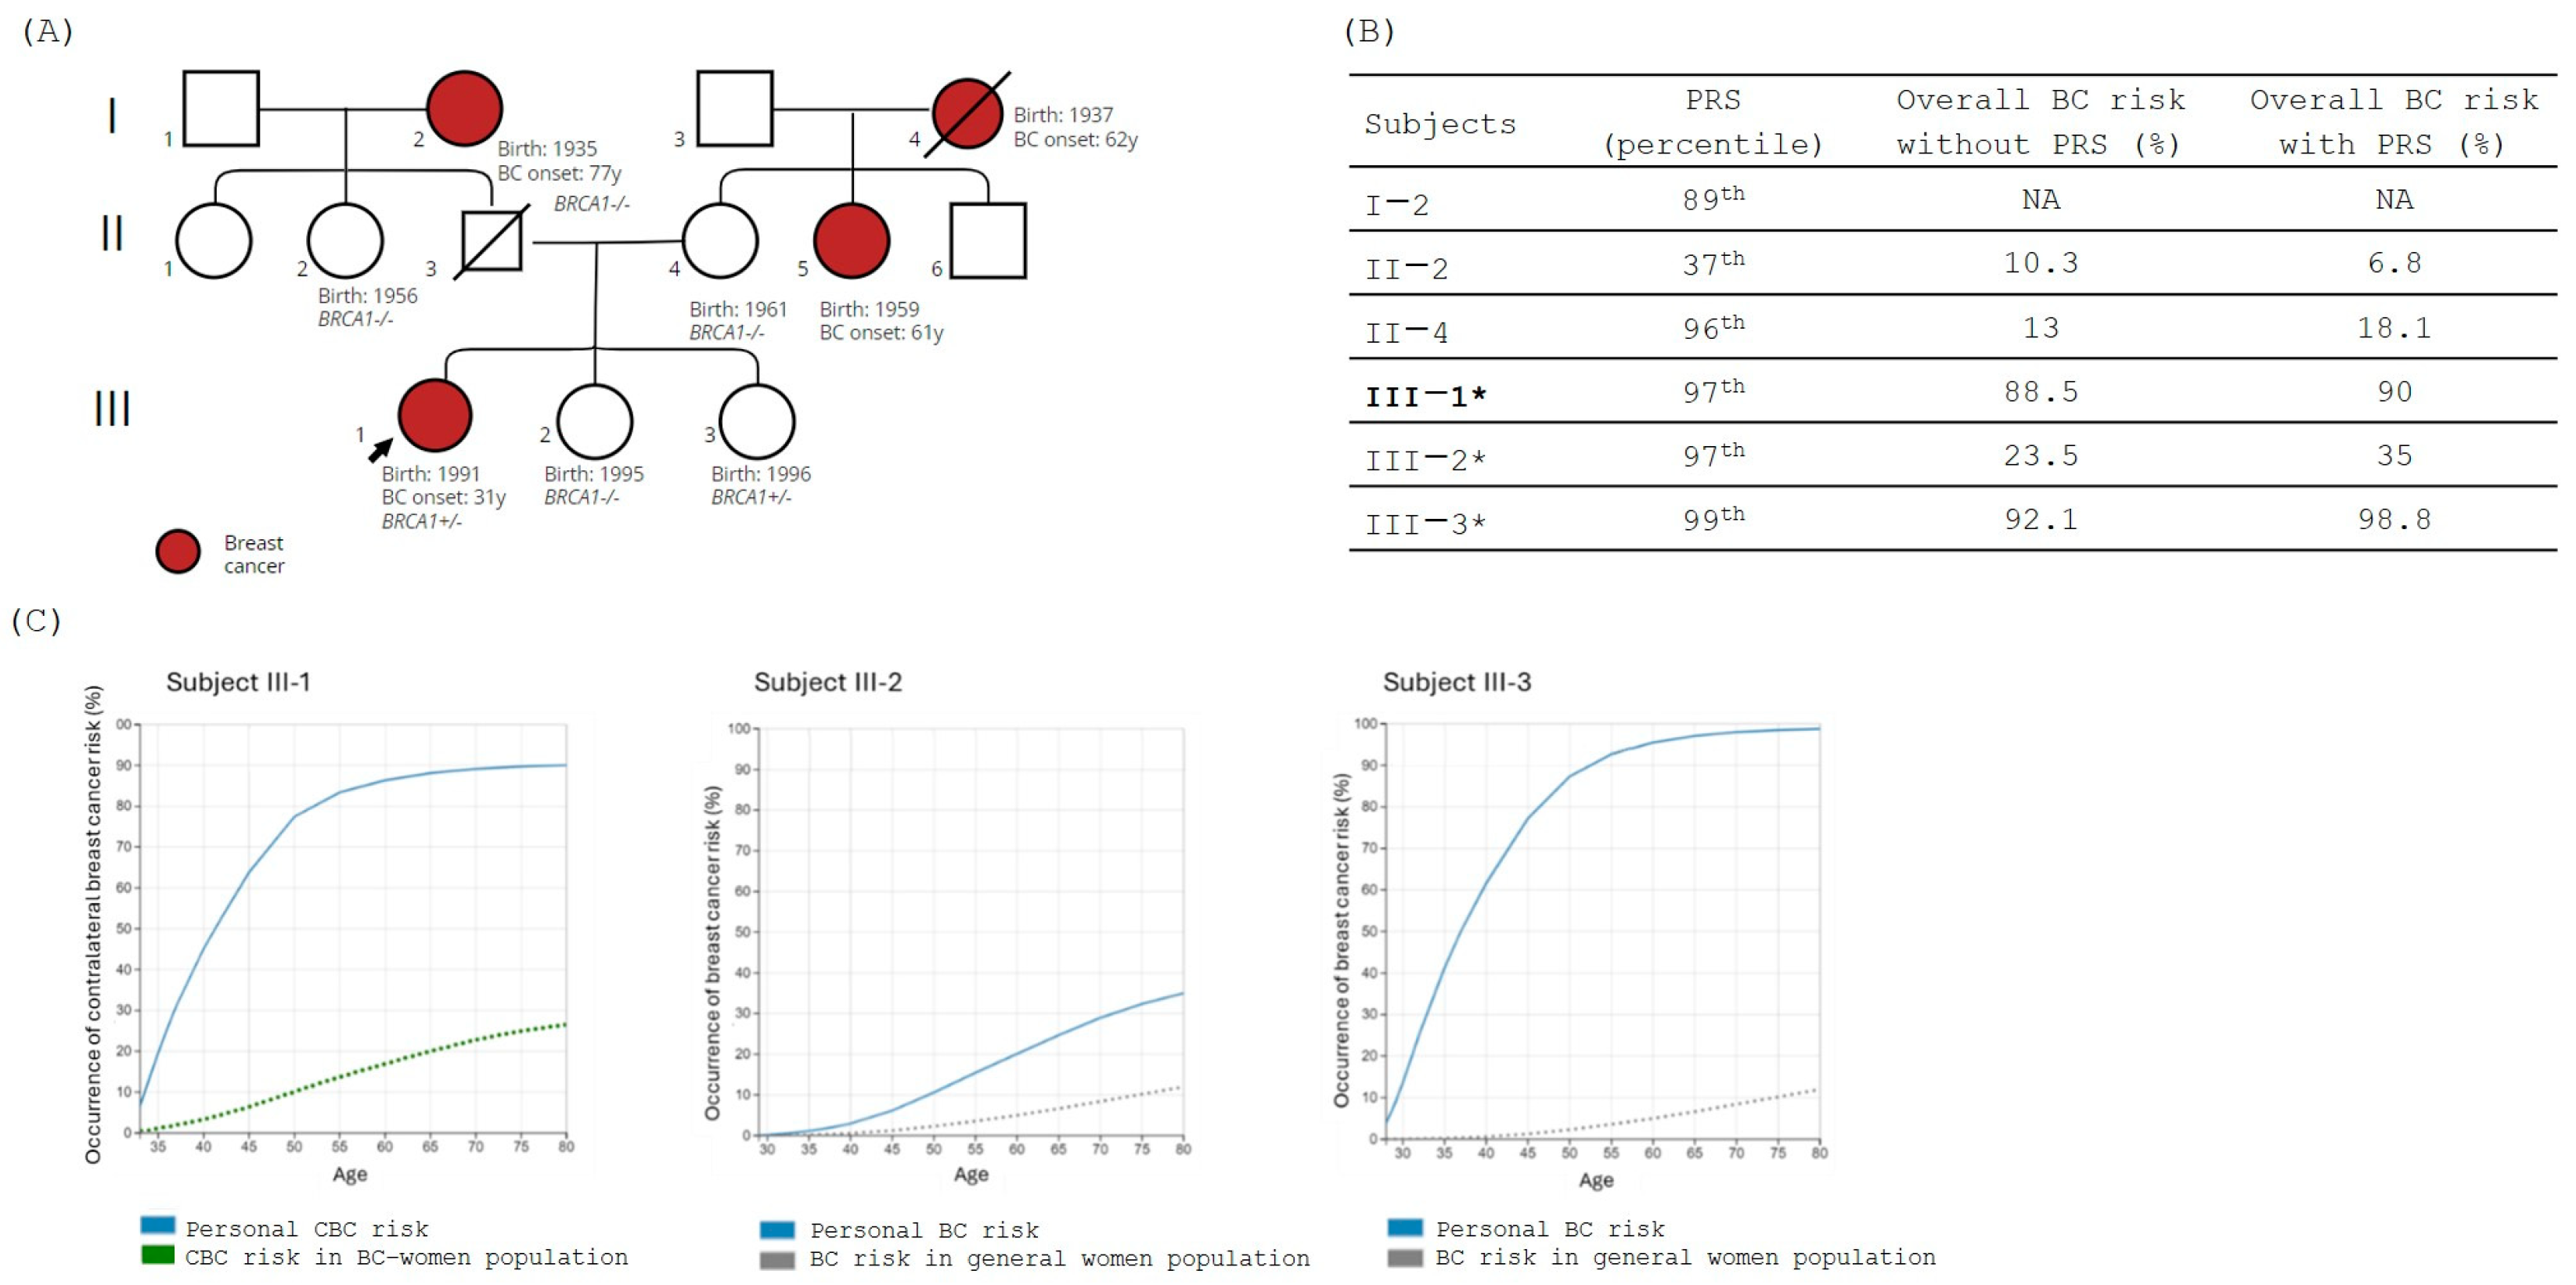
3.1. Family 1
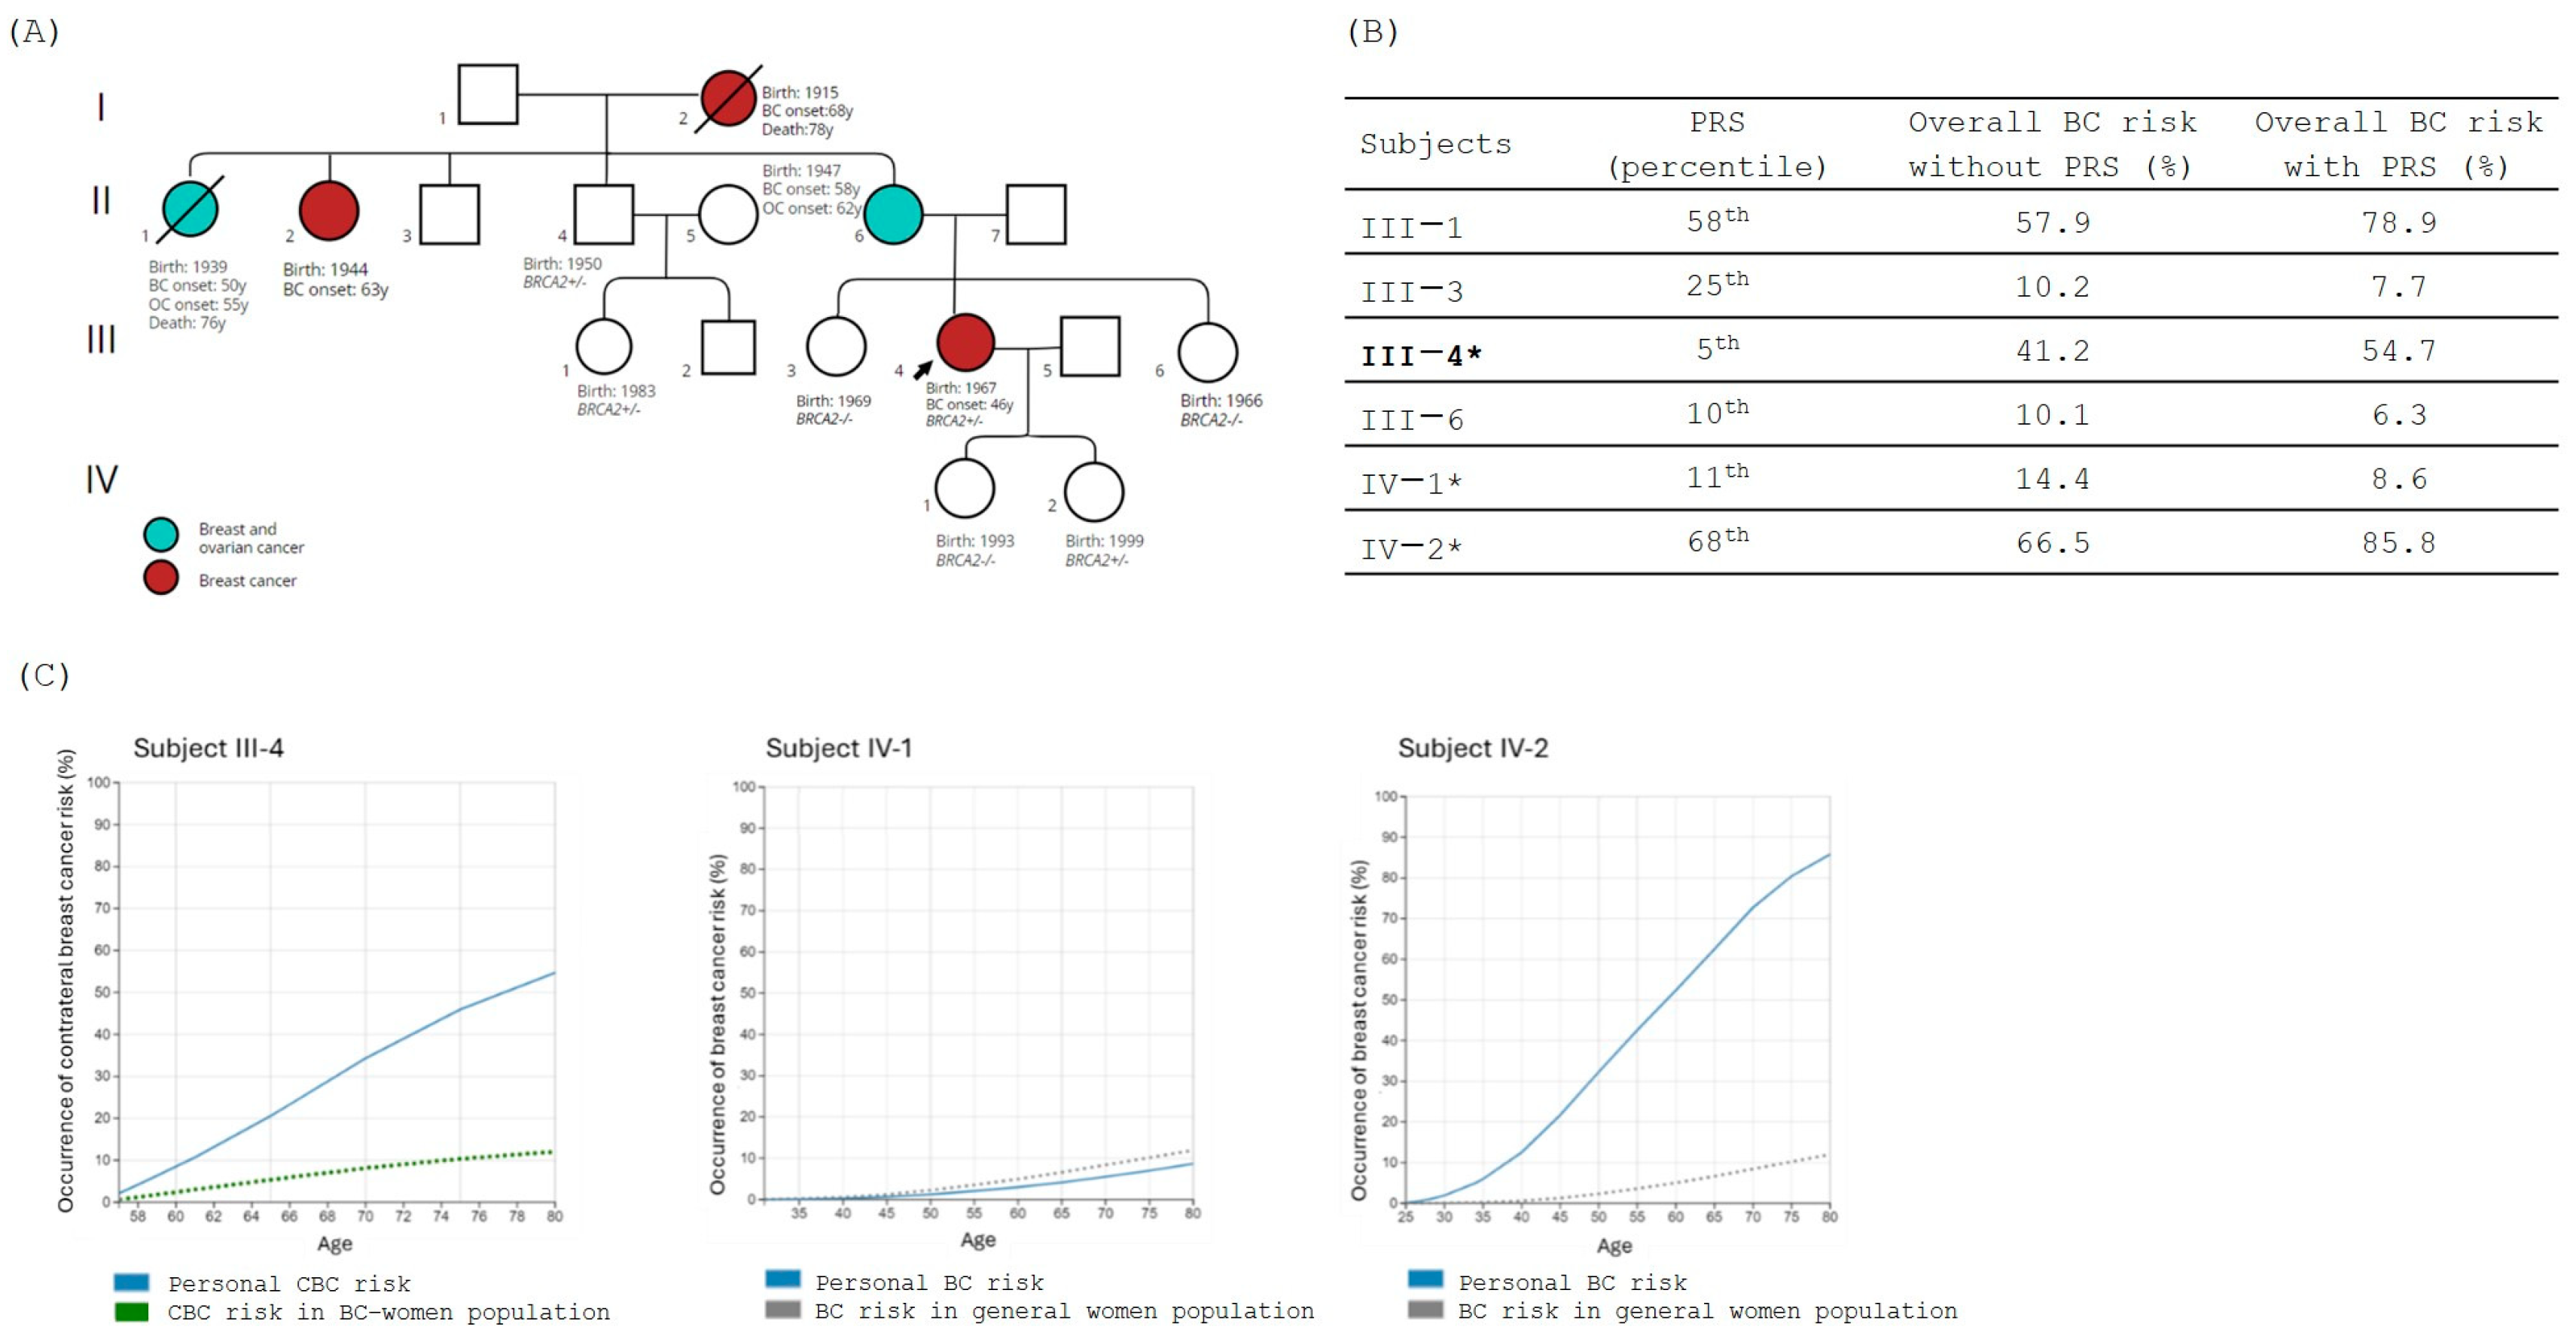
3.2. Family 2
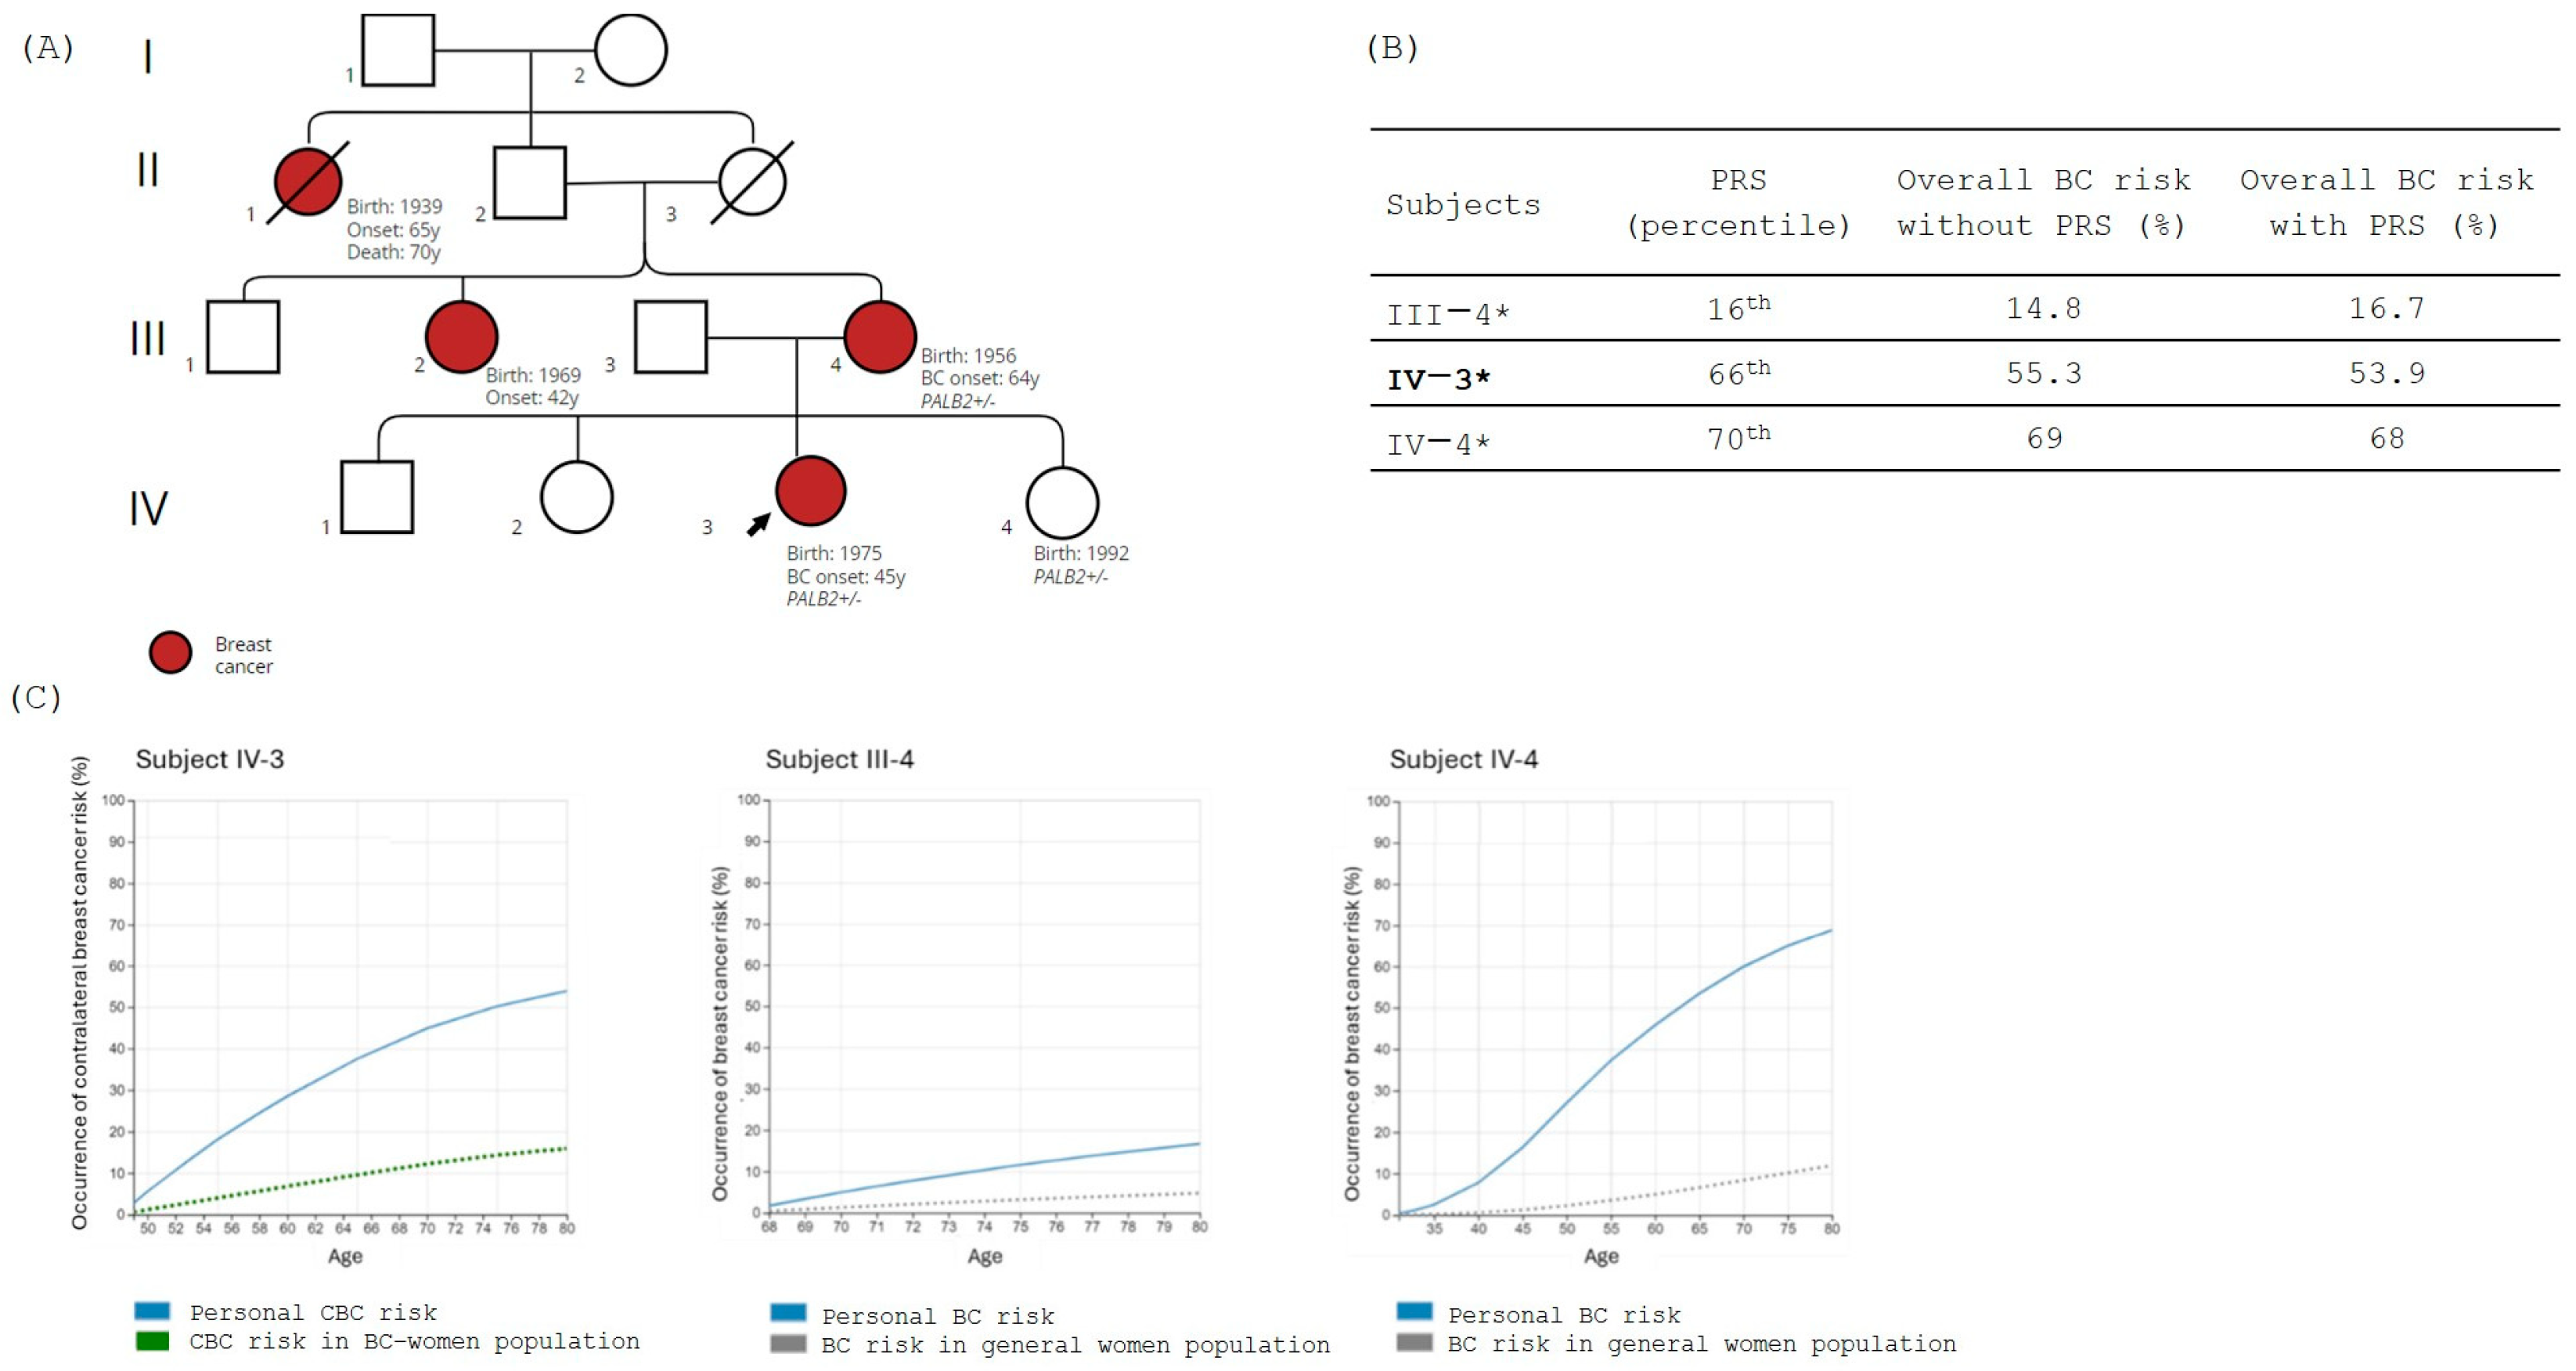
3.3. Family 3
3.4. Family 4
4. Discussion
5. Conclusions
Author Contributions
Funding
Institutional Review Board Statement
Informed Consent Statement
Data Availability Statement
Conflicts of Interest
References
- Ferlay, J.; Ervik, M.; Lam, F.; Laversanne, M.; Colombet, M.; Mery, L.; Global Cancer Observatory: Cancer Today. International Agency for Research on Cancer: Lyon, France. Available online: https://gco.iarc.who.int/today/ (accessed on 30 May 2024).
- Yoshida, R. Hereditary Breast and Ovarian Cancer (HBOC): Review of Its Molecular Characteristics, Screening, Treatment, and Prognosis. Breast Cancer 2021, 28, 1167–1180. [Google Scholar] [CrossRef] [PubMed]
- Miki, Y.; Swensen, J.; Shattuck-Eidens, D.; Futreal, P.A.; Harshman, K.; Tavtigian, S.; Liu, Q.; Cochran, C.; Bennett, L.M.; Ding, W. A Strong Candidate for the Breast and Ovarian Cancer Susceptibility Gene BRCA1. Science 1994, 266, 66–71. [Google Scholar] [CrossRef]
- Wooster, R.; Bignell, G.; Lancaster, J.; Swift, S.; Seal, S.; Mangion, J.; Collins, N.; Gregory, S.; Gumbs, C.; Micklem, G. Identification of the Breast Cancer Susceptibility Gene BRCA2. Nature 1995, 378, 789–792. [Google Scholar] [CrossRef]
- Renwick, A.; Thompson, D.; Seal, S.; Kelly, P.; Chagtai, T.; Ahmed, M.; North, B.; Jayatilake, H.; Barfoot, R.; Spanova, K.; et al. ATM Mutations That Cause Ataxia-Telangiectasia Are Breast Cancer Susceptibility Alleles. Nat. Genet. 2006, 38, 873–875. [Google Scholar] [CrossRef]
- Stucci, L.S.; Internò, V.; Tucci, M.; Perrone, M.; Mannavola, F.; Palmirotta, R.; Porta, C. The ATM Gene in Breast Cancer: Its Relevance in Clinical Practice. Genes 2021, 12, 727. [Google Scholar] [CrossRef] [PubMed]
- Dorling, L.; Carvalho, S.; Allen, J.; Parsons, M.T.; Fortuno, C.; González-Neira, A.; Heijl, S.M.; Adank, M.A.; Ahearn, T.U.; Andrulis, I.L.; et al. Breast Cancer Risks Associated with Missense Variants in Breast Cancer Susceptibility Genes. Genome Med. 2022, 14, 51. [Google Scholar] [CrossRef] [PubMed]
- Petrucelli, N.; Daly, M.B.; Pal, T. BRCA1- and BRCA2-Associated Hereditary Breast and Ovarian Cancer. In GeneReviews®; Adam, M.P., Feldman, J., Mirzaa, G.M., Pagon, R.A., Wallace, S.E., Bean, L.J., Gripp, K.W., Amemiya, A., Eds.; University of Washington: Seattle, WA, USA, 1993. [Google Scholar]
- Angeli, D.; Salvi, S.; Tedaldi, G. Genetic Predisposition to Breast and Ovarian Cancers: How Many and Which Genes to Test? Int. J. Mol. Sci. 2020, 21, 1128. [Google Scholar] [CrossRef]
- Michailidou, K.; Lindström, S.; Dennis, J.; Beesley, J.; Hui, S.; Kar, S.; Lemaçon, A.; Soucy, P.; Glubb, D.; Rostamianfar, A.; et al. Association Analysis Identifies 65 New Breast Cancer Risk Loci. Nature 2017, 551, 92–94. [Google Scholar] [CrossRef]
- Milne, R.L.; Kuchenbaecker, K.B.; Michailidou, K.; Beesley, J.; Kar, S.; Lindström, S.; Hui, S.; Lemaçon, A.; Soucy, P.; Dennis, J.; et al. Identification of Ten Variants Associated with Risk of Estrogen-Receptor-Negative Breast Cancer. Nat. Genet. 2017, 49, 1767–1778. [Google Scholar] [CrossRef]
- Couch, F.J.; Wang, X.; McGuffog, L.; Lee, A.; Olswold, C.; Kuchenbaecker, K.B.; Soucy, P.; Fredericksen, Z.; Barrowdale, D.; Dennis, J.; et al. Genome-Wide Association Study in BRCA1 Mutation Carriers Identifies Novel Loci Associated with Breast and Ovarian Cancer Risk. PLoS Genet. 2013, 9, e1003212. [Google Scholar] [CrossRef]
- Gaudet, M.M.; Kuchenbaecker, K.B.; Vijai, J.; Klein, R.J.; Kirchhoff, T.; McGuffog, L.; Barrowdale, D.; Dunning, A.M.; Lee, A.; Dennis, J.; et al. Identification of a BRCA2-Specific Modifier Locus at 6p24 Related to Breast Cancer Risk. PLoS Genet. 2013, 9, e1003173. [Google Scholar] [CrossRef] [PubMed]
- Pashayan, N.; Duffy, S.W.; Chowdhury, S.; Dent, T.; Burton, H.; Neal, D.E.; Easton, D.F.; Eeles, R.; Pharoah, P. Polygenic Susceptibility to Prostate and Breast Cancer: Implications for Personalised Screening. Br. J. Cancer 2011, 104, 1656–1663. [Google Scholar] [CrossRef] [PubMed]
- Burton, H.; Chowdhury, S.; Dent, T.; Hall, A.; Pashayan, N.; Pharoah, P. Public Health Implications from COGS and Potential for Risk Stratification and Screening. Nat. Genet. 2013, 45, 349–351. [Google Scholar] [CrossRef] [PubMed]
- Hall, P.; Easton, D. Breast Cancer Screening: Time to Target Women at Risk. Br. J. Cancer 2013, 108, 2202–2204. [Google Scholar] [CrossRef]
- Torkamani, A.; Wineinger, N.E.; Topol, E.J. The Personal and Clinical Utility of Polygenic Risk Scores. Nat. Rev. Genet. 2018, 19, 581–590. [Google Scholar] [CrossRef]
- Fahed, A.C.; Wang, M.; Homburger, J.R.; Patel, A.P.; Bick, A.G.; Neben, C.L.; Lai, C.; Brockman, D.; Philippakis, A.; Ellinor, P.T.; et al. Polygenic Background Modifies Penetrance of Monogenic Variants for Tier 1 Genomic Conditions. Nat. Commun. 2020, 11, 3635. [Google Scholar] [CrossRef]
- Bolze, A.; Kiser, D.; Schiabor Barrett, K.M.; Elhanan, G.; Schnell Blitstein, J.M.; Neveux, I.; Dabe, S.; Reed, H.; Anderson, A.; Metcalf, W.J.; et al. Combining Rare and Common Genetic Variants Improves Population Risk Stratification for Breast Cancer. Genet. Med. Open 2024, 2, 101826. [Google Scholar] [CrossRef]
- Richards, S.; Aziz, N.; Bale, S.; Bick, D.; Das, S.; Gastier-Foster, J.; Grody, W.W.; Hegde, M.; Lyon, E.; Spector, E.; et al. Standards and Guidelines for the Interpretation of Sequence Variants: A Joint Consensus Recommendation of the American College of Medical Genetics and Genomics and the Association for Molecular Pathology. Genet. Med. 2015, 17, 405–424. [Google Scholar] [CrossRef] [PubMed]
- World Medical Association. World Medical Association Declaration of Helsinki: Ethical Principles for Medical Research Involving Human Subjects. JAMA 2013, 310, 2191–2194. [Google Scholar] [CrossRef]
- Busby, G.B.; Craig, P.; Yousfi, N.; Hebbalkar, S.; Domenico, P.D.; Bottà, G. Genetic Assessments of Breast Cancer Risk that Do Not Account for Polygenic Background Are Incomplete and Lead to Incorrect Preventative Strategies. medRxiv 2021. [Google Scholar] [CrossRef]
- Busby, G.B.; Kulm, S.; Bolli, A.; Kintzle, J.; Domenico, P.D.; Bottà, G. Ancestry-Specific Polygenic Risk Scores Are Risk Enhancers for Clinical Cardiovascular Disease Assessments. Nat. Commun. 2023, 14, 7105. [Google Scholar] [CrossRef] [PubMed]
- Carver, T.; Hartley, S.; Lee, A.; Cunningham, A.P.; Archer, S.; Babb de Villiers, C.; Roberts, J.; Ruston, R.; Walter, F.M.; Tischkowitz, M.; et al. CanRisk Tool-A Web Interface for the Prediction of Breast and Ovarian Cancer Risk and the Likelihood of Carrying Genetic Pathogenic Variants. Cancer Epidemiol. Biomark. Prev. 2021, 30, 469–473. [Google Scholar] [CrossRef] [PubMed]
- Lee, A.; Mavaddat, N.; Wilcox, A.N.; Cunningham, A.P.; Carver, T.; Hartley, S.; Babb de Villiers, C.; Izquierdo, A.; Simard, J.; Schmidt, M.K.; et al. BOADICEA: A Comprehensive Breast Cancer Risk Prediction Model Incorporating Genetic and Nongenetic Risk Factors. Genet. Med. 2019, 21, 1708–1718. [Google Scholar] [CrossRef]
- Lee, A.; Mavaddat, N.; Cunningham, A.; Carver, T.; Ficorella, L.; Archer, S.; Walter, F.M.; Tischkowitz, M.; Roberts, J.; Usher-Smith, J.; et al. Enhancing the BOADICEA Cancer Risk Prediction Model to Incorporate New Data on RAD51C, RAD51D, BARD1 Updates to Tumour Pathology and Cancer Incidence. J. Med. Genet. 2022, 59, 1206–1218. [Google Scholar] [CrossRef]
- Lakeman, I.M.M.; Hilbers, F.S.; Rodríguez-Girondo, M.; Lee, A.; Vreeswijk, M.P.G.; Hollestelle, A.; Seynaeve, C.; Meijers-Heijboer, H.; Oosterwijk, J.C.; Hoogerbrugge, N.; et al. Addition of a 161-SNP Polygenic Risk Score to Family History-Based Risk Prediction: Impact on Clinical Management in Non-BRCA1/2 Breast Cancer Families. J. Med. Genet. 2019, 56, 581–589. [Google Scholar] [CrossRef] [PubMed]
- Lakeman, I.M.M.; Rodríguez-Girondo, M.D.M.; Lee, A.; Celosse, N.; Braspenning, M.E.; van Engelen, K.; van de Beek, I.; van der Hout, A.H.; Gómez García, E.B.; Mensenkamp, A.R.; et al. Clinical Applicability of the Polygenic Risk Score for Breast Cancer Risk Prediction in Familial Cases. J. Med. Genet. 2023, 60, 327–336. [Google Scholar] [CrossRef]
- Mars, N.; Widén, E.; Kerminen, S.; Meretoja, T.; Pirinen, M.; Della Briotta Parolo, P.; Palta, P.; FinnGen; Palotie, A.; Kaprio, J.; et al. The Role of Polygenic Risk and Susceptibility Genes in Breast Cancer over the Course of Life. Nat. Commun. 2020, 11, 6383. [Google Scholar] [CrossRef]
- Kuchenbaecker, K.B.; Hopper, J.L.; Barnes, D.R.; Phillips, K.-A.; Mooij, T.M.; Roos-Blom, M.-J.; Jervis, S.; van Leeuwen, F.E.; Milne, R.L.; Andrieu, N.; et al. Risks of Breast, Ovarian, and Contralateral Breast Cancer for BRCA1 and BRCA2 Mutation Carriers. JAMA 2017, 317, 2402–2416. [Google Scholar] [CrossRef]
- Gao, C.; Polley, E.C.; Hart, S.N.; Huang, H.; Hu, C.; Gnanaolivu, R.; Lilyquist, J.; Boddicker, N.J.; Na, J.; Ambrosone, C.B.; et al. Risk of Breast Cancer Among Carriers of Pathogenic Variants in Breast Cancer Predisposition Genes Varies by Polygenic Risk Score. J. Clin. Oncol. 2021, 39, 2564–2573. [Google Scholar] [CrossRef]
- Busby, G.; Kulm, S.; Bolli, A.; Kintzle, J.; Di Domenico, P.; Neary, J.; Morganstern, D.; Bottà, G. Ancestry-Specific Polygenic Risk Scores Improve Clinical Assessments of Breast Cancer Risk in Diverse Populations. Res. Sq. 2024, preprint. [Google Scholar] [CrossRef]
- Mavaddat, N.; Michailidou, K.; Dennis, J.; Lush, M.; Fachal, L.; Lee, A.; Tyrer, J.P.; Chen, T.-H.; Wang, Q.; Bolla, M.K.; et al. Polygenic Risk Scores for Prediction of Breast Cancer and Breast Cancer Subtypes. Am. J. Hum. Genet. 2019, 104, 21–34. [Google Scholar] [CrossRef] [PubMed]
- Barnes, D.R.; Rookus, M.A.; McGuffog, L.; Leslie, G.; Mooij, T.M.; Dennis, J.; Mavaddat, N.; Adlard, J.; Ahmed, M.; Aittomäki, K.; et al. Polygenic Risk Scores and Breast and Epithelial Ovarian Cancer Risks for Carriers of BRCA1 and BRCA2 Pathogenic Variants. Genet. Med. 2020, 22, 1653–1666. [Google Scholar] [CrossRef] [PubMed]
- Roberts, E.; Howell, S.; Evans, D.G. Polygenic Risk Scores and Breast Cancer Risk Prediction. Breast 2023, 67, 71–77. [Google Scholar] [CrossRef] [PubMed]
- Ochaney, P.; Patel, K.; Haq, F.; Reese, R.; Igel, S. The Importance of Risk-Reducing Prophylactic Mastectomy in Breast Cancer (BRCA) Carriers: A Case Report. Cureus 2019, 11, e5311. [Google Scholar] [CrossRef] [PubMed]
- Mukama, T.; Fallah, M.; Brenner, H.; Xu, X.; Sundquist, K.; Sundquist, J.; Kharazmi, E. Risk of Invasive Breast Cancer in Relatives of Patients with Breast Carcinoma in Situ: A Prospective Cohort Study. BMC Med. 2020, 18, 295. [Google Scholar] [CrossRef]
- Sun, J.; Chu, F.; Pan, J.; Zhang, Y.; Yao, L.; Chen, J.; Hu, L.; Zhang, J.; Xu, Y.; Wang, X.; et al. BRCA-CRisk: A Contralateral Breast Cancer Risk Prediction Model for BRCA Carriers. J. Clin. Oncol. 2023, 41, 991–999. [Google Scholar] [CrossRef]


| Subjects (n) | Age (Mean ± SD) | Breast Cancer | PV/LPV Carriers (n) | Gene | Variant | Pathogenicity Class | |
|---|---|---|---|---|---|---|---|
| Family 1 | 6 | 51.5 ± 25.21 | Yes: 2 No: 4 | 2 | BRCA1 | NM_007294.3 c.4117G>T, p.(Glu1373*) | Pathogenic |
| Family 2 | 6 | 44.5 ± 13.30 | Yes: 1 No: 5 | 3 | BRCA2 | NM_000059.4 c.7680dup, p.(Gln2561Serfs*5) | Pathogenic |
| Family 3 | 3 | 49.66 ± 18 | Yes: 2 No: 1 | 3 | PALB2 | NM_024675.4 c.2351_2352delinsT, p.(Lys784Ilefs*67) | Pathogenic |
| Family 4 | 3 | 54.66 ± 11.93 | Yes: 1 No: 2 | 3 | ATM | NM_000051.4 c.7515+1G>C, p.? | Likely pathogenic |
| Allelica 577k PRS | 313 SNP PRS | |
|---|---|---|
| Area Under the Receiver Operator Curve | 0.71 (95%CI 0.698–0.717) | 0.68 (95%CI 0.669–0.688) |
| Odds ratio per standard deviation | 1.81 (95%CI 1.78–1.84) | 1.56 (95%CI 1.53–1.58) |
Disclaimer/Publisher’s Note: The statements, opinions and data contained in all publications are solely those of the individual author(s) and contributor(s) and not of MDPI and/or the editor(s). MDPI and/or the editor(s) disclaim responsibility for any injury to people or property resulting from any ideas, methods, instructions or products referred to in the content. |
© 2024 by the authors. Licensee MDPI, Basel, Switzerland. This article is an open access article distributed under the terms and conditions of the Creative Commons Attribution (CC BY) license (https://creativecommons.org/licenses/by/4.0/).
Share and Cite
Rizzacasa, B.; Nicolì, V.; Tancredi, C.; Conte, C.; Salehi, L.B.; Carriero, M.L.; Longo, G.; Cirigliano, V.; Lopez, L.I.; Palao, B.; et al. Implementing the Risk Stratification and Clinical Management of Breast Cancer Families Using Polygenic Risk Score Evaluation: A Pilot Study. J. Pers. Med. 2024, 14, 1034. https://doi.org/10.3390/jpm14101034
Rizzacasa B, Nicolì V, Tancredi C, Conte C, Salehi LB, Carriero ML, Longo G, Cirigliano V, Lopez LI, Palao B, et al. Implementing the Risk Stratification and Clinical Management of Breast Cancer Families Using Polygenic Risk Score Evaluation: A Pilot Study. Journal of Personalized Medicine. 2024; 14(10):1034. https://doi.org/10.3390/jpm14101034
Chicago/Turabian StyleRizzacasa, Barbara, Vanessa Nicolì, Chantal Tancredi, Chiara Conte, Leila B. Salehi, Miriam Lucia Carriero, Giuliana Longo, Vincenzo Cirigliano, Luis Izquierdo Lopez, Bibiana Palao, and et al. 2024. "Implementing the Risk Stratification and Clinical Management of Breast Cancer Families Using Polygenic Risk Score Evaluation: A Pilot Study" Journal of Personalized Medicine 14, no. 10: 1034. https://doi.org/10.3390/jpm14101034