
A Literature Review and Meta-Analysis on the Potential Use of miR-150 as a Novel Biomarker in the Detection and Progression of Multiple Sclerosis

 , , ,
, , ,
Abstract
:1. Introduction
2. Material and Methods
2.1. Literature Search Strategy
2.2. Selection Criteria
2.3. Registration
2.4. Data Extraction
2.5. Quality Assessment
- Selection (0–4 points): Including the representativeness of the exposed cohort, selection of the non-exposed cohort, ascertainment of exposure, and demonstration that the outcome of interest was not present at the start of the study.
- Comparability (0–2 points): Evaluation of the study’s control for confounding factors.
- Outcome (0–3 points): Assessment of the outcome, including the method of ascertainment, length of follow-up, and adequacy of follow-up [52].
- Protocol Registration: Whether the review methods were established prior to conducting the review.
- Comprehensive Literature Search: The extent and inclusivity of the literature search, including grey literature.
- Justification for Excluding Studies: Explanation for study exclusions.
- Risk of Bias: Assessment of bias in individual studies and its impact on the review’s conclusions.
- Appropriateness of Meta-analytical Methods: Suitability of the statistical methods used and assessment of publication bias [53].
2.6. Data Synthesis and Analysis
2.7. Statistical Analysis
3. Results
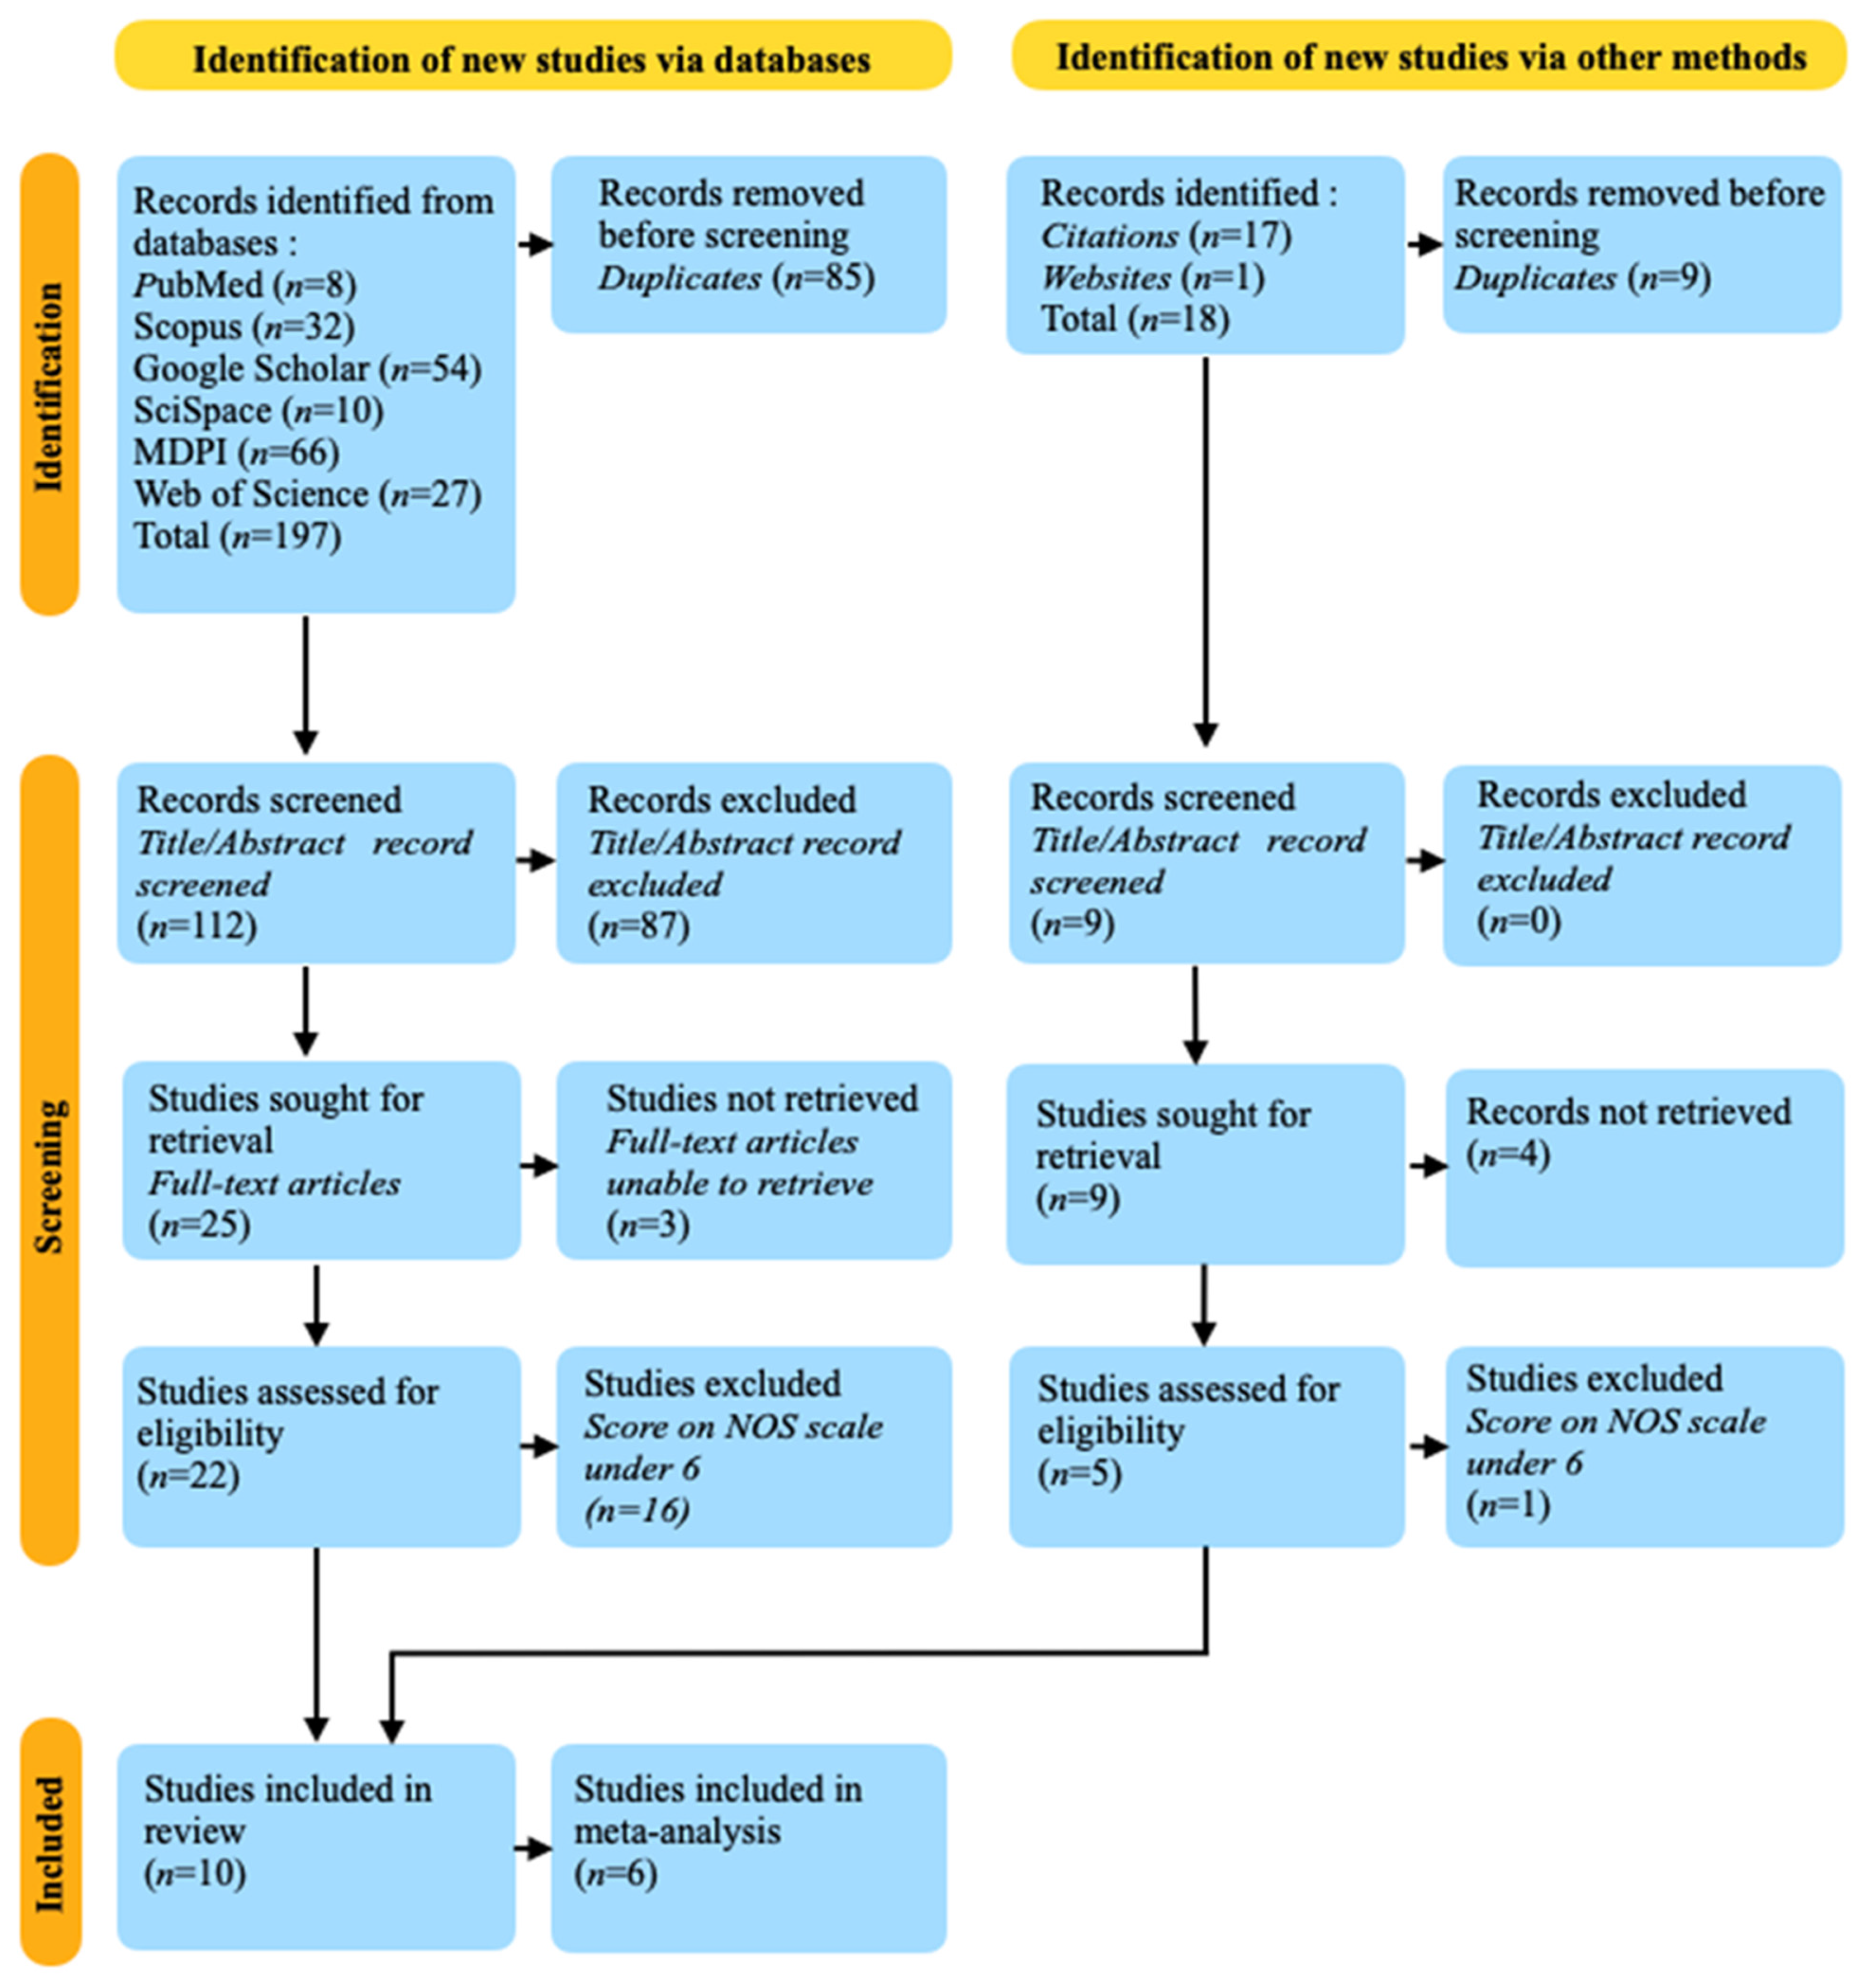
3.1. Databases Research Results
3.2. Other Sources’ Research Results
3.3. Reliability and Validity of Data Extraction Assessment
3.4. Risk of Bias Assessment
3.5. Strength of Evidence Assessment
3.6. Synthesis of Findings
3.7. Statistical Analysis Results
4. Discussions
5. Conclusions
Author Contributions
Funding
Institutional Review Board Statement
Informed Consent Statement
Data Availability Statement
Conflicts of Interest
References
- Azizi Dargahlou, S.; Iriti, M.; Pouresmaeil, M.; Goh, L.P.W. MicroRNAs; their therapeutic and biomarker properties. Cell. Mol. Biomed. Rep. 2023, 3, 73–88. [Google Scholar] [CrossRef]
- Bayraktar, E.; Bayraktar, R.; Oztatlici, H.; Lopez-Berestein, G.; Amero, P.; Rodriguez-Aguayo, C. Targeting microRNAs and Other Non-Coding RNAs as Targets for Anticancer Drug Development. Non-Coding RNA 2023, 9, 27. [Google Scholar] [CrossRef] [PubMed]
- Kanwal, N.; Al Samarrai, O.R.; Al-Zaidi, H.M.H.; Mirzaei, A.R.; Heidari, M.J. Comprehensive analysis of microRNA (miRNA) in cancer cells. Cell. Mol. Biomed. Rep. 2023, 3, 89–97. [Google Scholar] [CrossRef]
- Suzuki, H. Roles of MicroRNAs in Disease Biology. JMA J. 2023, 6, 104–113. [Google Scholar] [CrossRef]
- Hudy, D.; Rzeszowska-Wolny, J. Expression of miRNA-Targeted and Not-Targeted Reporter Genes Shows Mutual Influence and Intercellular Specificity. Int. J. Mol. Sci. 2022, 23, 15059. [Google Scholar] [CrossRef] [PubMed]
- Reza, A.M.M.T.; Yuan, Y.-G. microRNAs Mediated Regulation of the Ribosomal Proteins and its Consequences on the Global Translation of Proteins. Cells 2021, 10, 110. [Google Scholar] [CrossRef] [PubMed]
- Ali, S.; Khan, M.S.; Wani, J.A.; Faiz, S.; Rehman, M.U.; Majid, S.; Ali, M.N. miRNAs: The genetic regulators of immunity. In A Molecular Approach to Immunogenetics; Academic Press: Cambridge, MA, USA, 2022; pp. 299–325. [Google Scholar]
- Naghavian, R.; Ghaedi, K.; Kiani-Esfahani, A.; Ganjalikhani-Hakemi, M.; Etemadifar, M.; Nasr-Esfahani, M.H. miR-141 and miR-200a, Revelation of New Possible Players in Modulation of Th17/Treg Differentiation and Pathogenesis of Multiple Sclerosis. PLoS ONE 2015, 10, e0124555. [Google Scholar] [CrossRef] [PubMed]
- Salimian, N.; Peymani, M.; Ghaedi, K.; Esfahani, M.H.N. Modulation in miR-200a/SIRT1axis is associated with apoptosis in MPP+-induced SH-SY5Y cells. Gene 2018, 674, 25–30. [Google Scholar] [CrossRef]
- Hu, Z.; Cui, Y.; Qiao, X.; He, X.; Li, F.; Luo, C.; Wang, S.; Li, C.; Dai, R. Silencing miR-150 Ameliorates Experimental Autoimmune Encephalomyelitis. Front. Neurosci. 2018, 12, 465. [Google Scholar] [CrossRef]
- Sharaf-Eldin, W.E.; Kishk, N.A.; Gad, Y.Z.; Hassan, H.; Ali, M.A.; Zaki, M.S.; Mohamed, M.R.; Essawi, M.L. Extracellular miR-145, miR-223 and miR-326 expression signature allow for differential diagnosis of immune-mediated neuroinflammatory diseases. J. Neurol. Sci. 2017, 383, 188–198. [Google Scholar] [CrossRef]
- Garreau, M.; Weidner, J.; Hamilton, R.; Kolosionek, E.; Toki, N.; Stavenhagen, K.; Paris, C.; Bonetti, A.; Czechtizky, W.; Gnerlich, F.; et al. Chemical modification patterns for microRNA therapeutic mimics: A structure-activity relationship (SAR) case-study on miR-200c. Nucleic Acids Res. 2024, 52, 2792–2807. [Google Scholar] [CrossRef]
- Uli, J.E.; Yong, C.S.Y.; Yeap, S.K.; Rovie-Ryan, J.J.; Isa, N.M.; Tan, S.G.; Alitheen, N.B. RNA sequencing (RNA-Seq) of lymph node, spleen, and thymus transcriptome from wild Peninsular Malaysian cynomolgus macaque (Macaca fascicularis). PeerJ 2017, 5, e3566. [Google Scholar] [CrossRef]
- Smits, B.M.; Hartley, T.; Dünnebach, E.; Bartels, M.; Boycott, K.M.; Kernohan, K.D.; Dyment, D.A.; Giltay, J.C.; Haddad, E.; Jarinova, O.; et al. Heterozygous Variants in the DNA-binding Domain of c-Myb May Affect Normal B/T Cell Development. HemaSphere 2022, 6, e774. [Google Scholar] [CrossRef]
- Yue, C.; Wang, W.; Gao, S.; Ye, J.; Zhang, T.; Xing, Z.; Xie, Y.; Qian, H.; Zhou, X.; Li, S.; et al. Agomir miRNA-150-5p alleviates pristane-induced lupus by suppressing myeloid dendritic cells activation and inflammation via TREM-1 axis. Inflamm. Res. 2023, 72, 1391–1408. [Google Scholar] [CrossRef] [PubMed]
- Hu, Y.Z.; Li, Q.; Wang, P.F.; Li, X.P.; Hu, Z.L. Multiple functions and regulatory network of miR-150 in B lymphocyte-related diseases. Front. Oncol. 2023, 13, 1140813. [Google Scholar] [CrossRef]
- Wang, L.; Liang, Y. MicroRNAs as T Lymphocyte Regulators in Multiple Sclerosis. Front. Mol. Neurosci. 2022, 15, 865529. [Google Scholar] [CrossRef] [PubMed]
- Basak, J.; Majsterek, I. miRNA-Dependent CD4+ T Cell Differentiation in the Pathogenesis of Multiple Sclerosis. Mult. Scler. Int. 2021, 2021, 8825588. [Google Scholar] [CrossRef]
- Nociti, V.; Romozzi, M. Multiple Sclerosis and Autoimmune Comorbidities. J. Pers. Med. 2022, 12, 1828. [Google Scholar] [CrossRef]
- Nataf, S. Myelinodegeneration vs. Neurodegeneration in MS Progressive Forms. Int. J. Mol. Sci. 2023, 24, 1596. [Google Scholar] [CrossRef] [PubMed]
- Rhodes, K.R.; Tzeng, S.Y.; Iglesias, M.; Lee, D.; Storm, K.; Neshat, S.Y.; VanDyke, D.; Lowmaster, S.M.; Spangler, J.B.; Raimondi, G.; et al. Bioengineered particles expand myelin-specific regulatory T cells and reverse autoreactivity in a mouse model of multiple sclerosis. Sci. Adv. 2023, 9, eadd8693. [Google Scholar] [CrossRef]
- Chen, M.H.; Cherian, C.; Elenjickal, K.; Rafizadeh, C.M.; Ross, M.K.; Leow, A.; DeLuca, J. Real-time associations among MS symptoms and cognitive dysfunction using ecological momentary assessment. Front. Med. 2023, 9, 1049686. [Google Scholar] [CrossRef] [PubMed]
- Balasa, R.; Barcutean, L.; Balasa, A.; Motataianu, A.; Roman-Filip, C.; Manu, D. The action of TH17 cells on blood brain barrier in multiple sclerosis and experimental autoimmune encephalomyelitis. Hum. Immunol. 2020, 81, 237–243. [Google Scholar] [CrossRef]
- Bermel, R.A.; Rae-Grant, A.D.; Fox, R.J. Diagnosing multiple sclerosis at a later age: More than just progressive myelopathy. Mult. Scler. J. 2010, 16, 1335–1340. [Google Scholar] [CrossRef] [PubMed]
- McCombe, P.A. The role of sex and pregnancy in multiple sclerosis: What do we know and what should we do? Expert Rev. Neurother. 2022, 22, 377–392. [Google Scholar] [CrossRef]
- Ostkamp, P.; Schwab, N. Effects of Latitude and Sunlight on Multiple Sclerosis Severity. Neurology 2022, 98, 997–998. [Google Scholar] [CrossRef]
- Zarubina, N.V.; Spirin, N.N. Impact of depression on the quality of life of patients with multiple sclerosis. Nevrol. Nejropsihiatriâ Psihosomatika 2023, 15, 41–47. [Google Scholar] [CrossRef]
- Van Wijmeersch, B.; Hartung, H.P.; Vermersch, P.; Pugliatti, M.; Pozzilli, C.; Grigoriadis, N.; Alkhawajah, M.; Airas, L.; Linker, R.; Oreja-Guevara, C. Using personalized prognosis in the treatment of relapsing multiple sclerosis: A practical guide. Front. Immunol. 2022, 13, 991291. [Google Scholar] [CrossRef] [PubMed]
- Cappelletti, C.; Eriksson, A.; Brorson, I.S.; Leikfoss, I.S.; Kråbøl, O.; Høgestøl, E.A.; Vitelli, V.; Mjaavatten, O.; Harbo, H.F.; Berven, F.; et al. Quantitative proteomics reveals protein dysregulation during T cell activation in multiple sclerosis patients compared to healthy controls. Clin. Proteom. 2022, 19, 23. [Google Scholar] [CrossRef]
- Angelini, G.; Bani, A.; Constantin, G.; Rossi, B. The interplay between T helper cells and brain barriers in the pathogenesis of multiple sclerosis. Front. Cell. Neurosci. 2023, 17, 1101379. [Google Scholar] [CrossRef]
- Li, J.; Lu, L.; Binder, K.; Xiong, J.; Ye, L.; Cheng, Y.H.; Majri-Morrison, S.; Lu, W.; Lee, J.W.; Zhang, Z.; et al. Mechanisms of antigen-induced reversal of CNS inflammation in experimental demyelinating disease. Sci. Adv. 2023, 9, eabo2810. [Google Scholar] [CrossRef]
- Geladaris, A.; Häusser-Kinzel, S.; Pretzsch, R.; Nissimov, N.; Lehmann-Horn, K.; Häusler, D.; Weber, M.S. IL-10-providing B cells govern pro-inflammatory activity of macrophages and microglia in CNS autoimmunity. Acta Neuropathol. 2023, 145, 461–477. [Google Scholar] [CrossRef]
- Groh, J.; Abdelwahab, T.; Kattimani, Y.; Hoerner, M.; Loserth, S.; Gudi, V.; Adalbert, R.; Imdahl, F.; Saliba, A.E.; Coleman, M.; et al. Genetically perturbed myelin as a risk factor for neuroinflammation-driven axon degeneration. bioRxiv 2023. [Google Scholar] [CrossRef]
- Ganesan, A.; Muralidharan, P.; Ramya, L.N. The Fulcrum of Demyelination in Multiple Sclerosis. Curr. Protein Pept. Sci. 2023, 24, 579–588. [Google Scholar] [CrossRef]
- Samtani, G.; Kim, S.; Michaud, D.; Hillhouse, A.E.; Szule, J.A.; Konganti, K.; Li, J. Brain region dependent molecular signatures and myelin repair following chronic demyelination. Front. Cell. Neurosci. 2023, 17, 1169786. [Google Scholar] [CrossRef]
- Benallegue, N.; Nicol, B.; Lasselin, J.; Bézie, S.; Flippe, L.; Regue, H.; Vimond, N.; Remy, S.; Garcia, A.; Le Frère, F.; et al. Patients With Severe Multiple Sclerosis Exhibit Functionally Altered CD8+ Regulatory T Cells. Neurol. Neuroimmunol. Neuroinflamm. 2022, 9, e200016. [Google Scholar] [CrossRef]
- Ménoret, A.; Agliano, F.; Karginov, T.A.; Karlinsey, K.S.; Zhou, B.; Vella, A.T. Antigen-specific downregulation of miR-150 in CD4 T cells promotes cell survival. Front. Immunol. 2023, 14, 1102403. [Google Scholar] [CrossRef]
- Oshi, M.; Gandhi, S.; Wu, R.; Yan, L.; Yamada, A.; Ishikawa, T.; Endo, I.; Takabe, K. Abstract P3-10-01: Mir-150 expression is associated with immune cell infiltration and immune response in breast cancer. Cancer Res. 2022, 82, P3–P10. [Google Scholar] [CrossRef]
- Wang, B.; Hu, S.; Fu, X.; Li, L. CD4+ Cytotoxic T Lymphocytes in Cancer Immunity and Immunotherapy. Adv. Biol. 2022, 7, 2200169. [Google Scholar] [CrossRef]
- Gozzi-Silva, S.C.; Oliveira, L.D.M.; Alberca, R.W.; Pereira, N.Z.; Yoshikawa, F.S.; Pietrobon, A.J.; Yendo, T.M.; de Souza Andrade, M.M.; Ramos, Y.A.L.; Brito, C.A.; et al. Generation of Cytotoxic T Cells and Dysfunctional CD8 T Cells in Severe COVID-19 Patients. Cells 2022, 11, 3359. [Google Scholar] [CrossRef]
- Pérez, M.M.G.; Eisele, S.J.G. MicroRNAs as a possible biomarker in the treatment of multiple sclerosis. IBRO Neurosci. Rep. 2022, 13, 492–499. [Google Scholar] [CrossRef]
- Saeidi, N.N.; Dabiri, A.; Mansouri, R.; Moomivand, A.; Goudarzvand, M. miRNAs as Valuable Diagnostic Biomarkers in Patients with Multiple Sclerosis. J. Biomed. Res. Environ. Sci. 2023, 2766, 2276. [Google Scholar] [CrossRef]
- Omarova, M.A.; Kozin, M.S.; Boyko, A.N. Free circulating miRNA as a potential diagnostic marker in multiple sclerosis (review). Neurol. Neuropsychiatry Psychosom. 2022, 14, 29–33. [Google Scholar] [CrossRef]
- Muñoz-San Martín, M.; Torras, S.; Robles-Cedeño, R.; Buxó, M.; Gomez, I.; Matute-Blanch, C.; Comabella, M.; Villar, L.M.; Perkal, H.; Quintana, E.; et al. Radiologically isolated syndrome: Targeting miRNAs as prognostic biomarkers. Epigenomics 2020, 12, 2065–2076. [Google Scholar] [CrossRef]
- Radhi, K.A.; Matti, B.F.; Hamzah, I.H.; Alkasir, R. The role of miRNA-150 between different BCR-ABL p210 transcript levels and between different levels of imatinib optimal response in CML patients. Al-Mustansiriyah J. Sci. 2023, 34, 16–22. [Google Scholar] [CrossRef]
- Dinet, J.; Favart, M.; Passerault, J.M. Searching for information in an online public access catalogue (OPAC): The impacts of information search expertise on the use of Boolean operators. J. Comput. Assist. Learn. 2004, 20, 338–346. [Google Scholar] [CrossRef]
- Innocenti, T.; Feller, D.; Giagio, S.; Salvioli, S.; Minnucci, S.; Brindisino, F.; Cosentino, C.; Piano, L.; Chiarotto, A.; Ostelo, R. Adherence to the PRISMA statement and its association with risk of bias in systematic reviews published in rehabilitation journals: A meta-research study. Rev. Bras. Fisioter. 2022, 26, 100450. [Google Scholar] [CrossRef]
- Kahale, L.A.; Elkhoury, R.; El Mikati, I.; Pardo-Hernandez, H.; Khamis, A.M.; Schünemann, H.J.; Haddaway, N.R.; Akl, E.A. Tailored PRISMA 2020 flow diagrams for living systematic reviews: A methodological survey and a proposal. F1000Research 2022, 10, 192. [Google Scholar] [CrossRef]
- Open Science Framework. Available online: https://osf.io/dashboard (accessed on 12 April 2024).
- Research Project. The Possibility of Using miR-150 as a Novel Biomarker in Multiple Sclerosis for the Detection and Progression of the Disease. Available online: https://osf.io/zmwgh (accessed on 6 June 2024).
- Więckowska, B.; Kubiak, K.B.; Jóźwiak, P.; Moryson, W.; Stawińska-Witoszyńska, B. Cohen’s Kappa Coefficient as a Measure to Assess Classification Improvement following the Addition of a New Marker to a Regression Model. Int. J. Environ. Res. Public Health 2022, 19, 10213. [Google Scholar] [CrossRef]
- Stang, A.; Jonas, S.; Poole, C. Case study in major quotation errors: A critical commentary on the Newcastle-Ottawa scale. Eur. J. Epidemiol. 2018, 33, 1025–1031. [Google Scholar] [CrossRef]
- Shea, B.J.; Reeves, B.C.; Wells, G.; Thuku, M.; Hamel, C.; Moran, J.; Moher, D.; Tugwell, P.; Welch, V.; Kristjansson, E.; et al. AMSTAR 2: A critical appraisal tool for systematic reviews that include randomised or non-randomised studies of healthcare interventions, or both. BMJ 2017, 358, j4008. [Google Scholar] [CrossRef]
- StataCorp Stata MP 16.0 Free Download. Available online: https://filecr.com/windows/stata-mp/?id=178670608000 (accessed on 29 May 2024).
- Kulinskaya, E.; Hoaglin, D.C. On the Q statistic with constant weights in meta-analysis of binary outcomes. BMC Med. Res. Methodol. 2023, 23, 146. [Google Scholar] [CrossRef]
- Baragilly, M.; Willis, B.H. On estimating a constrained bivariate random effects model for meta-analysis of test accuracy studies. Stat. Methods Med. Res. 2022, 31, 287–299. [Google Scholar] [CrossRef]
- Zhou, Y.; Huang, A.; Hattori, S. A likelihood based sensitivity analysis for publication bias on summary ROC in meta-analysis of diagnostic test accuracy. arXiv 2021, arXiv:2106.04253. [Google Scholar]
- Olsson-Collentine, A.; Bakker, M.; Wicherts, J. Unreliable Heterogeneity: How Measurement Errorobscures Heterogeneity in Meta-Analyses Inpsychology. OSF Prepr. 2023. [Google Scholar] [CrossRef]
- Bowden, J.; Davey Smith, G.; Burgess, S. Mendelian randomization with invalid instruments: Effect estimation and bias detection through Egger regression. Int. J. Epidemiol. 2015, 44, 512–525. [Google Scholar] [CrossRef]
- Martinez, B.; Peplow, P.V. MicroRNAs in blood and cerebrospinal fluid as diagnostic biomarkers of multiple sclerosis and to monitor disease progression. Neural Regen. Res. 2020, 15, 606–619. [Google Scholar] [CrossRef]
- Quintana, E.; Ortega, F.J.; Robles-Cedeño, R.; Villar, M.L.; Buxó, M.; Mercader, J.M.; Alvarez-Cermeño, J.C.; Pueyo, N.; Perkal, H.; Fernández-Real, J.M.; et al. miRNAs in cerebrospinal fluid identify patients with MS and specifically those with lipid-specific oligoclonal IgM bands. Mult. Scler. 2017, 23, 1716–1726. [Google Scholar] [CrossRef]
- Bergman, P.; Piket, E.; Khademi, M.; James, T.; Brundin, L.; Olsson, T.; Piehl, F.; Jagodic, M. Circulating miR-150 in CSF is a novel candidate biomarker for multiple sclerosis. Neurol. Neuroimmunol. Neuroinflamm. 2016, 3, e219. [Google Scholar] [CrossRef]
- Gandhi, R. MicroRNAs as potential biomarkers for multiple sclerosis. Mult. Scler. J. 2015, 21, 1095–1103. [Google Scholar] [CrossRef]
- Martinelli-Boneschi, F.; Fenoglio, C.; Brambilla, P.; Sorosina, M.; Giacalone, G.; Esposito, F.; Serpente, M.; Cantoni, C.; Ridolfi, E.; Rodegher, M.; et al. MicroRNA and mRNA expression profile screening in multiple sclerosis patients to unravel novel pathogenic steps and identify potential biomarkers. Neurosci. Lett. 2012, 508, 4–8. [Google Scholar] [CrossRef]
- Al-Temaimi, R.; Alshammari, N.; Alroughani, R. Analysis of potential microRNA biomarkers for multiple sclerosis. Exp. Mol. Pathol. 2024, 137, 104903. [Google Scholar] [CrossRef]
- Scaroni, F.; Visconte, C.; Serpente, M.; Golia, M.T.; Gabrielli, M.; Huiskamp, M.; Hulst, H.E.; Carandini, T.; De Riz, M.; Pietroboni, A.; et al. miR-150-5p and let-7b-5p in Blood Myeloid Extracellular Vesicles Track Cognitive Symptoms in Patients with Multiple Sclerosis. Cells 2022, 11, 1551. [Google Scholar] [CrossRef] [PubMed]
- Piket, E.; Zheleznyakova, G.Y.; Kular, L.; Jagodic, M. Small non-coding RNAs as important players, biomarkers and therapeutic targets in multiple sclerosis: A comprehensive overview. J. Autoimmun. 2019, 101, 17–25. [Google Scholar] [CrossRef] [PubMed]
- Perdaens, O.; Dang, H.A.; D’Auria, L.; van Pesch, V. CSF MicroRNAs Discriminate MS Activity and Share Similarity to Other Neuroinflammatory Disorders. Neurol. Neuroimmunol. Neuroinflamm. 2020, 7, e673. [Google Scholar] [CrossRef] [PubMed]
- Søndergaard, H.B.; Hesse, D.; Krakauer, M.; Sørensen, P.S.; Sellebjerg, F. Differential microRNA expression in blood in multiple sclerosis. Mult. Scler. J. 2013, 19, 1849–1857. [Google Scholar] [CrossRef] [PubMed]
- Zeng, M.L.; Clunis, J. FAIR+ FIT: Guiding Principles and Functional Metrics for Linked Open Data (LOD) KOS Products. J. Data Inf. Sci. 2020, 5, 93–118. [Google Scholar] [CrossRef]
- Izcovich, A.; Chu, D.K.; Mustafa, R.A.; Guyatt, G.; Brignardello-Petersen, R. A guide and pragmatic considerations for applying GRADE to network meta-analysis. BMJ 2023, 381, e074495. [Google Scholar] [CrossRef] [PubMed]
- Bezerra, C.T.; Grande, A.J.; Galvao, V.K.; dos Santos, D.H.M.; Atallah, A.N.; Silva, V. Assessment of the strength of recommendation and quality of evidence: GRADE checklist. A descriptive study. Sao Paulo Med. J. 2022, 140, 829–836. [Google Scholar] [CrossRef] [PubMed]
- Mohammad, H.R. Emerging imaging and liquid biomarkers in multiple sclerosis. Eur. J. Immunol. 2023, 53, 2250228. [Google Scholar] [CrossRef]
- Gaytán-Pacheco, N.; Ibáñez-Salazar, A.; Herrera-Van Oostdam, A.S.; Oropeza-Valdez, J.J.; Magaña-Aquino, M.; Adrián López, J.; Monárrez-Espino, J.; López-Hernández, Y. miR-146a, miR-221, and miR-155 are Involved in Inflammatory Immune Response in Severe COVID-19 Patients. Diagnostics 2022, 13, 133. [Google Scholar] [CrossRef] [PubMed]
- Elkhodiry, A.A.; Zamzam, D.A.; El Tayebi, H.M. MicroRNA-155 modulation of CD8+ T-cell activity personalizes response to disease-modifying therapies of patients with relapsing-remitting multiple sclerosis. Med. Int. 2023, 3, 1–10. [Google Scholar] [CrossRef]
- Thompson, J.W.; Hu, R.; Huffaker, T.B.; Ramstead, A.G.; Ekiz, H.A.; Bauer, K.M.; Tang, W.W.; Ghazaryan, A.; Round, J.L.; Fujinami, R.S.; et al. MicroRNA-155 Plays Selective Cell-Intrinsic Roles in Brain-Infiltrating Immune Cell Populations during Neuroinflammation. J. Immunol. 2023, 210, 926–934. [Google Scholar] [CrossRef] [PubMed]
- Mao, S.; Wu, J.; Yan, J.; Zhang, W.; Zhu, F. Dysregulation of miR-146a: A causative factor in epilepsy pathogenesis, diagnosis, and prognosis. Front. Neurol. 2023, 14, 1094709. [Google Scholar] [CrossRef] [PubMed]
- Cantoni, C.; Ghezzi, L.; Choi, J.; Cross, A.H.; Piccio, L. Targeting miR-223 enhances myeloid-derived suppressor cell suppressive activities in multiple sclerosis patients. Mult. Scler. Relat. Disord. 2023, 76, 104839. [Google Scholar] [CrossRef] [PubMed]
- Lucius, K. Novel and Emerging Markers of Chronic or Low-Grade Inflammation. Integr. Complement. Ther. 2023, 29, 130–142. [Google Scholar] [CrossRef]
- Ignatova, V.A. Biomarkers in Multiple Sclerosis; IntechOpen: Rijeka, Croatia, 2022. [Google Scholar] [CrossRef]
- Minutti-Zanella, C.; Bojalil-Alvarez, L.; Garcia-Villasenor, E.; Lopez-Martinez, B.; Perez-Turrent, M.; Murrieta-Alvarez, I.; Ruiz-Delgado, G.J.; Argüelles, G.J.R. miRNAs in multiple sclerosis: A clinical approach. Mult. Scler. Relat. Disord. 2022, 63, 103835. [Google Scholar] [CrossRef] [PubMed]
- Clyne, B.; Olshaker, J.S. The C-reactive protein. J. Emerg. Med. 1999, 17, 1019–1025. [Google Scholar] [CrossRef] [PubMed]
- Olsson, A.; Gustavsen, S.; Gisselø Lauridsen, K.; Chenoufi Hasselbalch, I.; Sellebjerg, F.; Bach Søndergaard, H.; Bang Oturai, A. Neutrophil-to-lymphocyte ratio and CRP as biomarkers in multiple sclerosis: A systematic review. Acta Neurol. Scand. 2021, 143, 577–586. [Google Scholar] [CrossRef] [PubMed]
- Vani, P.B.; Chitra, V. The Role of the Proinflammatory and Anti-inflammatory Cytokines in Multiple Sclerosis. Biomed. Pharmacol. J. 2022, 15, 137–146. [Google Scholar] [CrossRef]
- de Ferronato, G.A.; Cerezetti, M.B.; Bridi, A.; Prado, C.M.; Dos Santos, G.; Bastos, N.M.; da Rosa, P.M.; Ferst, J.G.; da Silveira, J.C. MicroRNA Profiling Using a PCR-Based Method. In MicroRNA Profiling: Methods and Protocols; Springer: New York, NY, USA, 2022. [Google Scholar] [CrossRef]
- Brown, A.L.; Al-Samadi, A.; Sperandio, M.; Soares, A.B.; Teixeira, L.N.; Martinez, E.F.; Demasi, A.P.D.; Araújo, V.C.; Leivo, I.; Salo, T.; et al. MiR-455-3p, miR-150 and miR-375 are aberrantly expressed in salivary gland adenoid cystic carcinoma and polymorphous adenocarcinoma. J. Oral Pathol. Med. 2019, 48, 840–845. [Google Scholar] [CrossRef]
- Courts, C.; Madea, B. Specific micro-RNA signatures for the detection of saliva and blood in forensic body-fluid identification. J. Forensic Sci. 2011, 56, 1464–1470. [Google Scholar] [CrossRef]
- Arcas, V.C.; Tig, I.A.; Moga, D.F.C.; Vlad, A.L.; Roman-Filip, C.; Fratila, A.M. A Systematic Literature Review on Inflammatory Markers in the Saliva of Patients with Multiple Sclerosis: A Cause or a Consequence of Periodontal Diseases. Medicina 2024, 60, 859. [Google Scholar] [CrossRef] [PubMed]
- Roman-Filip, C.; Catana, M.G.; Bereanu, A.; Lazaroae, A.; Gligor, F.; Sava, M. Therapeutic plasma exchange and double filtration plasmapheresis in severe neuroimmune disorders/terapijska izmjena plazme i plazmafereza s dvostrukim filtriranjem u teškim neuroimunim bolestima. Acta Clin. Croat. 2019, 58, 621–627. [Google Scholar] [PubMed]

 , moderate risk
  , or low risk
  for each risk of bias item. (b) A Summary Plot illustrating the review authors’ assessments of the risk of bias for each item, presented as percentages for all included studies. The assessments are categorised as high risk
  , moderate risk
  , and low risk
  [60,61,62,63,64,65,66,67,68,69].
, moderate risk , or low risk for each risk of bias item. (b) A Summary Plot illustrating the review authors’ assessments of the risk of bias for each item, presented as percentages for all included studies. The assessments are categorised as high risk , moderate risk , and low risk [60,61,62,63,64,65,66,67,68,69].
[60,61,62,63,64,65,66,67,68,69].
, moderate risk , or low risk for each risk of bias item. (b) A Summary Plot illustrating the review authors’ assessments of the risk of bias for each item, presented as percentages for all included studies. The assessments are categorised as high risk , moderate risk , and low risk [60,61,62,63,64,65,66,67,68,69].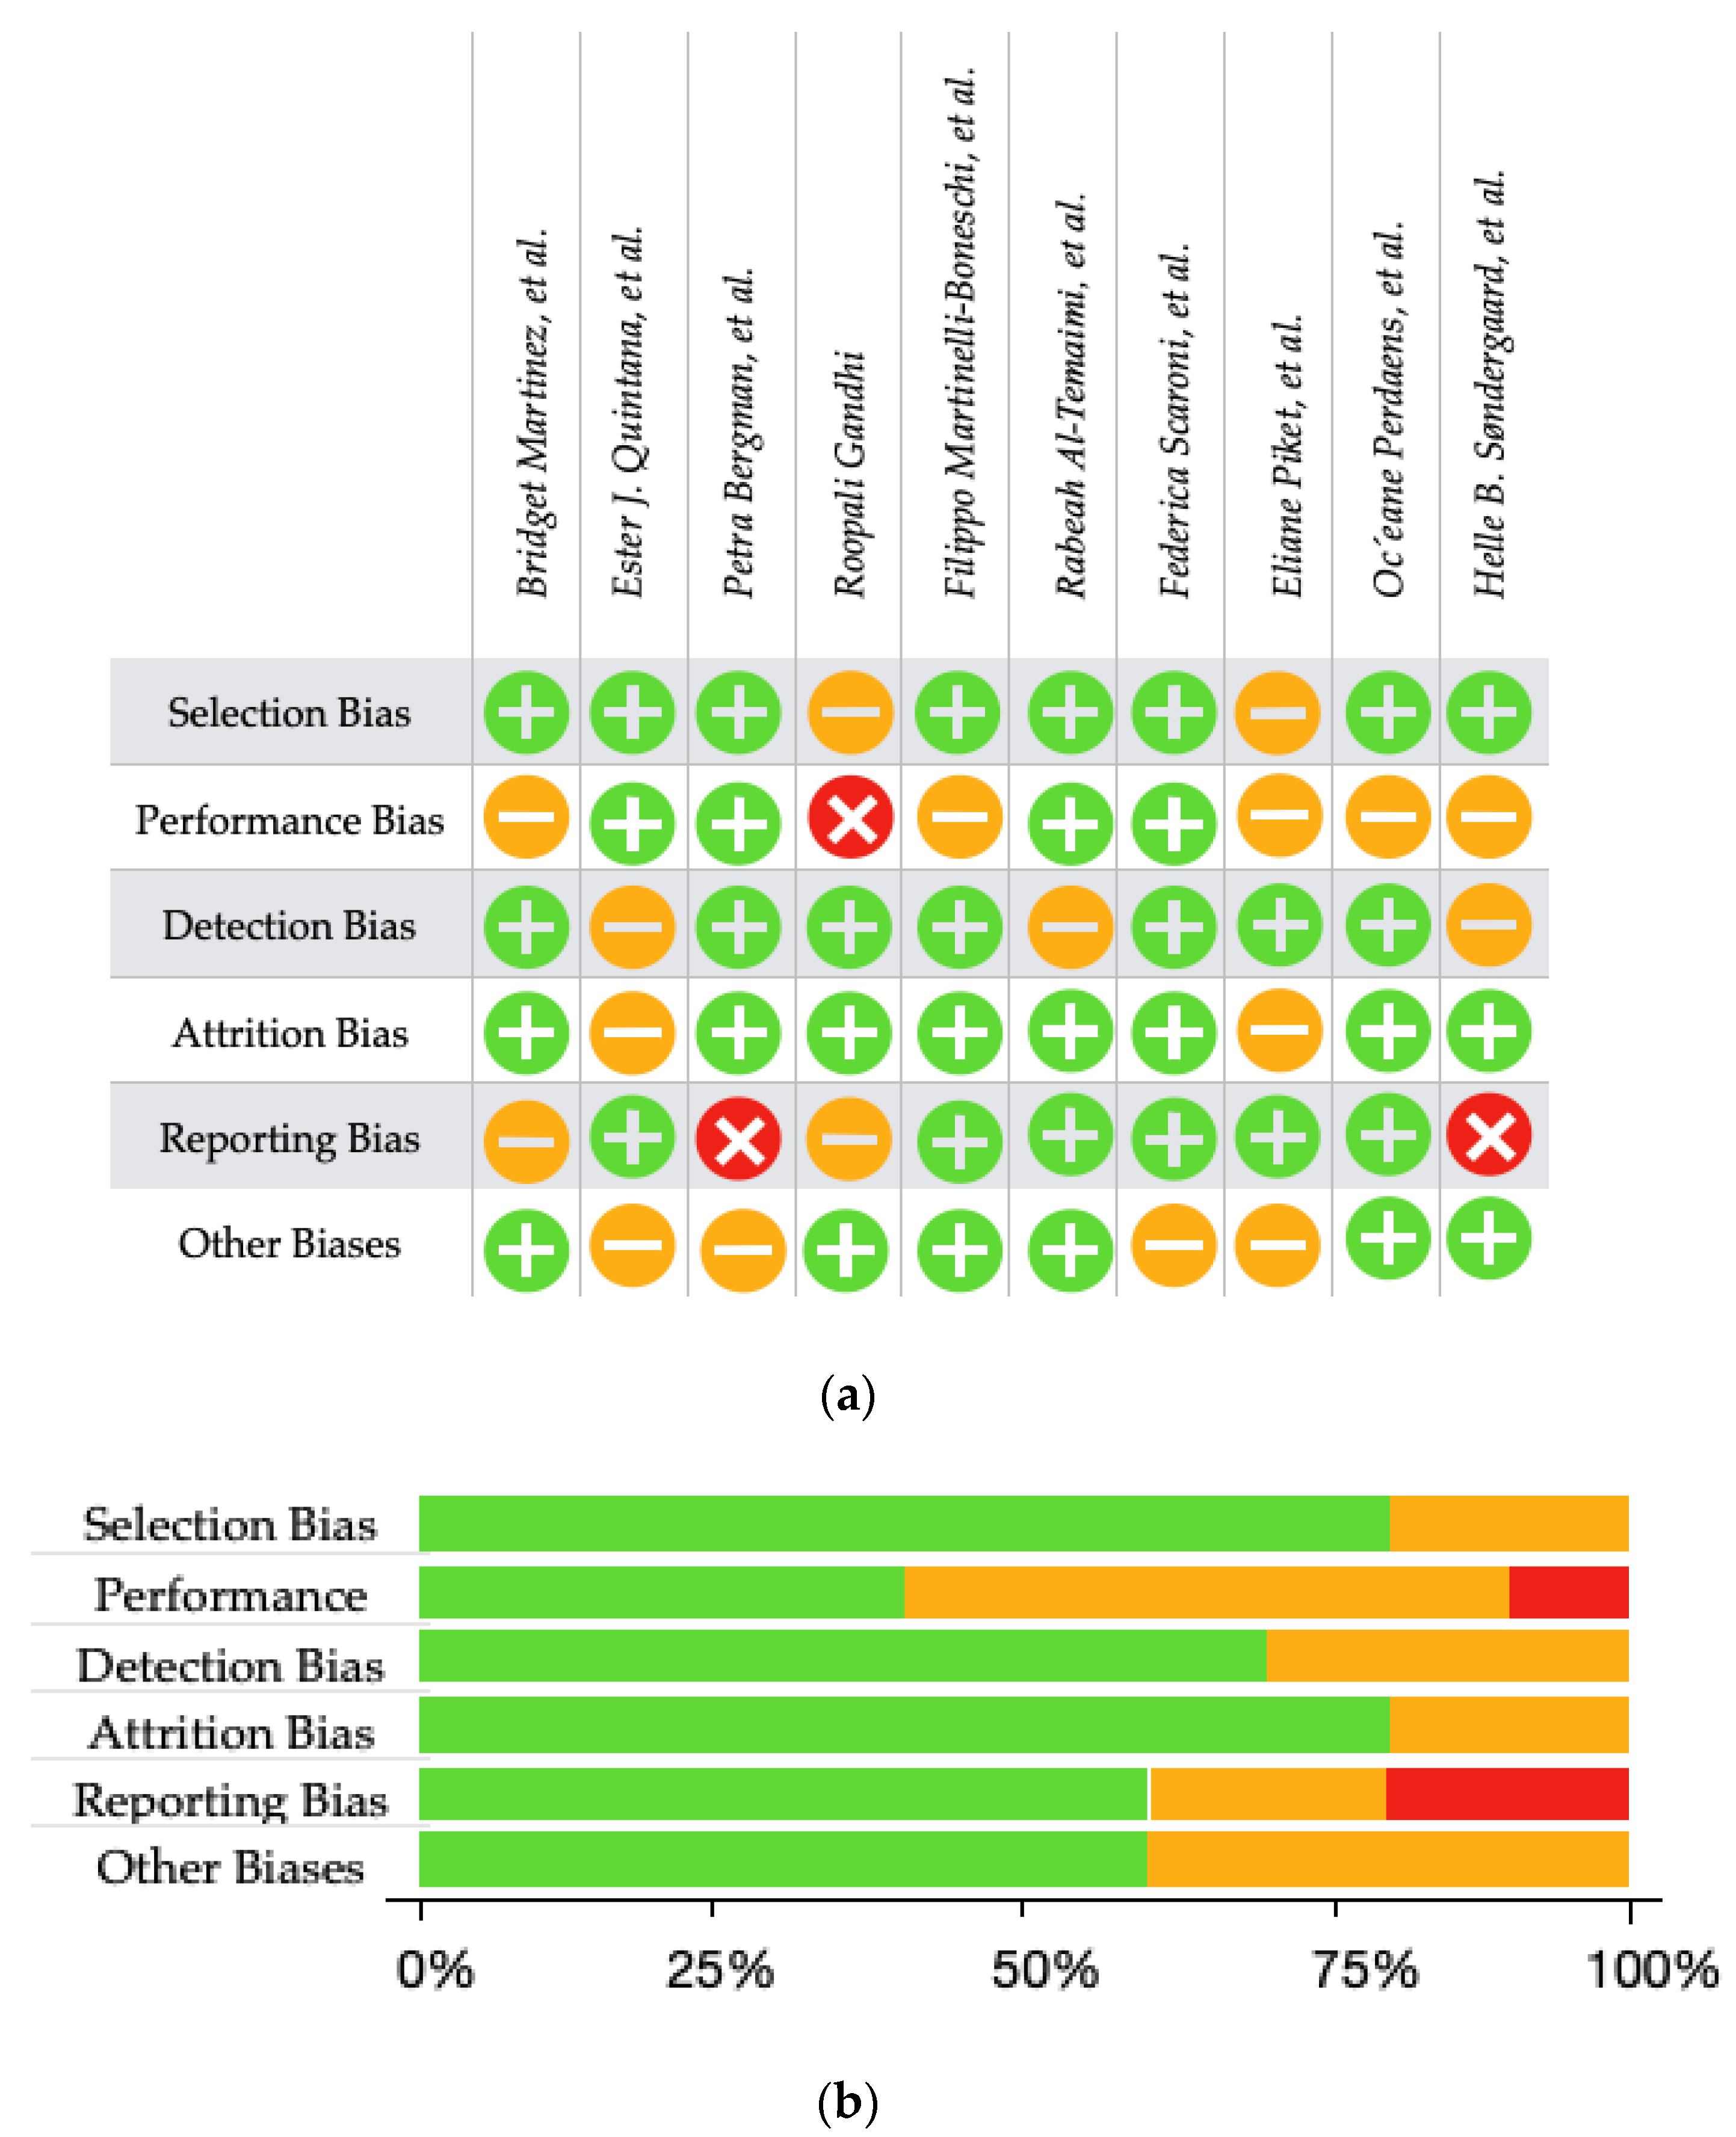
 , Bergman et al.
  , Al-Temaimi et al.
  [61,62,65].
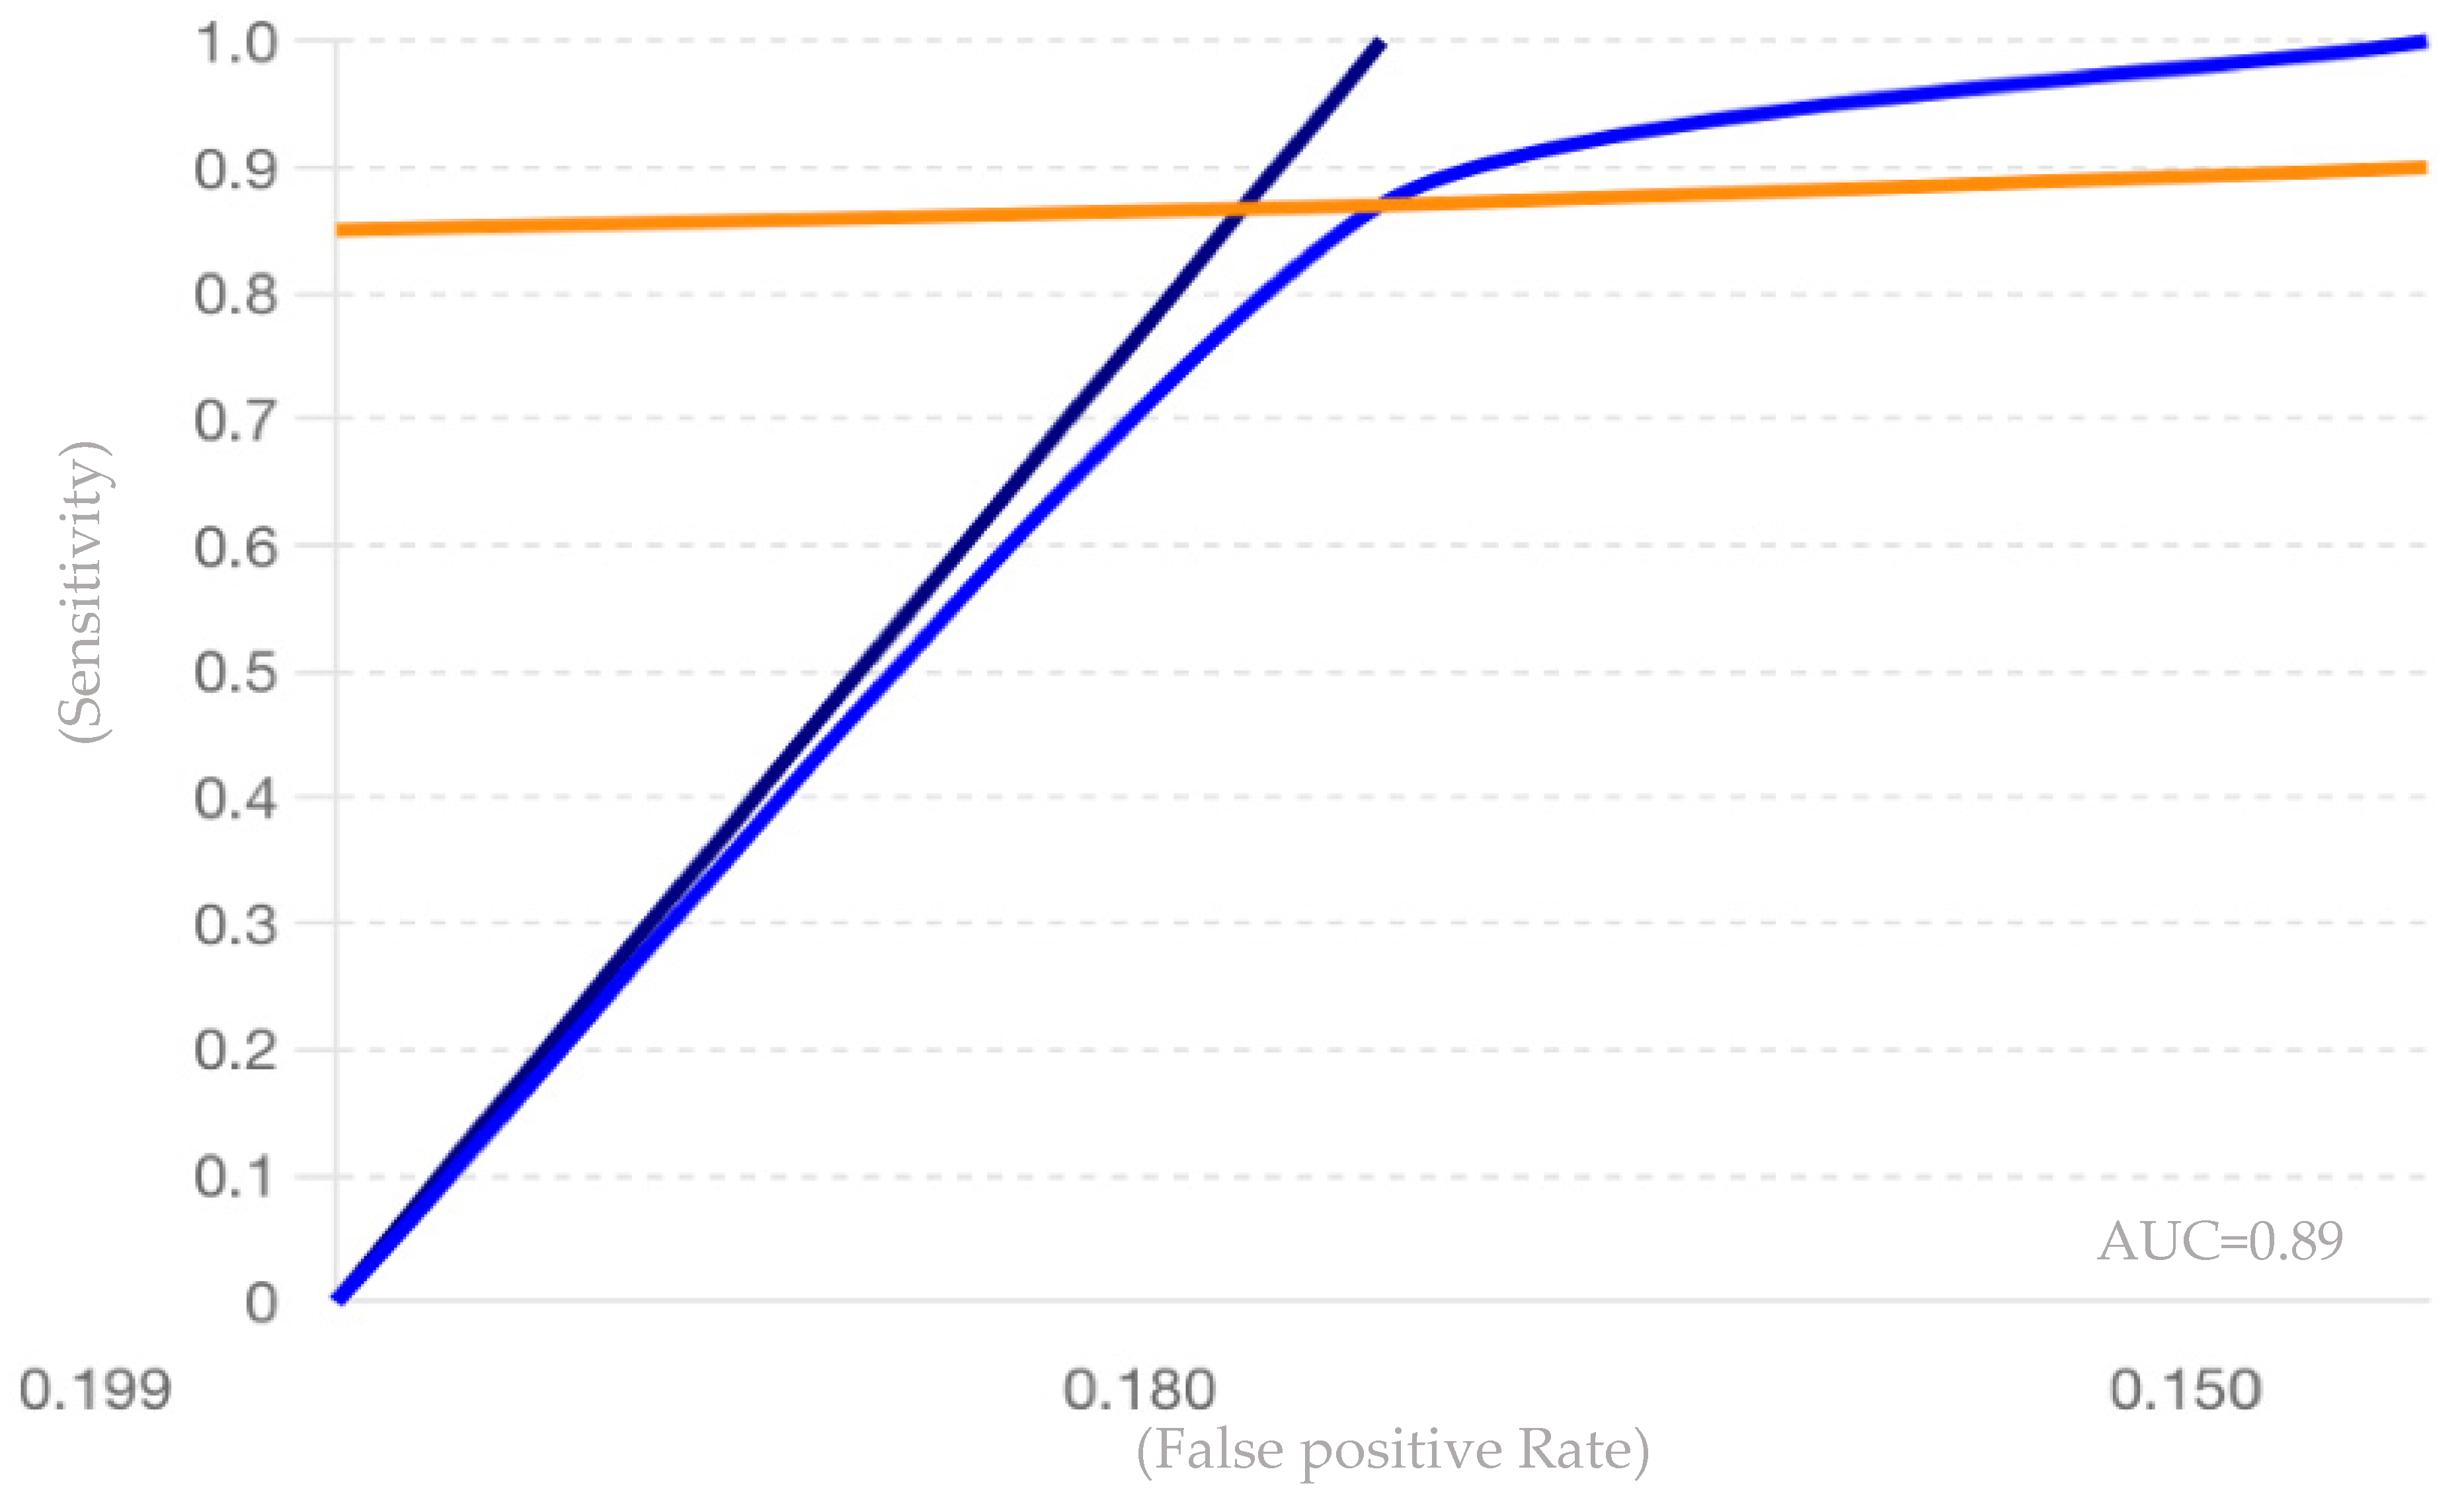

| Keywords Combinations |
|---|
| “miR-150” OR “miRNA-150” AND “Multiple Sclerosis” |
| “miR-150” OR “miRNA-150” AND “biomarker” |
| “miR-150” AND “Multiple Sclerosis” AND “biomarker” |
| “miRNA-150” AND “Multiple Sclerosis” AND “biomarker” |
| “miR-150” OR “miRNA-150” AND “Multiple Sclerosis” AND “biomarker” |
| Main Authors Name | Year of Pub. | Type of Study | Material and Methods | Methods for miR-150 Detection | Details/Findings | Correlation of miR-150 Levels with Clinical Parameters | Authors’ Interpretation of Findings | Other miRNAs Studied | Population Characteristics |
|---|---|---|---|---|---|---|---|---|---|
| Matinez et al. [60] | 2019 | Review | Literature search and meta-analysis | Does not mention | miR-150 levels were significantly elevated in MS patients compared to controls, with correlations to disease activity and treatment response. | miR-150 levels correlate with the presence of lipid-specific IgM bands, the likelihood of CIS conversion to MS, and potentially with broader indicators of disease activity. These correlations highlight the potential of miR-150 as a biomarker for monitoring disease progression in MS. | miR-150 shows promise as a diagnostic biomarker for MS, with significant upregulation in MS patients’ CSF compared to controls and a notable ability to distinguish MS from other neurological conditions. It is also useful in predicting the conversion of CIS to MS. | 110 miRNAs mentioned, among them ebv-miR-BHRF1-2-5p, ebv-miR-BHRF1-3, let-7a-5p, let-7b-5p, and let-7c-5p | From two studies that mentioned miR150 there were 218 patients mith MS and 442 caracterised with OND |
| Quintaa et al. [61] | 2017 | Case-control study | The study involved a discovery phase using TaqMan low-density arrays to profile miRNAs in the CSF of MS patients and controls, followed by a validation phase using RT-PCR in a larger cohort to confirm the differential expression of selected miRNAs. Laboratory techniques included nephelometry, isoelectric focusing, immunoblotting, and various RNA analysis methods, with statistical comparisons made using standard tests and ROC curve analysis for biomarker evaluation. | Profiling with TaqMan low-density arrays and validating cith RT-PCR | By ROC analysis, miR-150 had the greatest AUC value of 0.684 for distinguishing MS patients from other neurological diseases OND. | Clinical and radiological data collected for MS patients from MRI performed within an average of 3 months showed no differences between LS_OCMB- and LS_OCMB+ groups, except for onset symptoms, where 50% of LS_OCMB+ patients presented with medullar (spinal cord) symptoms. | The expression of miR-150 was upregulated in MS patients compared to OND controls. | miR-328, miR-30a-5p, miR-645 (all upregulated in MS) and miR-365, miR-21, miR-191, miR-199a3p, miR-106a, miR-146a (all downregulated in MS) | 86 patients with MS and 55 OND controls, RRMS, PPMS, SPMS among the MS patients |
| Bergman et al. [62] | 2016 | Clinical research study | In the study, CSF samples were collected from patients with CIS, relapsing-remitting MS, and control groups. miRNA profiling was performed using TaqMan miRNA arrays, and subsequent validation was carried out with real-time PCR on two independent patient cohorts to assess the levels of miR-150. | RT-PCR | miR-145 and miR-150 of the tested miRNAs were significantly different for MS compared to NINDC in cohort 1. In the larger validation cohort 2, the significantly higher levels of miR-150 in MS compared to both NINDC and INDC were replicated. Additionally, significantly higher levels of miR-150 were observed between patients with CIS and NINDC. | Higher levels of miR-150 in CSF were significantly associated with increased CSF cell count, elevated immunoglobulin G (IgG) index, and the presence of OCBs. Additionally, miR-150 levels correlated with the levels of candidate protein biomarkers such as C-X-C motif chemokine 13 (CXCL13), matrix metallopeptidase 9 (MMP-9), and osteopontin (OPN). However, there was no significant correlation between miR-150 levels and the number of MRI T2 lesions or the EDSS score. | The authors conclude that miR-150 is a promising biomarker for MS. Its elevated levels in CSF of MS patients correlate with active CNS inflammation and established immunologic parameters. The miR-150/miR-204 ratio also shows potential as an effective biomarker, performing similarly to current top protein biomarkers, indicating its value in early diagnosis and disease monitoring. | miR-204, miR-145, The ratio of miR-150 to miR-204 was significantly higher in MS patients compared to both NINDC and INDC in cohort 2. | Two validation cohorts of patients were recruted: cohort 1 comprised 34 CIS patients, 43 MS patients, 34 NINDC, and 31 INDC, while cohort 2 included 96 CIS patients, 120 MS patients, 119 NINDC, and 95 INDC. |
| Roopali Gandhi [63] | 2015 | Topical Review | Literature search and meta-analysis | Illumina BeadArray, qPCR | To develop a miRNA-based biomarker for MS or any disease, it is crucial to quantify miRNAs from various samples with high sensitivity, accuracy, and reproducibility. | miR-150, along with other miRNAs, showed altered expression levels in MS patients compared to healthy controls and that its expression levels could be linked to disease activity and progression. | There is significant enthusiasm about using miRNAs as biomarkers, driven by their stability and ease of detection. However, thereare a wide range of results reported by different research groups, and its hard to find a perfect miRNA as a biomarker in MS. | 151 miRNAs listed. Five examples include: miR-34a, miR-155, miR-326, miR-18b, and miR-493 | Only one study focusing on miR-150 where the population consists of 33 individuals. |
| Martinelli-Bonesch et al. [64] | 2012 | Cross-sectional observational study | Peripheral blood mononuclear cells (PBMCs) from 19 MS patients and 14 controls were used to test the expression profile of 1145 microRNAs and to perform whole-genome mRNA profiling. The researchers employed Illumina BeadArray technology for the microRNA and mRNA screenings and validated the findings using quantitative PCR and bioinformatic prediction tools to identify potential genetic targets and biomarkers. | Illumina BeadArray, qPCR | This study identified 104 miRNAs with dysregulated expression in MS patients compared to controls. However, upon validation with a separate group of individuals using qPCR, only two miRNAs, let-7g and miR-150, showed consistent differences. | The study found that miR-150 was significantly downregulated in MS patients compared to controls. This downregulation was confirmed through quantitative PCR in a second sample of MS patients and controls. Additionally, the study identified putative target genes of miR-150 that are potentially involved in MS pathogenesis, such as the suppressor of cytokine signaling-1 gene (SOCS1), which affects immune processes within the CNS and has been associated with MS severity and progression. | Significant dysregulation of miRNAs in MS patients. This suggest that these miRNAs, particularly miR-150, may be involved in the pathogenesis of MS through their predicted target genes, which include those involved in immune processes within the CNS. The identification of these miRNAs as being deregulated in MS patients provides potential novel targets for further research and potential biomarkers for the disease, aiding in understanding the molecular mechanisms underlying MS and developing diagnostic and therapeutic strategies. | let-7g, miR-363, miR-31, miR-524-3p, miR-876-3p, miR-223, miR-550, miR-181c, and miR-374a | The study included a total of 33 individuals, comprising 19 patients diagnosed with MS and 14 control subjects. Among the MS patients, there were 7 with RRMS, 6 with SPMS, and 6 with PPMS. This diverse representation of MS subtypes alongside the control group provided a comprehensive basis for analysis. |
| Al-Temaimi et al. [65] | 2024 | Observational cohort study | The study by Al-Temaimi et al. analyzed plasma samples from 76 MS patients and 75 healthy controls to evaluate the expression of seven miRNAs using real-time quantitative PCR. The miRNAs were selected based on previous associations with MS, and statistical analyses were performed to assess their potential as diagnostic and prognostic biomarkers. | PCR; (qRT-PCR) | The study found that miR-150-5p is significantly downregulated in SPMS patients compared to RRMS patients, and its increased expression is associated with reduced brain-derived neurotrophic factor (BDNF) levels, indicating its potential as a biomarker for inflammation and SPMS transition. | MiR-150-5p had significantly lower fold expression in SPMS patients compared to RRMS patients when adjusted for age, sex, and treatment type. Additionally, increased miR-150-5p expression was associated with reduced levels of BDNF in the total cohort, indicating its potential role as a biomarker for inflammation and the transition from RRMS to SPMS. | The findings suggest that miR-150-5p, which is significantly downregulated in SPMS patients compared to RRMS patients, could serve as a potential biomarker for the transition from RRMS to SPMS. Additionally, the association of increased miR-150-5p expression with reduced BDNF levels underscores its potential role in inflammation and disease progression in MS. | miR-23a-3p, miR-326, miR-223-3p, miR-320a-3p, miR-145-5p, and miR-155-5p | The study included 76 MS patients and 75 healthy controls. Among the MS patients, 56 had RRMS and 20 had SPMS. |
| Scaroni et al. [66] | 2022 | Observational cohort study | The study analyzed plasma samples from two cohorts of MS patients, isolating total and myeloid extracellular vesicles (EVs) using Exoquick precipitation and Isolectin B4 affinity capture, respectively. The levels of 14 miRNAs targeting synaptic genes were measured in these EVs using RT-PCR, and cognitive function was assessed with neuropsychological tests. | RT-PCR | The study found that miR-150-5p levels were significantly higher, and let-7b-5p levels were significantly lower in myeloid extracellular vesicles from cognitively impaired MS patients compared to cognitively preserved ones, suggesting these miRNAs as potential biomarkers for cognitive deficits in MS. | The study found a moderate positive correlation between miR-150-5p levels in myeloid extracellular vesicles and serum neurofilament light chain (sNf-L) levels, but no significant correlation with other clinical parameters such as age, gender, EDSS, disease duration, or age at disease onset. | The dysregulation of miR-150-5p and let-7b-5p in myeloid extracellular vesicles may be associated with cognitive deficits in MS rather than disease progression. They propose that these miRNAs could serve as potential biomarkers for cognitive impairment in MS, providing complementary information to traditional MRI measures. | let-7b-5p, miR-146a-5p, miR-223-3p, miR-320a-3p, miR-145-5p, miR-23a-3p, miR-326. | Two cohorts: an Italian cohort with 21 patients (17 RRMS, 4 PMS) with an average age of 42 years, and an Amsterdam cohort with 28 patients (23 RRMS, 5 PMS) with an average age of 44.9 years. The Italian cohort had an EDSS score of 2.4 and disease duration of 6.8 years, while the Amsterdam cohort had an EDSS score of 3.8 and disease duration of 14.9 years. |
| Piket et al. [67] | 2019 | Review | Literature search and meta-analysis | Not explicitly detailed | A comprehensive overview of the roles, potential as biomarkers, and therapeutic targets of small non-coding RNAs (sncRNAs) in MS, highlighting the significant regulatory functions of microRNAs in disease mechanisms, particularly focusing on their dysregulation and impact on immune and CNS processes. | Elevated levels of miR-150 in CSF have been linked to distinguishing RRMS from controls and predicting conversion from CIS to MS, suggesting its potential as a biomarker for disease progression. Additionally, changes in miR-150 levels have been associated with treatment response and immune cell activity. | Results suggest that microRNAs, including miR-150, have the potential to be used as biomarkers for MS. miR-150’s distinct patterns in various MS stages and its correlation with clinical parameters, emphasizing its diagnostic and prognostic potential, particularly in distinguishing between different stages of the disease and in predicting disease progression and treatment response. | miR-142-3p, miR-146a/b, miR-145, miR-155, miR-22, miR-223, miR-326, miR-584, miR-21, miR-17, miR-320, miR-103, miR-15, miR-548, and members of the let-7 family. | Does not mention any specific population regarding miR-150 presence |
| Perdaens et al. [68] | 2020 | Retrospective cross-sectional study | The study conducted a retrospective cross-sectional analysis of microRNA expression MS across three biological compartments: CSF, serum, and peripheral blood mononuclear cells (PBMCs). PCR arrays measured 127 miRNAs on pooled samples, followed by quantitative PCR on individual samples from different patient cohorts. Post hoc analyses included principal component analysis (PCA), gene set, and pathway enrichment analysis. | PCR (qPCR), The miRNAs were isolated using the miRNeasy Serum/Plasma Kit for CSF and serum, and the miRNeasy Mini Kit for PBMCs. | The study found that miR-150, along with other differentially expressed miRNAs, was predominantly dysregulated in the cerebrospinal fluid of patients with MS during relapses. These miRNAs, including miR-150, were shown to potentially serve as biomarkers for MS disease activity, correlating with the extent of intrathecal inflammation. | miR-150 levels were moderately correlated with CSF pleocytosis, a clinical parameter indicating the presence of white blood cells in the CSF. This correlation highlights miR-150’s potential as a biomarker for monitoring disease activity and intrathecal inflammation in MS patients. | Results indicate that miRNAs, particularly miR-150, have significant potential as biomarkers for disease activity and intrathecal inflammation in MS. The findings suggest that miRNAs could serve as diagnostic tools and provide insights into immune and neuroinflammatory processes involved in MS, potentially guiding therapeutic interventions. | miR-15a-3p, miR-124-5p, miR-149-3p, miR-29c-3p, miR-33a-3p, miR-34c-5p, and miR-297 | The study involved 68 participants, including 40 with relapsing MS, 13 with remitting MS, and 15 symptomatic controls. Patients were matched for age and sex, and none were undergoing disease-modifying treatment. |
| Søndergaard et al. [69] | 2013 | Observational study | Global miRNA expression profiling analysis was performed in PBMCs, with selected miRNAs measured in plasma. Expression of miRNAs was detected by real-time qPCR and compared with cytokines related to inflammation and disease activity; subsequently, selected miRNAs were analyzed in PBMC subpopulations isolated by magnetic bead separation. | Real-time qPCR | The study found that miR-150, along with several other miRNAs, was differentially expressed in the blood of MS patients compared to healthy controls, suggesting its potential role in MS pathogenesis. | Specific miRNA expression levels, including miR-150, showed correlations with clinical parameters such as disease activity and immune cell profiles in MS patients. | Differential expression of miRNAs, including miR-150, in the blood of MS patients may reflect underlying disease mechanisms and hold potential as biomarkers for MS diagnosis and progression. | miR-21, miR-146a, and miR-155 | The study included 20 untreated patients with RRMS and 20 healthy controls (HCs), matched for age and sex to ensure comparability between the groups. |
| Author and Year | Effect Sizes | Measures of Variability | p-Values | Sample Sizes |
|---|---|---|---|---|
| Quintana et al. (2017) [61] | Higher levels of miR-150 in MS | Median and IQR: 0.129 (0.167) vs. 0.057 (0.121) | <0.001 | 86 MS patients (39 LS_OCMB+ and 47 LS_OCMB−), 55 controls |
| Bergman et al. (2016) [62] | Higher miR-150 levels in MS | Not present | <0.0001 | Validation cohort 1: 142, Validation cohort 2: 430 |
| Martinelli-Boneschi et al. (2012) [64] | Fold change: −1.03 | SEM in MS: ±197.8, SEM in controls: ±162.7 | 2.06 × 10⁻³ | 19 MS patients, 14 controls |
| Al-Temaimi et al. (2024) [65] | Fold change: 4.027 | SEM: ±0.84 | 0.554 | 76 MS, 75 HC |
| Scaroni et al. (2022) [66] | miR-150-5p upregulated in CI patients | RQ ± SEM: 3.29 ± 0.11 vs. 0.60 ± 0.2 | 0.03 | 26 CP, 23 CI patients |
| Perdaens et al. (2020) [68] | miR-150-5p upregulated in CSF during relapses | Fold change: 25.66 | <0.0001 | 40 patients with relapsing MS, 13 with remitting MS, 15 controls |
| Reviewer Pair | Number of Items | Agreed Items | Disagreed Items | Cohen’s Kappa Value |
|---|---|---|---|---|
| Reviewer 1 & Reviewer 2 | 18 | 16 | 2 | 0.85 |
| Reviewer 1 & Reviewer 3 | 18 | 17 | 1 | 0.92 |
| Reviewer 2 & Reviewer 3 | 18 | 17 | 1 | 0.92 |
| Main Author, Year of Publication | Selection | Comparability | Outcome/Exposure | Total | |||||
|---|---|---|---|---|---|---|---|---|---|
| C1 | C2 | C3 | C4 | C5 | C6 | C7 | C8 | ||
| Quintana et al., 2017 [61] | 1p | 1p | 1p | 1p | 2p | 1p | 1p | 0p | 8p |
| Bergman et al., 2016 [62] | 1p | 1p | 1p | 1p | 2p | 1p | 1p | 0p | 8p |
| Martinelli-Boneschi et al., 2012 [64] | 1p | 1p | 1p | 1p | 2p | 1p | 0p | 0p | 7p |
| Al-Temaimi et al., 2024 [65] | 1p | 1p | 1p | 1p | 1p | 1p | 1p | 0p | 7p |
| Scaroni et al., 2022 [66] | 1p | 1p | 1p | 1p | 2p | 1p | 0p | 0p | 7p |
| Perdaens et al., 2020 [68] | 1p | 1p | 1p | 1p | 2p | 1p | 1p | 0p | 8p |
| Søndergaard et al., 2023 [69] | 1p | 1p | 1p | 1p | 2p | 1p | 1p | 0p | 8p |
| AMSTAR 2 Critical Criteria | Matinez et al. [60] | Roopali Gandhi [63] | Piket et al. [67] |
|---|---|---|---|
| 1. PICO elements clearly stated and research question/objective appropriately framed | Yes | Yes | Yes |
| 2. Protocol registered before commencement of the review | Yes | Partial Yes | Yes |
| 3. Explanation for excluded studies | Yes | Yes | Yes |
| 4. Comprehensive literature search | Yes | Yes | Yes |
| 5. Status of publication (i.e., grey literature) used as an inclusion criterion | Yes | No | Yes |
| 6. List of excluded studies provided and justified | No | No | No |
| 7. Risk of bias from individual studies included in review | Yes | No | Yes |
| 8. Appropriateness of meta-analytical methods | Partial Yes | Yes | Yes |
| 9. Consideration of risk of bias when interpreting the results | Yes | Yes | Yes |
| 10. Assessment of presence and impact of publication bias | No | No | No |
| Criteria | Quintana et al. [61] | Bergman et al. [62] | Roopali Gandhi [63] | Martinez et al. [60] | Piket et al. [67] | Martinelli-Bonesch [64] | Al-Temaimi et al. [65] | Scaroni et al. [66] | Perdaens et al. [68] | Søndergaard et al. [69] |
|---|---|---|---|---|---|---|---|---|---|---|
| Year | 2017 | 2016 | 2017 | 2018 | 2019 | 2012 | 2024 | 2022 | 2020 | 2018 |
| Study Type | Cohort | Cohort | Review | Review | Review | Cohort | Cohort | Cohort | Cohort | Cohort |
| Initial Rating | Moderate | Moderate | Low | Low | Low | Moderate | Moderate | Moderate | Moderate | Moderate |
| Comparison | MS vs. controls | MS vs. controls | MS and others | MS and others | MS and others | MS vs. controls | MS vs. controls | MS vs. controls | MS vs. controls | MS vs. controls |
| Outcome | miR-150 levels | miR-150 levels | miR-150 in MS | miR-150 in MS | miR-150 in MS | miR-150 levels | miR-150 levels | miR-150 levels | miR-150 levels | miR-150 levels |
| Study Limitations (risk of bias) | Low | Moderate | High | High | High | Low | Moderate | Moderate | Low | Moderate |
| Inconsistency | Not significant | Not significant | Significant | Significant | Significant | Not significant | Not significant | Not significant | Not significant | Not significant |
| Indirectness of Evidence | Direct | Direct | Indirect | Indirect | Indirect | Direct | Direct | Direct | Direct | Direct |
| Imprecision | Low | Moderate | High | High | High | Low | Moderate | Moderate | Low | Moderate |
| Publication Bias | Undetected | Undetected | Possible | Possible | Possible | Undetected | Undetected | Undetected | Undetected | Undetected |
| Magnitude of Effect | High | Moderate | Low | Low | Low | High | Moderate | Moderate | High | Moderate |
| Dose-Response Association | Not applicable | Not applicable | Not applicable | Not applicable | Not applicable | Not applicable | Not applicable | Not applicable | Not applicable | Not applicable |
| All Plausible Biases—Confounders | Yes | Yes | Yes | Yes | Yes | Yes | Yes | Yes | Yes | Yes |
| Final Rating | High | Moderate | Moderate | Moderate | Moderat | High | Moderate | Moderate | High | Moderate |
| Study | Sensitivity | Specificity | Sample Size | PLR | NLR | ROC AUC |
|---|---|---|---|---|---|---|
| Quintana et al. (2017) [61] | 0.85 | 0.80 | 141 | 4.25 | 0.19 | 0.875 |
| Bergman et al. (2016) [62] | 0.87 | 0.82 | 572 | 4.83 | 0.16 | 0.885 |
| Perdaens et al. (2020) [68] | 0.90 | 0.85 | 68 | 6.00 | 0.12 | 0.925 |
| Martinelli-Boneschi et al. (2012) [64] | 0.75 | 0.70 | 33 | 2.50 | 0.36 | 0.725 |
| Al-Temaimi et al. (2024) [65] | 0.80 | 0.78 | 151 | 3.64 | 0.26 | 0.790 |
| Scaroni et al. (2022) [66] | 0.78 | 0.76 | 49 | 3.25 | 0.29 | 0.770 |
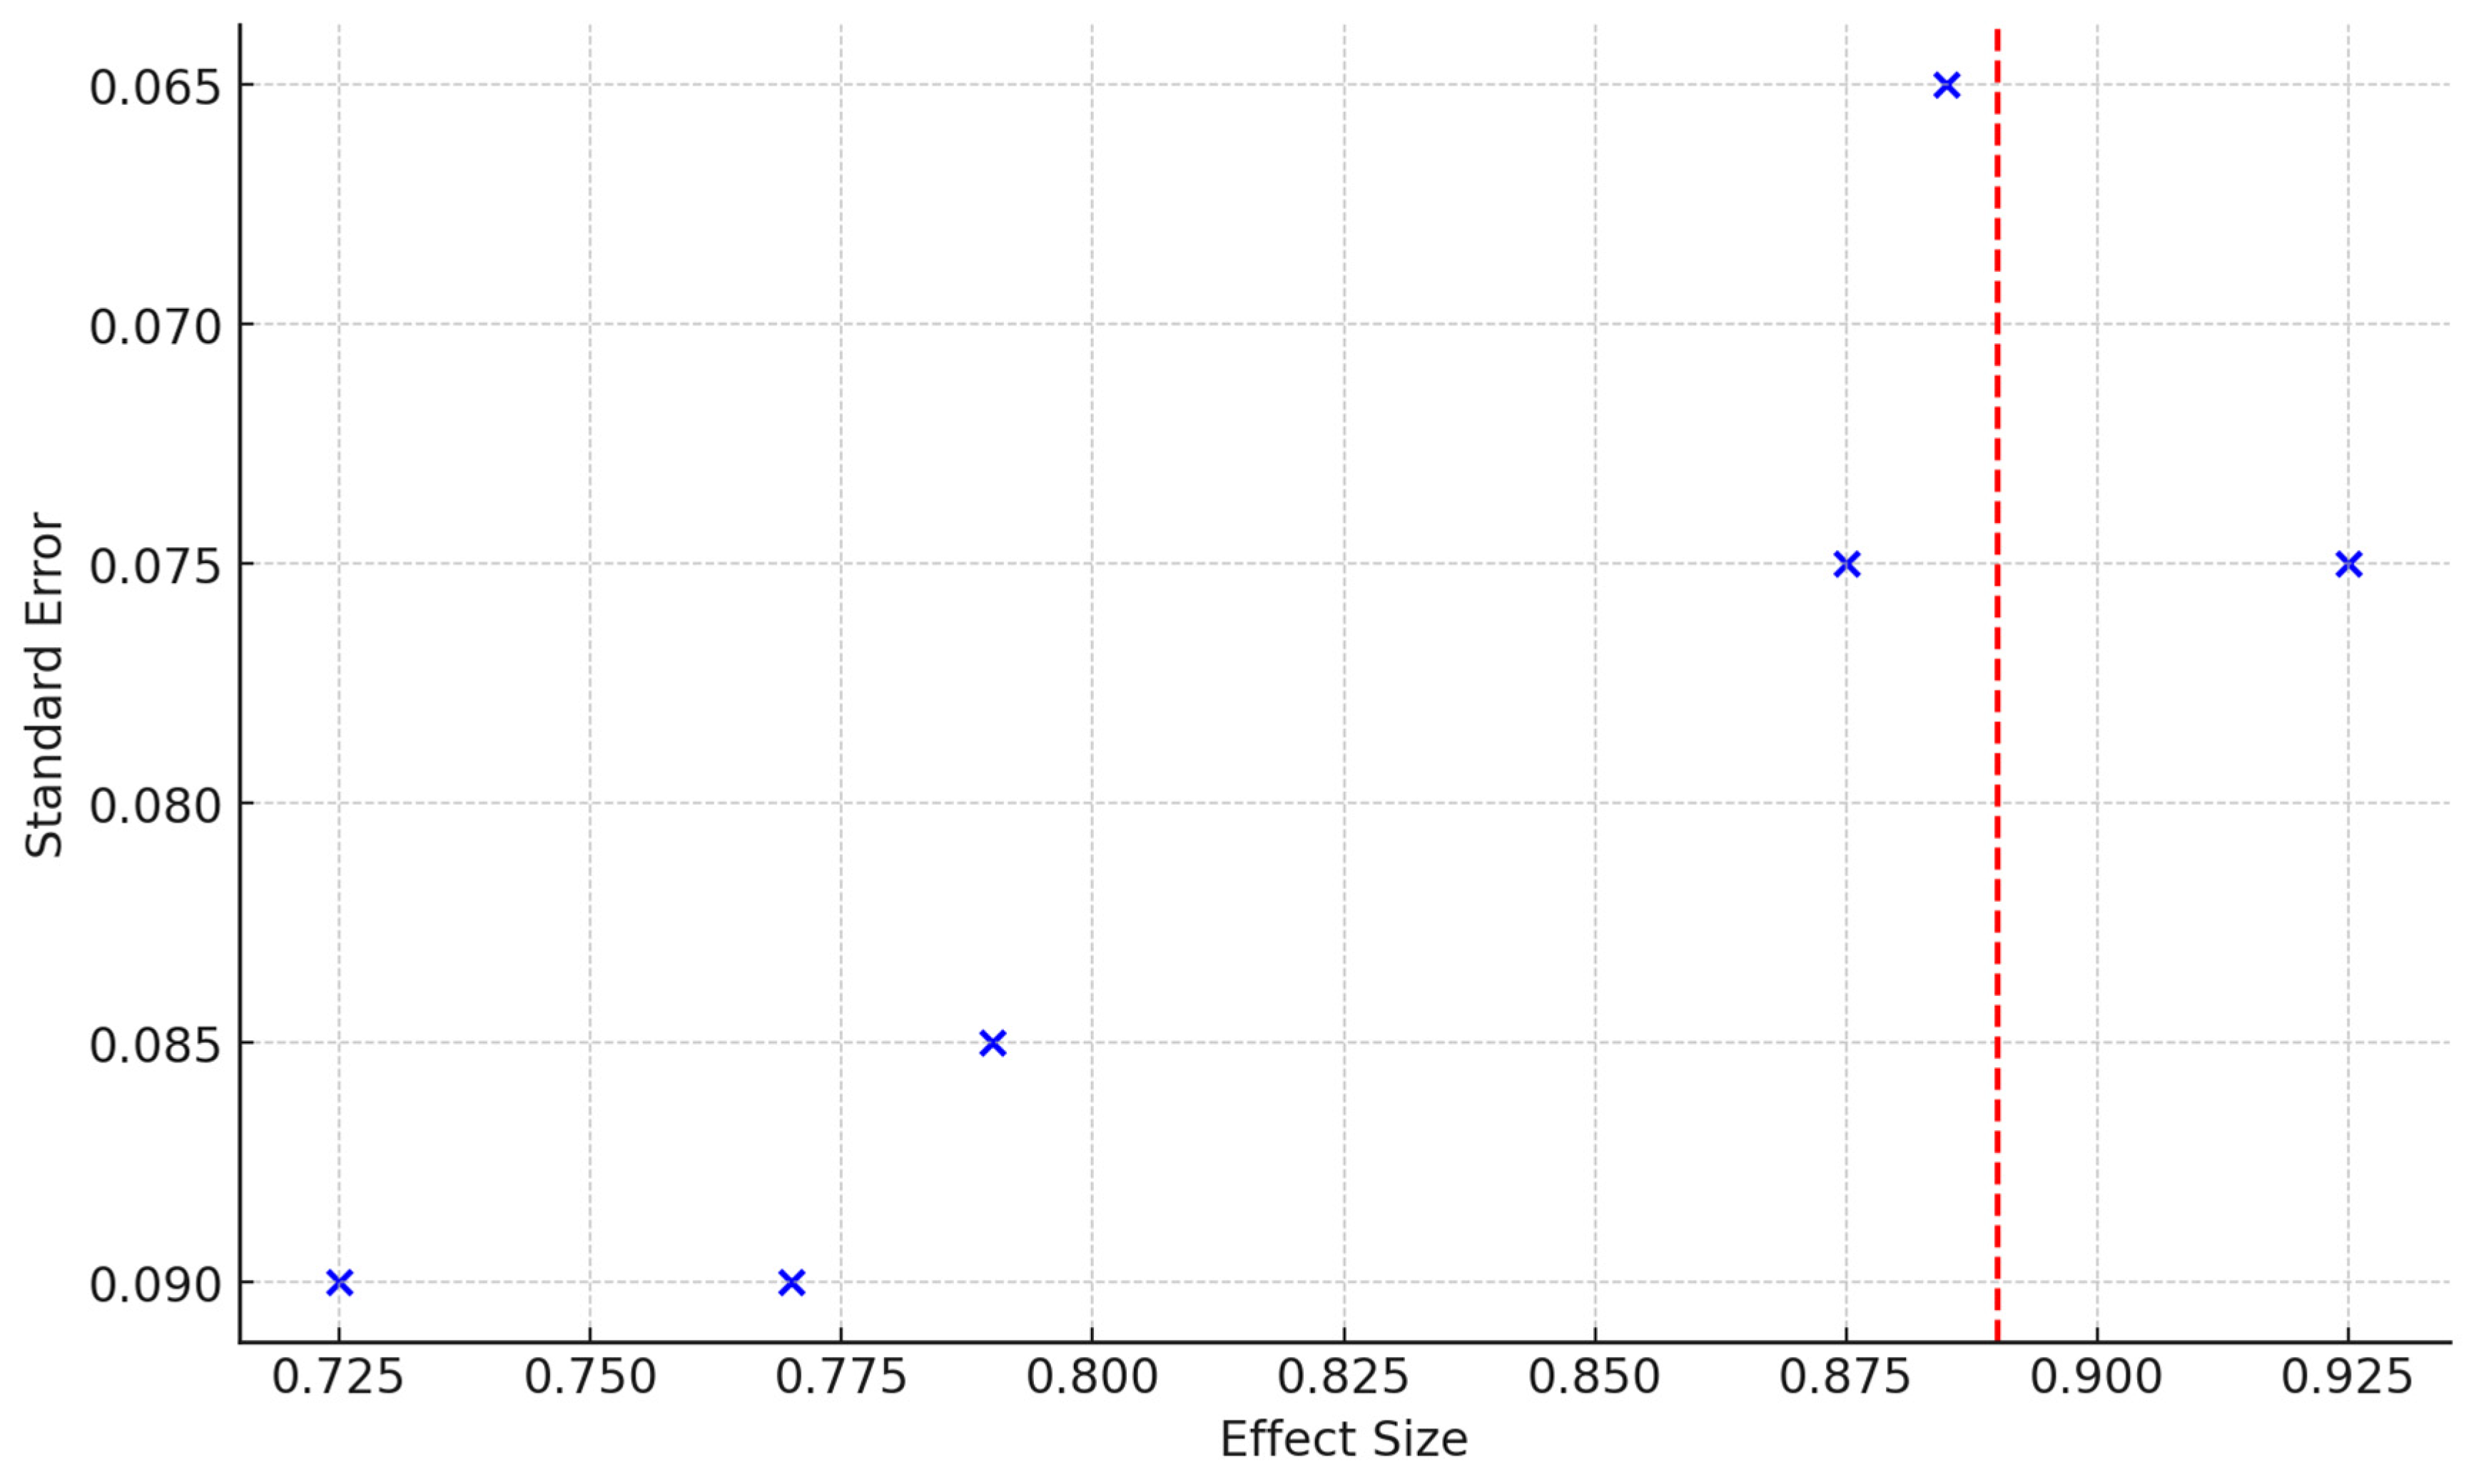
| Pooled Values | 0.88 | 0.82 | 726 | 4.87 (calculated) | 0.15 (calculated) | 0.89 |
Disclaimer/Publisher’s Note: The statements, opinions and data contained in all publications are solely those of the individual author(s) and contributor(s) and not of MDPI and/or the editor(s). MDPI and/or the editor(s) disclaim responsibility for any injury to people or property resulting from any ideas, methods, instructions or products referred to in the content. |
© 2024 by the authors. Licensee MDPI, Basel, Switzerland. This article is an open access article distributed under the terms and conditions of the Creative Commons Attribution (CC BY) license (https://creativecommons.org/licenses/by/4.0/).
Share and Cite
Arcas, V.C.; Fratila, A.M.; Moga, D.F.C.; Roman-Filip, I.; Arcas, A.-M.C.; Roman-Filip, C.; Sava, M. A Literature Review and Meta-Analysis on the Potential Use of miR-150 as a Novel Biomarker in the Detection and Progression of Multiple Sclerosis. J. Pers. Med. 2024, 14, 815. https://doi.org/10.3390/jpm14080815
Arcas VC, Fratila AM, Moga DFC, Roman-Filip I, Arcas A-MC, Roman-Filip C, Sava M. A Literature Review and Meta-Analysis on the Potential Use of miR-150 as a Novel Biomarker in the Detection and Progression of Multiple Sclerosis. Journal of Personalized Medicine. 2024; 14(8):815. https://doi.org/10.3390/jpm14080815
Chicago/Turabian StyleArcas, Vasile Calin, Anca Maria Fratila, Doru Florian Cornel Moga, Iulian Roman-Filip, Ana-Maria Cristina Arcas, Corina Roman-Filip, and Mihai Sava. 2024. "A Literature Review and Meta-Analysis on the Potential Use of miR-150 as a Novel Biomarker in the Detection and Progression of Multiple Sclerosis" Journal of Personalized Medicine 14, no. 8: 815. https://doi.org/10.3390/jpm14080815