Effect of Blowby on the Leakage of the Three-Piece Oil Control Ring and Subsequent Oil Transport in Upper Ring-Pack Regions in Internal Combustion Engines


Department of Mechanical Engineering, Massachusetts Institute of Technology, 77 Massachusetts Ave., Cambridge, MA 02139, USA
*
Author to whom correspondence should be addressed.
Lubricants 2022, 10(10), 250; https://doi.org/10.3390/lubricants10100250
Submission received: 25 August 2022
/
Revised: 4 October 2022
/
Accepted: 6 October 2022
/
Published: 10 October 2022
(This article belongs to the Special Issue Advances in Fuel-Lubricant Interactions)
Abstract
:The lubricating oil consumption (LOC) in internal combustion engines contributes to emission and deteriorates the performance of the aftertreatment. In this work, an optical engine with a 2D Laser-induced fluorescence (2D-LIF) system was used to study operating conditions critical to real driving oil emissions. Additionally, numerical models were used to analyze the ring dynamics, oil flow and gas flow. It was found that the intake pressure that results in zero blowby is the separation line between two drastically different oil flow patterns in the ring pack. With intake pressure lower than the separation line, the oil accumulation of the three-piece oil control ring groove (TPOCR) begins to increase, followed by the drastic increase of the oil accumulation in the third land, second land, and finally visible oil leaking through the top ring gap, given enough time. The time required for the oil to leak through different rings was investigated using both measurements and modeling. The effects of drain holes and rail gaps, as well as their relative rotation on oil accumulation and leakage from the TPOCR groove, were analyzed. These findings contribute to improving ring pack designs and engine calibration in spark ignition (SI), gas, and hydrogen engines equipped with TPOCR to minimize the negative impacts of LOC.
1. Introduction
With the rising demand of environmentally friendly energy generation in the transportation industry, gas emissions from internal combustion engines have been a critical factor for engine development. Lubricating oil consumption (LOC) in the combustion chamber can generate oil emission (OE), including harmful gases such as HC and NOx and particulates, with the potential to damage emission aftertreatment systems. In addition, the worldwide emission regulations, such as EURO VI, are leading a trend to shift from a chassis dynamometer test in a controlled laboratory environment to a real-world driving test, satisfying Real Driving Emissions (RDE) [1]. Moreover, the engine operation in hybrid-electric vehicles (HEVs) contains frequent starting and shutting off conditions, in turn introducing more complex control strategies regarding speed and load change. In constant changing engine speed and load operations, huge spikes of OE were observed occasionally, especially during the transient period when changing from low load to high load [2,3]. Thus, understanding the oil transport characteristics in continuously changing engine working conditions is critical to designing the piston and ring pack in order to reduce real-world driving OE.
Previous studies conducted by Thirouard [4,5] showed by studying the ramp change of engine load through a 2D Laser-induced fluorescence (2D-LIF) engine that, during low engine load condition, more oil is transported to the upper piston regions due to the lack of strong blowby gas flow which can carry oil to the crankcase. This provides a good view that downwards blowby is a critical factor to reduce LOC and is therefore a good design to balance the high load’s blowby, and low load’s LOC should be achieved. Studies focused on drain holes [6,7,8] pointed out that the drain holes’ size, number and location are critical to both LOC and blowby, and also linked higher blowby to lower LOC.
Yilmaz [9] found that when changing from low load to high load, an increase of LOC during the transient will happen. Oil release from the top ring groove was observed and might be a result of gas-induced top ring flutter. Continuing on with the top ring’s sealing ability, Przesmitzki [10,11] investigated the oil transportation behavior with a U-flex oil control ring (OCR) in the 2D-lif engine. He found that when the engine is running under low load for a long enough period of time, the top ring will lose its sealing ability due to the addition of oil inside the top ring groove. This can result in ring collapse and a massive increase of LOC. Therefore, the oil should be prevented from filling the top ring groove by improving both engine design and control strategies. Similar behavior was also observed by Ahling [12] with a different TPOCR design, which also compared the different oil controlling ability between a Twin-Land Oil Control Ring, referred to as TLOCR hereafter, and Three-Piece Oil Control Ring, referred as TPOCR hereafter. Furthermore, Wachtmeister [13] used the similar 2D-LIF technique to investigate oil transport and observed that oil droplets can be transported into the combustion chamber in high speed and low load conditions due to increased inertia force and lowered cylinder pressure.
Overall, previous works drew connections between oil transport upwards and different engine working conditions. However, the mechanisms were not yet fully studied and a clearer understanding of the path for oil to climb up across each ring and piston land is required. Also, the TPOCR design has not yet been thoroughly investigated.
This work aimed to study the threshold of operating conditions and the time needed for the oil to leak upward from the oil control ring to the top ring. The ring pack is representative of a typical modern spark ignition (SI) engine with a TPOCR and Napier second ring, along with a top ring with a positive twist. By using a step transit structure which changes one parameter at a time, the effects of engine load, speed and time duration of the steady states between each transient operation were analyzed. First, the experiments with designed transient driving cycles were conducted to observe the visualized oil upwards transport. Then, computer vision was applied to quantify the oil accumulation level in TPOCR. Finally, a pumping model [14] was used to evaluate the threshold of operating conditions for the upward oil flow through the ring groove clearances to appear. Compared to previous study focused on the TPOCR design [15] at a higher engine speed for 5000 RPM. This work was focused on a more common city driving engine speed range between 1200 to 3000 RPM and serves as a good addition.
2. Experimental Setup
2.1. Engine Setup
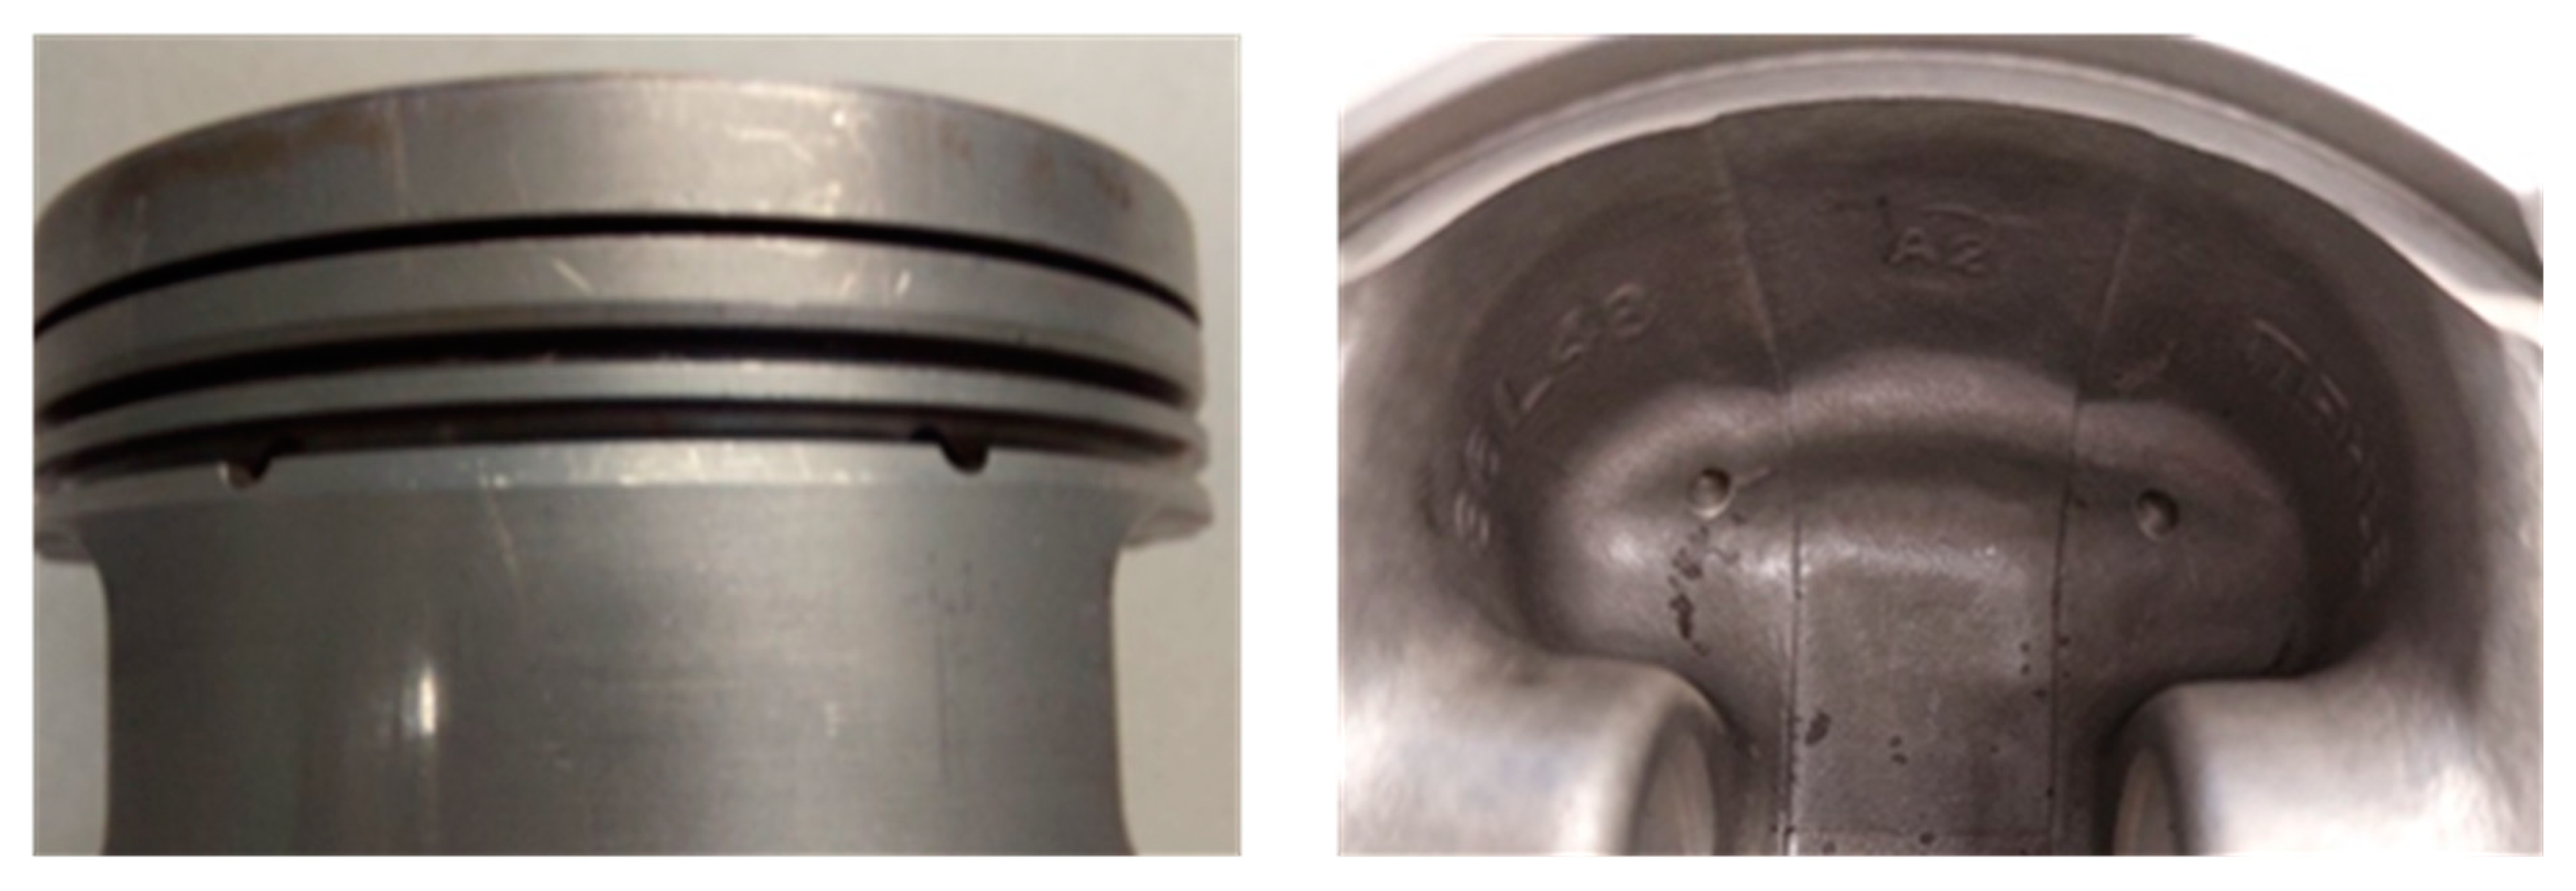
The test engine (Table 1) is the same engine used in previous work [4,5,9,10,11,12,16,17,18], which is a single cylinder research engine with a custom-made optical liner (Figure 1), allowing for a high-speed camera to record the lubrication oil movement as the piston moves. A cylinder head based on a PSA in line with a four-cylinder production engine with the three unused cylinders deactivated was used. The piston is a prototype piston with a dark graphite coating removed to reflect the laser light for stronger fluorescence signals. The test engine was equipped with a modern TPOCR design with the ends of the expander parallel to each other and making contact. The second ring has a Napier hook chamfer design on the outer surface to store oil (Figure 1). The top ring has a barrel shape with a positive twist. Additionally, in order to have a better view of the last path of oil before reaching the combustion chamber, the top ring was pinned with the top ring gap in the optical window’s area.
The engine control system is based on a field-programmable gate array (FPGA) system including National Instrument hardware and software. Fuel injection and ignition are all controlled by the FPGA system and data collection is performed by a Windows computer and cDAQ system. The trigger of high-speed camera is through the FPGA, which allows the critical operation times to be synchronized. A detailed description of the engine test bench and control setup can be found in [19].
2.2. Optical Setup
The custom-made optical liner consists of a transparent sapphire window of 12 mm width and 98.5 mm length along the piston moving direction on the thrust side. This allows a high-speed camera (Table 2) to capture the oil movement in the cylinder. The camera has two defined views:
- full view as using 128 × 1024 resolution recording the whole optical window;
- magnified view with 1024 × 1024 resolution focused on a 12 × 12 mm square area at a set position.
Furthermore, both high speed camera control and slow speed camera control were applied to serve different purposes. High speed mode can record as fast as 12,500 FPS with a 1/16,000 s shutter speed, around 1 frame per crank angle at 2000 RPM to get all the path as piston and ring moves in several full engine cycles. A slow speed camera can capture one frame per cycle at a set crank angle (CA) position to capture the oil accumulation evolution over longer time scales. The oil was mixed with a specific dye which can be induced to fluorescence by laser. The detailed theory and setup of the laser induced fluorescence system was described by Zanghi [16,17] previously.

Table 2.
Specifications of the SA-X2 high speed camera used.
| Camera Characters | |
|---|---|
| Sensor type | Proprietary Design Advanced CMOS |
| Maximum resolution | 1024 × 1024 pixels |
| Sensor size/ Diagonal | 20.48 × 20.48 mm/28.96 mm |
| Pixel size(microns) | 20 µm × 20 µm |
| Quantum efficiency | 46% at 630 nm |
| Fill factor | 58% |
| Color Matrix | Bayer CFA (single sensor) |
| ISO 12232 Ssat Sensitivity | ISO 25000 monochrome |
| Shutter | 1 ms to 1µs, independent of frame rate |
2.3. Test Procedure
The operation engine speeds were chosen at 1200, 2000, 3000 RPM. And engine load was changed by setting different absolute intake pressure (Figure 2) ranging from 120 mbar (closed throttle) to 1 bar (wide open throttle, referred to as WOT hereafter). The lowest intake pressures achieved were 140, 120, 110 mbar at 1200, 2000, and 3000 RPM, respectively. The oil temperature was controlled at 50 ± 1 °C and coolant temperature was set at 80 ± 1 °C.
The main mechanism we examined was the effect of the gas flow rate. As the motored condition provides more consistent control in cylinder pressure and temperature, the transient experiments were conducted between motored conditions. Between each set of tests, a fired condition at 700 mbar for 5 min was conducted to create a condition with max blowby for the engine to clean the ring pack area. The load was modified using step transit change, which can complete the change in 0.05 s using the FPGA control system. The camera can be triggered either at the same time that the load change occurs to record the change of oil accumulation during and after the transient or 1 s before transit happened to compare the difference between before and after the transient.
3. Results and Discussion
3.1. Drastic Change in Oil Upward Flow When Blowby Reaches Zero
3.1.1. Time for Oil to Climb Up
When the engine is operated at throttled conditions, especially during engine-brake, a relatively low absolute pressure in cylinder before compression starts can be generated. The reduced cylinder pressure can induce substantial reverse blowby flow. When the intake pressure is low enough, the blowby reaches zero. Further reducing the intake manifold pressure results in a decrease of the crankcase pressure to maintain a zero blowby.
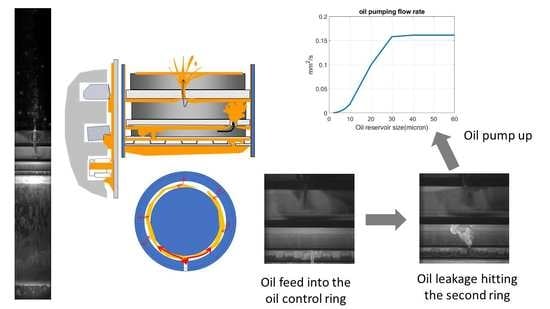
As the engine changes from high load to low load, the force to help oil climb up along the piston may become stronger due to the decrease of downward blowby gas flow and increase of upward. The most extreme case is the transient from WOT to closed throttle condition at the lowest intake pressure available. Figure 3 shows an example of oil gradually climbing up the third land, second land and finally crown land as time goes by after transient happened. The recording takes one sample at 90 degrees after top dead center (ATDC) of the intake stroke for a total of 1500 engine cycles with the limitation of the camera’s memory. This is 90 s in the Figure 4 120 mbar intake pressure 2000 RPM case.
Even though the window only accounts 12 mm width of a full bore, with inertia force flattening oil distribution away from the gap, the observed phenomena can be extended to represent the oil accumulation throughout the bore. Because of ring rotation, the gap locations changed during the recording and consequently changed the oil distribution locally. However, the oil distribution in the window area can reach a steady level in all the piston lands when gaps are far away from the optical window. When a steady oil accumulation at each piston land was achieved and would remain for the rest of the test, it was defined as having reached equilibrium.
Shown in Figure 4, there is a hook chamfer at the bottom of the second ring and a chamfer at upper edge of third land. The oil being scraped down can accumulate in both chamfers. At 560 cycles both of the chamfers were almost full (shown in green dashed area). Subsequently, at cycle 596 after closing throttle, a large amount of oil droplets flow through the top ring gap. These droplets continued all the way for 1500 cycles, indicating that equilibrium may be reached in each region after droplets appeared.
A sidenote is that the LOC of the closed throttled conditions was so high that it can be roughly estimated in the following manner. In the experiment, all the lubrication oil was stored in an external tank and circulated in a closed system by two pumps for feeding and extracting from the engine. With this massive oil transport upwards, the LOC rate was estimated at 100 g/hour by measuring the oil level’s change inside the oil tank before and after the experiment, which is far from usually acceptable LOC of several grams per hour [20] and should be prevented.
Each experiment was performed three times to verify the repeatability as shown in Figure 5. The scatters are separate points at each condition and the plot shows an average time for them. At each engine speed, as the engine load increased to a point, the oil would never reach the crown land. In general, a higher engine load can result in a longer time for oil to reach equilibrium at all three regions. However, the speed dependency is not clear.
3.1.2. Blowby Separation Line
The amount of oil droplets transported through the top ring gap during low load (under 150 mbar) period had no significant difference at 2000 RPM. However, a longer time for oil to reach the top ring gap as well as the second land and the third land was observed with higher intake pressure. A sudden change in overall trend only happened when reaching 150 mbar, as no oil droplets through the top ring gap were observed (Figure 6). To verify this, the engine stayed at 150 mbar for over 10 min and still no oil droplets were observed. The same verifications were also done for all the intake pressures over 150 mbar.
The intake pressure of 150 mbar was the blowby separation line at 2000 RPM. When the intake pressure was higher than 150 mbar, the measured blowby is a positive number, indicating that the overall gas flow direction is from the combustion chamber to the crankcase. With the limitation of measurement system, the negative blowby number cannot be measured. However, the measured crankcase pressure showed a drop when running under this separation line. Under the condition of the crankcase pressure being atmospheric, the blowby should be negative and the overall gas flow reversed its direction (Figure 7). In general, the blowby separation line is an intake pressure above which the overall blowby starts to become positive.
In addition, the 2D ring dynamics and gas flow model developed by Tian [21] were used for calculation. This model uses the cylinder pressure obtained from experiments as the pressure input. Engine geometry such as piston design, ring profile and thermal deformation were considered. Ring dynamics and gas flow in each piston land and ring groove can be calculated in each crank angle. The simulation results (Figure 8) show that the blowby becomes negative as engine load drops below 150 mbar if the crankcase pressure is assumed to be atmospheric. Additionally, the crankcase pressure needed to maintain zero blowby drops below 1 bar as well. Both of them verified an absolute intake pressure of 150 mbar as a blowby separation line, and above which the engine can achieve positive blowby and vice versa.
At a different engine speed from 2000 RPM, the blowby can change at the same intake pressure as shown in Figure 9, calculated from the 2D model [21]. From the experimental side, the measurement device has the lowest detectable limit of 10 mbar. It did not see a difference of blowby separation line at the chosen engine speeds of 1200, 2000 and 3000 RPM. This indicates the shift of blowby separation line around 150 mbar is within 10 mbar’s range. The same drastic change across the blowby separation line was also observed at 1200 and 3000 RPM.
Thus, the blowby separation line is the controlling factor of whether or not oil droplets will appear through top ring gap. Running under this separation for a long enough time can result in huge LOC and should be eliminated in engine working condition. The source of oil going up at low load will be examined in 3.2.
3.2. Oil Accumulation in TPOCR
The oil control ring is the first barrier to control the vast amount of oil below it. Thus, it is critical to understand how oil leaks through the OCR, and, particularly, how the oil flows into and out of the OCR groove.
In order to get the best view of oil accumulation inside the OCR groove, the magnification view was applied with a 1024 × 1024 resolution focused on a 12 × 12 mm optical window area. The camera position was chosen at 76CA of the intake stroke. At this moment the inertia force is changing direction from upwards to downwards with reference to the piston. Therefore, the oil accumulation reflects the maximum effect of the upward inertia force in a cycle, dwelling on the upper part of the groove. Since the camera is only able to see a shallow depth behind the optical window (Figure 10a), with the oil level flat, the optical view is able to represent the whole volume inside the OCR groove and provide the ability for quantified measurement. Recording started at the same time when transient happened. Slow speed camera control was applied to capture one frame per engine cycle.
Computer vision in Python was applied to the recorded video to quantify the oil accumulation inside the OCR groove. A program to trace the upper and lower rail of the OCR was used to identify and separate the region inside the OCR. Figure 10b shows the result of tracing OCR rails during the recording, as the OCR moves up and down. When the oil is leveled on all the pitches, the pitches with an expander had less oil, as shown in Figure 11. With a measure of oil level harder to identify, it is easier to implement the total brightness measurement and it qualitatively correlates with the amount of oil.
Figure 12a shows the brightness distribution below the OCR upper rail. It is clear the peaks and valleys match the position of pitches in the expander. Overall, the center of picture has the highest brightness because the laser pointing on the window is a Gaussian distribution [19], which has the highest intensity in the center. Furthermore, the highest brightness among all the pixels inside the OCR is always around 2200 regardless of load, referring to the oil at the center inside the OCR groove under upper rail. This number represents the saturated signal at the center of the laser with this optical setup and temperature. Thus, averaging the brightness in both circumferential and axial direction can represent the oil level’s height inside the OCR groove.
3.2.1. Dynamic Equilibrium Level
Figure 12b is the oil accumulation’s change after the transient happened from WOT to 120 mbar at 2000 RPM. The y axis’s unit is the absolute brightness averaged inside the OCR groove with a greater value representing more oil accumulation. At the first 20 cycles, the oil accumulation grows fast. Then, the oil amount inside the groove reaches a steady pattern with regular small fluctuations interrupted by large spikes, called dynamic equilibrium here. The small fluctuation represents the change in the pitch distribution in the window. The large spikes are the result of the lower rail gap being around the window as the lower rail gap provides an oil supply path into the groove.
It is clear both from the video (Figure 13) and computer vision plot (Figure 14) that at the same 2000 RPM, and with the increase of intake pressure, less oil will be accumulated inside the OCR groove when reaching equilibrium. When the intake pressure was at the lowest value of 120 mbar, almost half of the OCR groove could be filled with oil after reaching equilibrium. As the intake pressure increases to medium level at 500 mbar, only a thin layer of oil can be seen below the upper rail region. The reference is WOT motored working condition before changing to low load and the OCR groove is almost clean.
3.2.2. Oil Supply to the OCR Groove
Drain Holes
There are four drain holes inside the OCR groove, two on each side of the piston (Figure 15). They are designed to allow downwards blowby gas to go through and carry the oil inside the OCR groove back to the crankcase. However, the drain holes can also serve as oil supply holes. During an engine cycle when the cylinder pressure is low, due to the lack of blowby gas, oil at the bottom of piston can be transported into the OCR groove through the drain holes. This amount of oil can come from the piston cooling jet or splashed from the crankshaft. Additionally, during down strokes, the scraped oil can directly flow to the groove through the drain holes. Therefore, the drainage should be concluded to be a net draining effect, namely the oil flowing out through the drain holes minus the oil flowing inside. If there is more oil transported through the drain holes into the groove, even at the same blowby condition, there will be more accumulated oil.
Under the blowby separation line, even though the drain holes can still drain oil due to inertia, as an average effect, the blowby cannot release oil. The oil supply comes from inertia force and reverse flow. As the load increases, this oil level reduction indicates a reduced reverse flow. When intake pressure increases over the blowby separation line, a similar trend is observed as the increased positive blowby gas carries oil back to the crankcase through the drain holes.
Lower Rail Gaps
As discussed earlier, the large spikes in Figure 14 appear when the lower rail gap is in the window area. Figure 16 shows the contrast between the oil accumulation inside the OCR groove with and without presence of the lower rail gap at different intake manifold pressures. Additionally, one can see the decrease of the oil accumulation with the increase of intake pressure regardless of the presence of the lower rail gap.
The oil can enter the OCR groove through both the liner and piston shown in Figure 17. The first oil flow path is present during the entire down stroke when the oil on the liner is scraped and spread into the groove [22]. Thus, residing on the liner below the oil control ring is a determining parameter of the rate of oil supply from this path. The second path is present when the piston travels in the upper part of the liner and the inertia force due to piston acceleration pointing upwards. The amount of oil stored in the chamfer area between the oil control ring and skirt lubrication is critical to the second, and the oil accumulated in the skirt chamfer can be driven up by inertia force.
Although it is possible that skirt allows less oil to pass with higher intake pressure and there is less oil in the piston skirt chamfer area so that the inflow rate of to the OCR groove is lower with higher intake pressure, they are not directly observed. To understand these two observed trends in Figure 14, it is required that we examine the oil inflow, out flow, and the redistribution in the window area that is between two drain holes. Further quantitative analysis is left for further publications. In Section 3.3, a brief qualitative analysis will be presented.
3.2.3. Upper Rail Leaking
There are three main oil leaking sources from the TPOCR groove, namely direct leakage from the upper rail gap, oil leaked from the upper flank and up-scraping by the upper rail OD face. This work is focused on the upper rail gap leakage as the other two sources are not easy to identify.
Figure 18 shows the oil leakage jet from the upper rail gap. One can see that with less intake manifold pressure, more oil is present inside the groove and a larger amount of oil in the oil jet on the piston third land comes out of the upper rail gap. With intake manifold pressure below 150 mbar, which is the blowby separation line, an oil jet can reach the top of the third land or inside the hook of the second ring with possible further lateral spreading. Above 150 mbar, when the blowby becomes positive, the oil jet only reaches halfway to the third land and will be most likely returned to the OCR groove when the inertia force shifts downwards. Therefore, it can be concluded that a net oil leakage through the upper rail gap does not exist when the blowby is positive for this engine.
The oil flow through the upper rail gap is determined by the oil accumulation inside the groove and the driving forces that include the pressure difference and the inertia force from piston acceleration. It is thus not surprising that lower intake manifold pressure results in more oil flow through the upper rail gap. Figure 19 shows that lower intake pressure can lead to lower gas pressure in the third land as well. What is more interesting is that the presence of the upper rail gap may help suck the oil from the drain holes when the gas flow is from the drain holes, to the upper rail gap in the intake and early part of the compression stroke.
3.2.4. Importance of Rail Gap Location
While TPOCR rotates together at all speeds and loads, it is observed that a relative rotation exist between the upper rail and lower rail at a speed less than the overall rotations (Figure 20). When the gaps are close enough, at the same engine working condition, the oil leakage jet is stronger when compared to the situation of the gaps being far away from each other. The obvious reason is that the oil below the TPOCR can find its way passing the upper rail gap. As such, one of the main advantages of the TPOCR, namely, mis-aligning the rail gaps to avoid a direct oil flow from below to above the OCR, is temporarily muted. On the other hand, thanks to the parallel contact at the expander gap, the rail gaps are never trapped together with the expander gap forming permanently aligned gap. Yet, the upward oil flow is enhanced during the period the two rail gaps are close especially during low load conditions, contributing to unsteadiness of the LOC.
Now, combining the findings from Section 3.2.2 and Section 3.2.3, the main contributor to the increase of the oil accumulation inside the TPOCR in the window area when the intake manifold pressure is decrease may be explained as follows:
- When the upper rail gap is rotated to the window area, it helps suck more oil into areas of the TPOCR groove between the two drain holes when the intake manifold pressure is below blowby separation line. On the contrary, the upper rail gap can help release more oil through the drain holes when the blowby is positive;
- the ring rotation is fast enough such that the effect of the upper rail gap remains before it comes back again.
3.2.5. Effect of Engine Speed
A higher engine speed introduces a higher inertia force. This can result in faster oil spreading along both axial and circumferential directions, and thus greater rates for oil release and leakage from each region. Therefore, less oil accumulation in each region can be observed with higher engine speed [23]. The same effect was also observed in this study, as shown in Figure 21. At the same engine load of 150 mbar, a higher engine speed can result in less oil accumulated inside OCR groove when reaching equilibrium.
Overall, as we are mostly concerned about oil leakage, a stronger leakage jet can be observed with the reduction of engine speed because of more oil accumulated inside OCR. Thus, a transient from low-speed low-load to high-speed and high-load presents a transient condition from a highest oil accumulation to lowest. Engine operated through this condition may induce large LOC if the release is not managed well. The verification of these implications will be conducted in future studies.
3.3. After Passing OCR: Pumping Effect
In general, the low load and low speed condition can result in a higher oil accumulation in the OCR groove and more oil leakage to the upper region. After passing the OCR, the oil can be pumped upwards by the top two rings due to the change of ring lift and pressure. In order to quantify the oil pumping flow rate and its direction, the pumping model developed by Liu [14] was applied. This pumping model uses the pressure at piston lands, pressure inside ring grooves and ring lift to calculate the pumping flow rate in each crank angle. The pumping interface was decided according to piston and ring geometry. Shear stress between air and oil was neglected. The needed input such as ring lift characters and pressure inside ring grooves and piston lands all come from the 2D ring dynamics and gas flow model developed by Tian [21].
3.3.1. Hook Chamfer Design Result in Fully Flooded Pumping
As shown in Figure 22, the combination of the hook and chamfer of the Napier second ring is able to prevent oil from blocking the entrance of the lower flank clearance when the oil cannot fill the entire region. However, if the oil fills the entire region, it becomes available to be pumped into the second ring groove through the second ring dynamics and surrounding-pressure variation. As discussed earlier, the filling of the hook and chamfer become visible when the intake manifold pressure is below the blowby separation line.
When using the pumping model, the oil reservoir’s size at the inner edge (ID) and outer edge (OD) of the ring-groove interface need to be manually set (Figure 23). Figure 24 shows the sensitivity of the dependency of the oil flow rate across the lower flank of the second ring and groove clearance on the assumed oil puddle size. It can be seen that when the oil puddle size approaches the ring/groove clearance, the flow rate reaches an asymptotic value. This asymptotic value may represent the maximum flow rate across the ring/groove clearance and is used in this paper to evaluate the oil flow direction and flow rate across the ring/groove clearance. Below the blowby separation line, the estimation to be made can be considered to be close to reality. For all the other conditions and interfaces, the estimations should be considered as the maximal potential.
3.3.2. Pumping Rate of the Second Ring
Based on fully flooded boundary conditions, regardless of engine speed and load, the pumping direction for the second ring lower flank is always in the groove. The general trend for pumping flow rate is to increase with the reduction of engine load. A higher engine speed can result in higher pumping rate by running more cycles at the same time. Calculated with the size of the second ring groove, the pumping rate can be converted to times for pumped oil to fully fill the groove, as Figure 25 shows.
After oil enters the second ring groove and approaches the upper flank, the pumping effect will also happen there. The flow direction at the upper flank is pointing out from the groove, which means oil can pass the second ring to the upper regions. In addition, oil leakage from the second ring was observed as well, providing another oil path to climb up. Figure 26 shows the pumping rate at 2000 RPM at both flanks, as a positive number of means pumping into the groove. The pumping rate also increases with the reduction of engine load.
3.3.3. Pumping Rate of the Top Ring
The top ring is designed mainly to seal the gas with a barrel shape. There is no chamfer on the outside and easily get fully flooded. The source for the top ring to pump comes from the leakage from the second ring, mainly pumping and gap leakage. Since at high load there is not enough oil leakage from the OCR, the hook chamfer on the second ring can prevent pumping up oil, the top ring’s calculation was only conducted at low load condition. In addition, the leakage from the second ring gap can also be reduced, resulting in less oil in the third land at a high load.
The overall character for the top ring’s pumping effect (Figure 27) is similar to that of the second ring. The higher load can reduce the pumping effect and a higher RPM can result in a higher flow rate. When looking back to the full view’s transient data, running under blowby separation for typically 30–50 s can cause oil droplets to be seen through the top ring gap. This matches the time for oil pumping to pass the top two rings. Notice that the oil droplets observed through the top ring gap do not necessarily mean the ring grooves are full. The direct path from gaps and gas flow in non-contacting regions [24] can also contribute to upward oil transport past the top two rings.
3.4. Summary
For the ring pack design studied here, it can be concluded that the condition with zero blowby separates two drastically different oil transport patterns across the piston ring pack. When the intake manifold pressure is below the one resulting zero blowby (blowby separation line), the oil can first leak through the upper rail gap of the TPOCR before flooding the hook/chamfer region of the Napier second ring, and then finally flood the top ring gap area and pass the top ring going upwards. Drain holes and lower rail gap can both be the supply and release routes for the oil accumulation inside the TPOCR groove. In addition to their gaps, the second ring and top ring can pump the oil through the ring/groove clearance when the clearance boundaries become full, which can be reached when running below blowby separation line. Of course, one obvious remedy in practice is to always run the engine with a positive blowby. However, this is not often the case. How we design drain holes to minimize the oil accumulation inside the OCR groove both for high and no-load conditions then becomes critical. To do that, an adequate understanding of the oil transport inside the OCR groove needs to be established.
4. Conclusions
The following conclusions can be drawn from this work:
- When the engine is running under the blowby separation line for a long enough time, such as with engine brakes in driving, overall reverse flow will gradually drive oil upwards and even oil droplets can be seen through the top ring gap. This will result in massive LOC and should be eliminated in engine operation;
- The oil inside the OCR groove can leak out from the upper rail gap. Low engine load and low engine speed can both introduce a higher oil accumulation level, which can result in more oil leakage. The alignment of both OCR rail gaps can result in more leakage than the situation when the gaps are far away from each other;
- The drain holes inside the OCR groove can act as oil supply holes. When running at zero blowby without a draining effect, the oil leakage jet from the upper rail gap can hit the second ring. This acts as the starting point of massive oil upwards pumping by filling the hook chamfer;
- The top two rings can pump the oil upwards through ring groove clearances at all the load conditions tested, provided there is sufficient oil supply to the boundaries of the ring/groove clearance. Therefore, the limiting factor for the ring/groove clearance to become an oil leaking path is the oil supply;
- It needs to be emphasized that different engines reach zero blowby at different levels of intake manifold pressure. Zero blowby rather than the magnitude of intake pressure as the threshold for drastic change of oil control bears more general implications. Furthermore, the findings in this work are applicable to not only different SI engines but also gas and hydrogen engines equipped with TPOCR.
Author Contributions
Design and preparation of the experiment, M.L.; Experimental investigation and modeling calculation, M.L.; writing the manuscript, M.L.; Supervising and revising the manuscript, T.T. All authors have read and agreed to the published version of the manuscript.
Funding
This work was sponsored by Mercedes-Benz and the Consortium on Lubrication in Internal Combustion Engines in the Sloan Automotive Laboratory, Massachusetts Institute of Technology. The consortium members were Mahle, Shell, Rolls-Royce Solutions, Toyota, Volkswagen Group, Volvo Trucks and Weichai Power.
Institutional Review Board Statement
Not applicable.
Informed Consent Statement
Not applicable.
Data Availability Statement
Not applicable.
Acknowledgments
This work was sponsored by Mercedes-Benz and the Consortium on Lubrication in Internal Combustion Engines in the Sloan Automotive Laboratory, Massachusetts Institute of Technology. The consortium members were Mahle, Shell, Rolls-Royce Solutions, Toyota, Volkswagen Group, Volvo Trucks and Weichai Power. The authors greatly thank all of the members for the cooperation.
Conflicts of Interest
The authors declare no conflict of interest. The funders had no role in the design of the study; in the collection, analyses, or interpretation of data; in the writing of the manuscript; or in the decision to publish the results.
References
- A Technical Summary of Euro 6/VI Vehicle Emission Standards. Available online: https://theicct.org/publication/a-technical-summary-of-euro-6-vi-vehicle-emission-standards/ (accessed on 1 July 2016).
- Uhlig, B.; Kirner, C.; Preuss, A.; Wachtmeister, G. Real-Time Measurement of the Piston Ring Gap Positions and Their Effect on Exhaust Engine Oil Emission; SAE International: Warrendale, PA, USA, 2018. [Google Scholar] [CrossRef]
- Adelmann, J.; Becker, S.; Rabute, R.; Bruno, R. Optimized oil control ring design for emission reduction. In Zylinderlaufbahn, Kolben, Pleuel; VDI Berichte: Baden-Baden, Germany, 2018; pp. 91–103. [Google Scholar]
- Thirouard, B.; Tian, T. Oil Transport in the Piston Ring Pack (Part I): Identification and Characterization of the Main Oil Transport Routes and Mechanisms; SAE International: Warrendale, PA, USA, 2003. [Google Scholar] [CrossRef]
- Thirouard, B.; Tian, T. Oil Transport in the Piston Ring Pack (Part II): Zone Analysis and Macro Oil Transport Model; SAE International: Warrendale, PA, USA, 2003. [Google Scholar] [CrossRef]
- Papadopoulos, I.; Becker, S.; Ehnis, H.; Kunzel, R.; Frommer, A. Influence of Oil Drain Holes on Oil Emission of a Turbocharged Gasoline Engine. SAE Int. J. Engines 2017, 10, 1948–1953. [Google Scholar] [CrossRef]
- Hasegawa, H.; Kikuhara, K.; Nishijima, S.; Suzuki, H.; Ito, A.; Sekiya, H.; Akamatsu, H. The Effect of the Position and Number of Oil Drain Hole on the Oil Pressure Generating under the Oil Ring with Relation to Oil Consumption. Trans. Soc. Automot. Eng. Jpn. 2017, 48, 59–64. [Google Scholar]
- Kikuhara, K.; Sekiya, H.; Ito, A.; Hayashi, H. A Numerical Analysis on the Effect of Several Factors on the Oil Pressure under Oil Control Ring Which Relates to Oil Consumption. Trans. Soc. Automot. Eng. Jpn. 2018, 49, 282–289. [Google Scholar]
- Yilmaz, E.; Thirouard, B.; Tian, T.; Wong, V.; Heywood, J.B.; Lee, N. Analysis of Oil Consumption Behavior during Ramp Transients in a Production Spark Ignition Engine; SAE International: Warrendale, PA, USA, 2001. [Google Scholar] [CrossRef]
- Przesmitzki, S.; Tian, T. Oil Transport Inside the Power Cylinder During Transient Load Changes; SAE International: Warrendale, PA, USA, 2007. [Google Scholar] [CrossRef]
- Przesmitzki, S.; Tian, T. An Experimental Study of the Time Scales and Controlling Factors Affecting Drastic Blow-by Increases during Transient Load Changes in SI Engines; SAE International: Warrendale, PA, USA, 2008. [Google Scholar] [CrossRef]
- Ahling, S.; Tian, T. Oil Transport Phenomena during Extreme Load Transients Inside the Power Cylinder Unit as Investigated by HS-2DLIF (High-Speed 2D Laser-Induced Fluorescence); SAE International: Warrendale, PA, USA, 2019. [Google Scholar] [CrossRef]
- Schäffer, J.; Kirner, C.; Härtl, M.; Wachtmeister, G. Development of a Measuring System for the Visualization of the Oil Film between the Piston and Cylinder Liner of a Gasoline Engine. SAE Int. J. Engines 2020, 13, 175–190. [Google Scholar] [CrossRef]
- Zhang, W. Modeling Internal Combustion Engine Three-Piece Oil Control Ring Coupling Reduced Order Oil Transport Based on Neural Network. Master’s Thesis, Massachusetts Institute of Technology, Cambridge, MA, USA, 2020. [Google Scholar]
- Mochizuki, K.; Sasaki, R.; Yazawa, M.; Iijima, N.; Usui, M. Prediction and Experimental Verification for Oil Transport Volume around Three-Piece Type Oil Control Ring Affecting Lubricating Oil Consumption; SAE International: Warrendale, PA, USA, 2022. [Google Scholar] [CrossRef]
- Zanghi, E. Analysis of Oil Flow Mechanisms in Internal Combustion Engines via High Speed Laser Induced Fluorescence (LIF) Spectroscopy. Master’s Thesis, Massachusetts Institute of Technology, Cambridge, MA, USA, 2014. [Google Scholar]
- Zanghi, E.; Tian, T. Development of a High Speed Laser Induced Fluorescence (HSLIF) System in a Single Cylinder Engine for Oil Transport Studies; SAE International: Warrendale, PA, USA, 2016. [Google Scholar] [CrossRef]
- Vokac, A.; Tian, T. An Experimental Study of Oil Transport on the Piston Third Land and the Effects of Piston and Ring Designs; SAE International: Warrendale, PA, USA, 2004. [Google Scholar] [CrossRef]
- Ahling, S. Elements of Lubricant Transport Critical to Piston Skirt Lubrication and to Leakage into the Piston Ring Pack in Internal Combustion Engines. Ph.D. Thesis, Massachusetts Institute of Technology, Cambridge, MA, USA, 2021. [Google Scholar]
- Froelund, K.; Menezes, L.; Johnson, H.; Rein, W. Real-Time Transient and Steady-State Measurement of Oil Consumption for Several Production SI-Engines; SAE International: Warrendale, PA, USA, 2001. [Google Scholar] [CrossRef]
- Tian, T. Modeling the Performance of the Piston Ring-Pack in Internal Combustion Engines. Ph.D. Thesis, Massachusetts Institute of Technology, Cambridge, MA, USA, 1997. [Google Scholar]
- Fang, T.; Meng, Z.; Ahling, S.; Tian, T. A Computational Study of the Lubricant Transport into Oil Control Ring Groove; SAE International: Warrendale, PA, USA, 2019. [Google Scholar] [CrossRef]
- Przesmitzki, S. Characterization of Oil Transport in the Power Cylinder of Internal Combustion Engines during Steady State and Transient Operation. Ph.D. Thesis, Massachusetts Institute of Technology, Cambridge, MA, USA, 2018. [Google Scholar]
- Fang, T. Computations and Modeling of Oil Transport between Piston Lands and Liner in Internal Combustion Engines. Ph.D. Thesis, Massachusetts Institute of Technology, Cambridge, MA, USA, 2018. [Google Scholar]
Figure 1.
The optical window and ring pack design of the engine.

Figure 2.
The engine transient cycle and the trigger of the camera.

Figure 3.
The oil transport behavior after changing load.

Figure 4.
The second ring chamfer design.

Figure 5.
The time for oil reach equilibrium at each region: (a) engine speed set as 1200 RPM; (b) engine speed set as 200 RPM; (c) engine speed set as 3000 RPM; (d) engine load set as 140 mbar.
Figure 5.
The time for oil reach equilibrium at each region: (a) engine speed set as 1200 RPM; (b) engine speed set as 200 RPM; (c) engine speed set as 3000 RPM; (d) engine load set as 140 mbar.
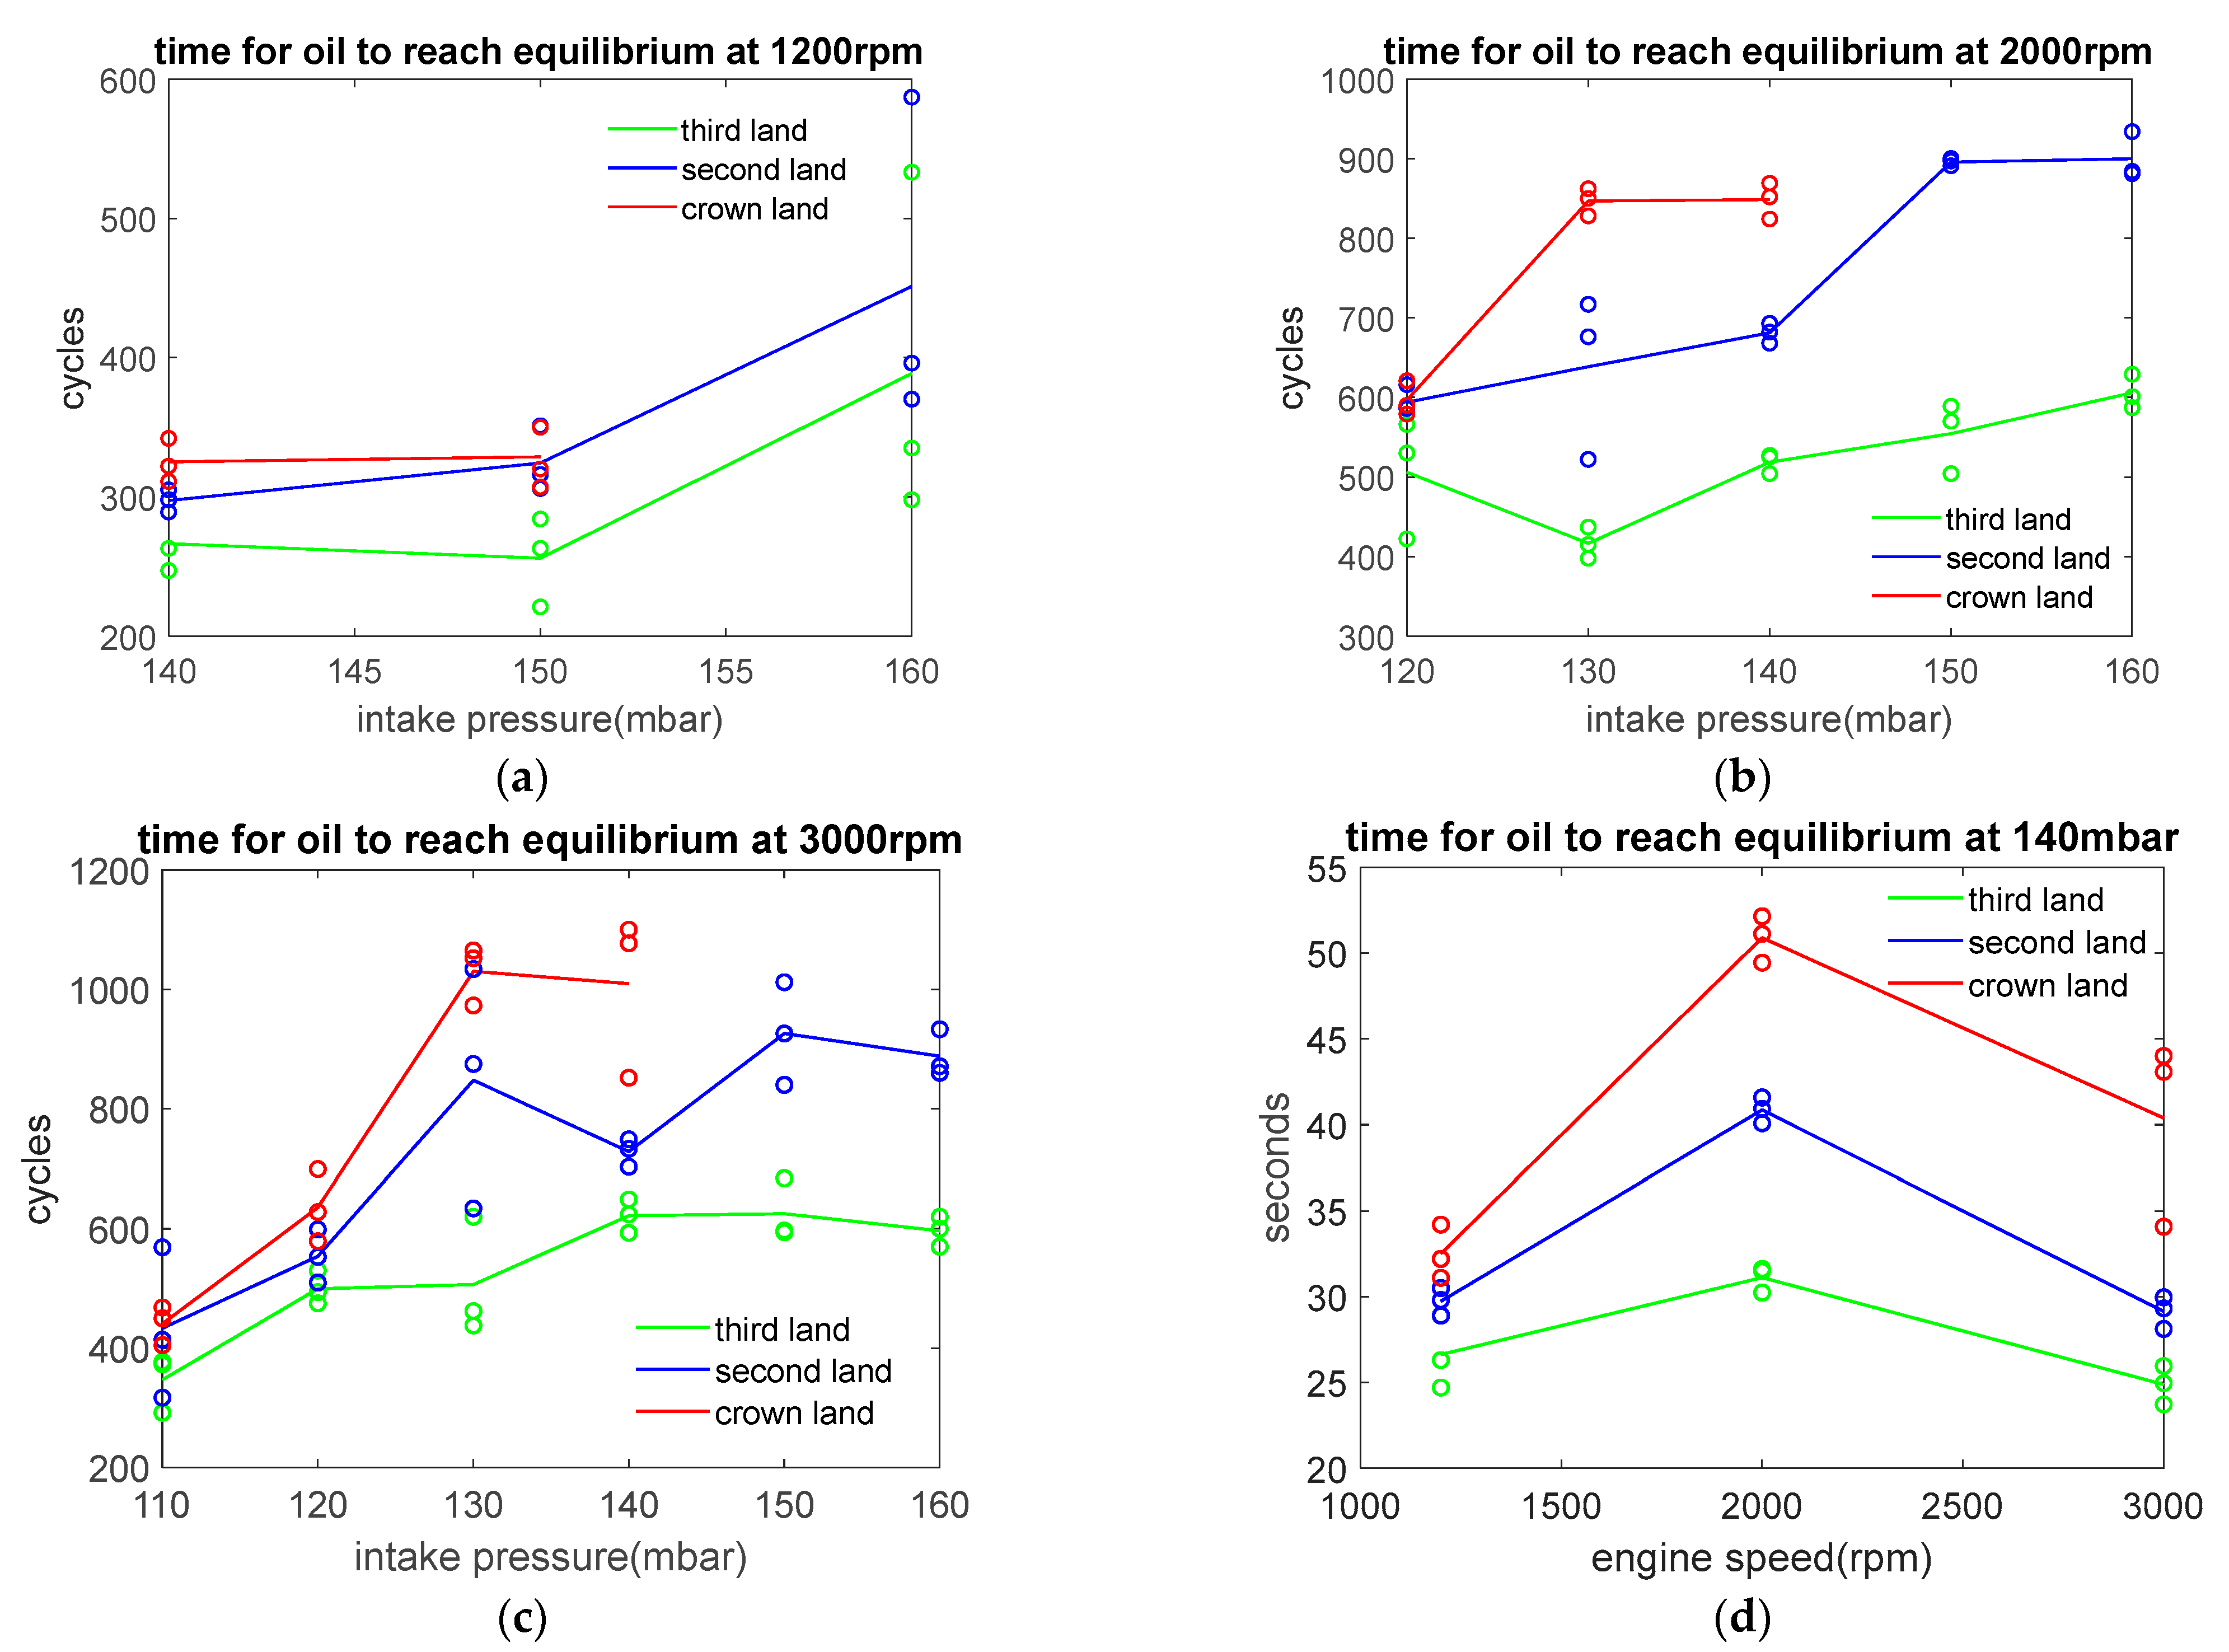
Figure 6.
The oil behavior at different loads.
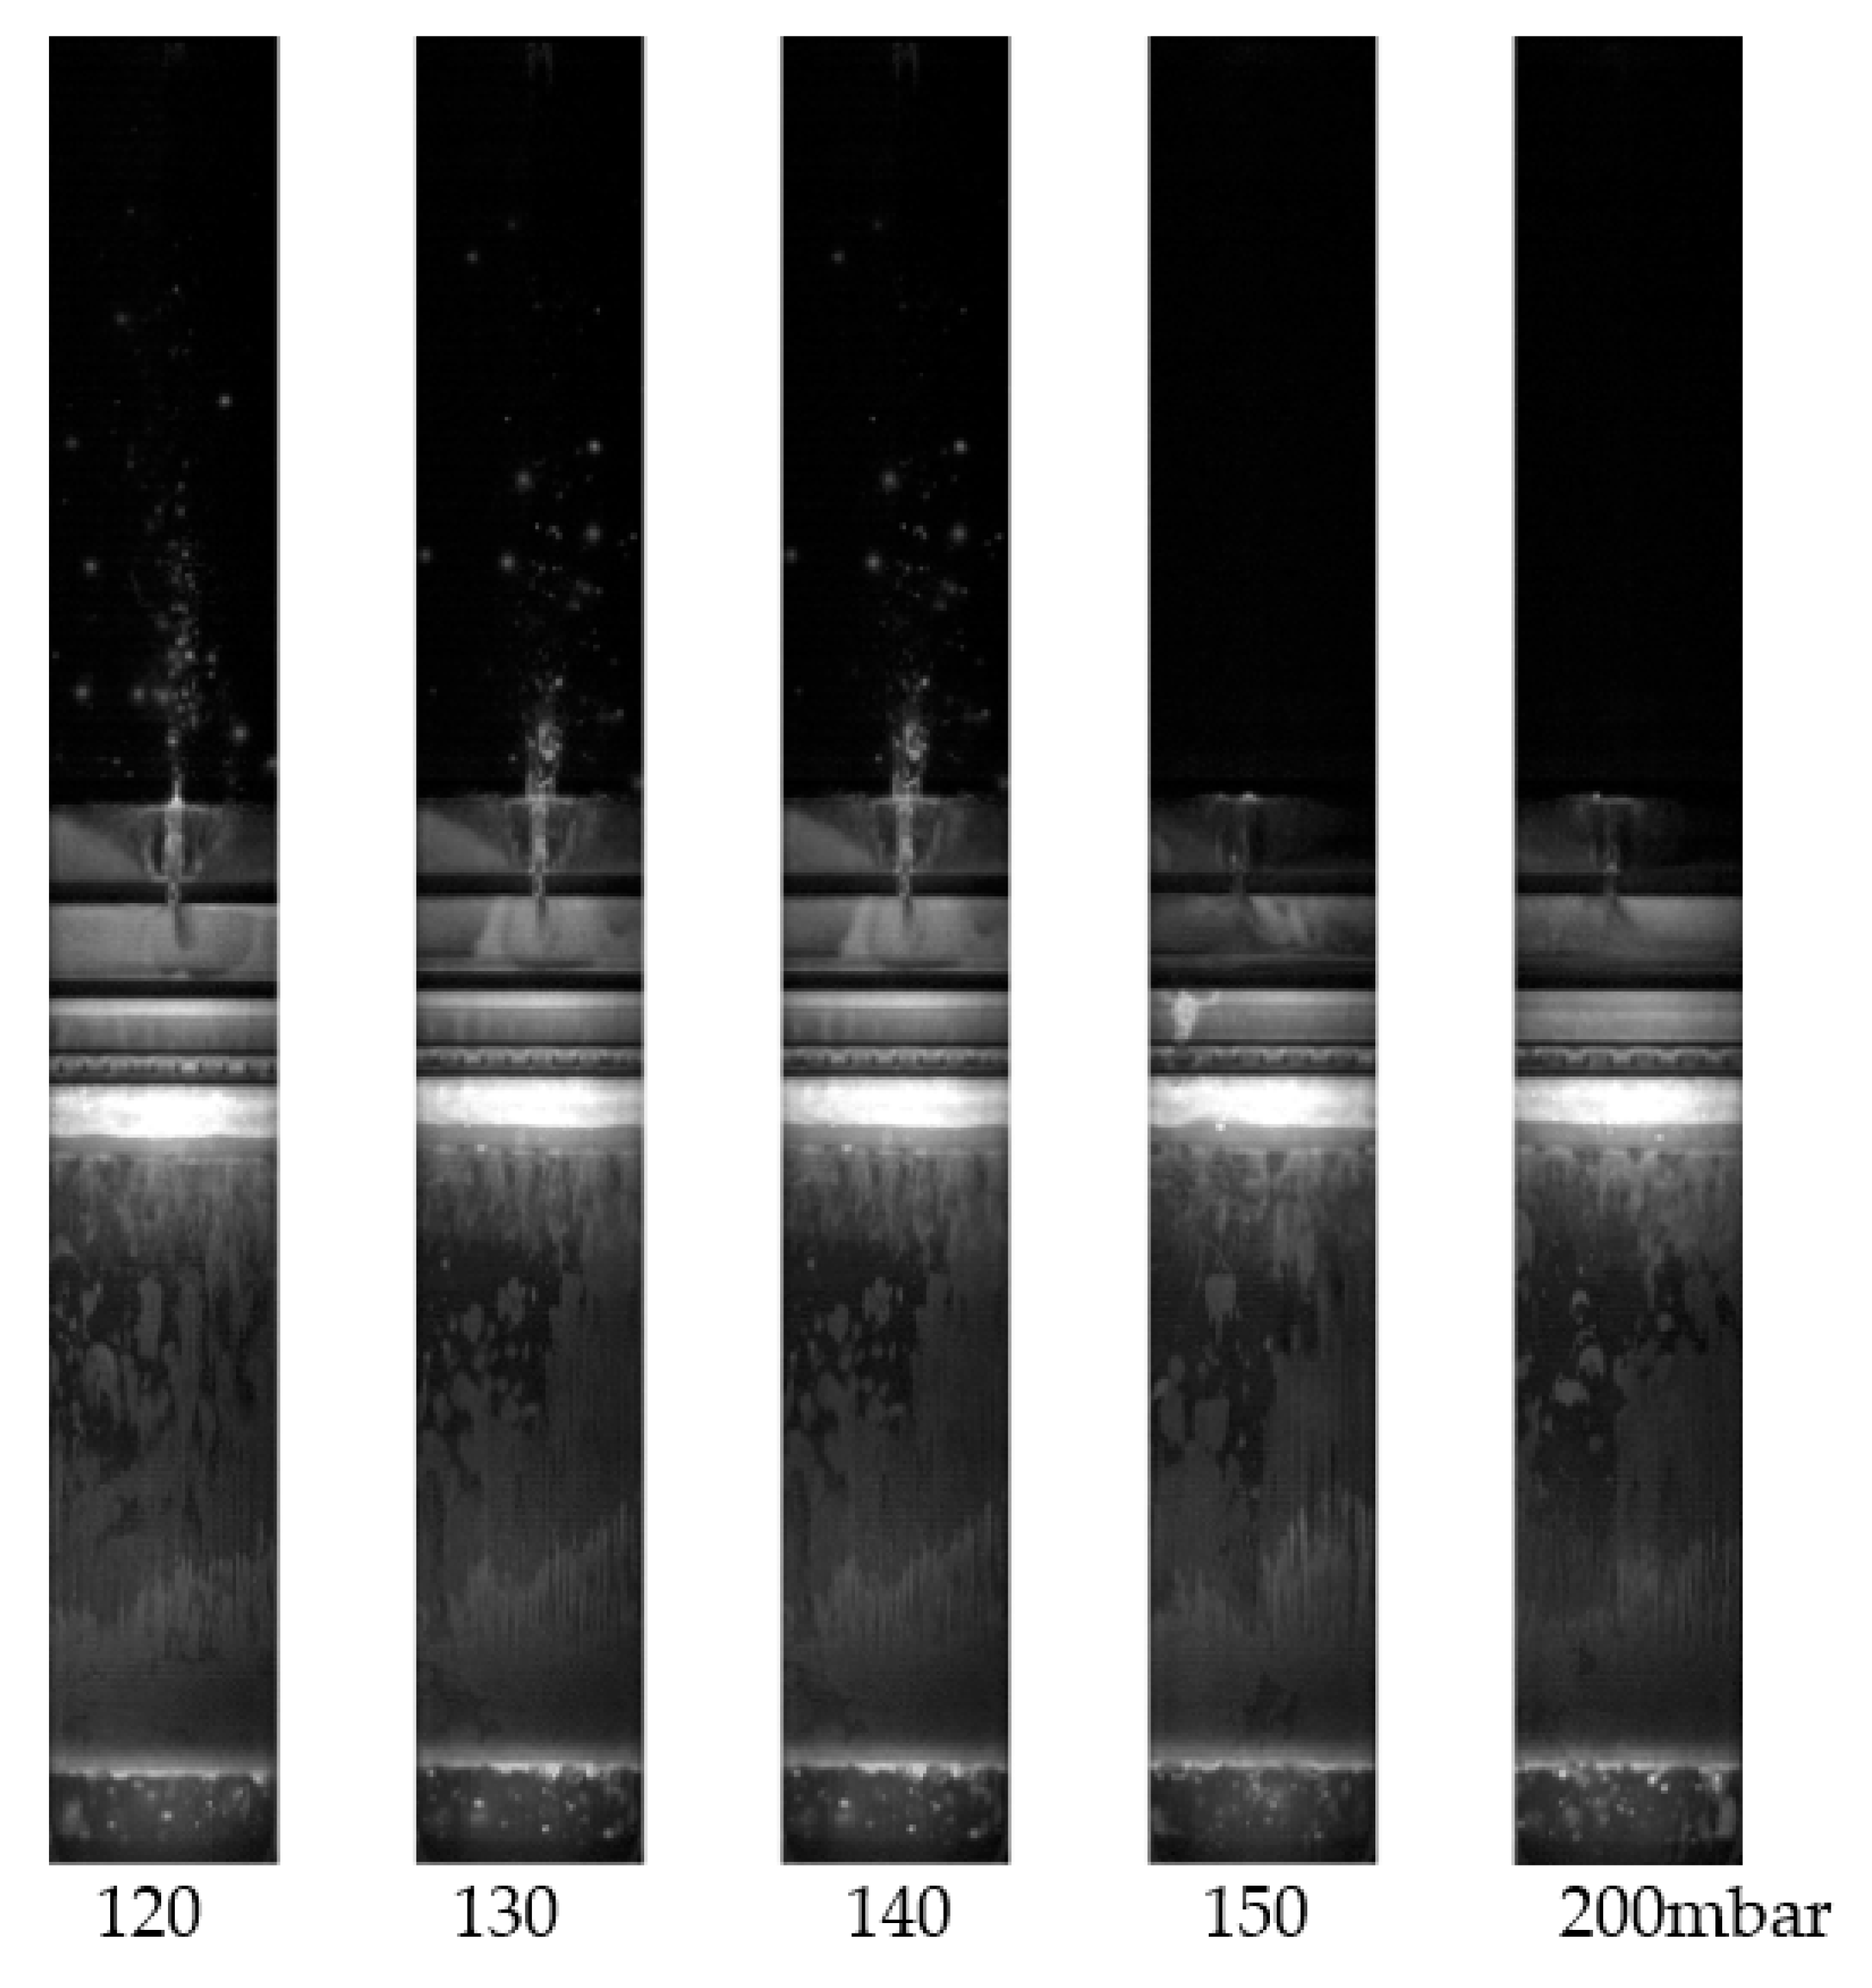
Figure 7.
The measured crankcase pressure and blowby.

Figure 8.
Results from 2D ring dynamics and a gas flow model.
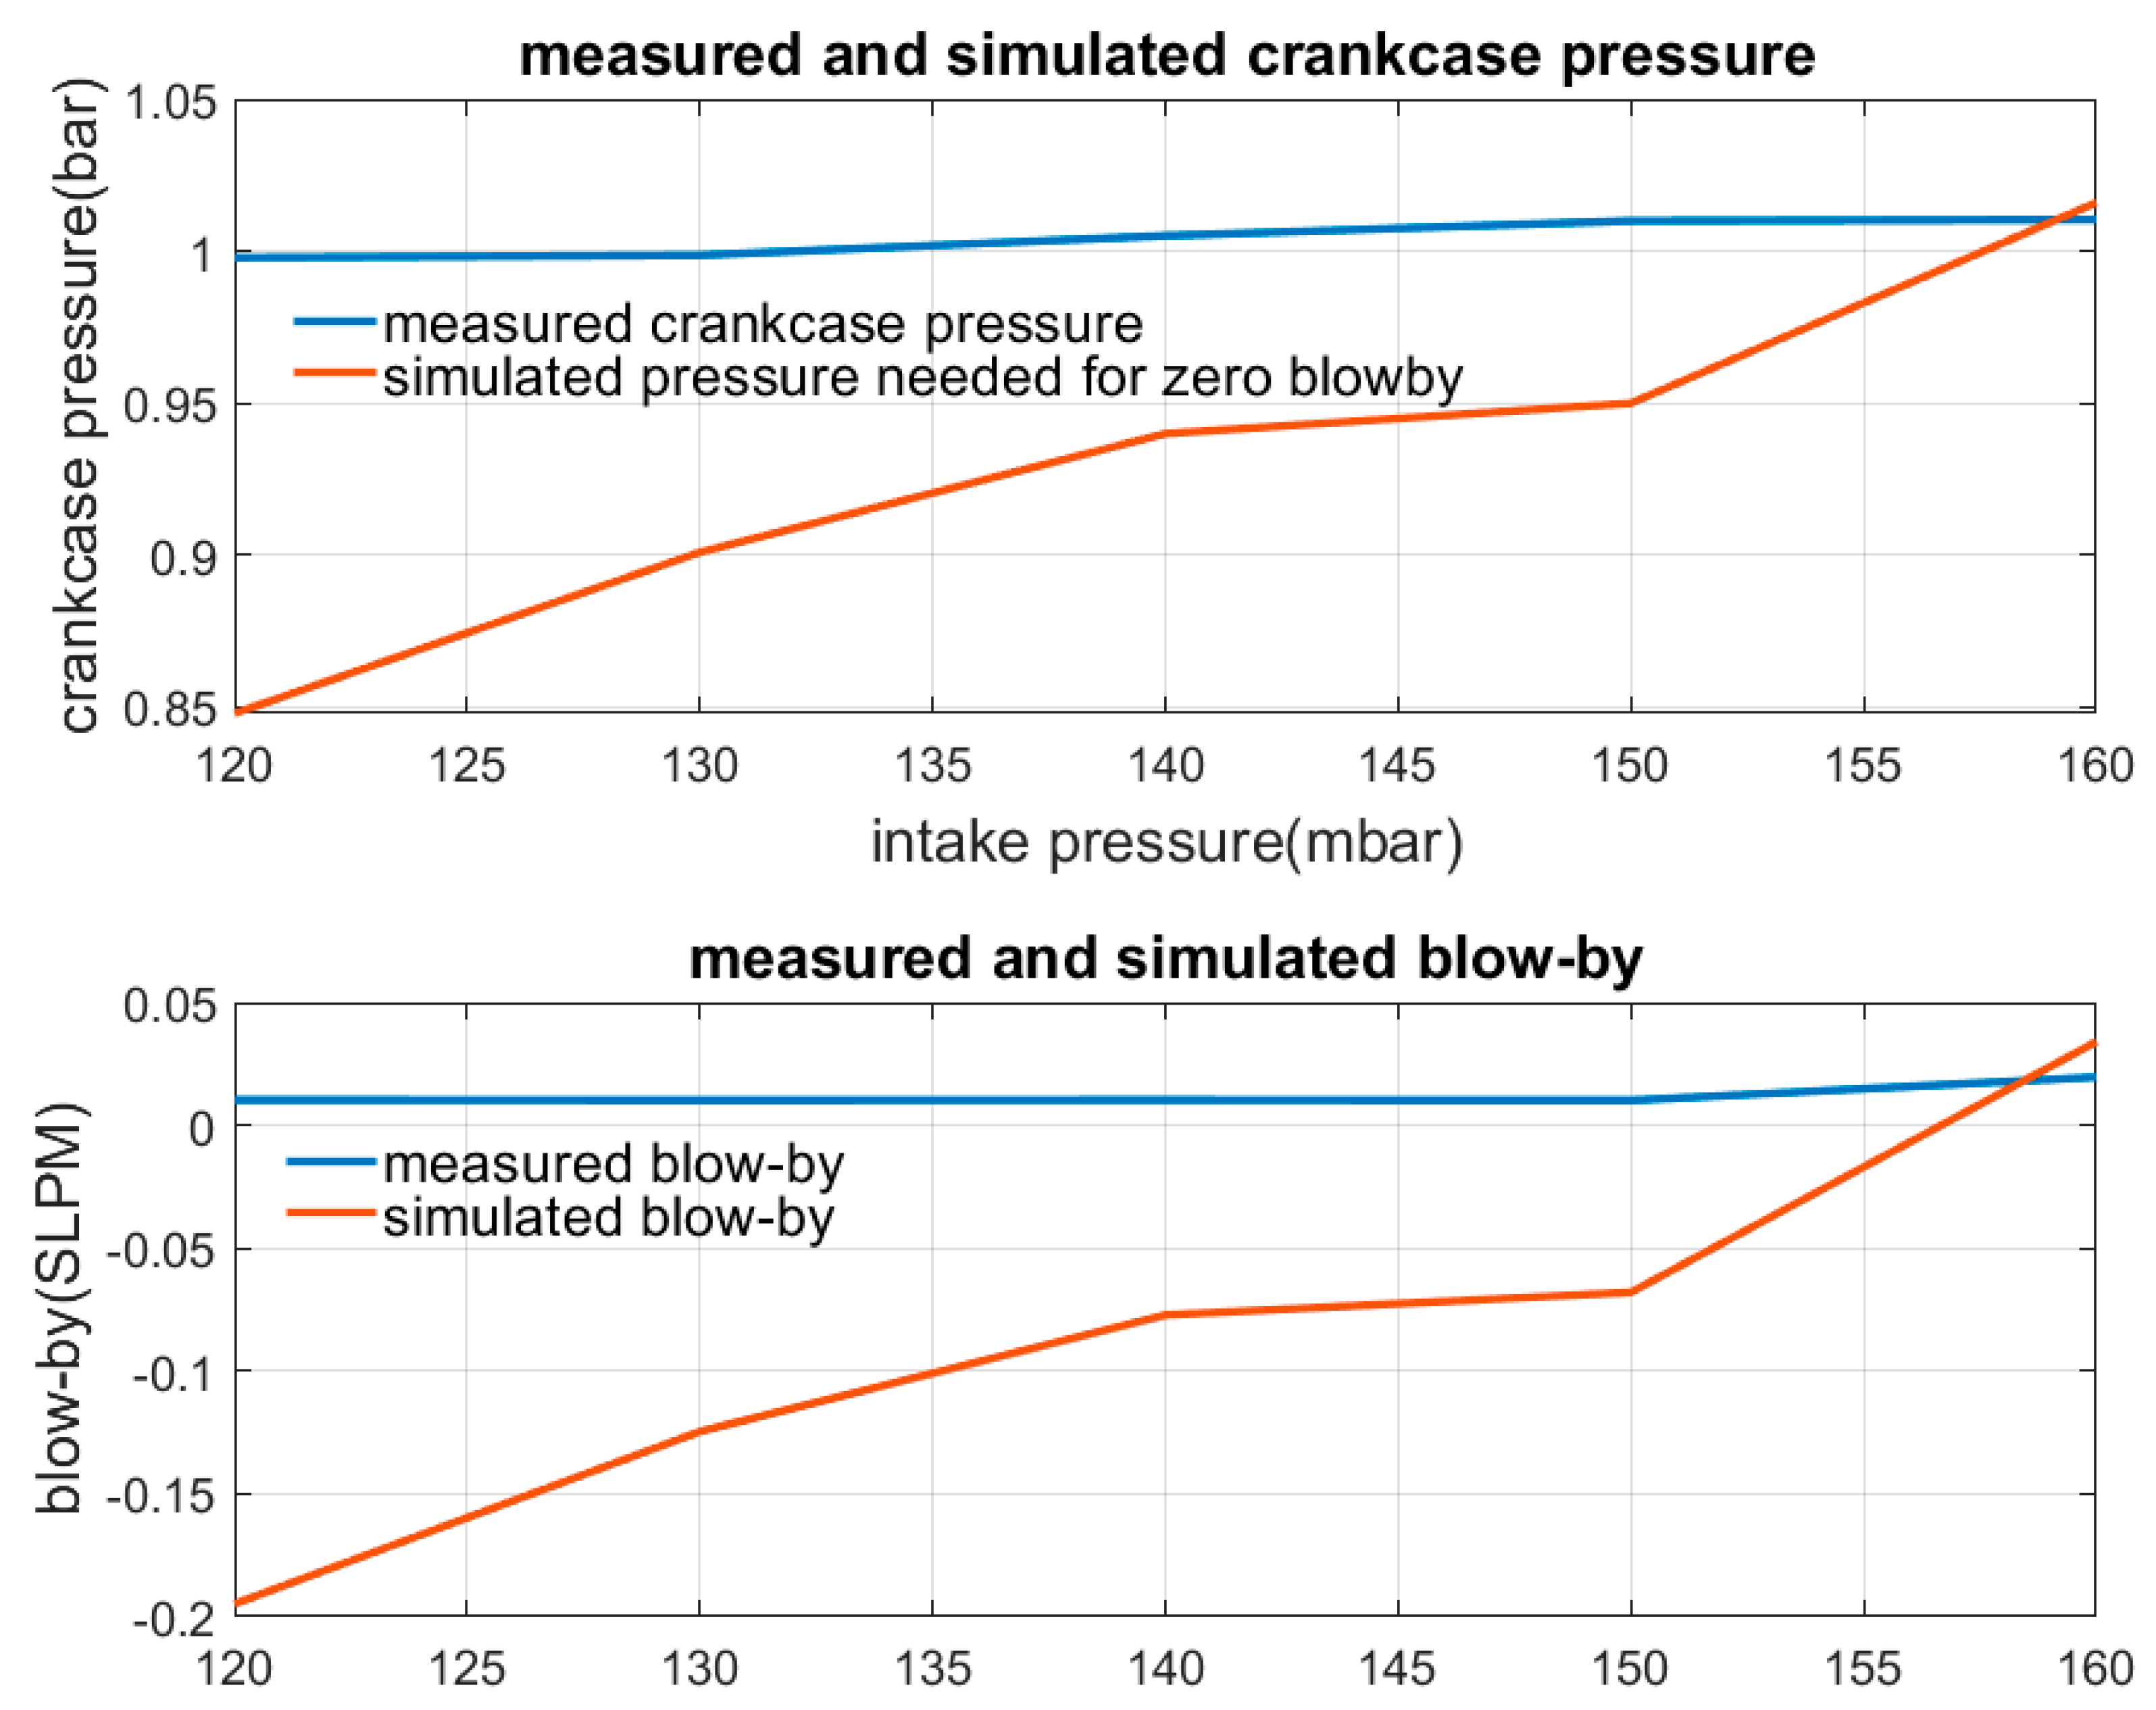
Figure 9.
Blowby and engine speed at different intake pressure.
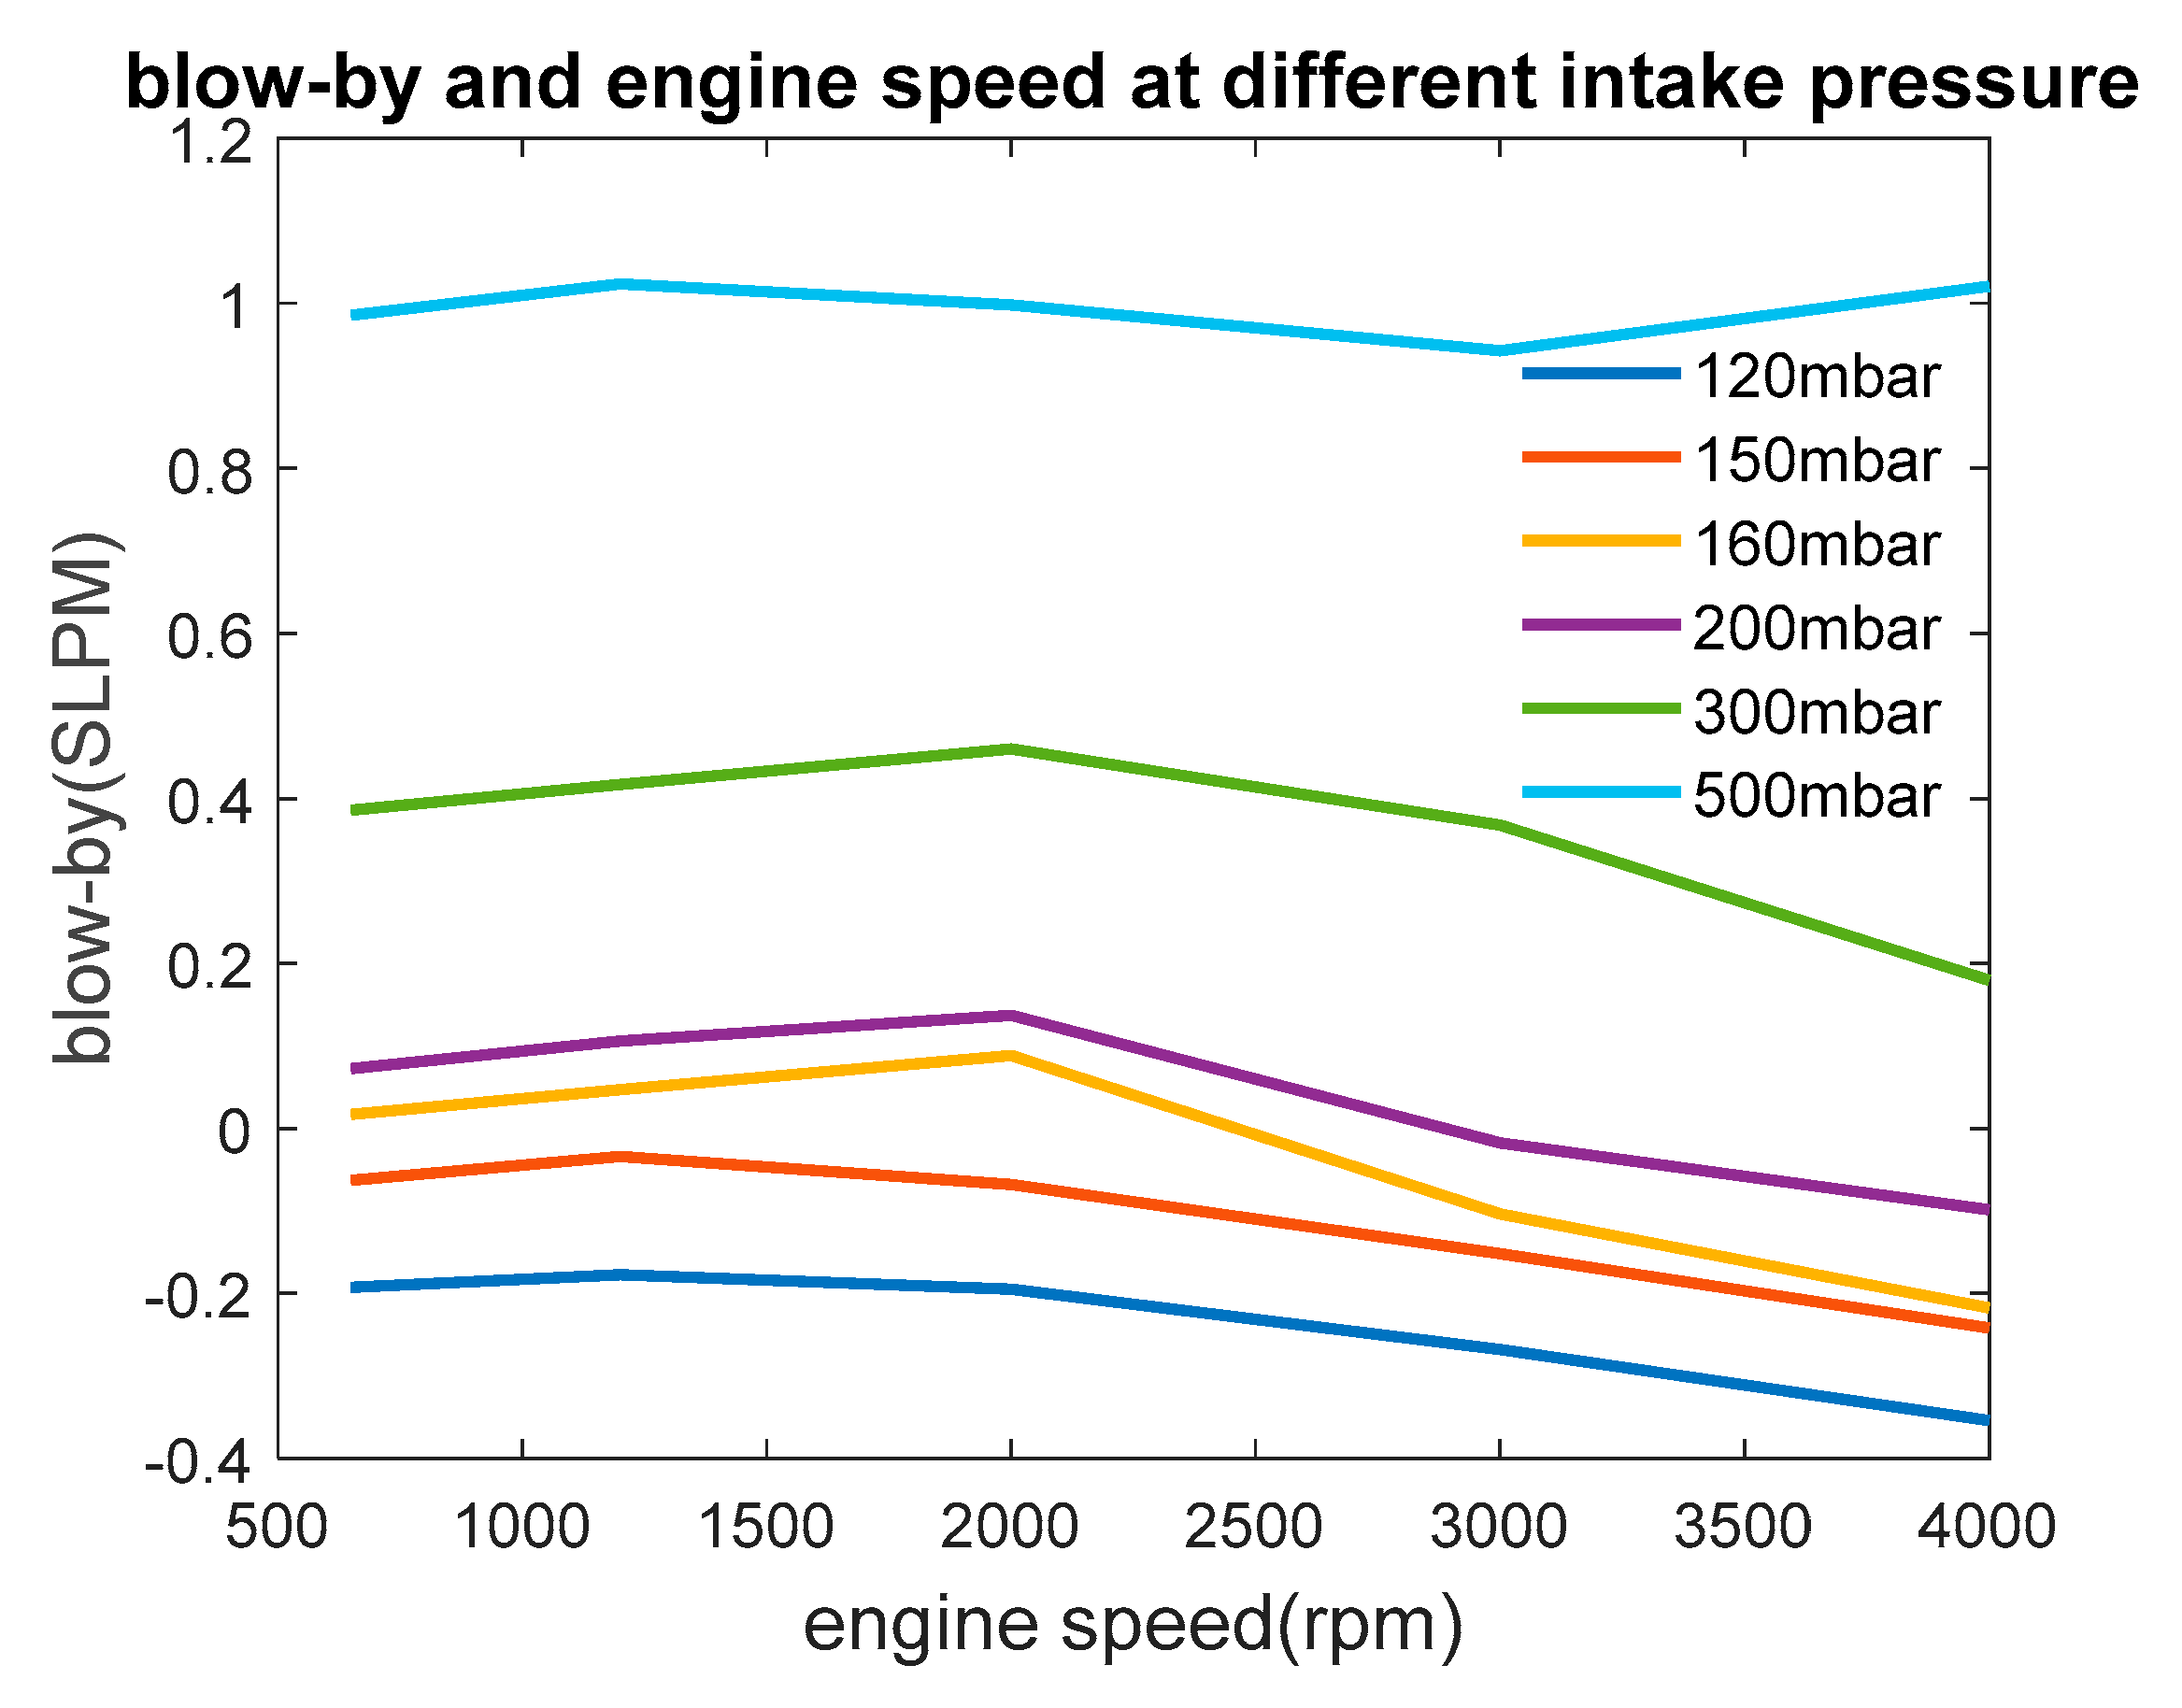
Figure 10.
Computer vision to identify the oil inside OCR groove: (a) the depth of optical view; (b) tracing the location of OCR in the recording.
Figure 10.
Computer vision to identify the oil inside OCR groove: (a) the depth of optical view; (b) tracing the location of OCR in the recording.
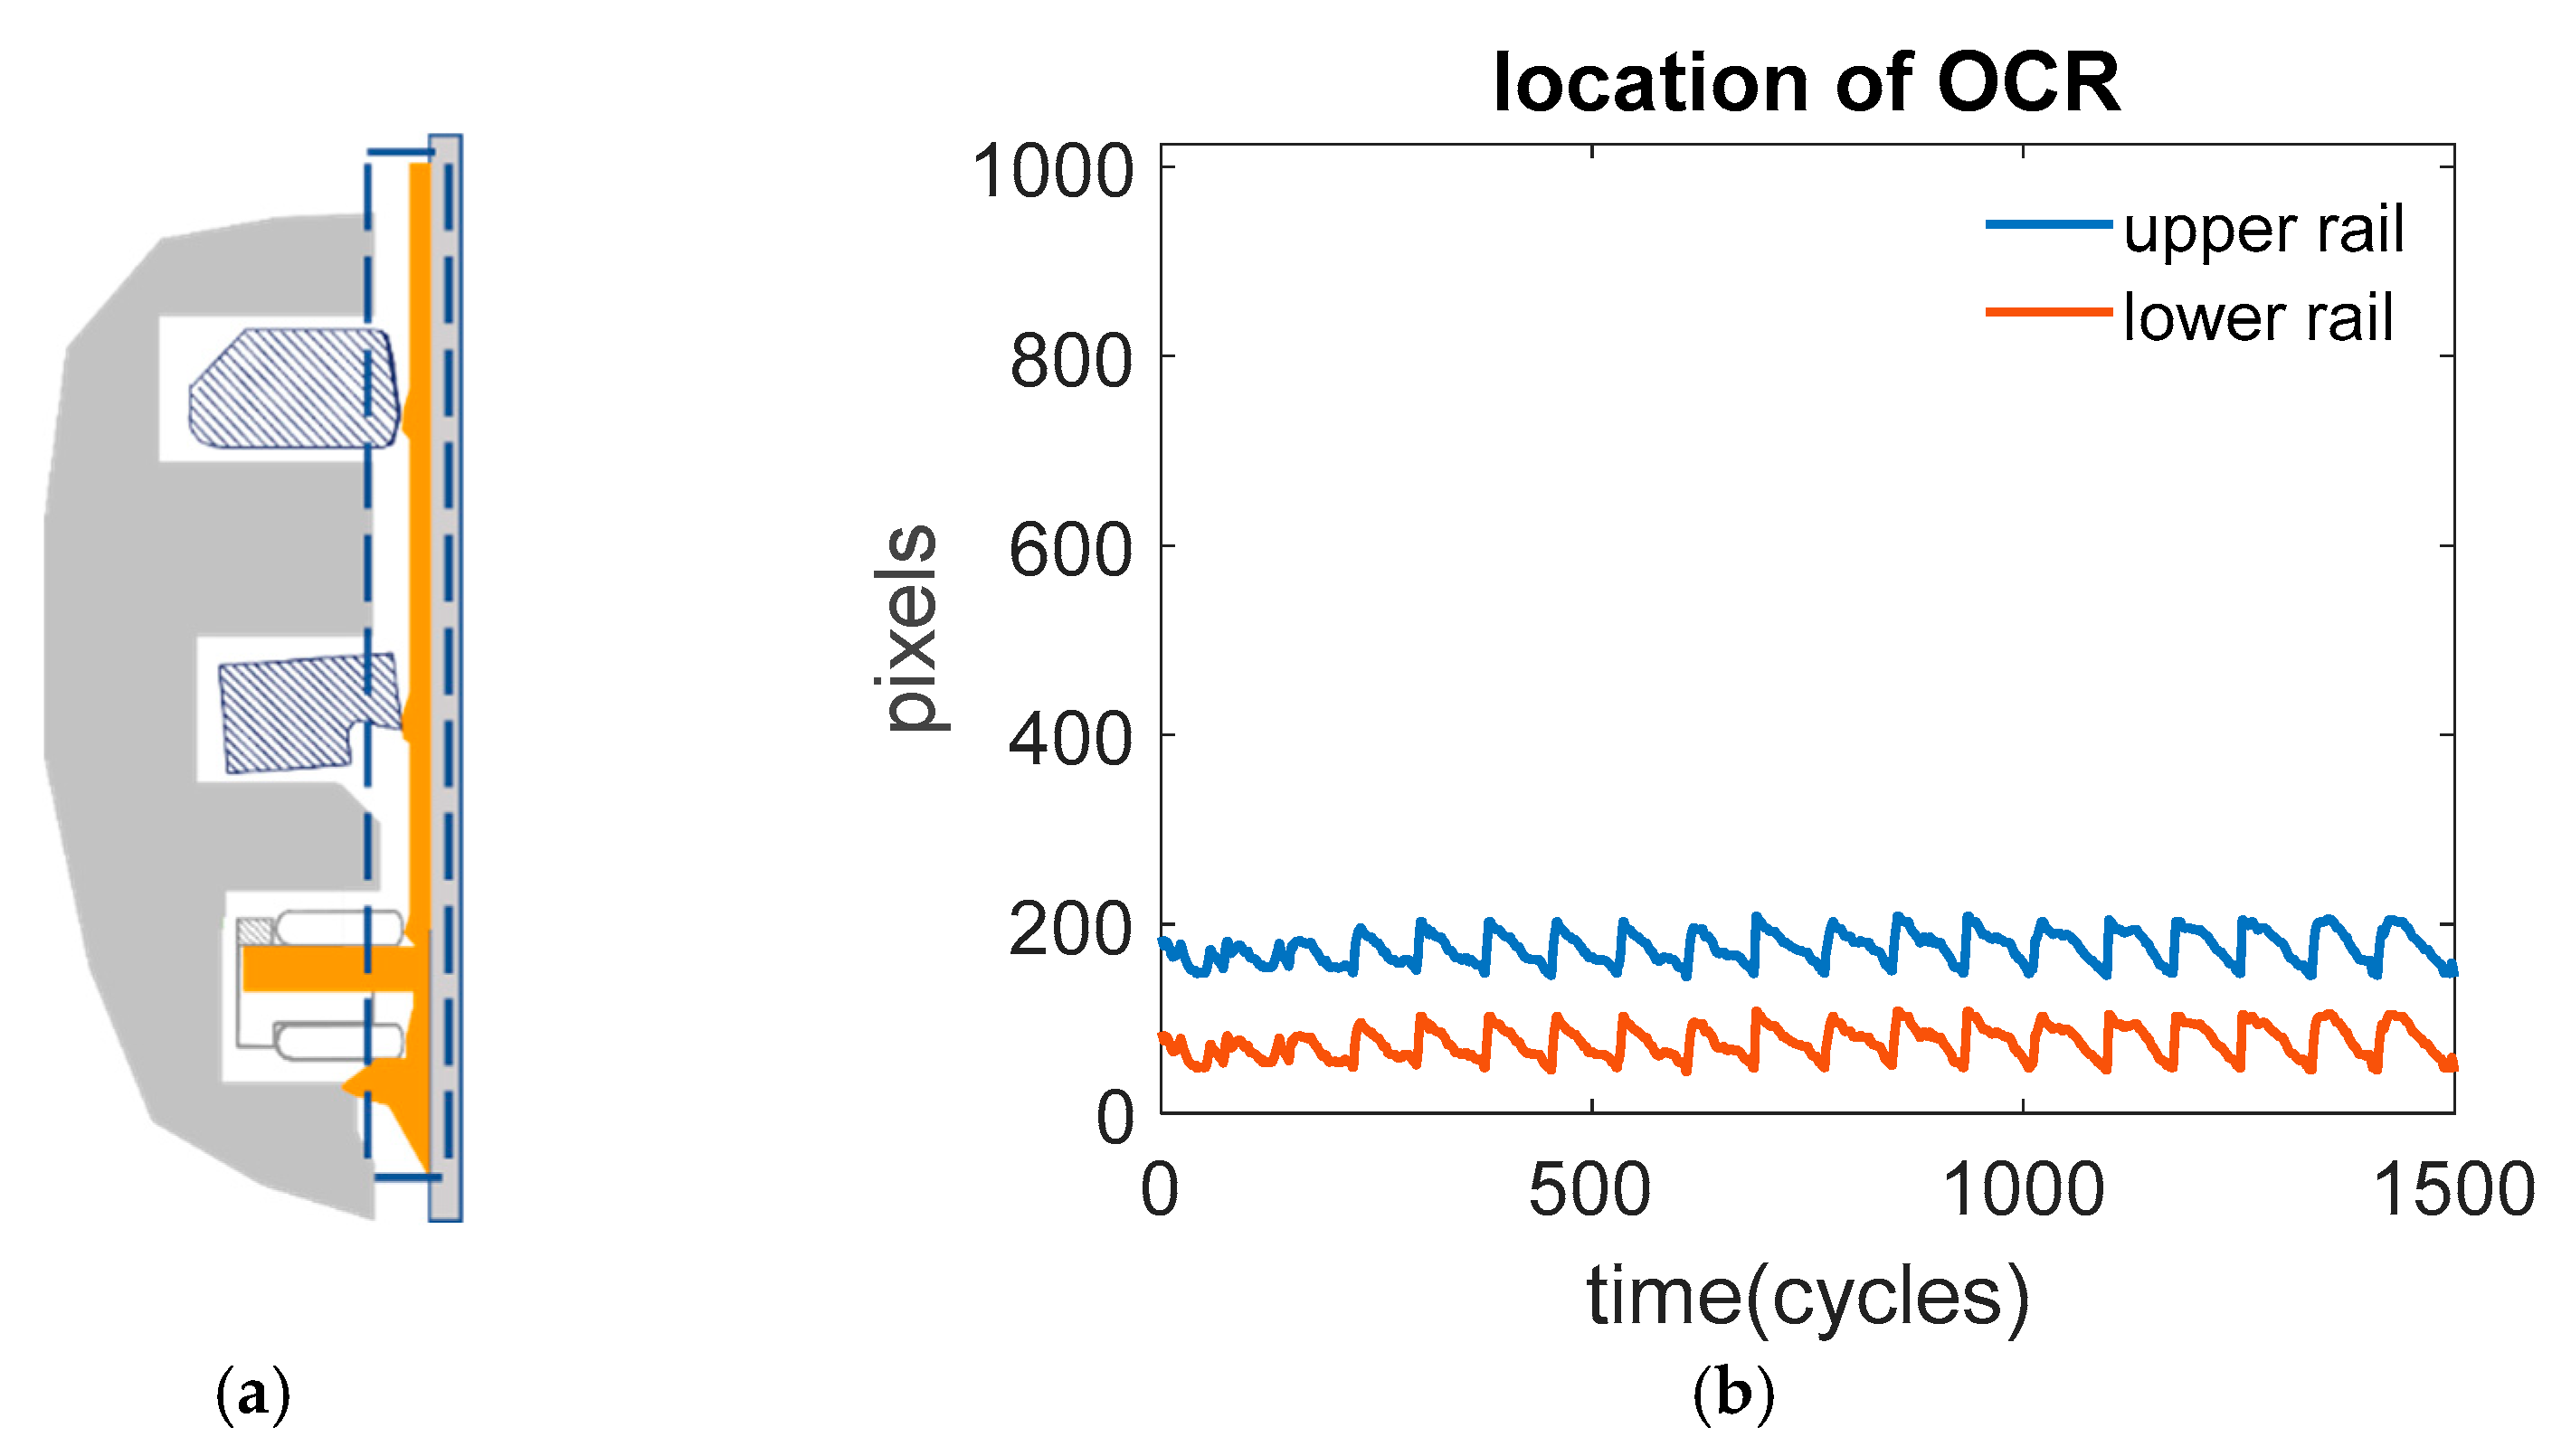
Figure 11.
Oil leveled on all the pitches.
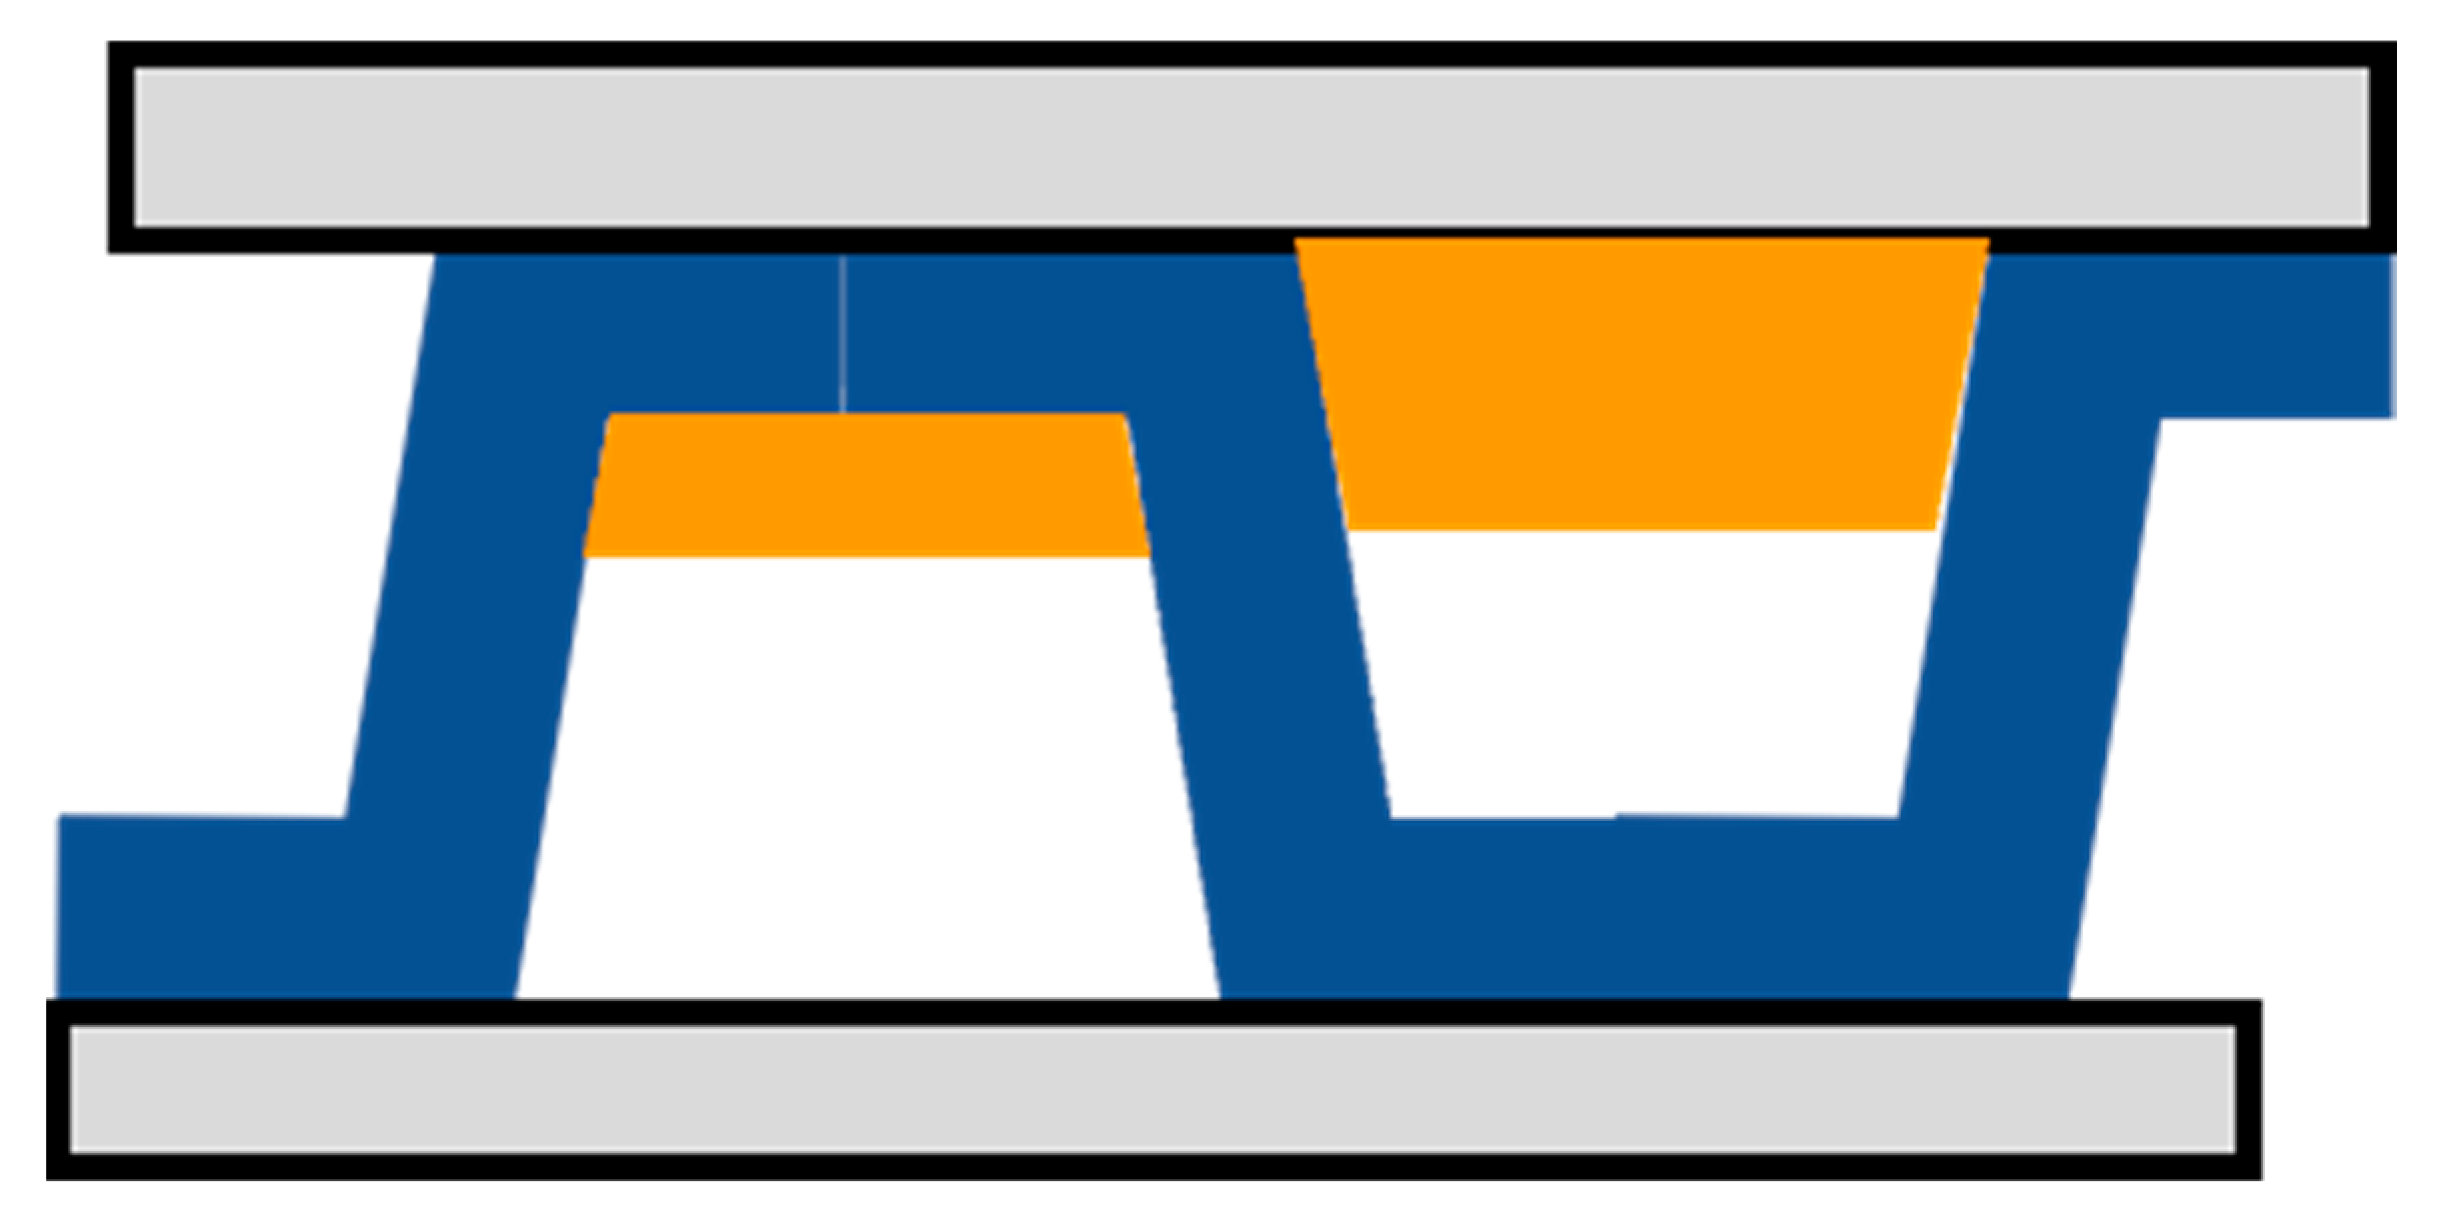
Figure 12.
Oil distribution and accumulation inside OCR groove: (a) the brightness distribution on oil leveled on the OCR pitches; (b) the oil accumulation’s change with time after transient happened.
Figure 12.
Oil distribution and accumulation inside OCR groove: (a) the brightness distribution on oil leveled on the OCR pitches; (b) the oil accumulation’s change with time after transient happened.
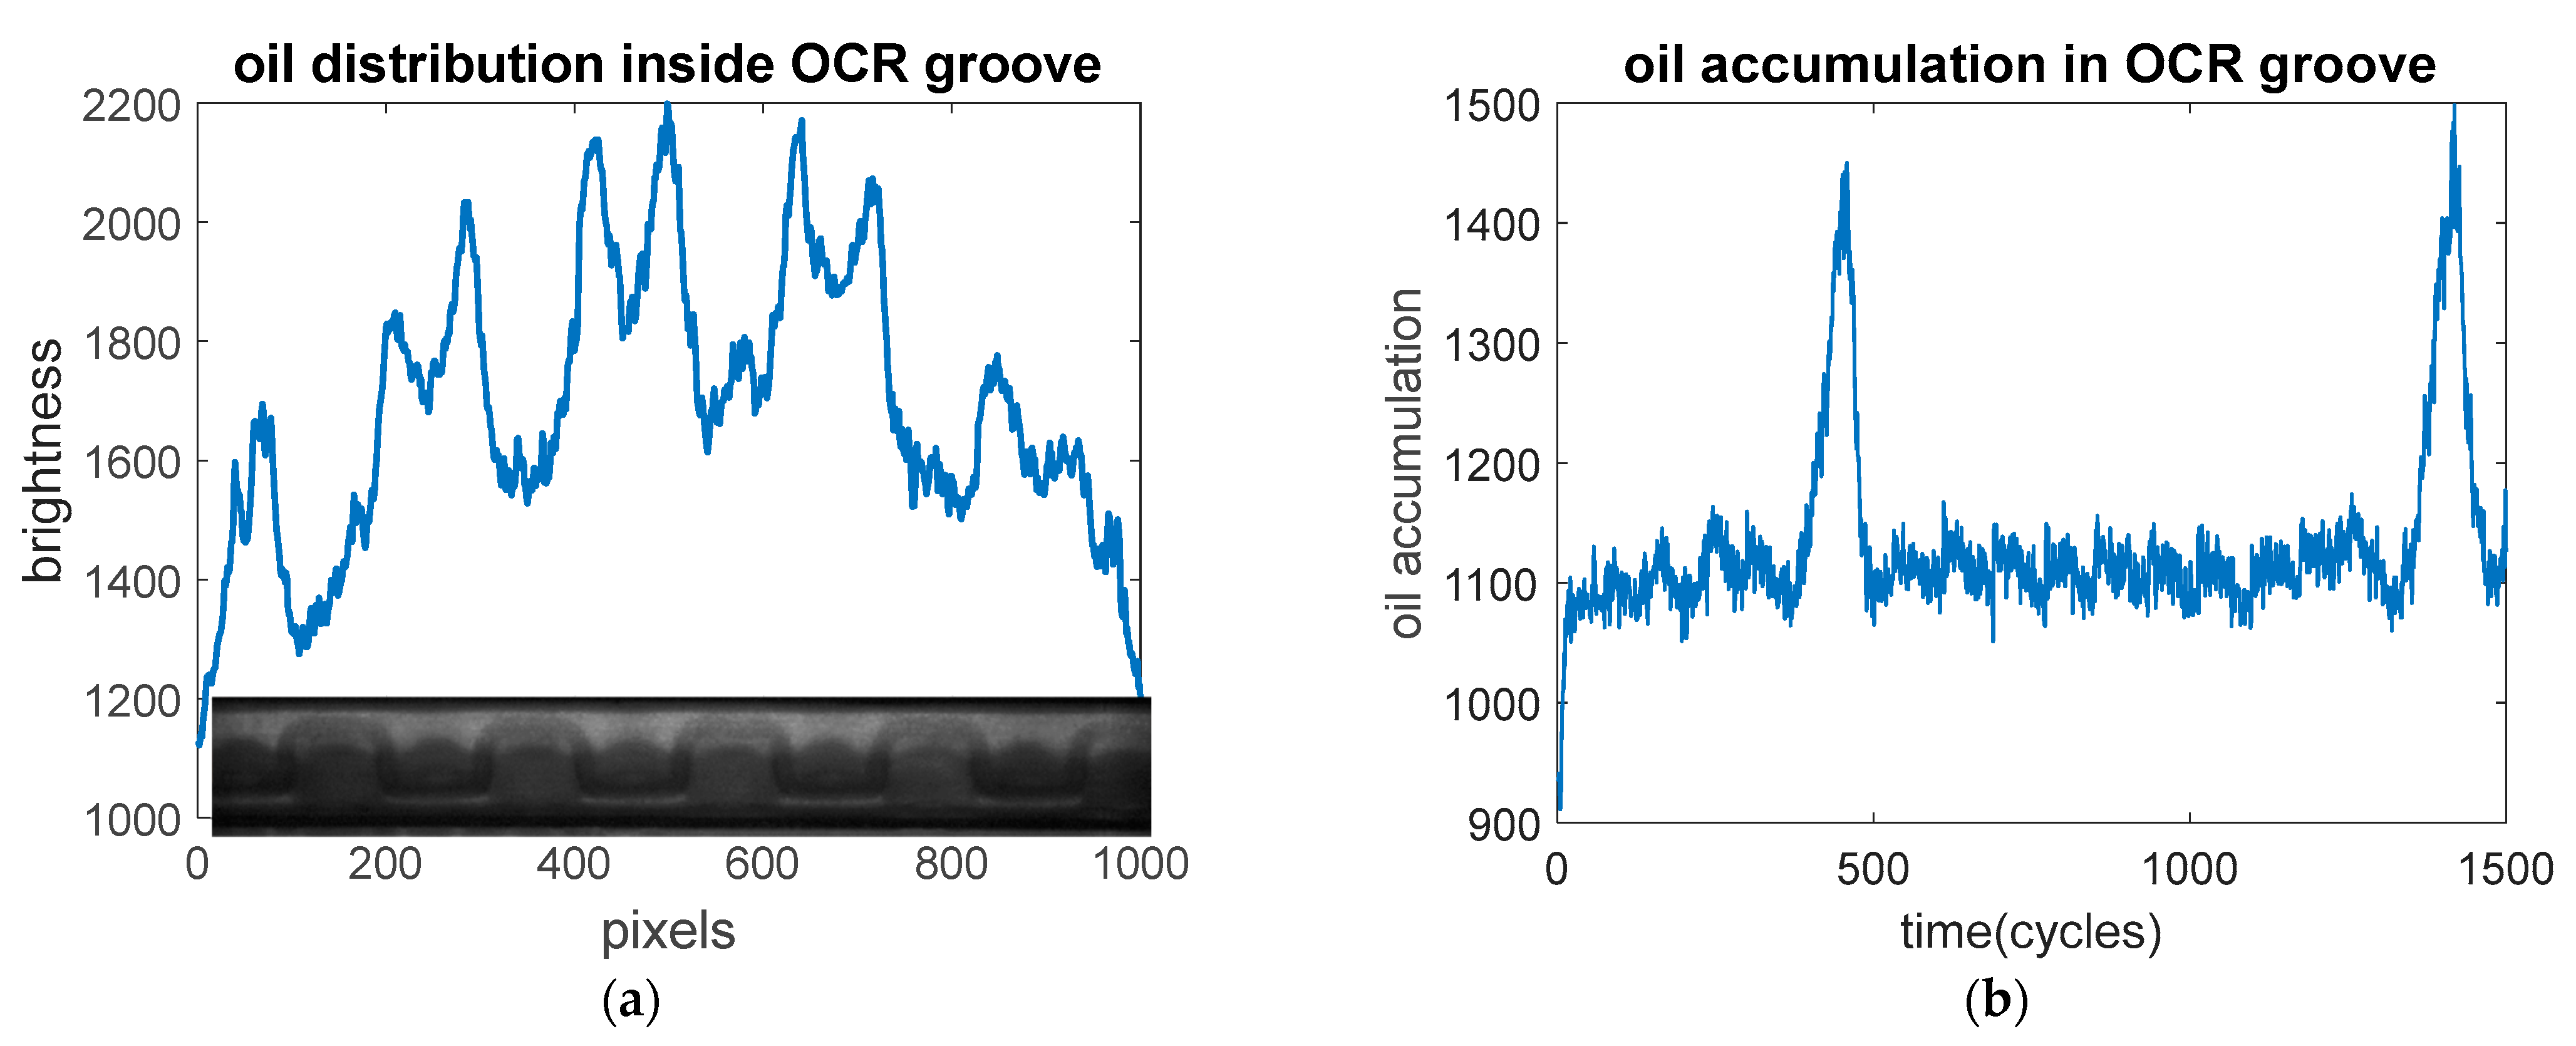
Figure 13.
Oil accumulation change with load at 2000 RPM.
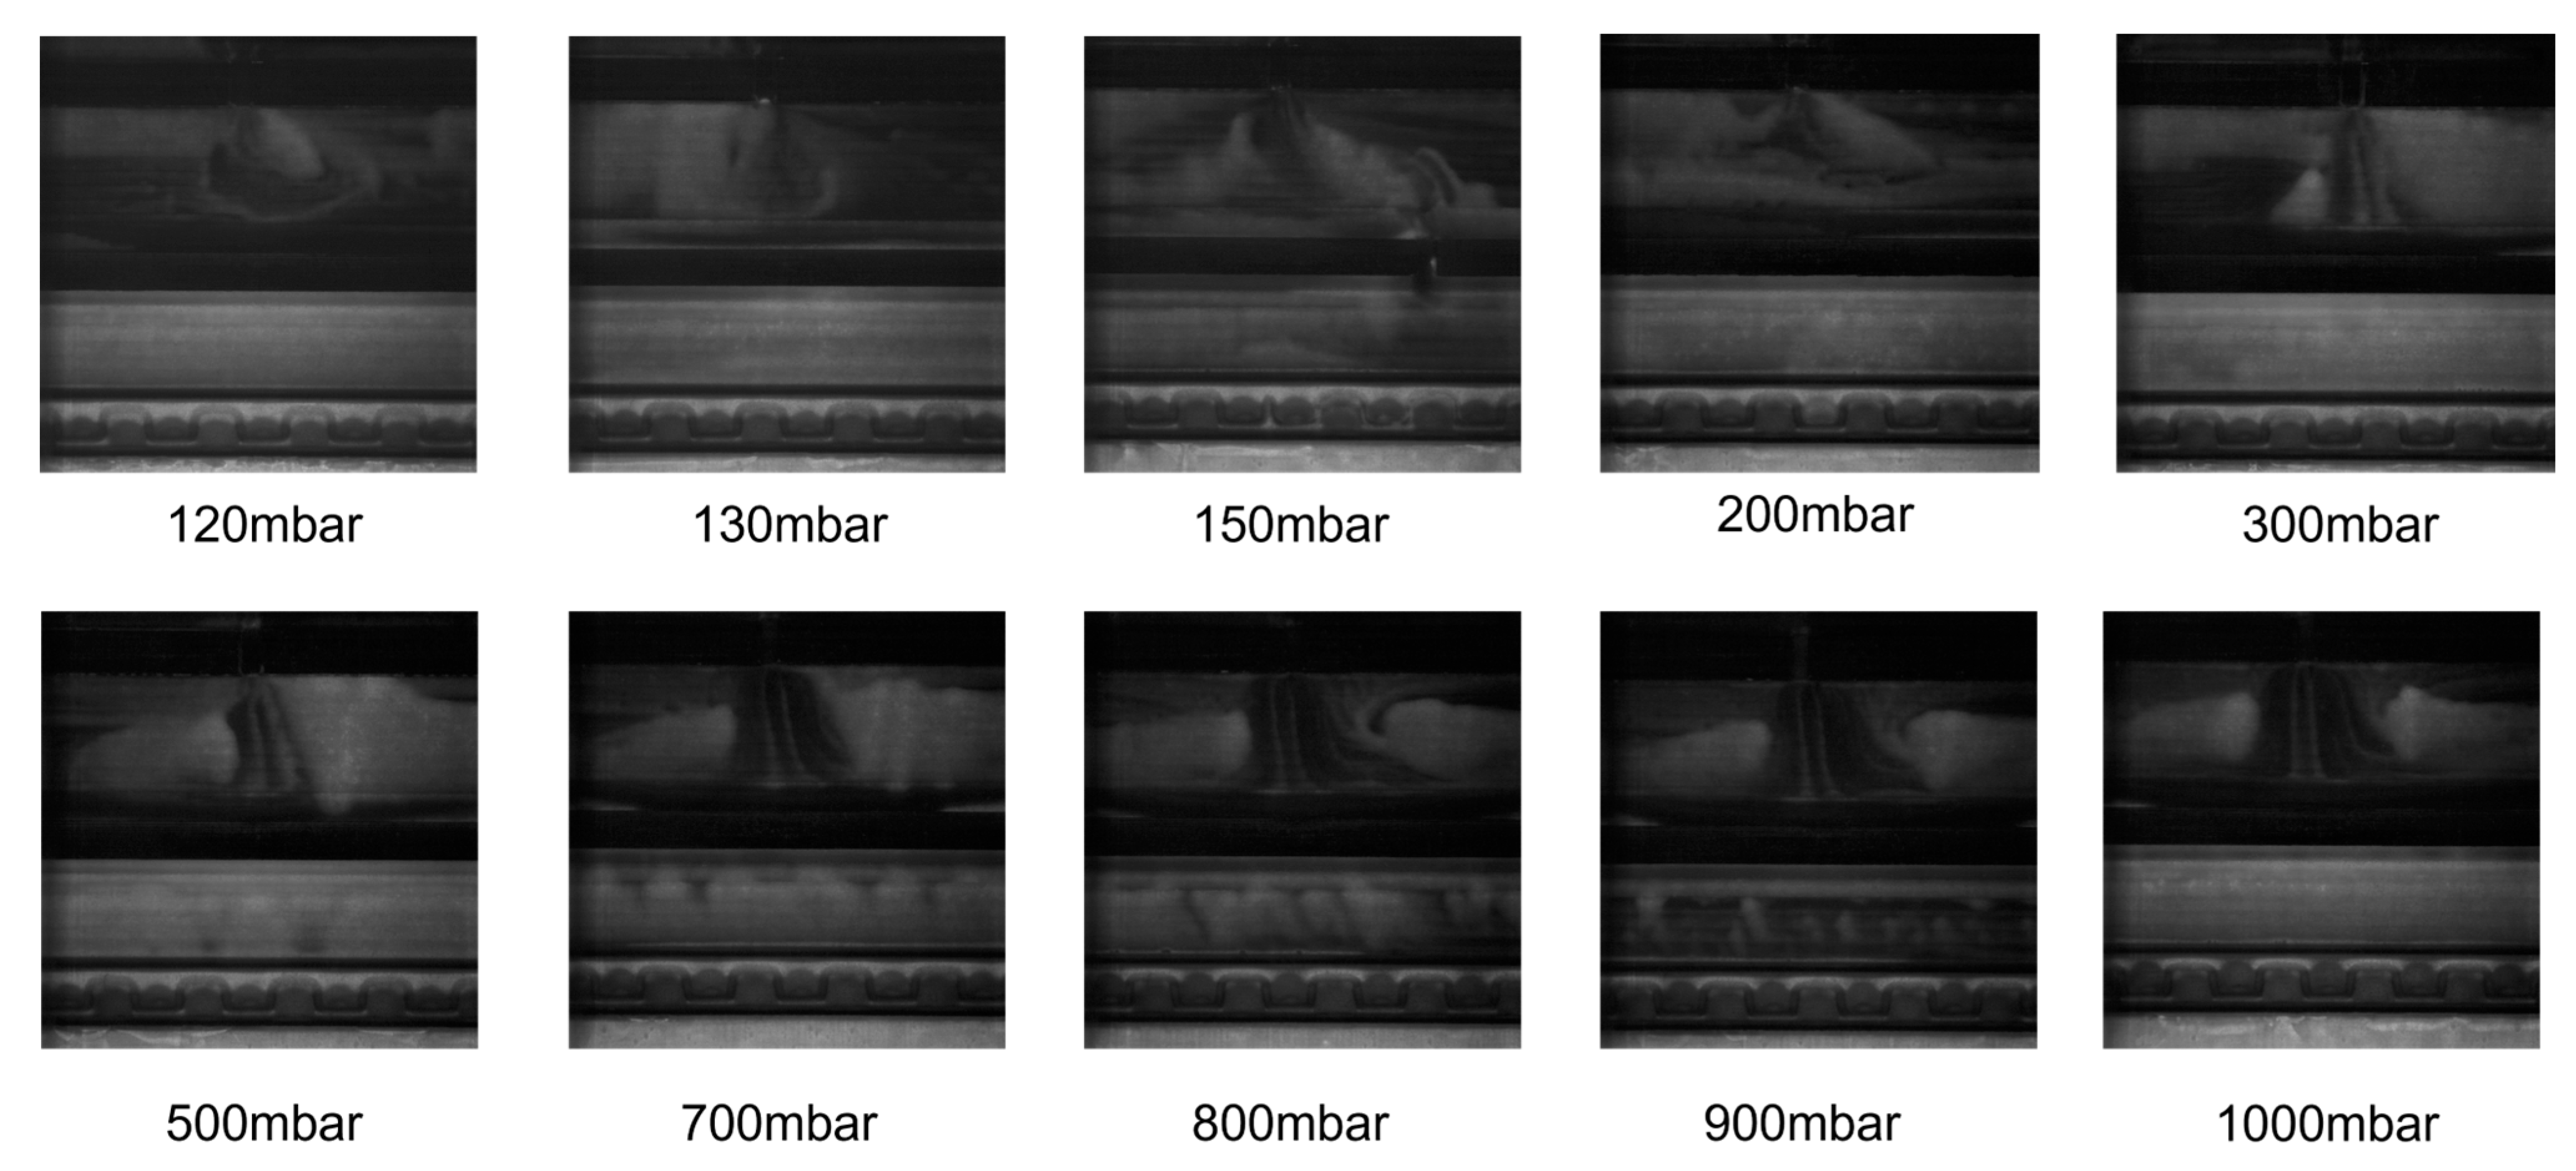
Figure 14.
Computer vision plots: (a) the oil accumulation in OCR groove’s change with load under the blowby separation line; (b) the oil accumulation in OCR groove’s change with load above the blowby separation line; (c) averaged oil accumulation in OCR when reaching equilibrium.
Figure 14.
Computer vision plots: (a) the oil accumulation in OCR groove’s change with load under the blowby separation line; (b) the oil accumulation in OCR groove’s change with load above the blowby separation line; (c) averaged oil accumulation in OCR when reaching equilibrium.

Figure 15.
Drain holes inside the OCR groove.

Figure 16.
The lower rail gap’s oil filling effect at 2000 RPM.
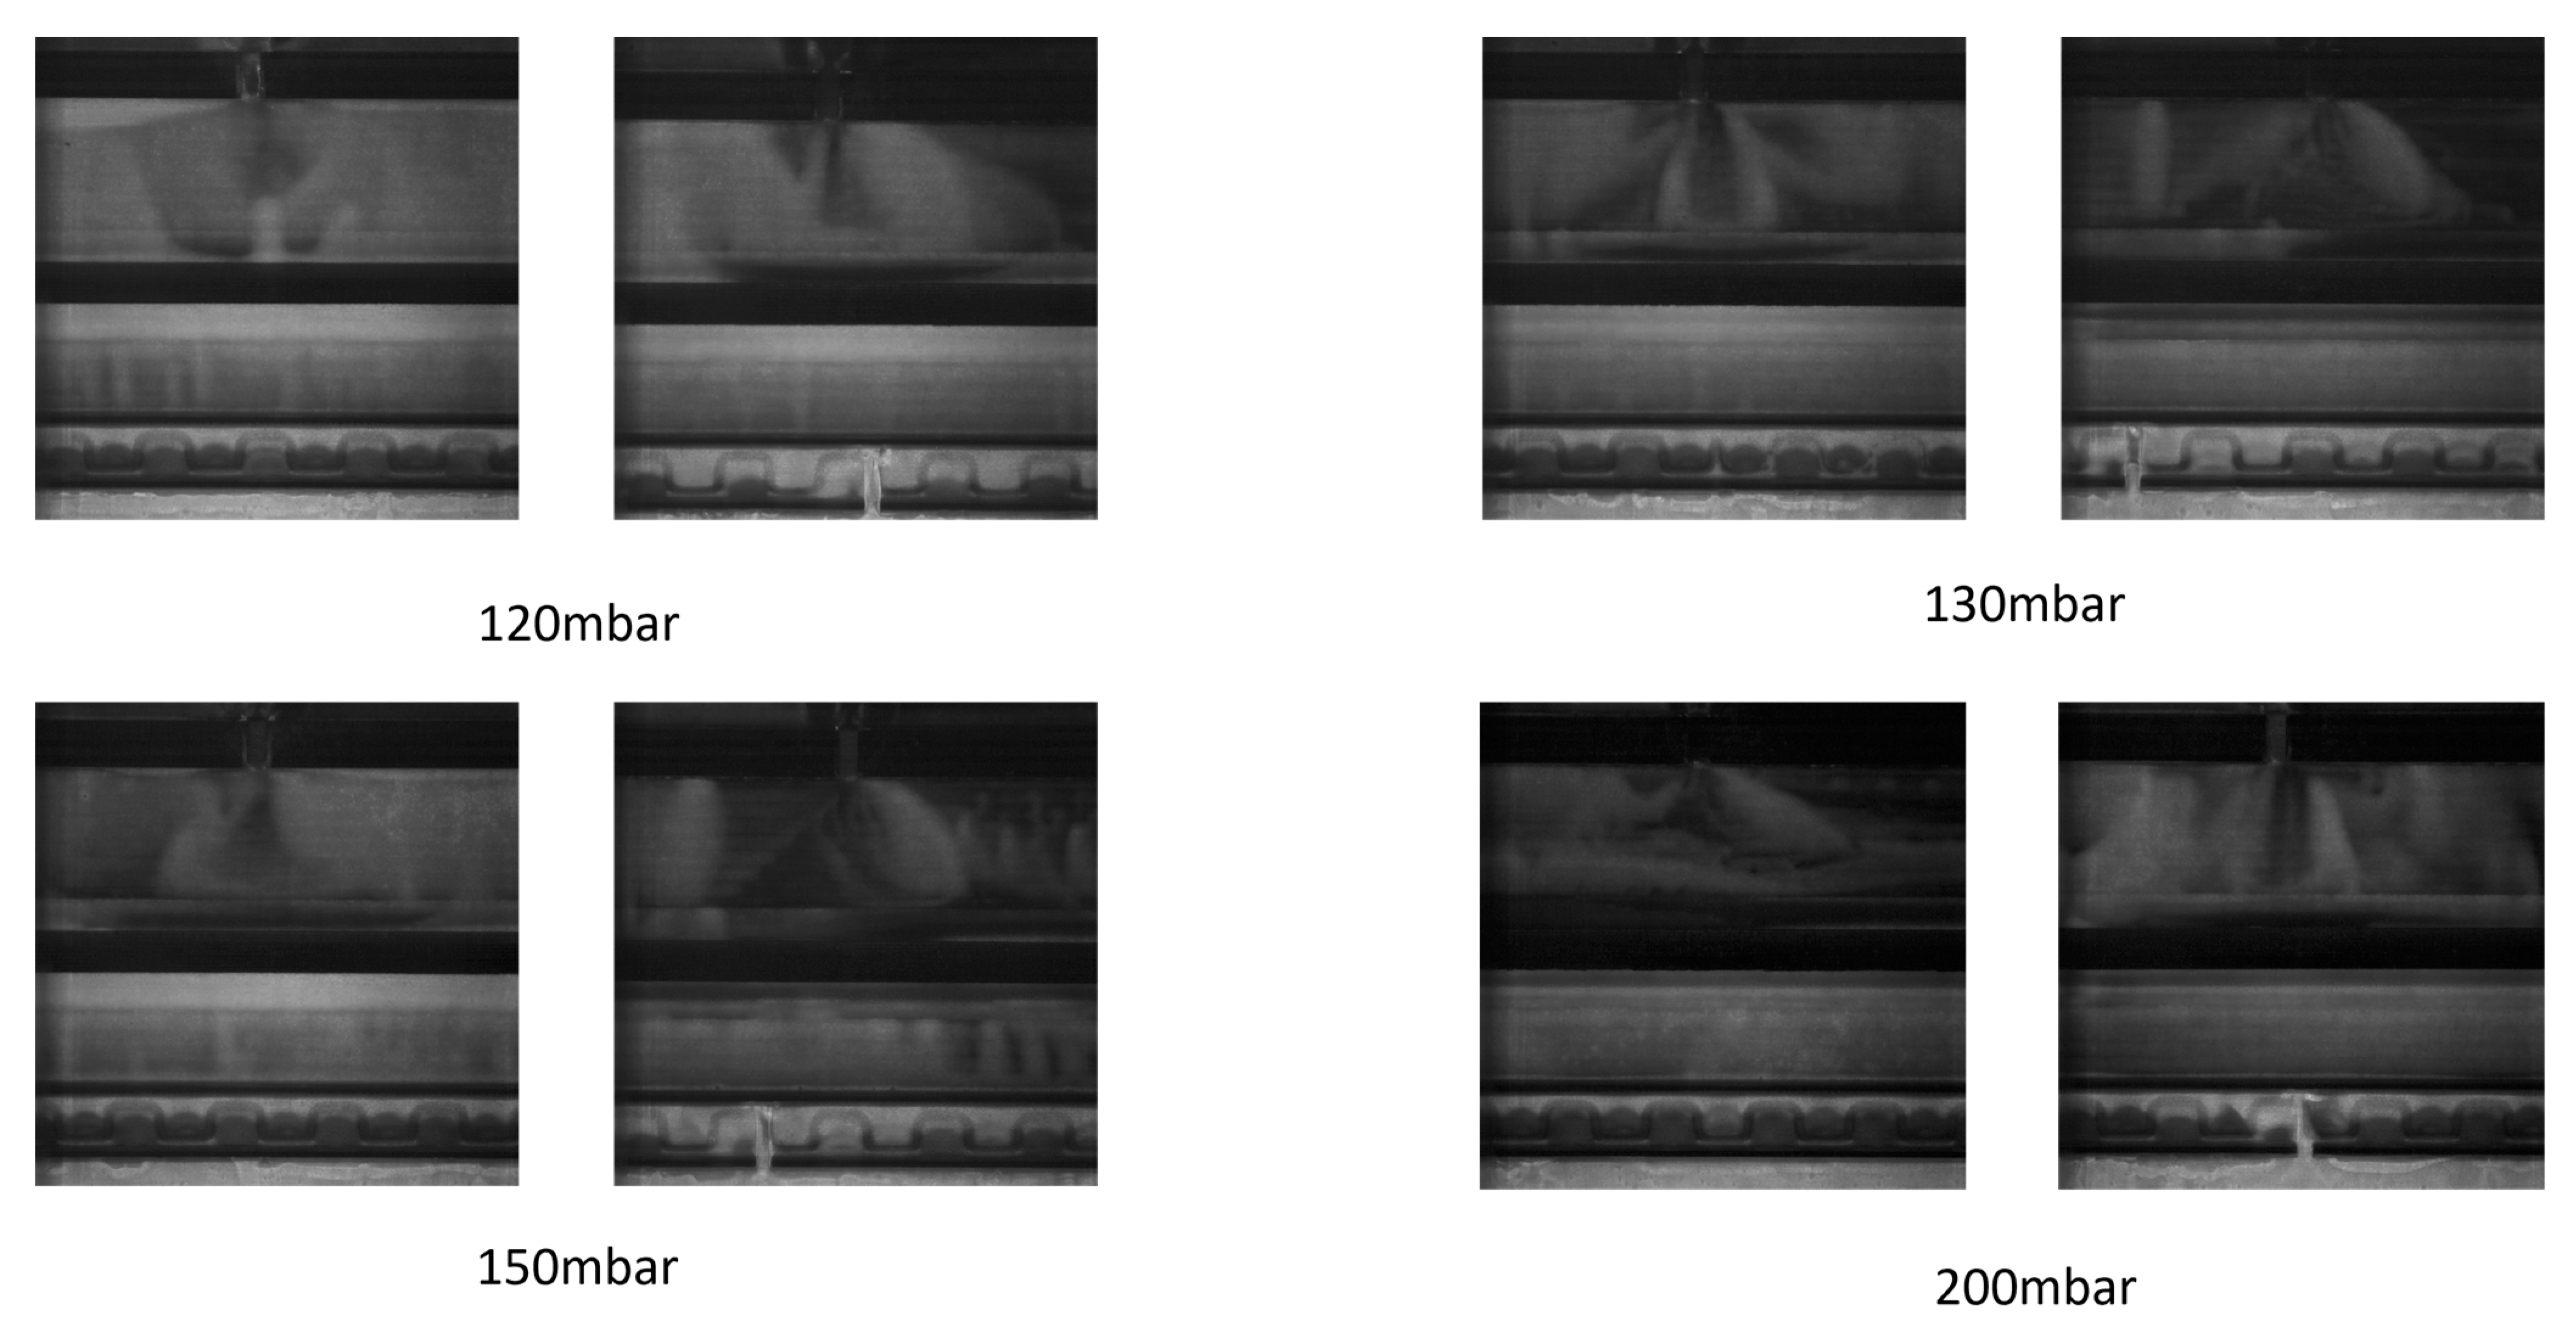
Figure 17.
Two paths for oil to enter OCR groove: (a) oil scraping from the liner; (b) inertia driven oil transport from the skirt.
Figure 17.
Two paths for oil to enter OCR groove: (a) oil scraping from the liner; (b) inertia driven oil transport from the skirt.
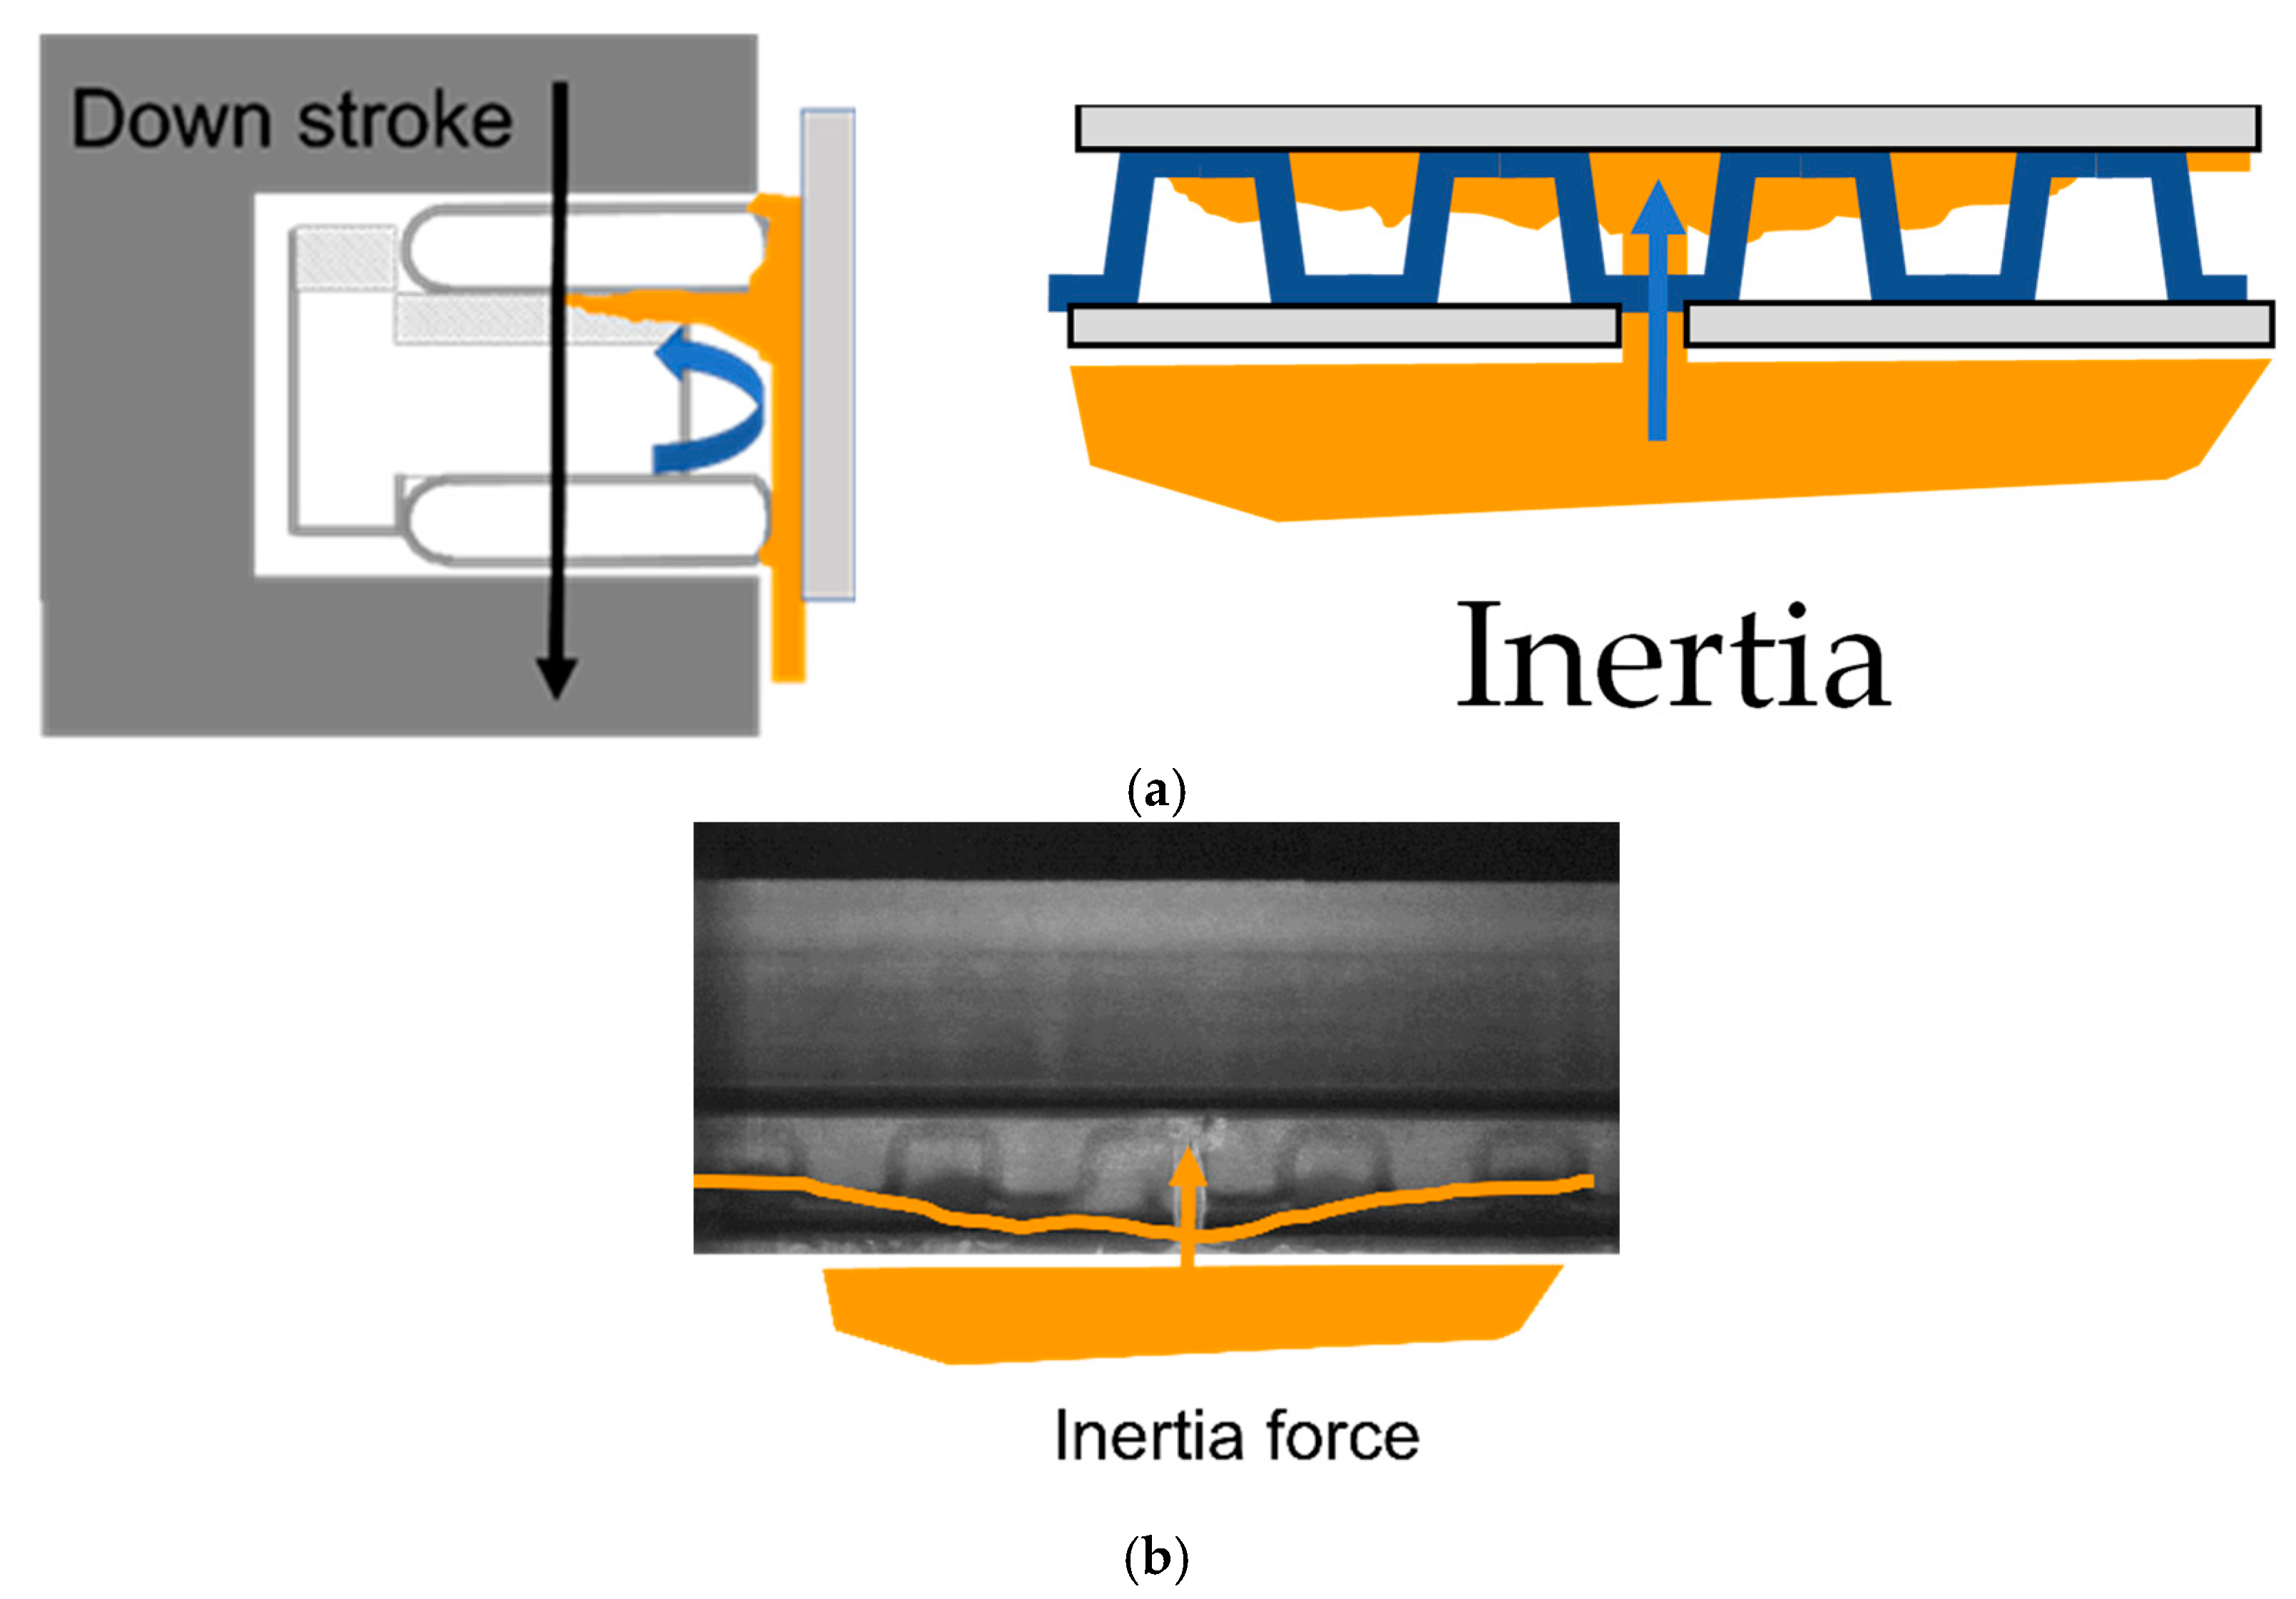
Figure 18.
The upper rail oil leakage.
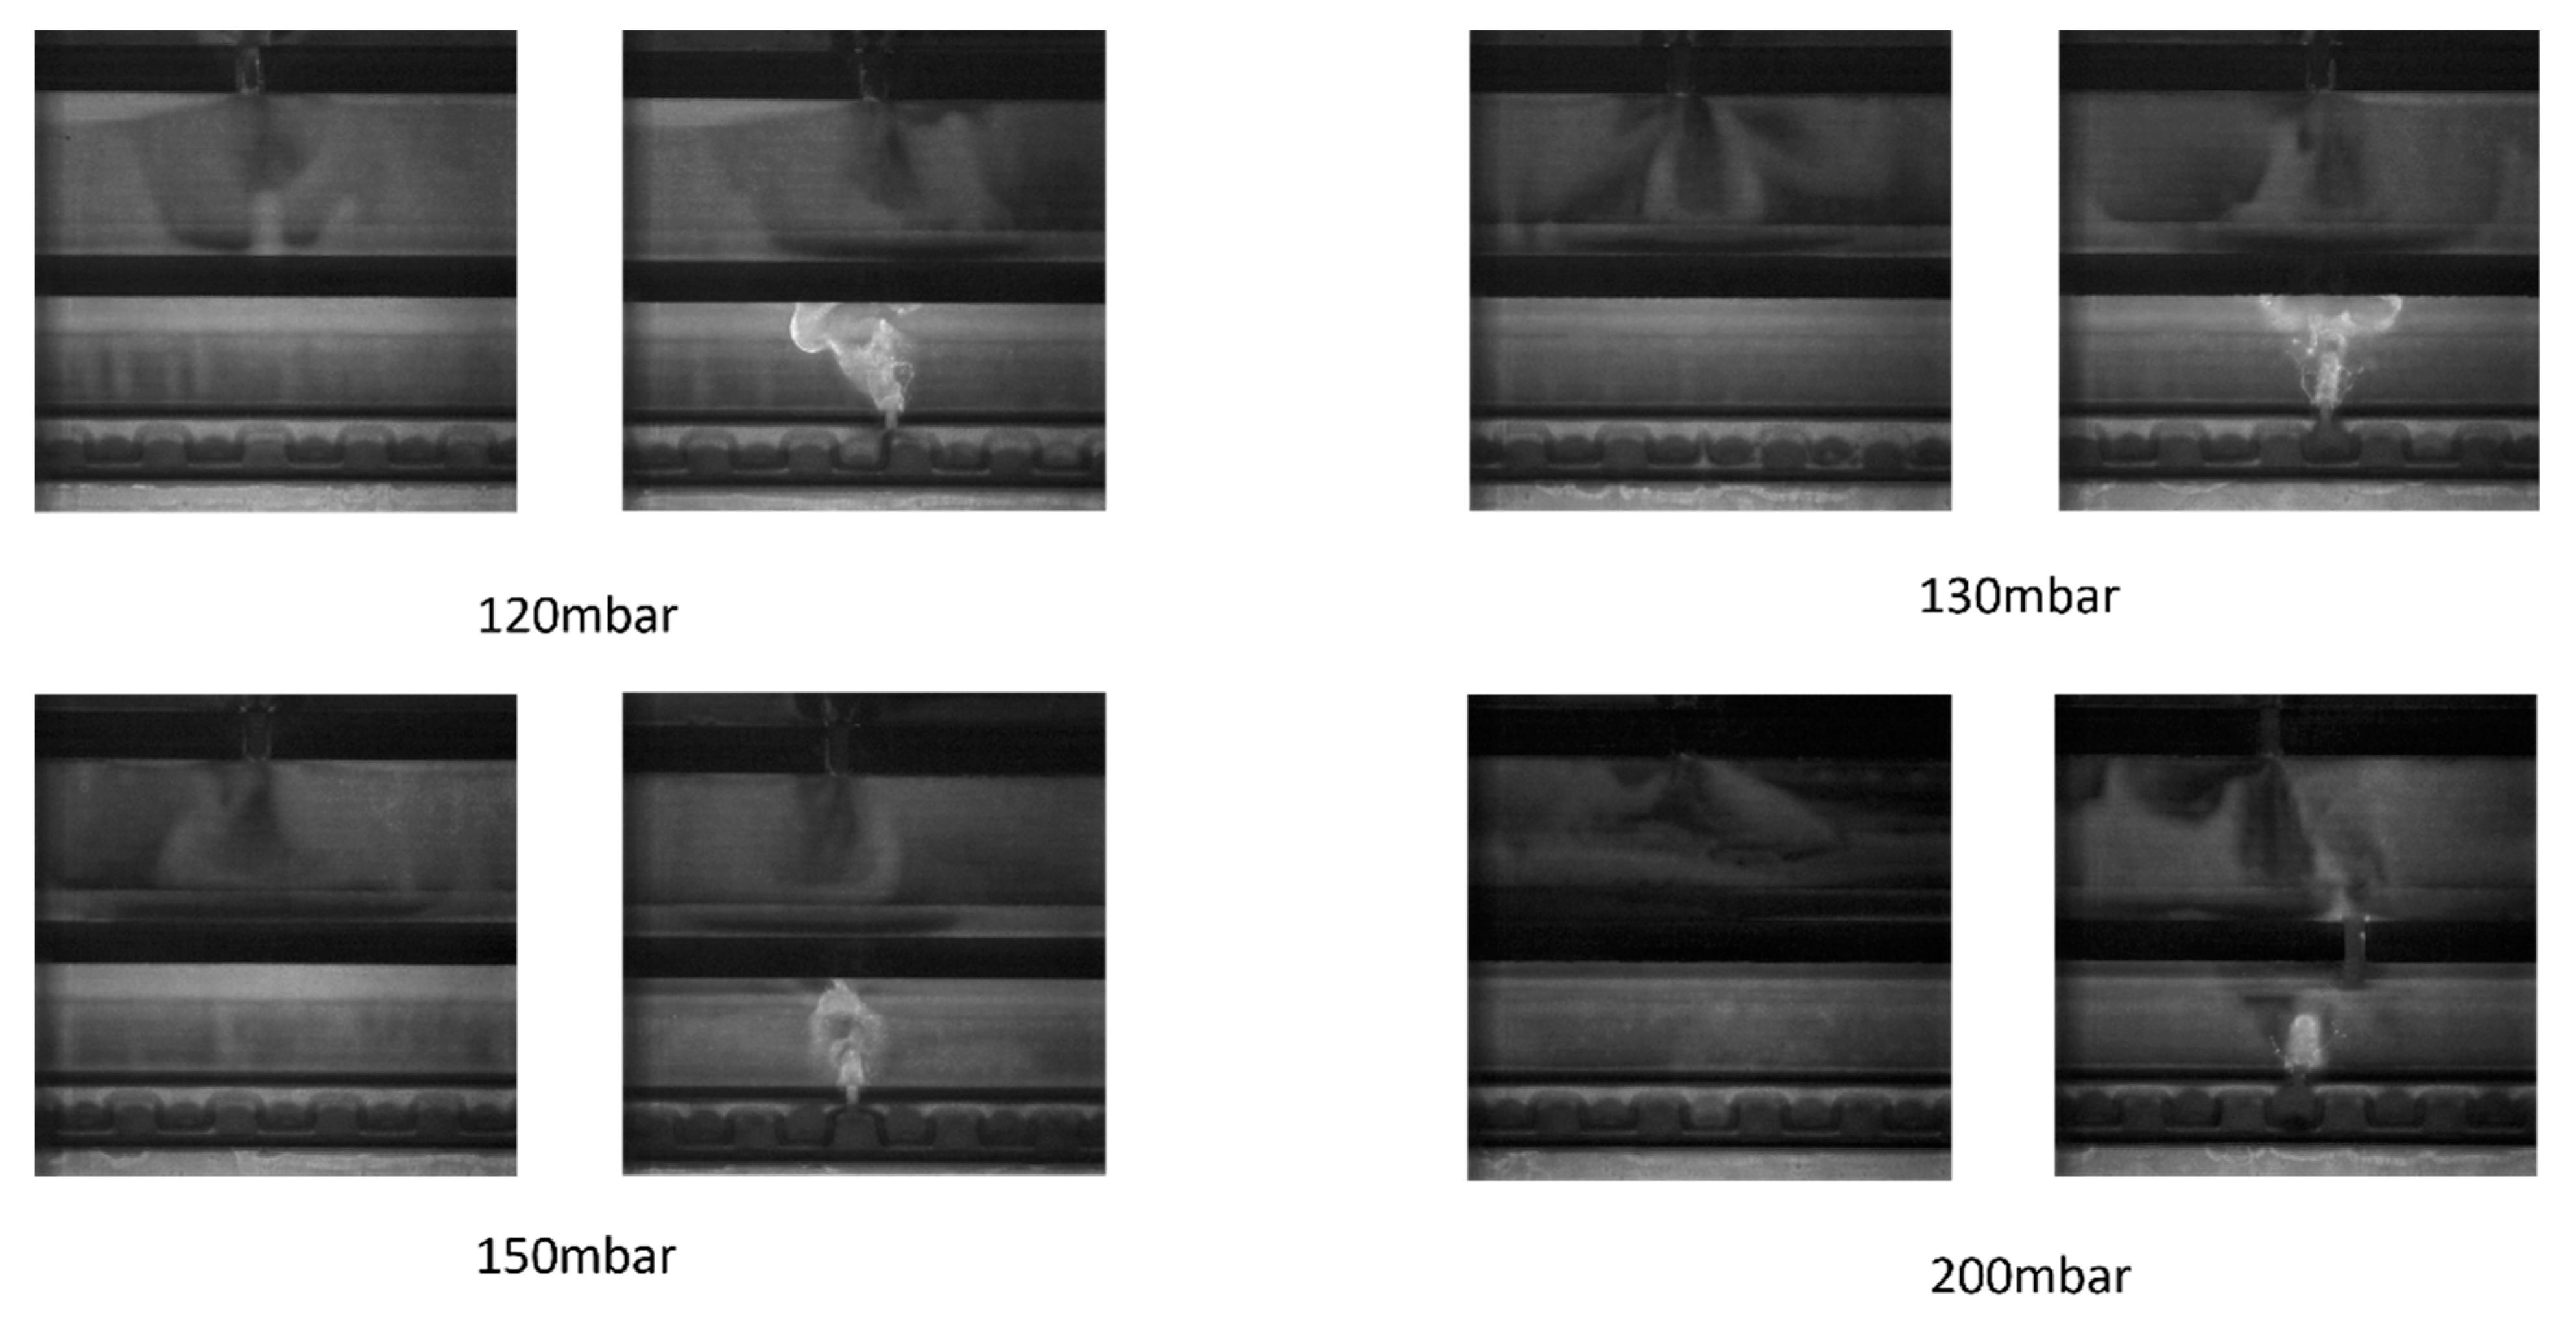
Figure 19.
Third land gas pressure at 2000 RPM.
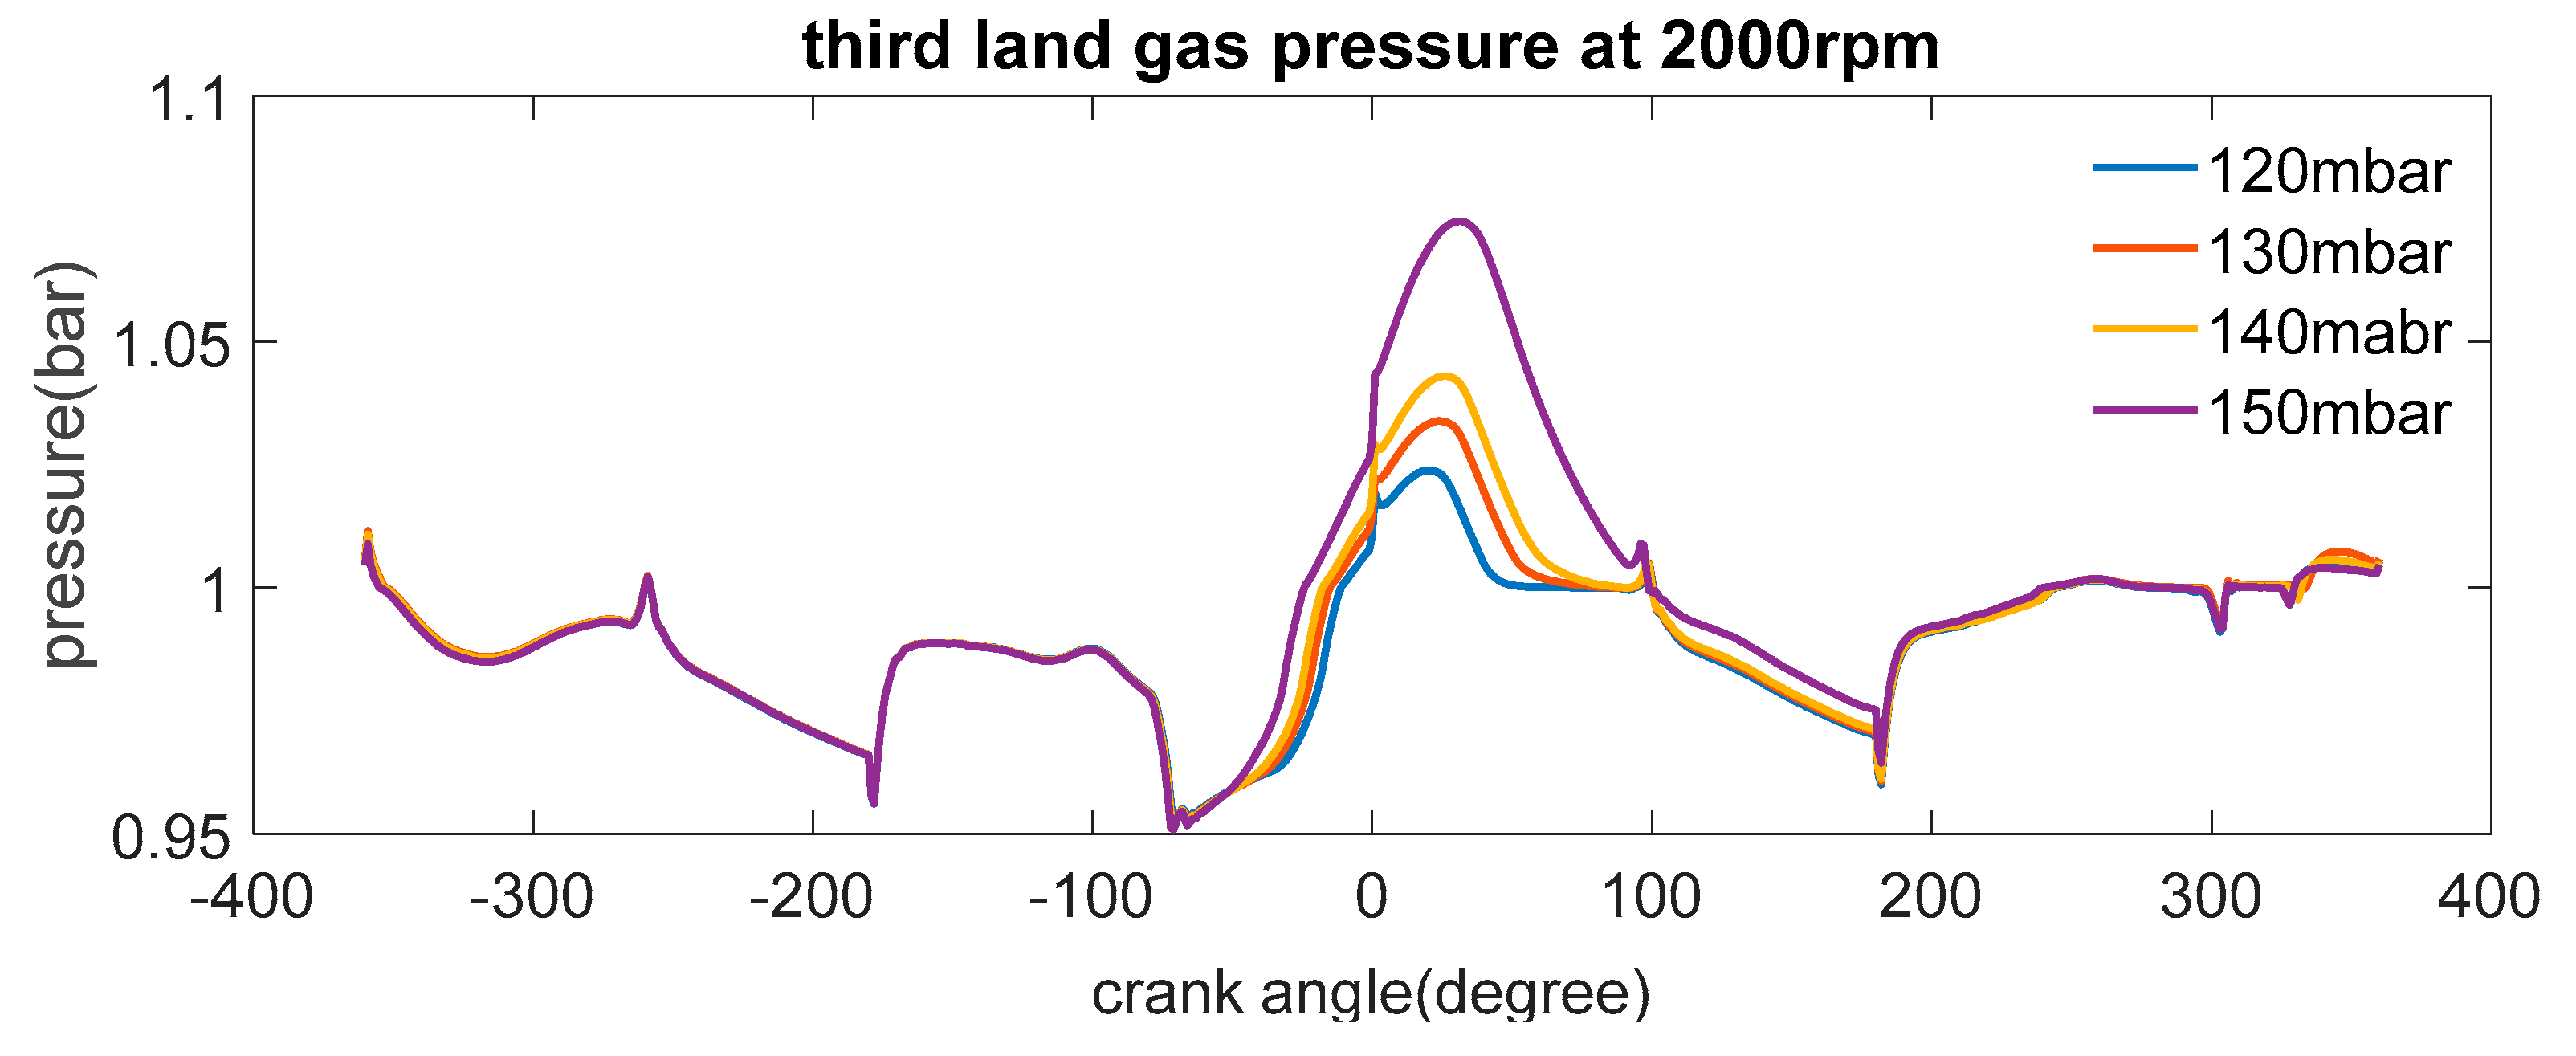
Figure 20.
Different ring gap distances.
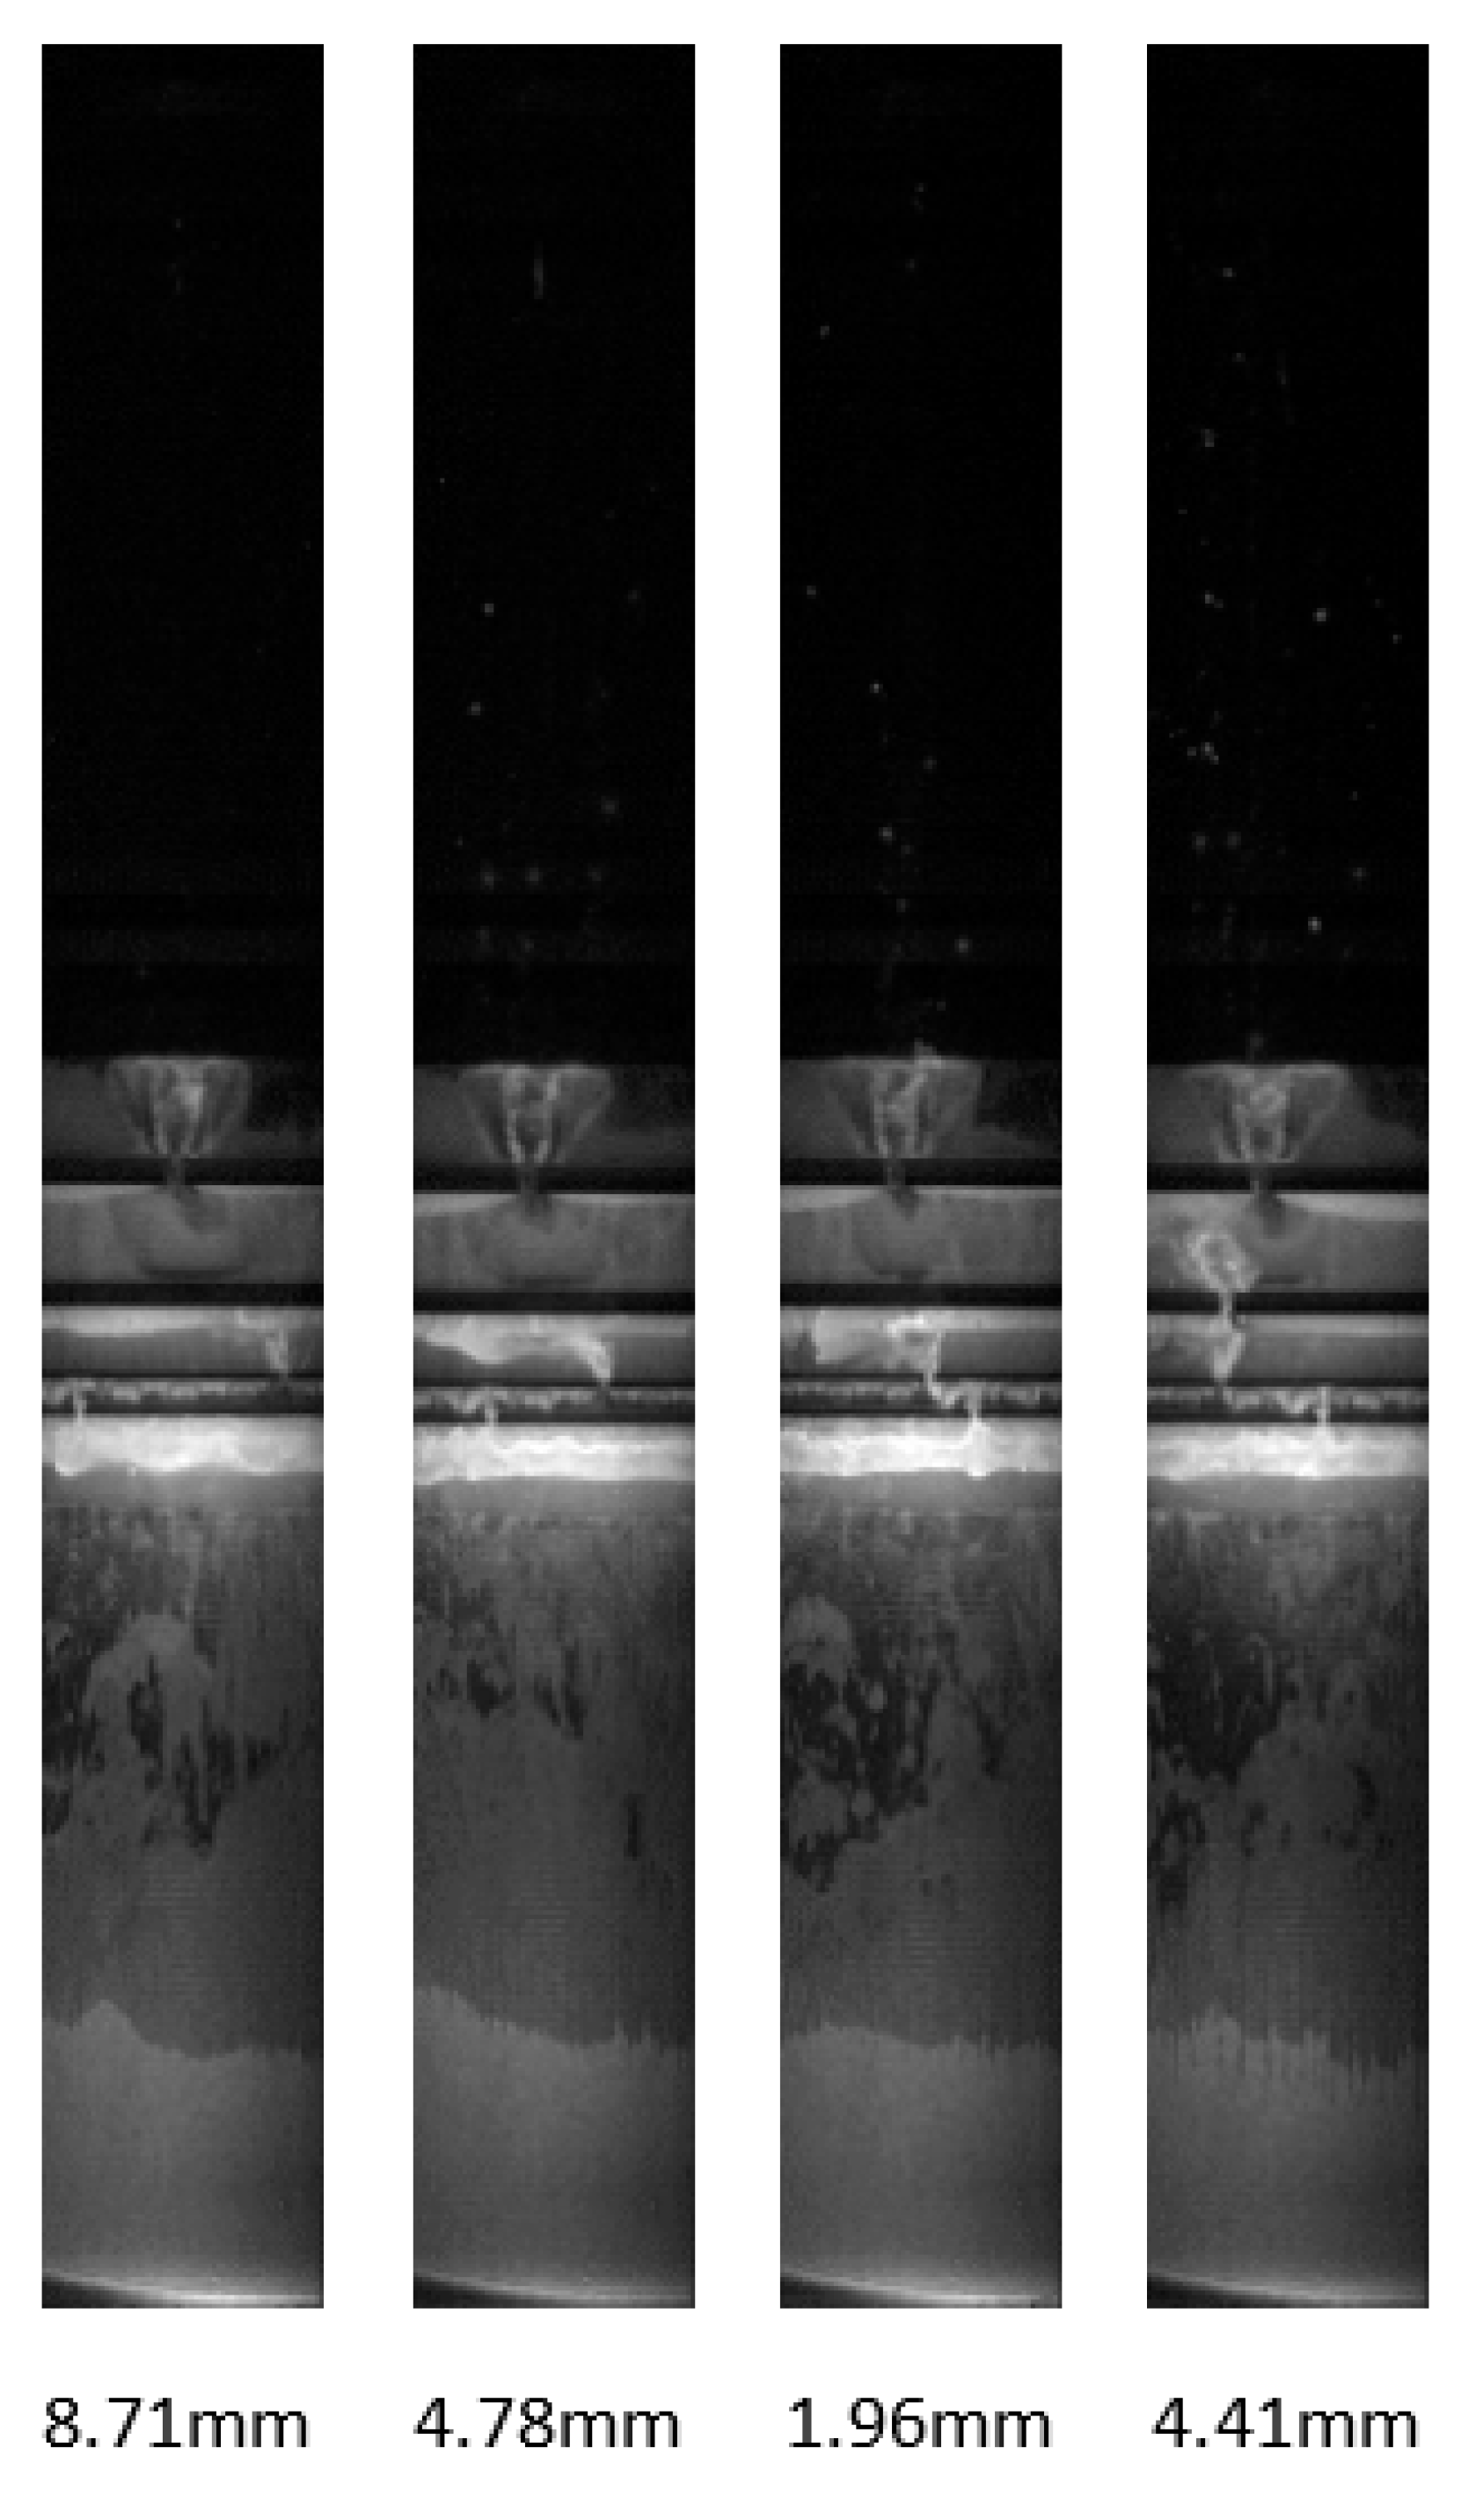
Figure 21.
The effects of engine speed at the blowby separation line (150 mbar).
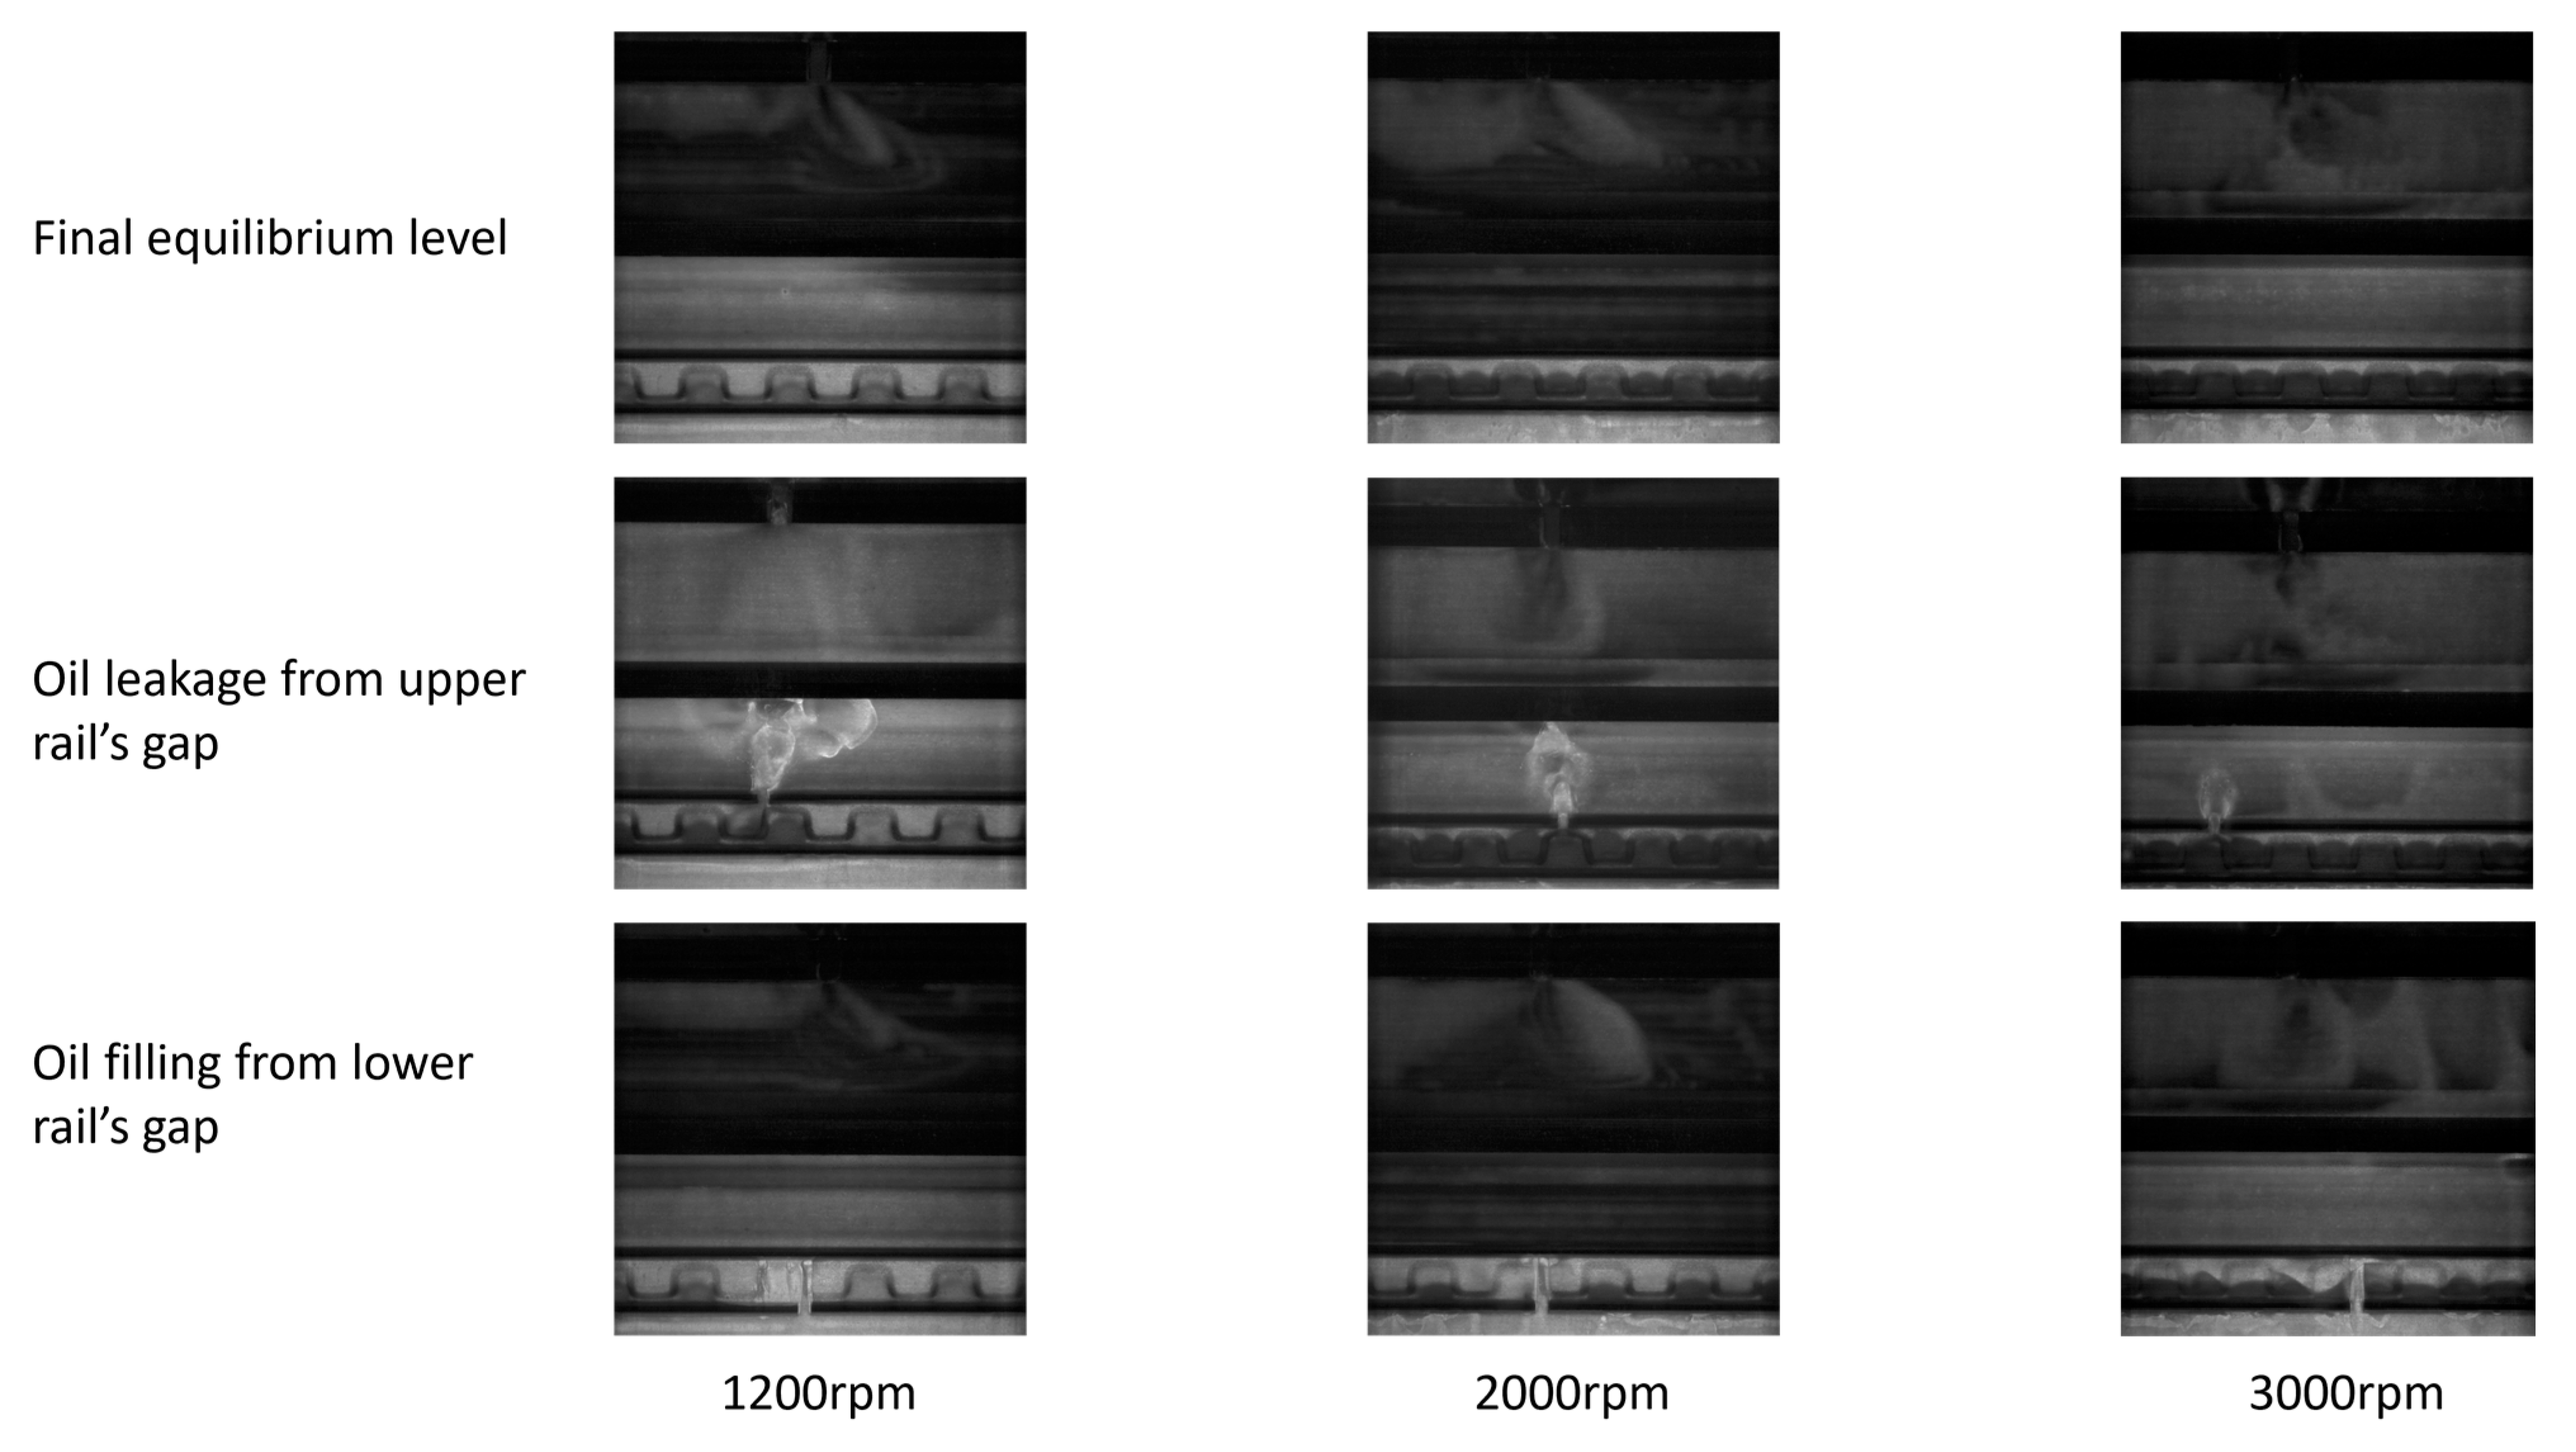
Figure 22.
Chamfers at the second ring.

Figure 23.
An oil reservoir for the pumping model.
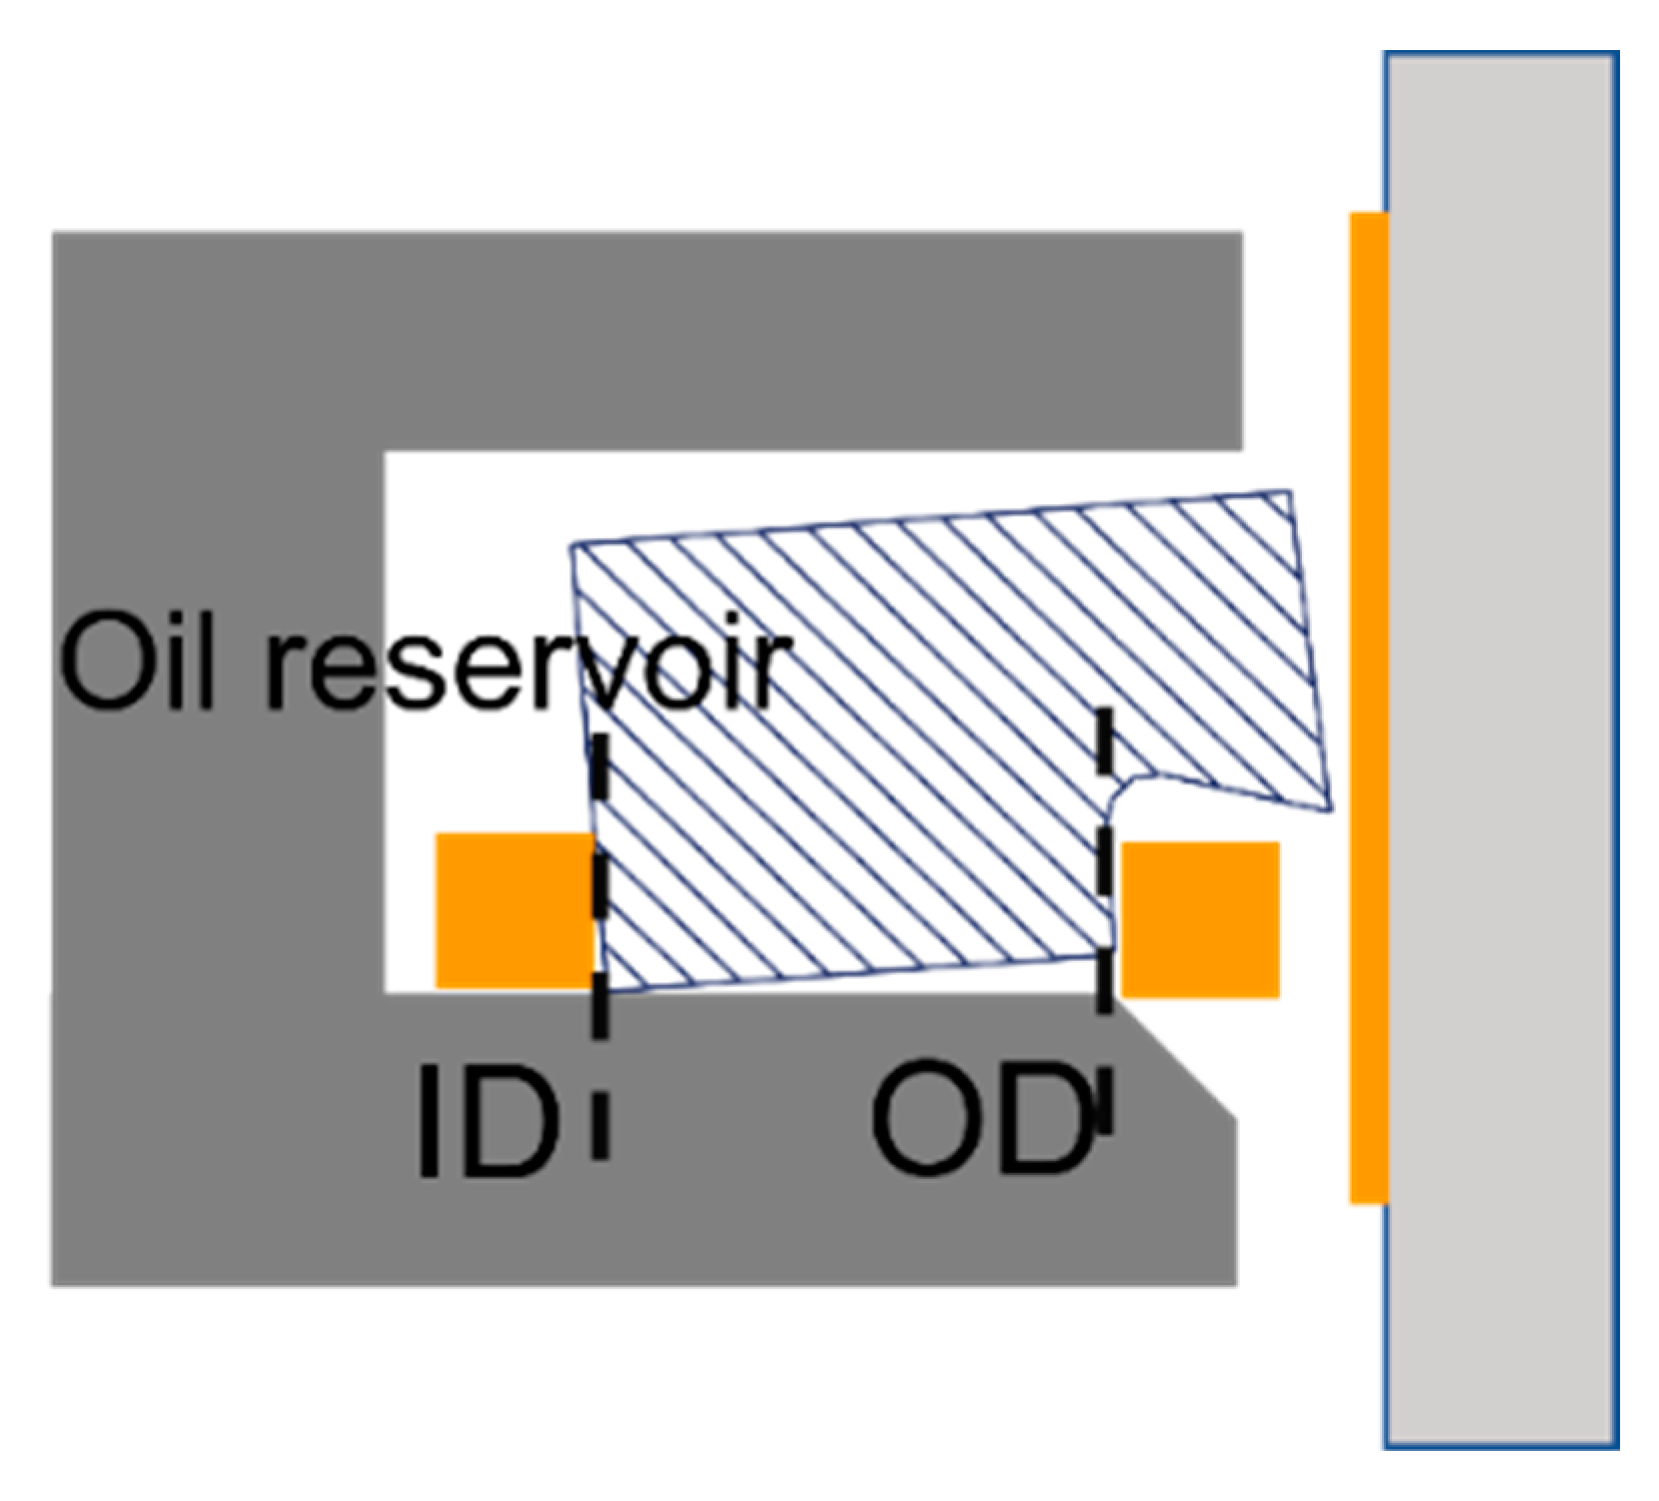
Figure 24.
The oil pumping flow rate at different supplies.
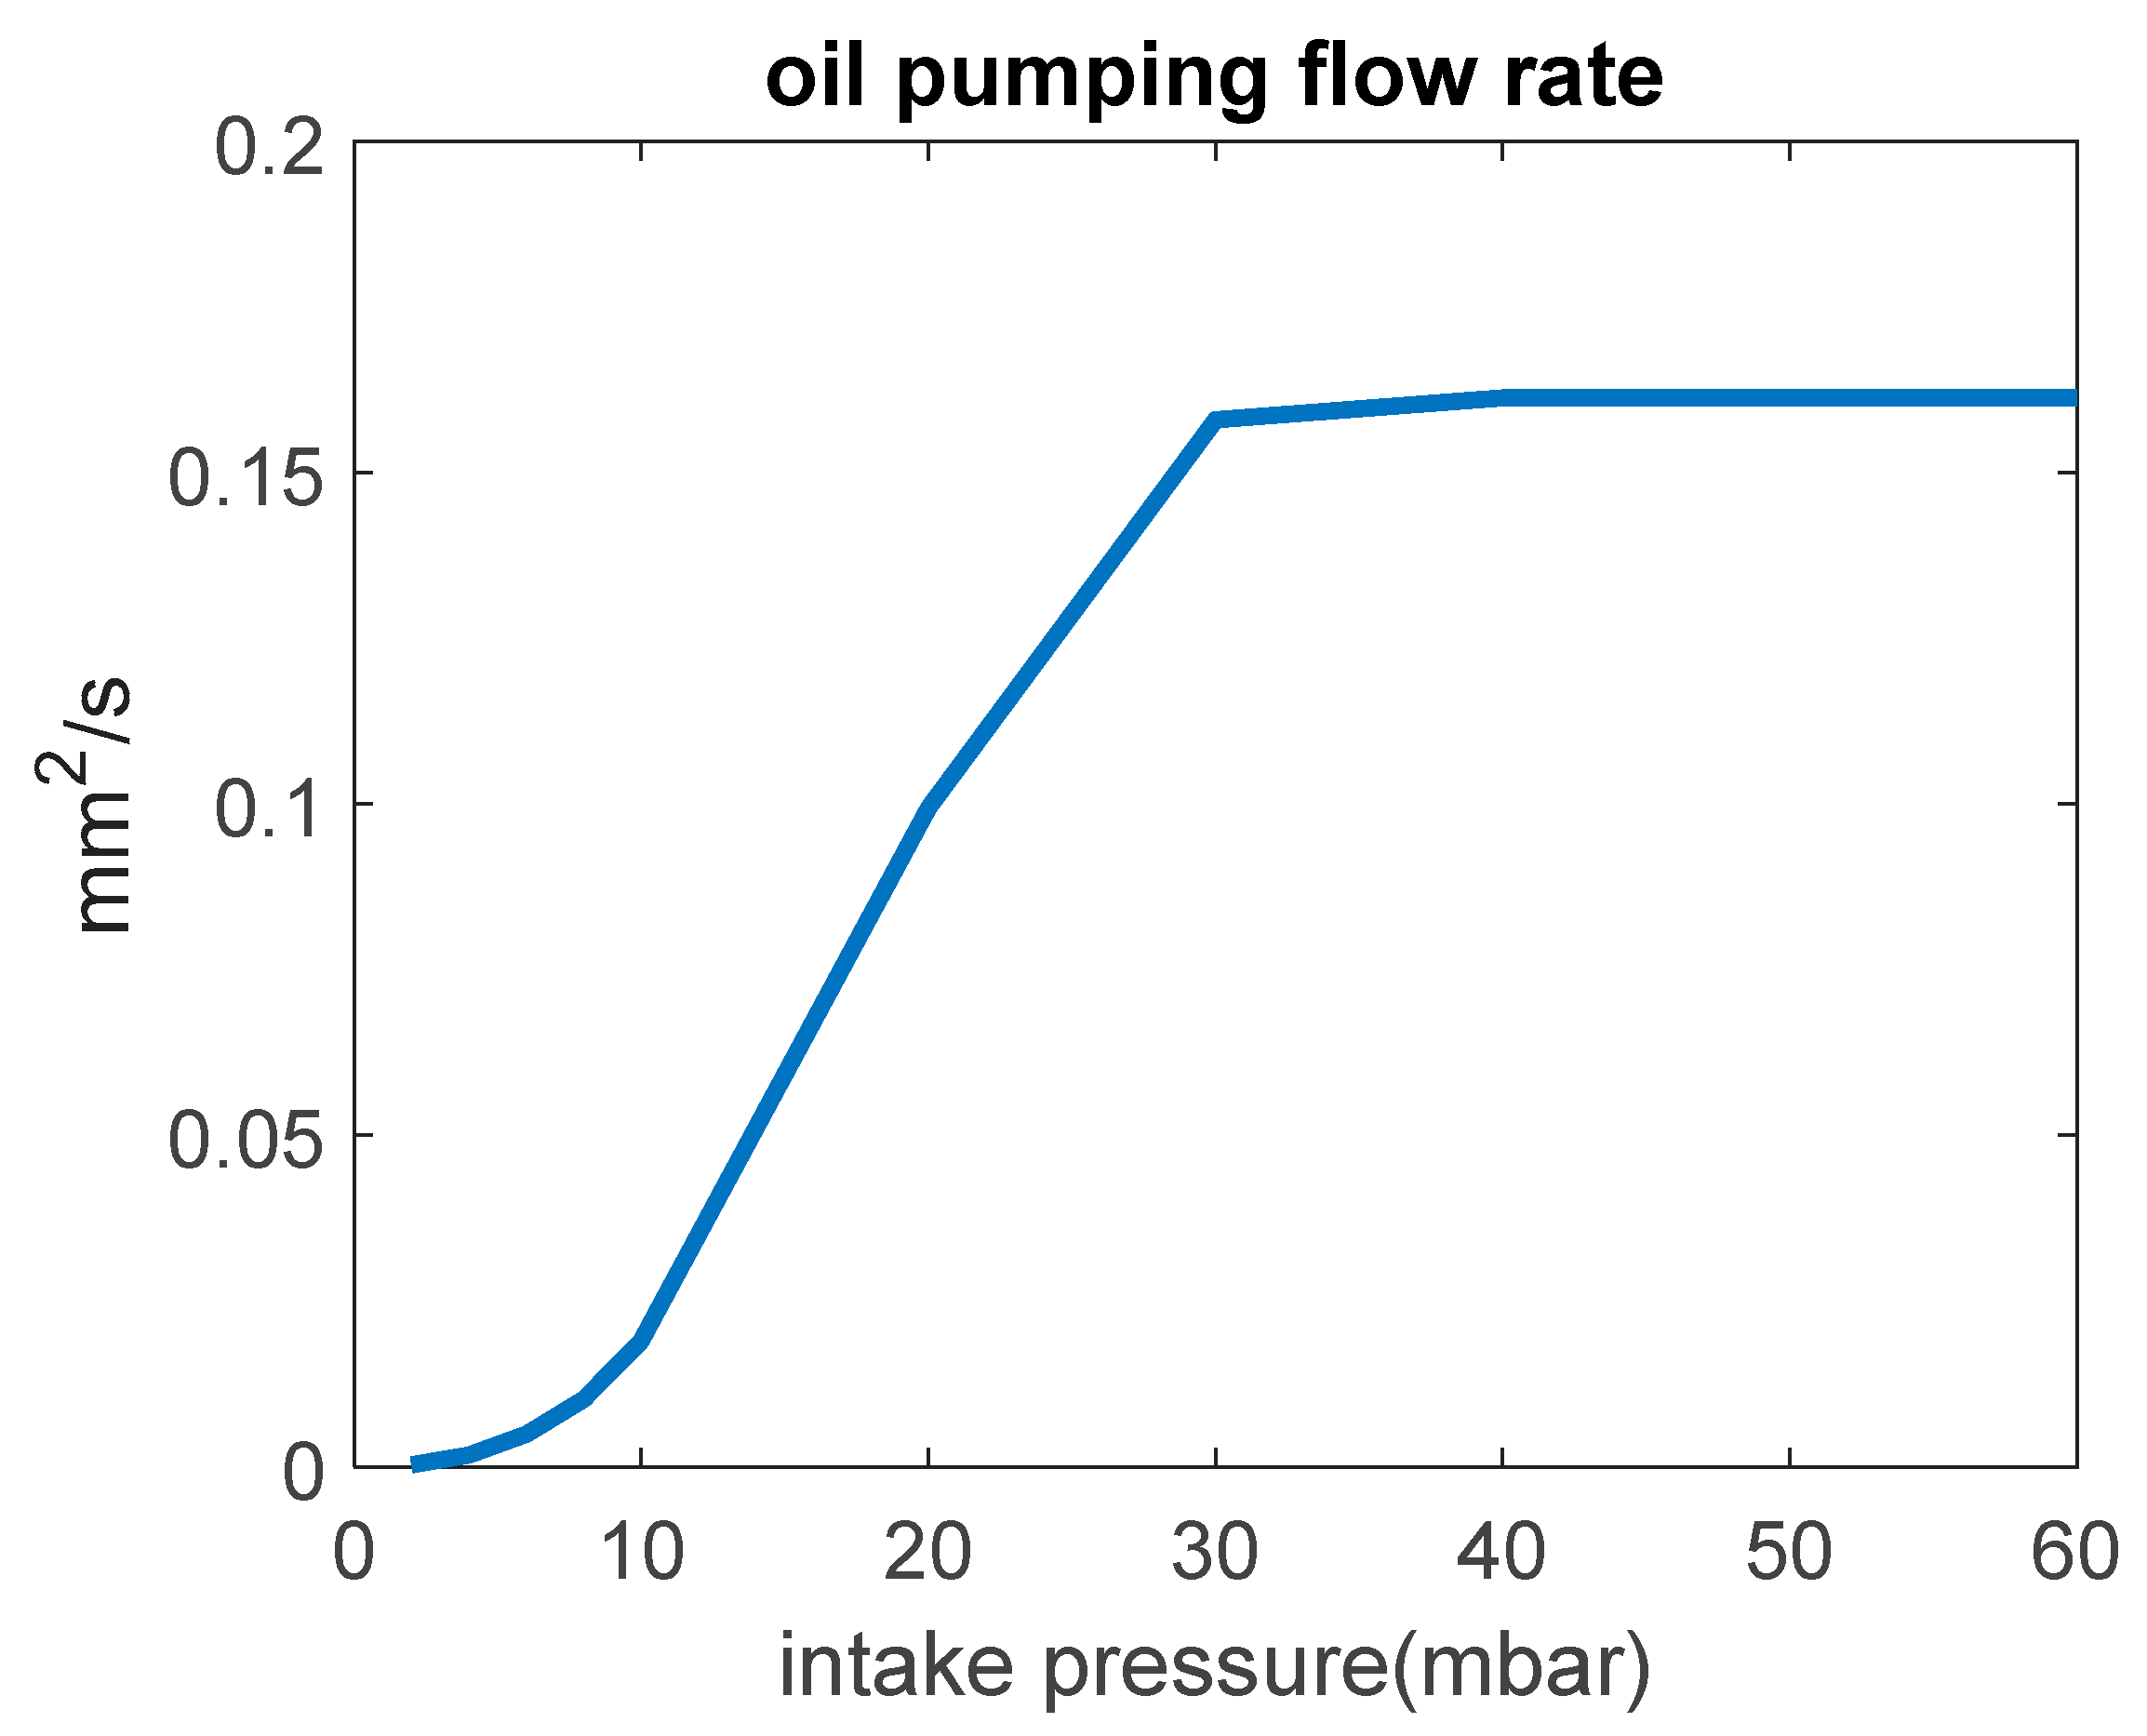
Figure 25.
The second ring pumping flow rate: (a) second ring oil pumping flow rate’s change with speed and load; (b) calculated time for oil pumping to fill the second ring groove.
Figure 25.
The second ring pumping flow rate: (a) second ring oil pumping flow rate’s change with speed and load; (b) calculated time for oil pumping to fill the second ring groove.
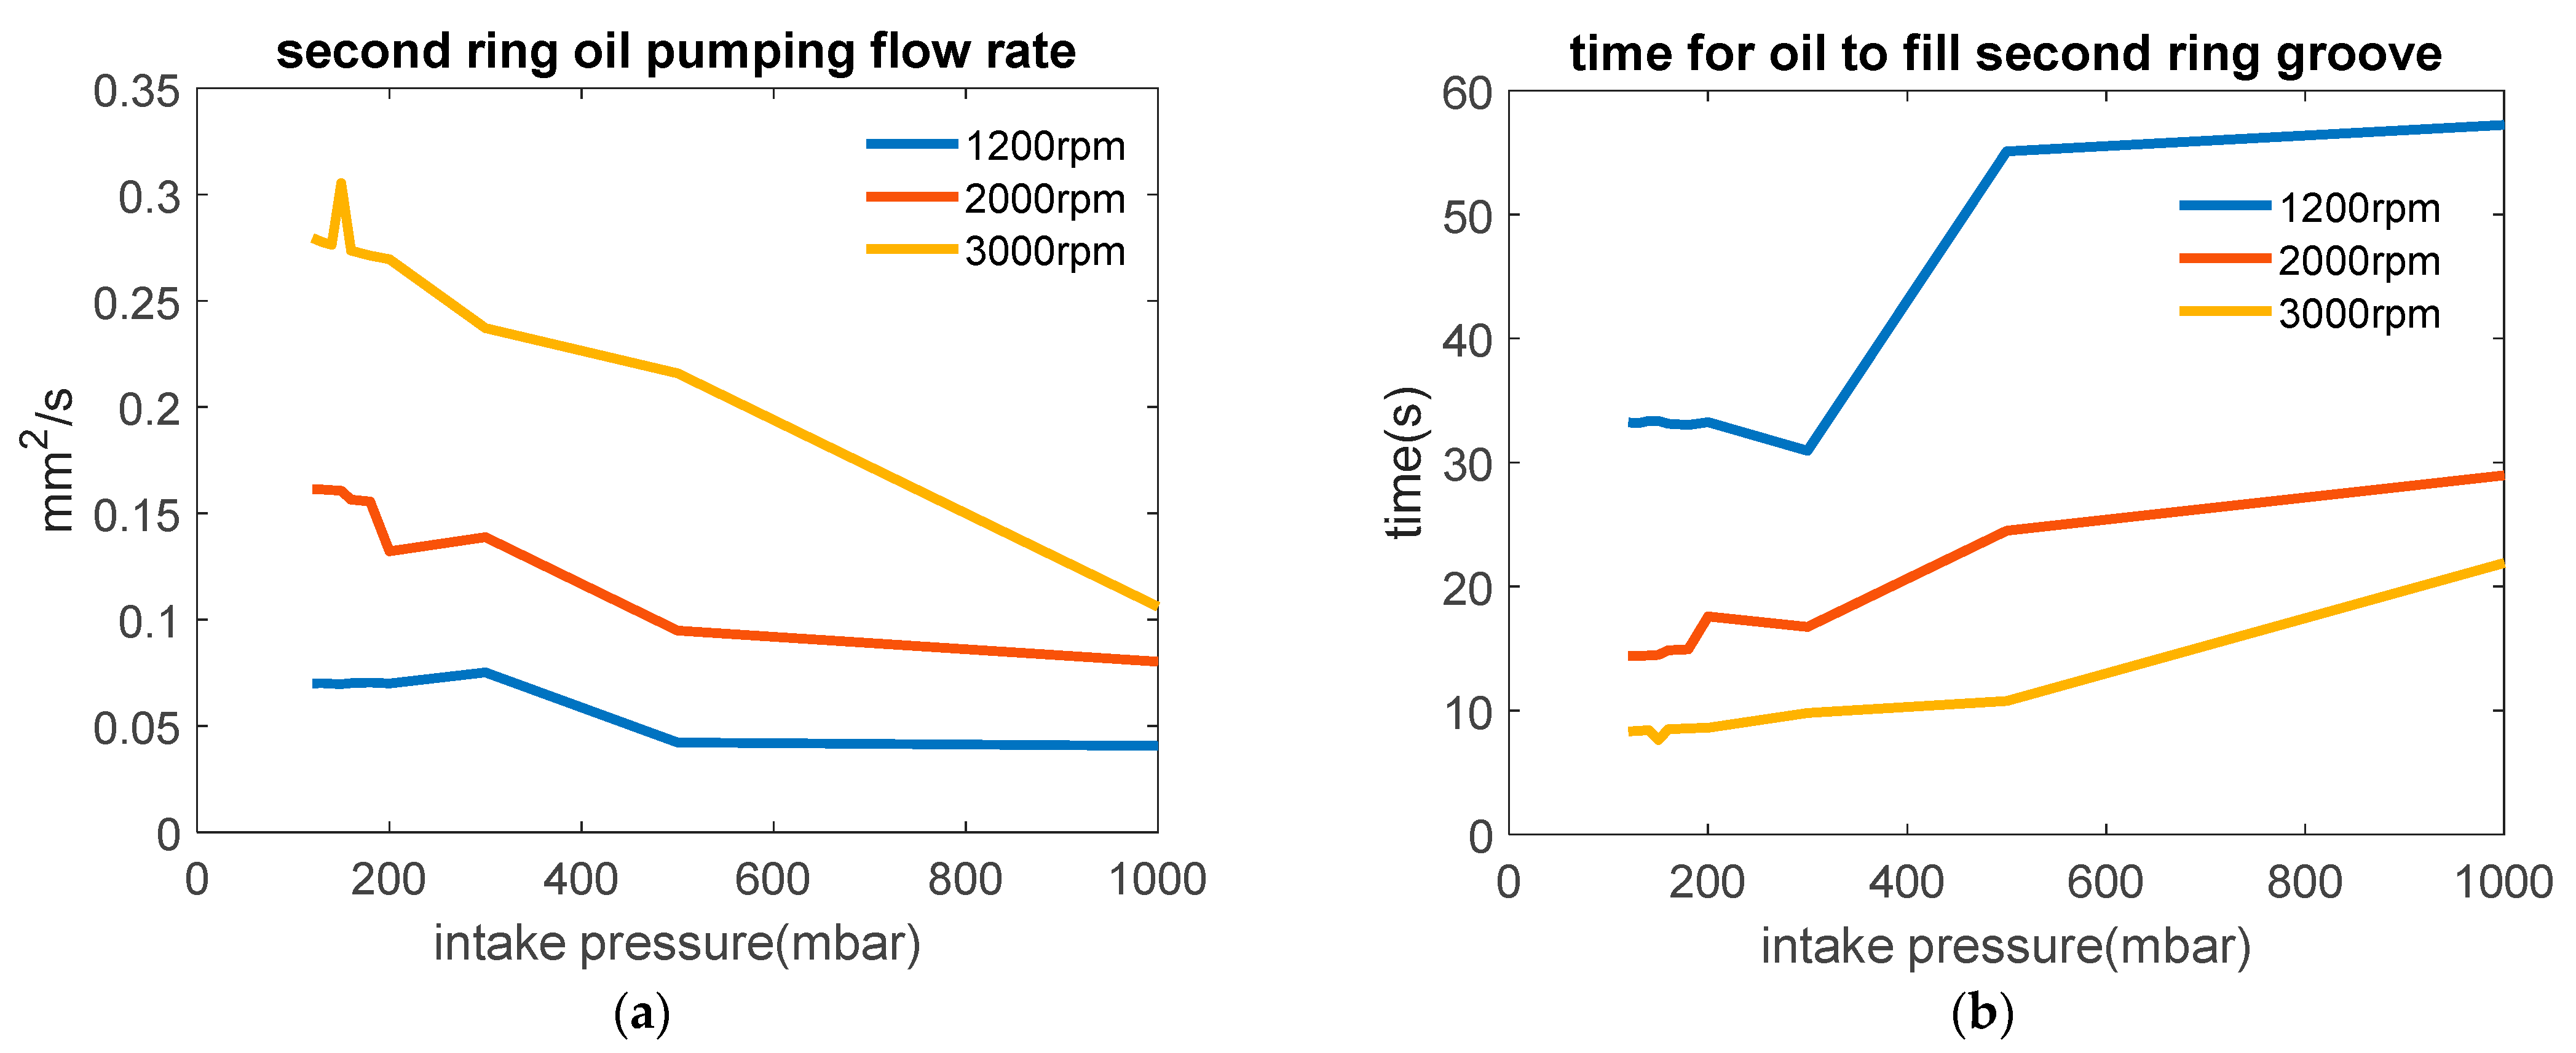
Figure 26.
The oil pumping flow direction at 2000 RPM for the second ring.
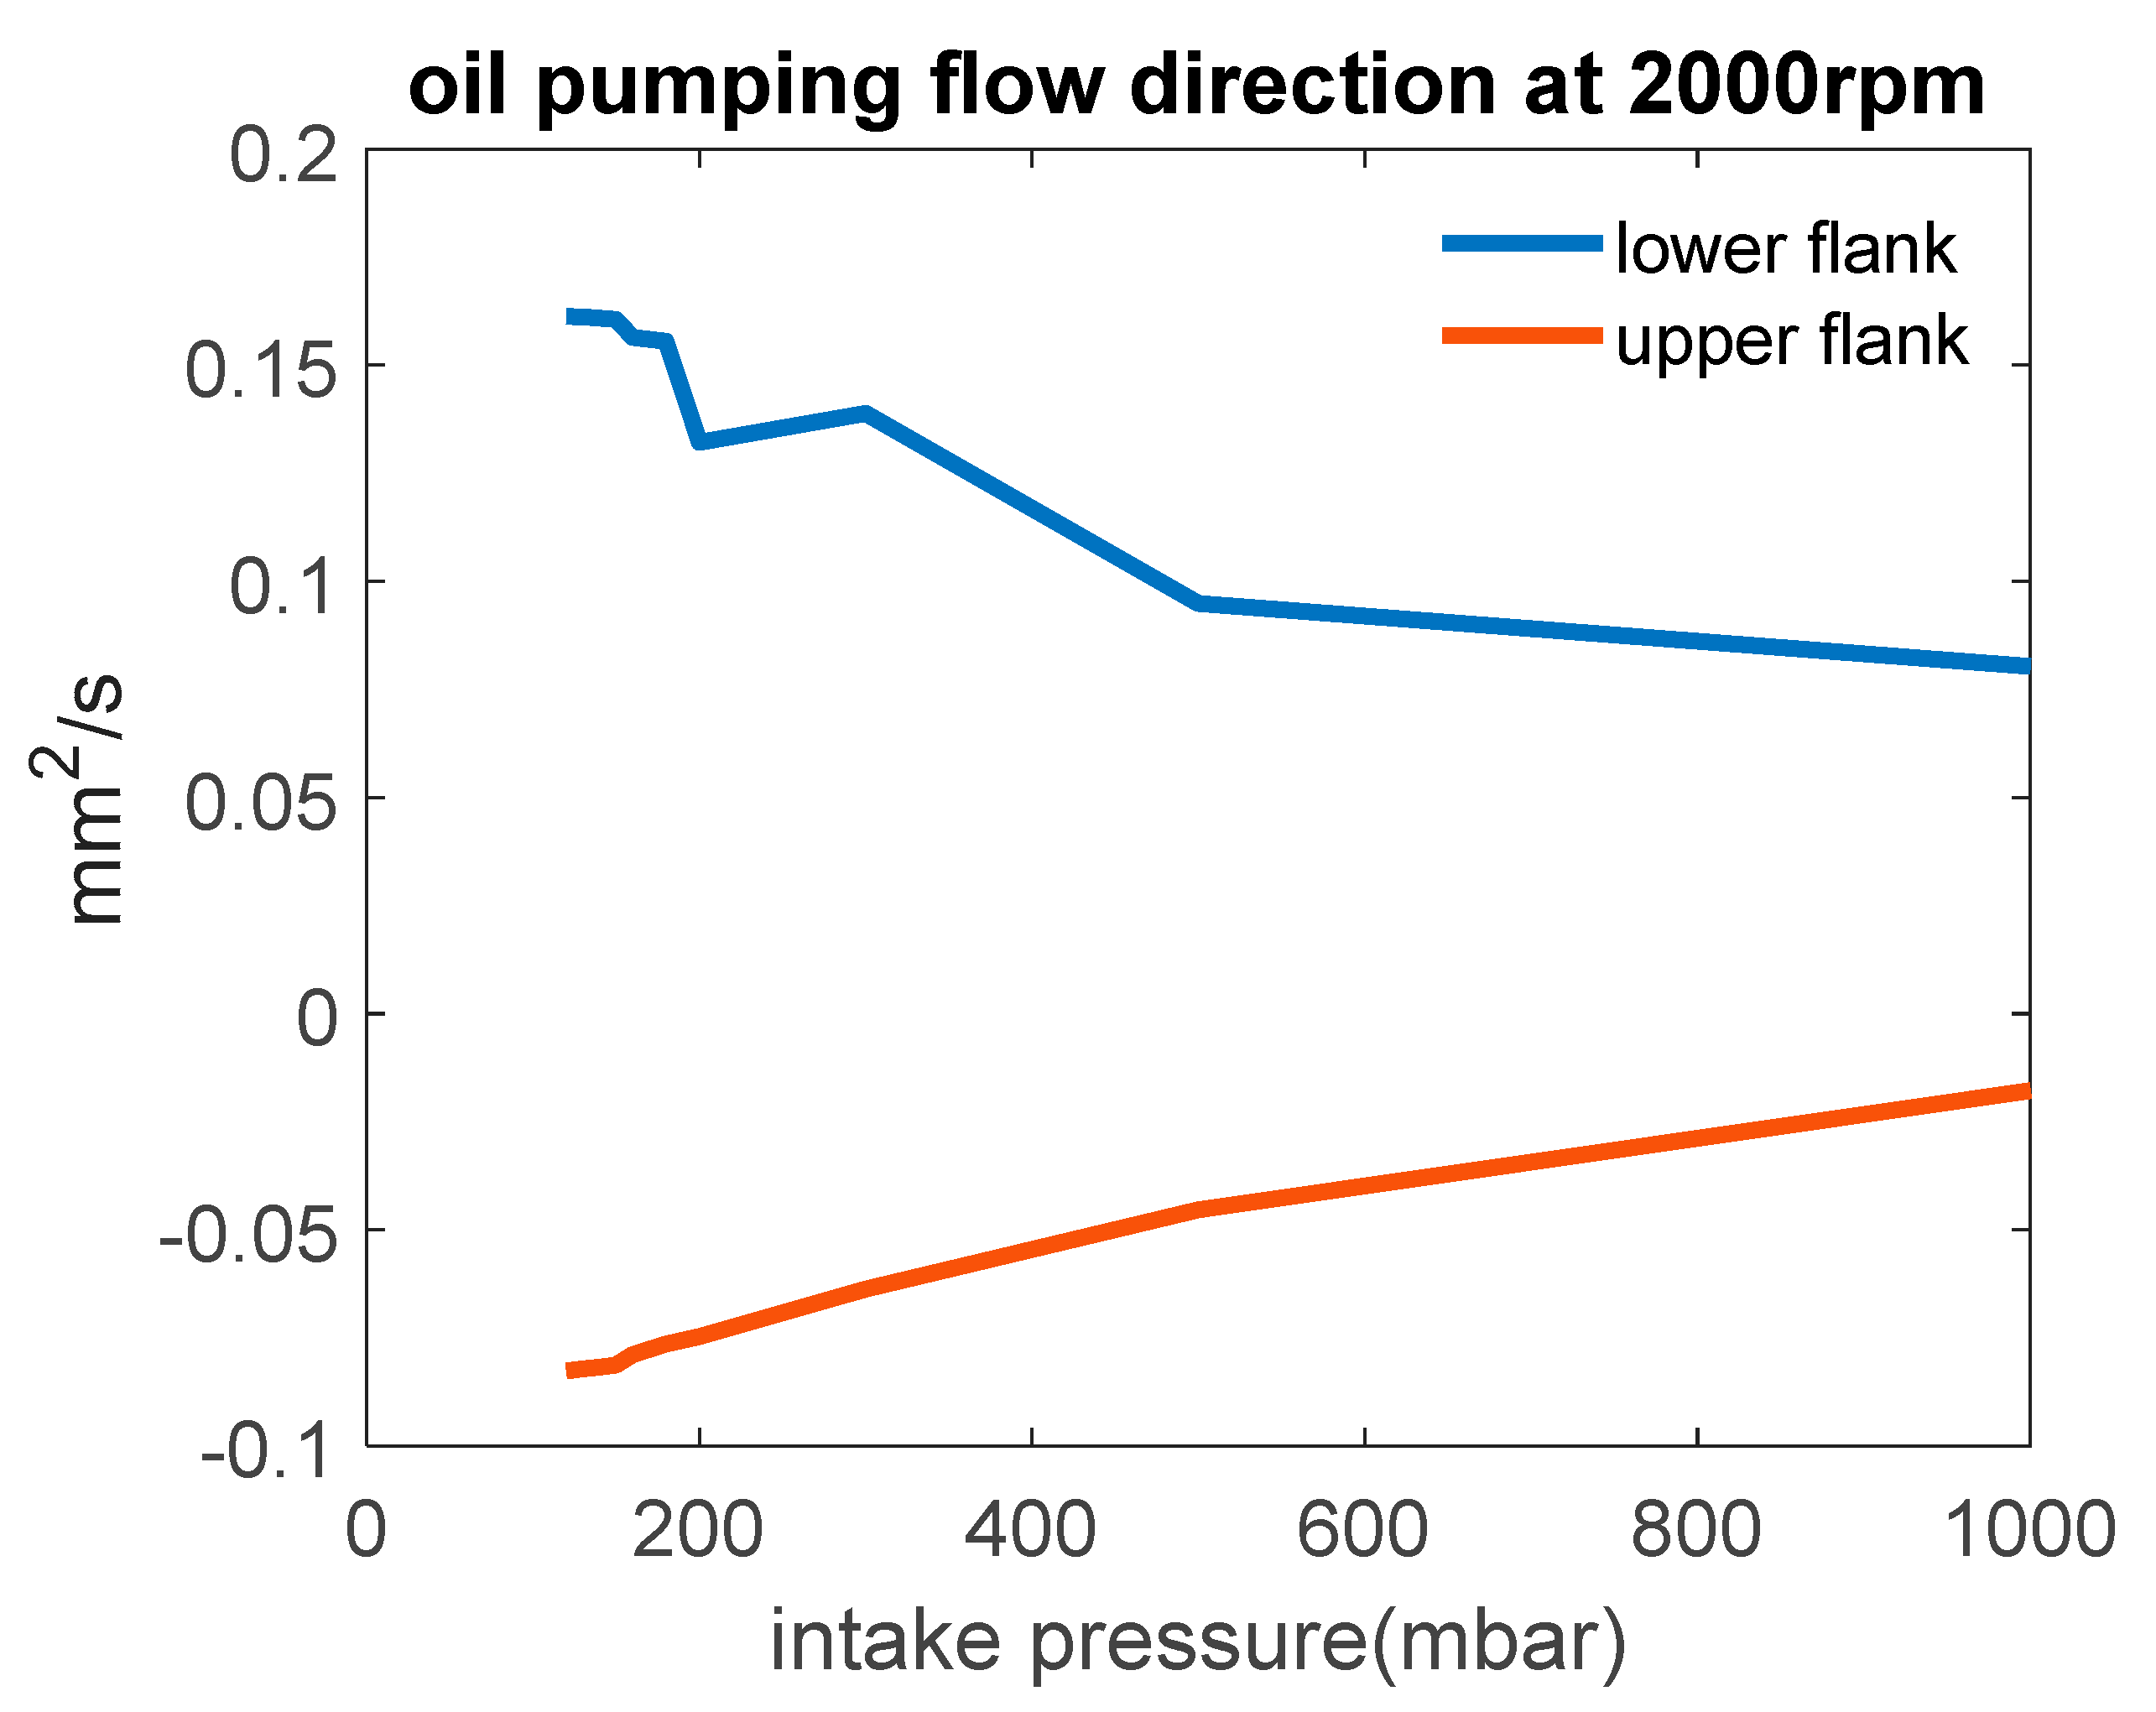
Figure 27.
The top ring oil pumping flow rate: (a) top ring oil pumping flow rate’s change with speed and load; (b) calculated time for oil pumping to fill the top ring groove.
Figure 27.
The top ring oil pumping flow rate: (a) top ring oil pumping flow rate’s change with speed and load; (b) calculated time for oil pumping to fill the top ring groove.
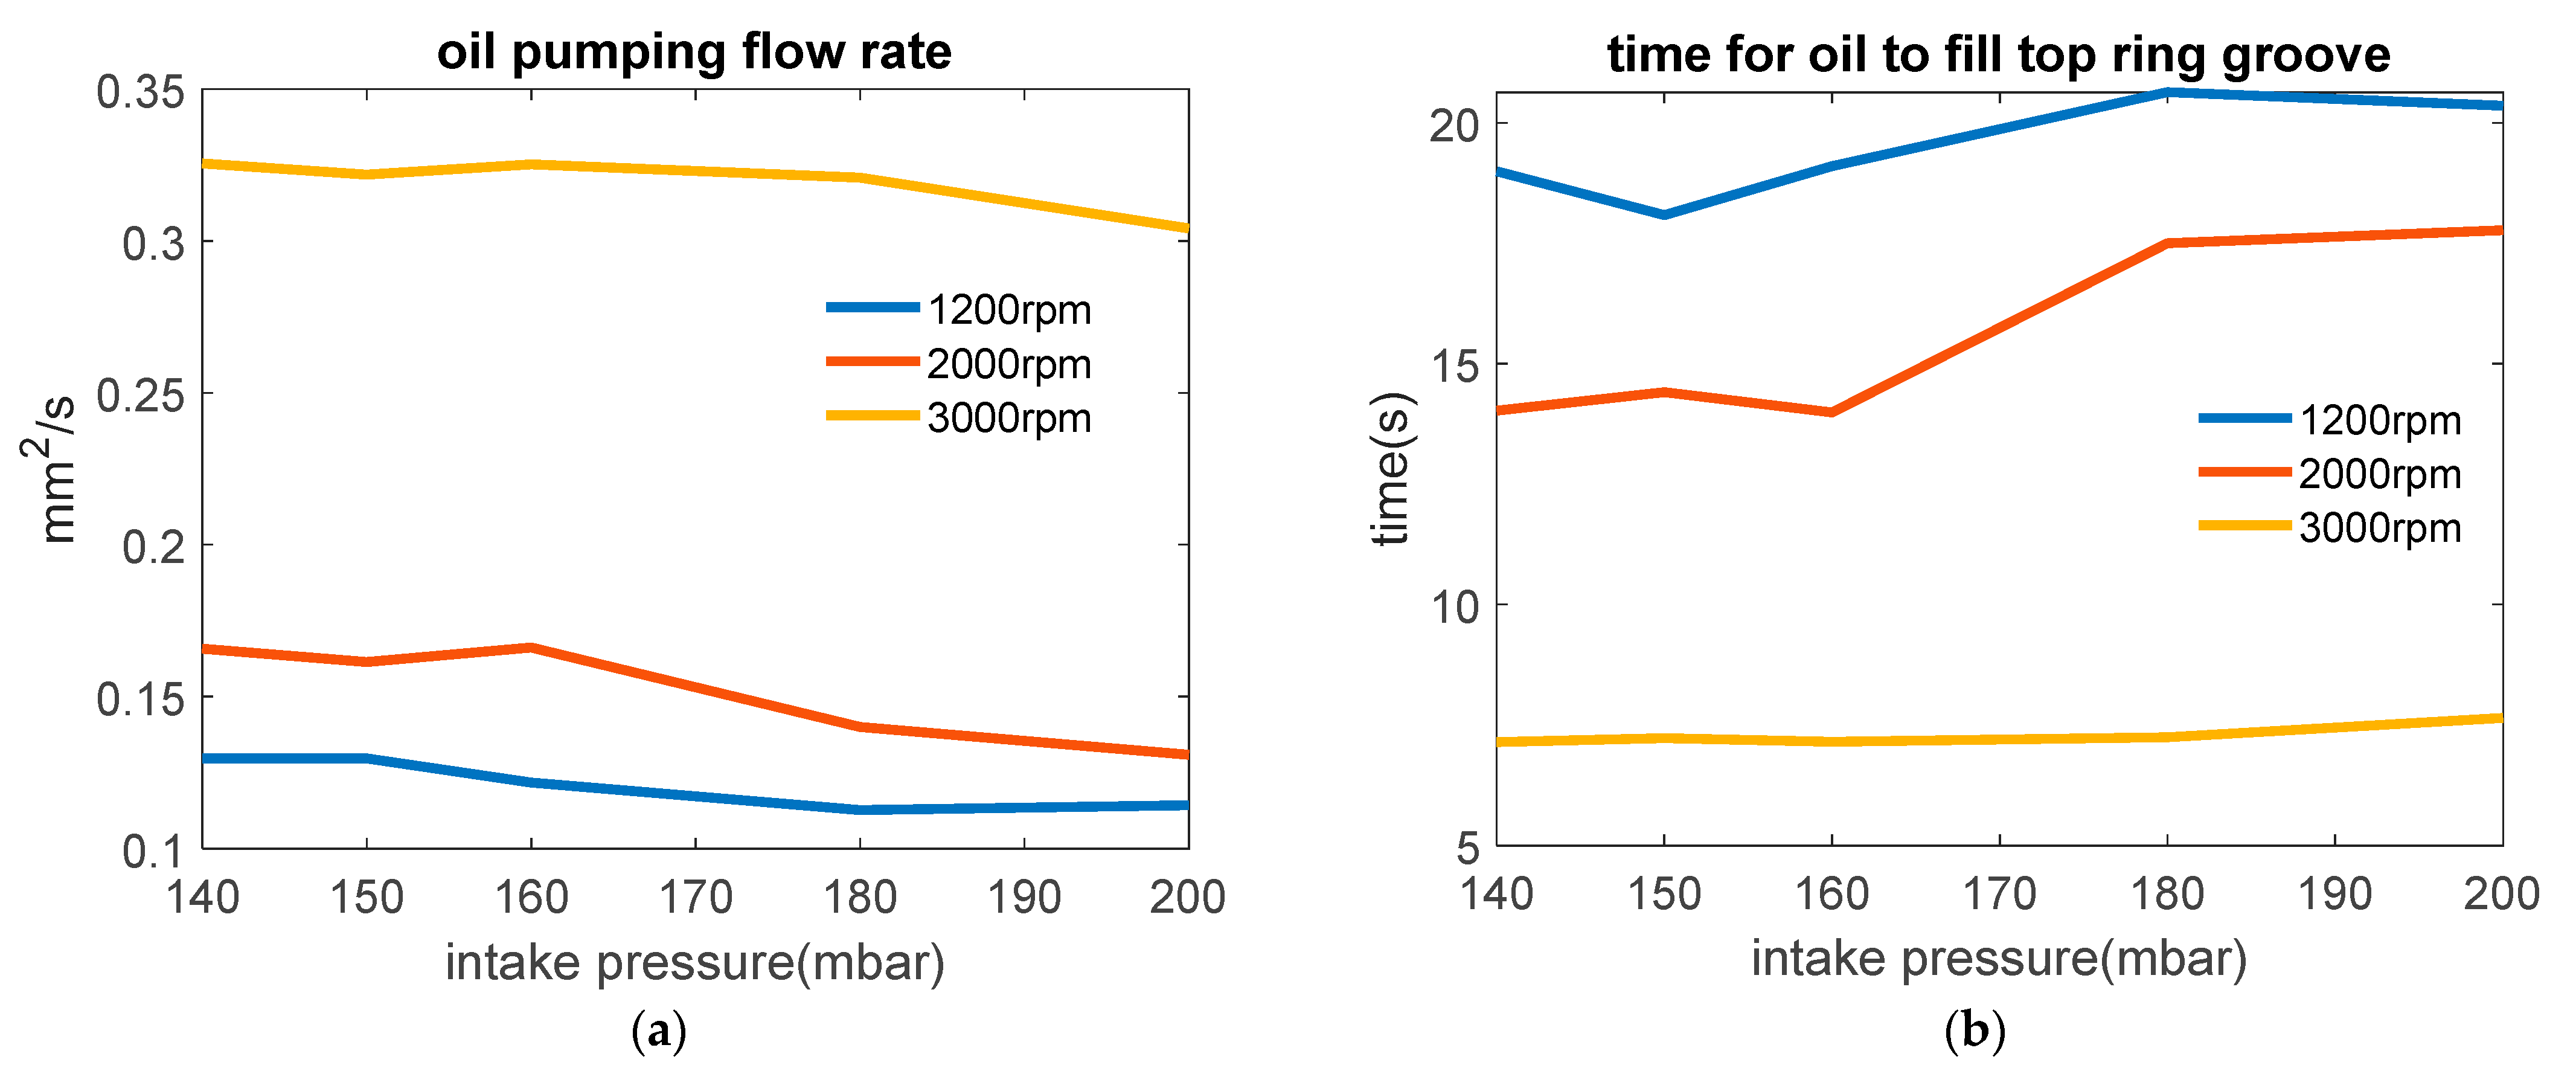
Table 1.
The engine specifications.
| Engine Characters | |
|---|---|
| Type | Spark Ignition 4 Valves |
| Bore | 86.6 mm |
| Stroke | 88.0 mm |
| Displacement | 0.511 L |
| Max specific power | 37.3 kW/L@5400 RPM |
| Max specific torque | 80 Nm/L@4200 RPM |
| Lubricant | SAE 0W20 |
Publisher’s Note: MDPI stays neutral with regard to jurisdictional claims in published maps and institutional affiliations. |
© 2022 by the authors. Licensee MDPI, Basel, Switzerland. This article is an open access article distributed under the terms and conditions of the Creative Commons Attribution (CC BY) license (https://creativecommons.org/licenses/by/4.0/).
Share and Cite
MDPI and ACS Style
Li, M.; Tian, T. Effect of Blowby on the Leakage of the Three-Piece Oil Control Ring and Subsequent Oil Transport in Upper Ring-Pack Regions in Internal Combustion Engines. Lubricants 2022, 10, 250. https://doi.org/10.3390/lubricants10100250
AMA Style
Li M, Tian T. Effect of Blowby on the Leakage of the Three-Piece Oil Control Ring and Subsequent Oil Transport in Upper Ring-Pack Regions in Internal Combustion Engines. Lubricants. 2022; 10(10):250. https://doi.org/10.3390/lubricants10100250
Chicago/Turabian StyleLi, Mo, and Tian Tian. 2022. "Effect of Blowby on the Leakage of the Three-Piece Oil Control Ring and Subsequent Oil Transport in Upper Ring-Pack Regions in Internal Combustion Engines" Lubricants 10, no. 10: 250. https://doi.org/10.3390/lubricants10100250
Note that from the first issue of 2016, this journal uses article numbers instead of page numbers. See further details here.