Abstract
To meet the global requirements of the industry, there is a need for innovative light weight, low cost, eco-friendly, high quality engineering materials with superior performance at a wide range of temperatures. Aluminum Matrix Composites (AMCs) are lightweight materials with isotropic properties, a suitable choice for modern industry. Low-cost aluminum alloys reinforced with minerals have found a special place in the automotive industry for the manufacture of automobile parts. Rutile particles improve the mechanical properties of the aluminum matrix, making it attractive for structural applications as well as providing greater wear resistance to the composite during sliding. In the present studies, a rutile mineral reinforced LM27 aluminum alloy composite was developed through a stir casting route with 6, 9 and 12 wt.% reinforcements. To study the effect of particle size on the mechanical and tribological properties of composite samples reinforced with fine-sized (50–75 μm) and coarse-sized (106–125 μm) rutile particles were prepared From the results of the experiment, it was found that the hardness, compressive strength and wear resistance increase with increasing rutile wt.% addition. The worn surface and re-groove of the new surface are restored during sliding with the help of oxide films. The analysis of the fractured surface clearly indicates with the help of energy dispersive X-ray spectroscopy (EDS) that with the increase in the volume fraction of the reinforced particles, the porosity increases, which could be the main reason for the compression failure of the composite material.
1. Introduction
AMCs, or aluminum matrix composites, are aluminum-centric material systems that are both lightweight and high-performing. With the help of non-metals and ceramics like SiC, Al2O3, graphite, carbon boron etc., composite materials can be altered in shape, size and volume fraction to achieve the desired properties [1]. There is a significant increase in material strength, mechanical [2], tribological [3] and thermal [4] properties with the addition of reinforcement. Engineering fields, such as transportation, aerospace, and sports, can benefit from using these custom-made materials. As a result of their low cost and abundance on the beach, minerals such as silicon carbide [4], garnet [5], and sillimanite [6] are attracting a growing number of researchers.
The study of wear behavior with variation of temperature clearly showed a delay in the transition of wear modes from mild to severe, which makes these composites suitable for high temperature as well as heavy load applications in the site of the transport sector [4]. A transition from friction to wear particle cracking-induced delamination occurred when the applied load on the ceramics aluminum alloy composite was increased [1]. Matrix cracking, breakage, delamination, de-bonding of matrix, high-temperature solid lubricants and self-lubricating composites have led to a critical review [7,8]. The tensile and fracture behavior of material with nano/micro TiB2 particle reinforced aluminum alloy composites [9] and tribological properties of brake disc material [10] has been studied. The synthesis, microstructure and mechanical properties of various particles such as ZrSiO4 reinforced aluminum alloy composites have been analyzed [11,12,13]. During sliding, surface formation and roughing effects at the interface in three-body contact conditions have been studied in relation to the trivalent properties of aluminium alloy composites [14,15,16].
An important consideration when preparing composites is improving their mechanical properties. When particles are evenly distributed throughout the matrix, the material becomes stiffer and less ductile, but it also changes its tensile and compressive strength. Despite the reduced ductility, cast Al 6061 reinforced composites showed significant improvements in mechanical properties such as hardness, tensile strength, and compressive strength [7]. Compressive loads can be applied to a variety of materials. A material’s compression response must be characterized by observing its behavior before it is used. Tensile testing is a standard method for determining a material’s elastic, yield point, and plastic deformation, as well as its fracture properties, through the study of mechanical behavior. In some cases, these studies are restricted to the neck area. Compression testing offers an alternative method for determining the behavior of materials under large plastic strains during deformation processes to obtain measurements beyond the tensile strength necking limit. The hardness of the composite also contributes to the material’s superior performance when used as a reinforcing material for a variety of structural applications. Rutile reinforced LM27 alloy composites showed an increase in hardness with increasing amounts of reinforcement. Zircon sand therefore exhibited better mechanical and tribology behavior under different loading conditions [11]. The incorporation of titanium dioxide powder into aluminum (AA5051) enhances the mechanical properties and increases the resistance of the composite material [17].
Rutile mineral particles of fine size (50–75 μm) and coarse size (106–125 μm) were used for the preparation of composites in the present study. Specimens made of melt composites were subjected to compressive tests, hardness and wear properties at variable loads from 9.81 N to 49.05 N. The effect of particle size and reinforcement amount on mechanical properties has been studied. This current study will result in a clearer vision of material behavior and identify new opportunities for composite materials that may differ significantly from those currently produced.
2. Preparation of Samples
Stir casting was used to prepare the composite, which involves mixing the particles into liquid aluminum melt with the help of a stirrer to ensure uniform distribution and then allowing the material to solidify in the mold under normal environmental conditions. It is currently being used on a commercial scale to produce a variety of AMCs, with some modifications, to achieve better mechanical and tribological properties [11]. The LM27 alloy with 8% silicon, 8% iron, 2% copper, 3% magnesium, 6% manganese, 1% nickel and a balance of aluminum is melted in an electric furnace. Gradually increasing the impeller speed created a vortex inside the melt, reaching (630 rpm). It was necessary to add rutile particles preheated to 12–15 g per minute (gm/min) into the vortex of an LM27 melt. Samples were cast in a permanent mold after being thoroughly mixed with the composites. The mechanical and tribological properties of the casted composites were studied, and the microhardness of the samples was measured. Kumar et al.’s [11] studies on the composites made from the ceramic’s reinforcements derived from natural resources is a dynamic research area encompassing a wide variety of mechanical and tribological properties of composite materials. Table 1 shows the composite with rutile mineral particles of fine size (50–75 μm) and coarse size (106–125 μm) specimens that were developed with different wt.% concentrations.

Table 1.
Details of the developed composite specimens by the stir casting process.
3. Characterization of Composites
3.1. Structural Analysis
With the help of the PANalytical X-pert PRO (UC Davis, Davis, CA, USA), X-ray diffraction patterns of the base alloy (LM27) and the composite containing 15 wt. percent fine-sized rutile particles were recorded. The composite samples were mechanically polished and etched with Keller’s reagent for a metallographic study. Optical microstructural analysis has been used to examine the prepared samples (Eclipse MA-100, Nikon, Tokyo, Japan).
3.2. Microhardness Measurement
A Vickers hardness testing machine was used to determine the microhardness of the composite’s various phases (particles, particle/matrix interface, and matrix) (Mitutoyo, Japan). Each set of samples was tested for microhardness by taking a minimum of five indentations at 100 gmf on each sample.
3.3. Wear Rate Measurements
Pin-on-disc wear and friction monitor (Model TR-20CH-400, Ducon, Bangalore, INDIA) with a programmable closed furnace chamber was used to conduct dry sliding wear tests on the composites at room temperature. The hardened EN32 steel disc with a hardness of 65HRC was used to test the cylindrical composite samples (30 mm × 10 mm). Using a linear variable displacement transducer (LVDT), we determined the wear rate of the specimen (LVDT). Using the formula, [W (mm3/m) = height change (mm)/pin area (mm2)/sliding distance (m)], the wear rate was calculated. Archard and Holm suggested that the total amount of material removed during sliding (wear volume) V, is proportional to the actual area of contact, multiplied by the unit-less proportionality constant of the sliding distance, known as wear factor (K). The wear factor can be a property of the material set, sliding conditions, surface topography, and environment, among other things. After 3000 m of sliding, the wear tests of the specimen were completed at a constant sliding velocity of 1.6 m s−1. The prepared specimens were tested under the variation of loading conditions from 9.81 N to 49.05 N, and also with the changed proportion of the rutile content in the composite.
3.4. Compressive Strength Measurements
The effects of fine and coarse rutile particles in the quasi-static uniaxial compressive stress–strain behavior of reinforced LM27 alloys were studied. The cylindrical specimens (a diameter of 10mm and a thickness of 5mm) for quasi-static uniaxial compressive stress-strain behavior have been used for this study. Table 2 provides information on the specimens used in this study. The specimens’ L/D ratio was kept at 0.5 to ensure uniform compressive deformation and to prevent buckling failure.
Table 2.
Details of the compressive tests plan and composite specimens.
The tests were carried out on a 100 kN Universal Testing Machine in the Terminal Ballistics Research Laboratory (Chandigarh), India (Make Lloyd LR 100K). All of the tests used a strain rate of 10−3 s−1, with the machine’s cross-head speed maintained at 1 mm/min. Molybdenum disulfide was applied to both ends of the specimen to reduce friction with the test machine. During quasi-static uniaxial compression, a cylindrical specimen expands due to the Poisson effect. Expansion restrained by friction at the loading faces of the specimen results in stress and strain nonuniformities.
3.5. Fracture Studies
Fracture and worn surface studies of the specimens were performed using a scanning electron microscope JSM-6510LV (JEOL, Tokyo, Japan) with an EDS attachment to study the causes of compression failure and wear tests. The fracture analysis provides a comprehensive, practical description of natural fractures, their origin, and characteristics, understanding the effects of fractures on materials.
4. Results and Discussion
4.1. XRD Analysis
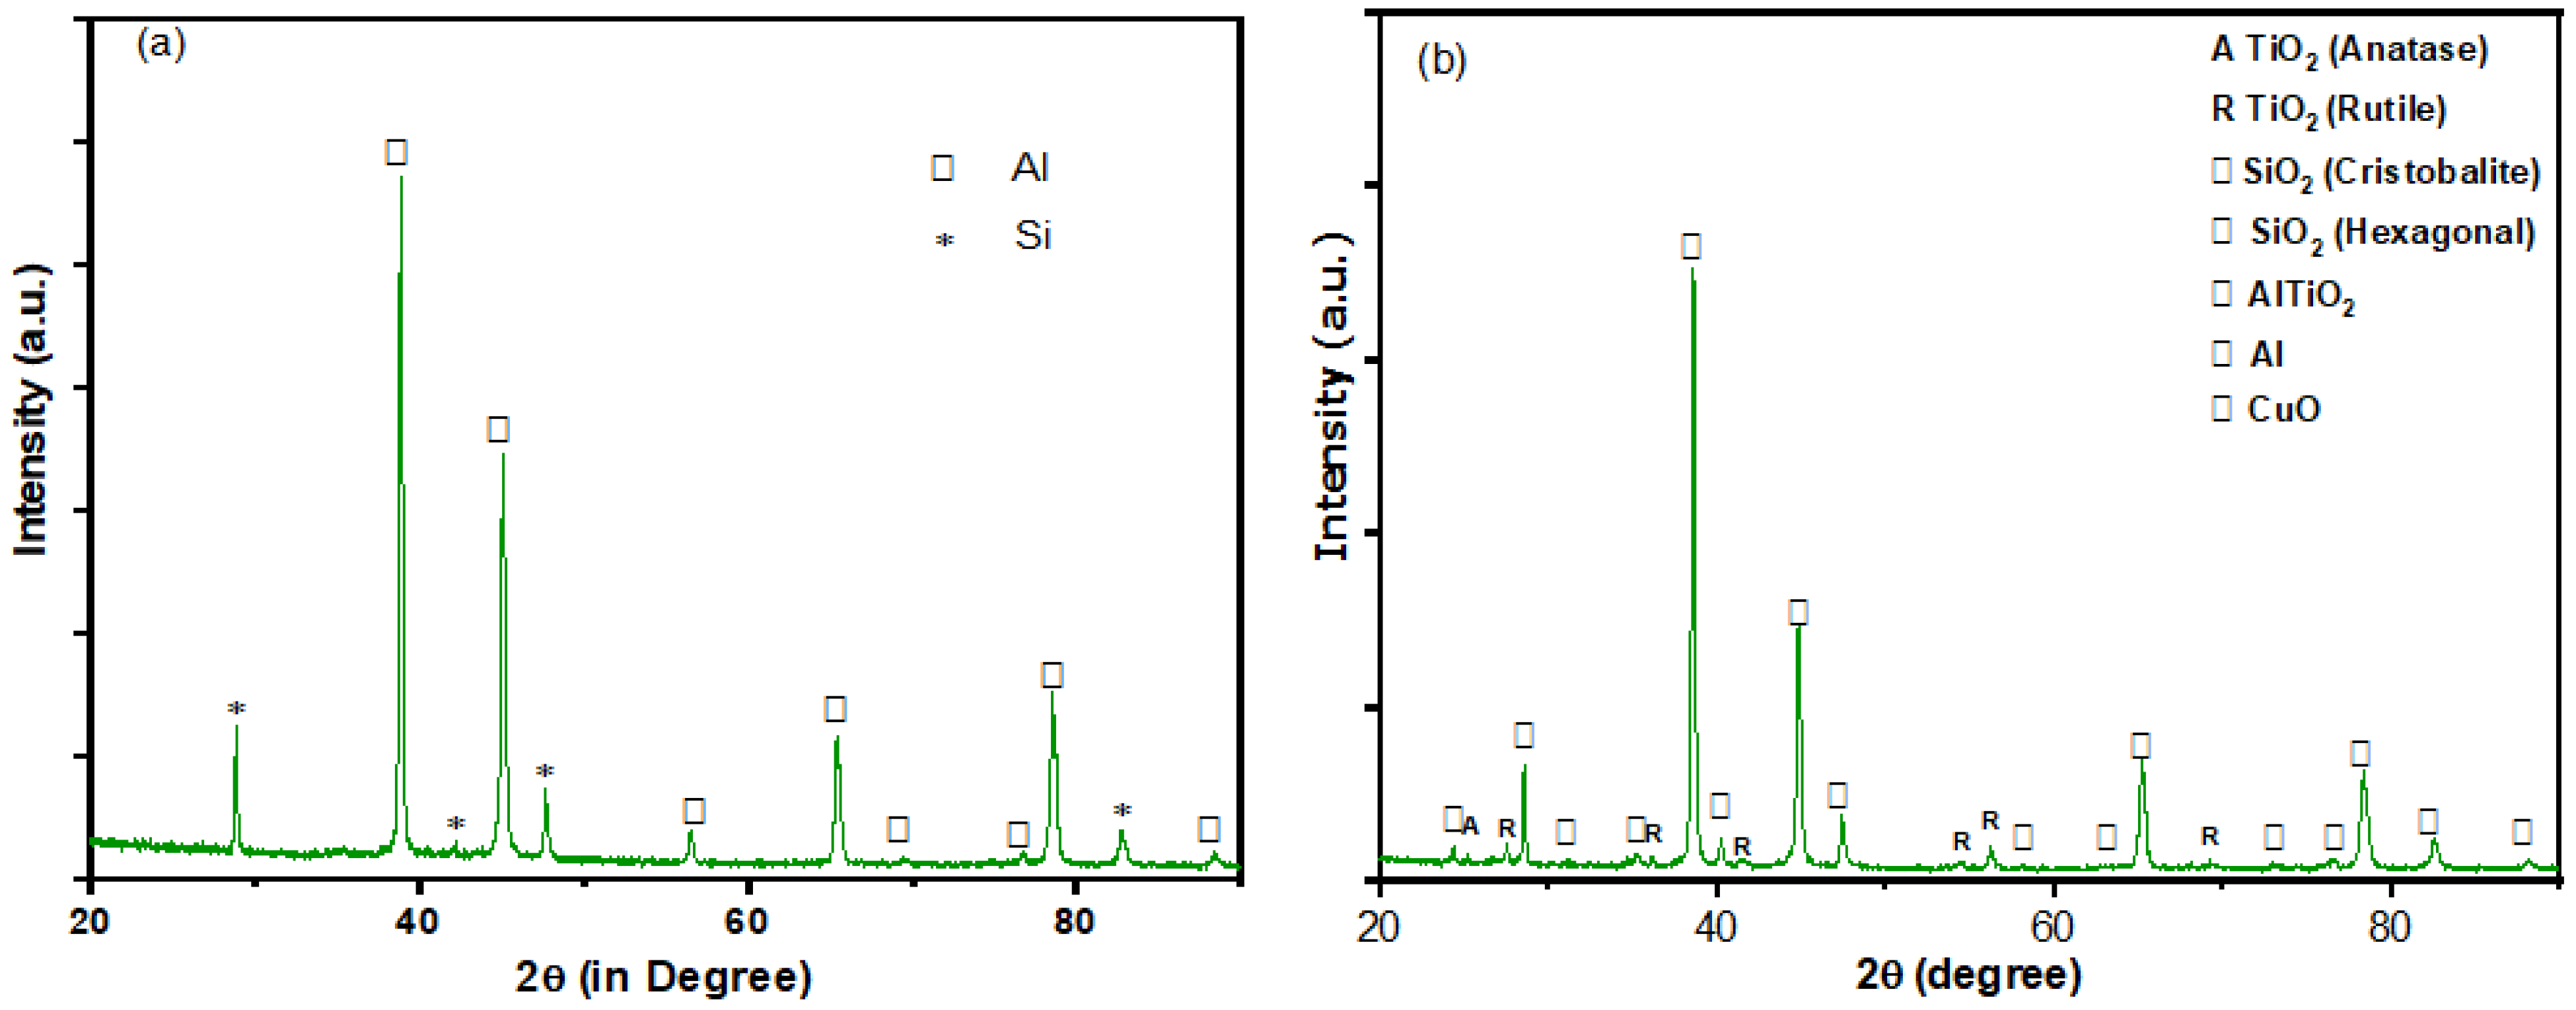
Figure 1 depicts the X-ray diffraction patterns (XRD) of a base alloy (LM27) and a composite containing 12% fine size rutile particles by weight (a,b). Figure 1a depicts the base alloy’s Al and Si composition. The XRD patterns of composite materials show that rutile particles and Al and Si elements are present (Figure 1b). The composite was also found to contain AlTiO2 in addition to the other phases. The reaction between rutile and LM27 alloy during casting could have resulted in the formation of AlTiO2 at the interface.
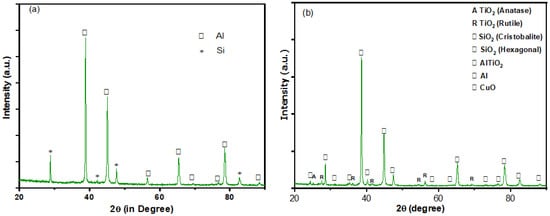
Figure 1.
XRD patterns of (a) LM27 alloy, and (b) composite with 12 wt.% fine size TiO2 reinforced particles.
4.2. Microstructural Analysis
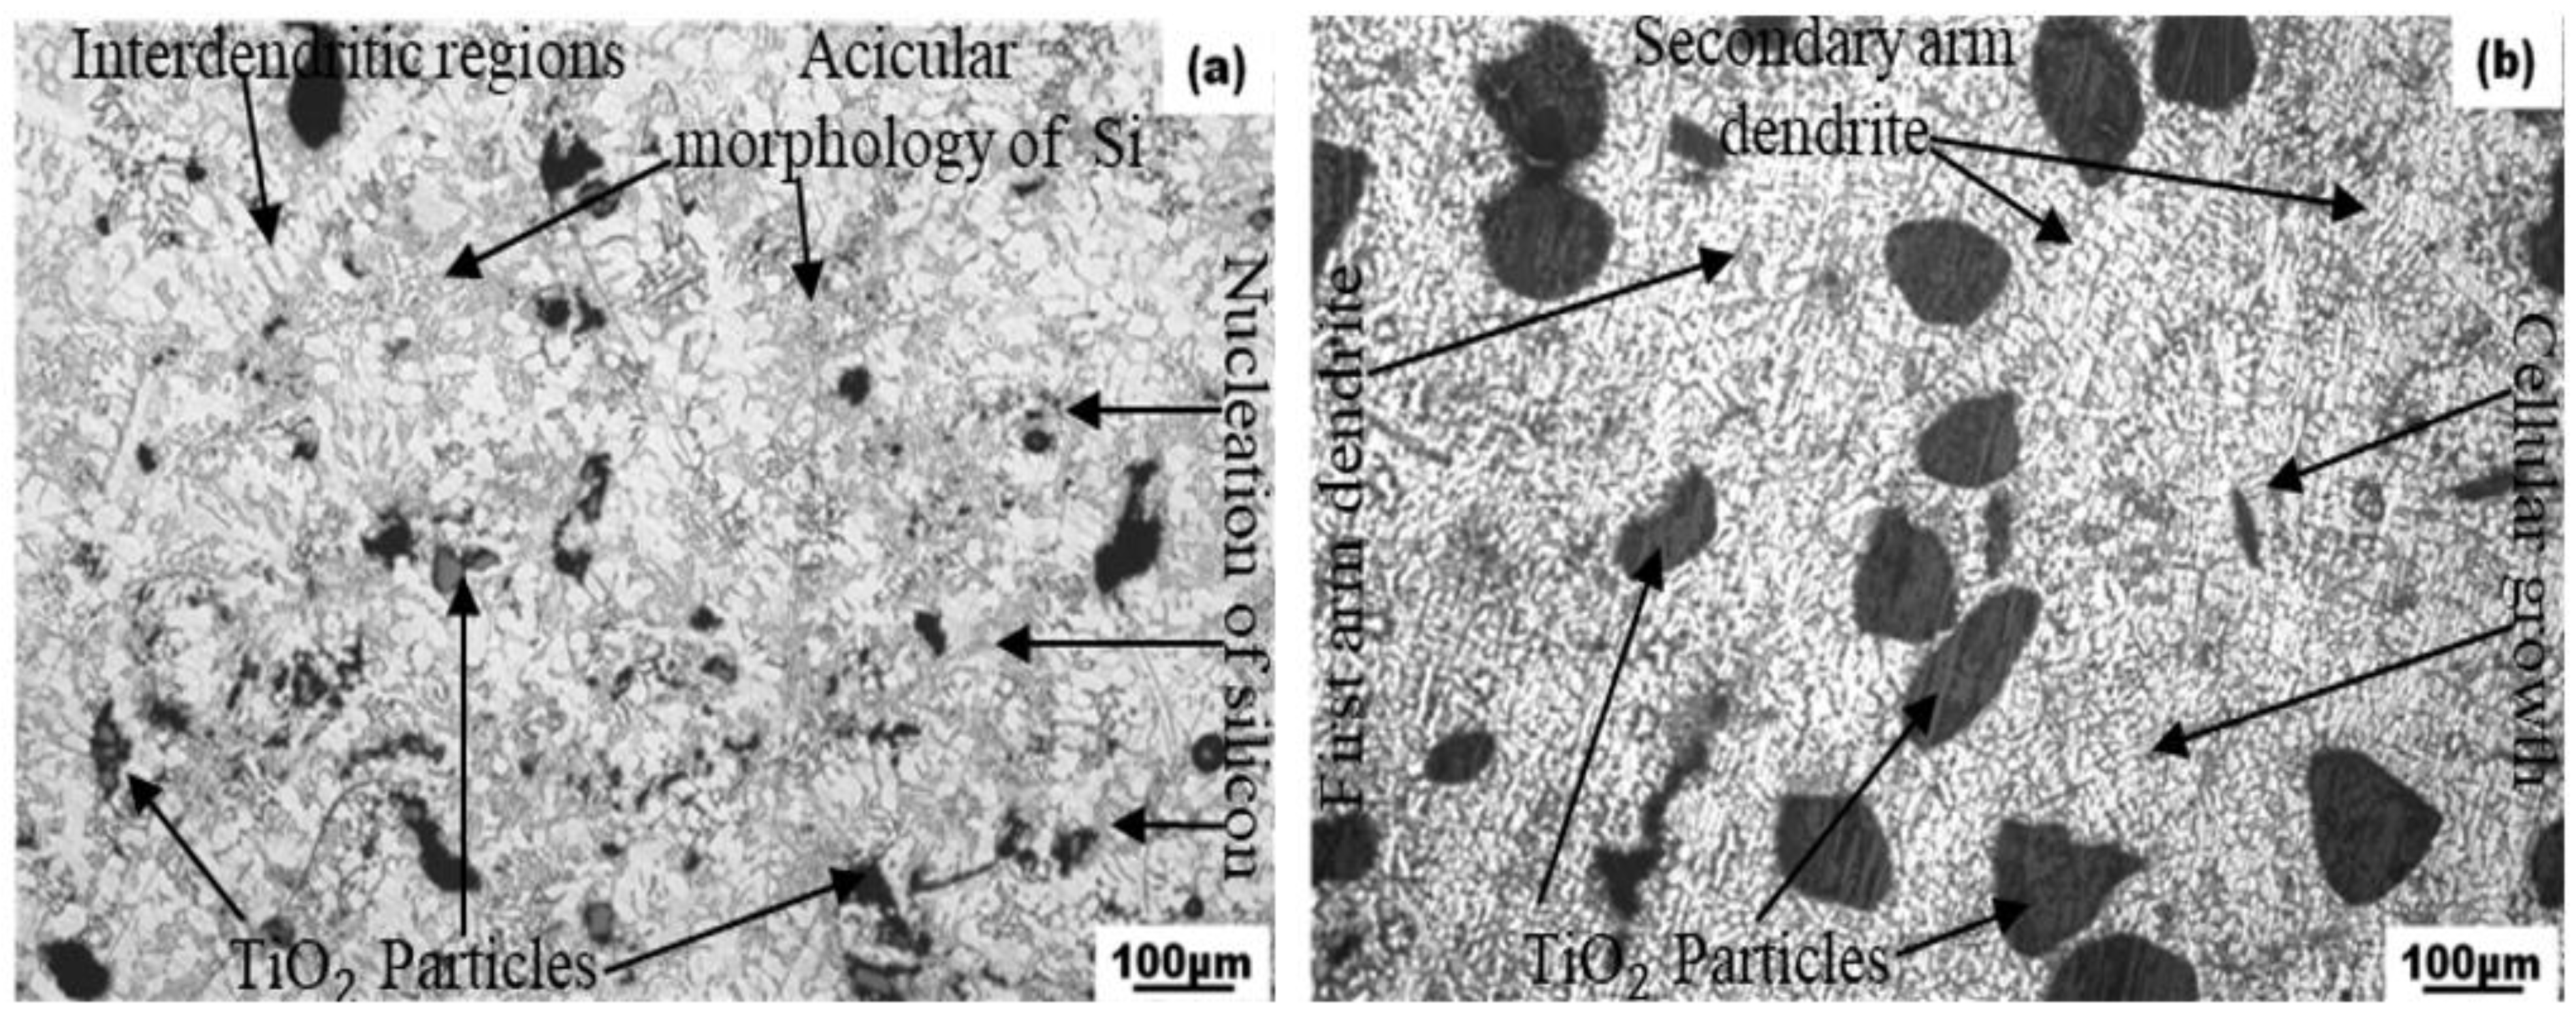
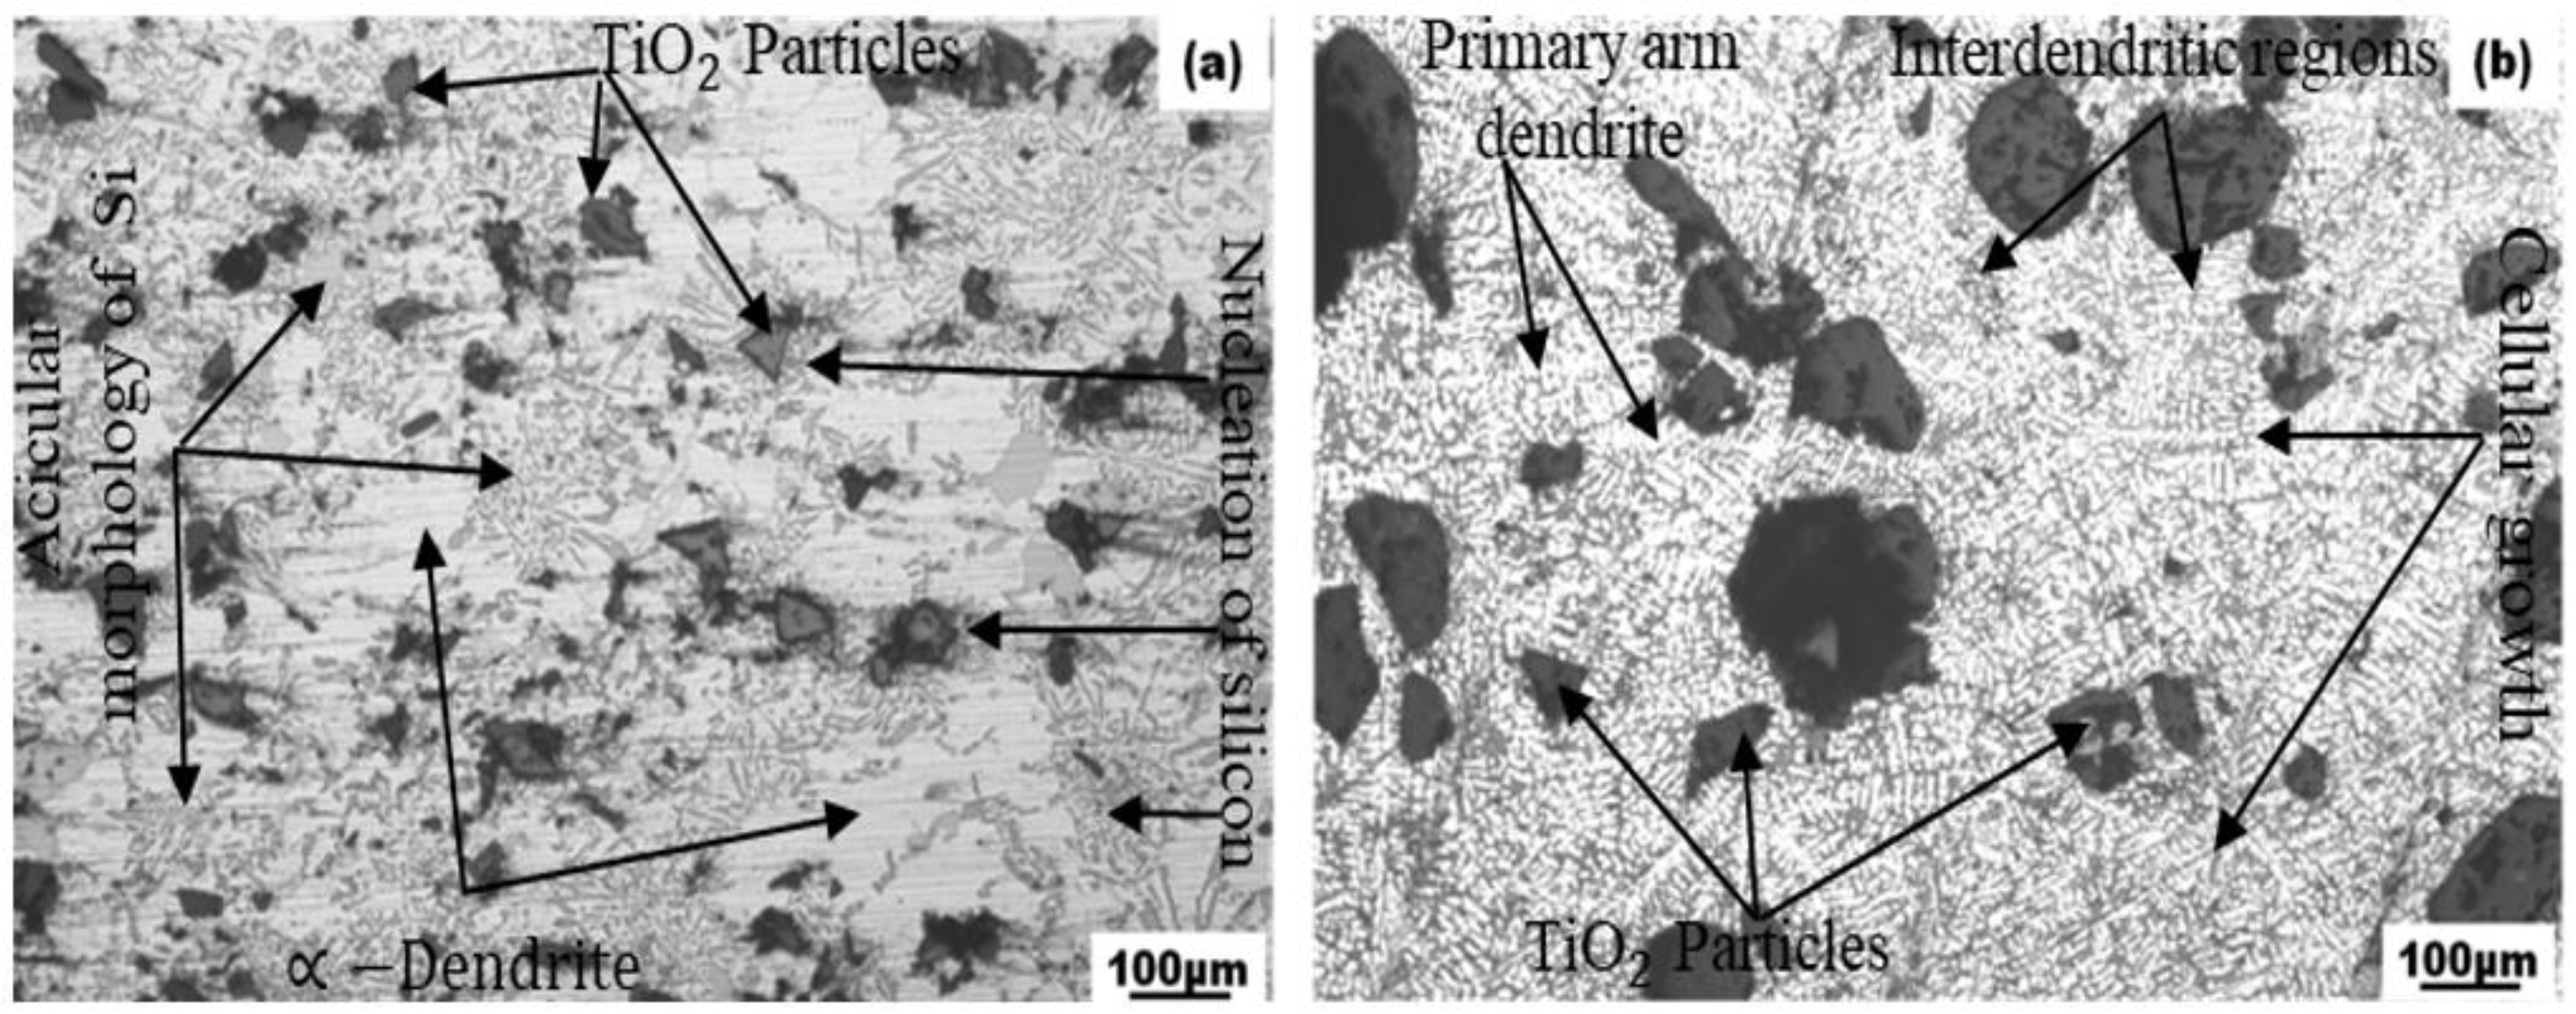
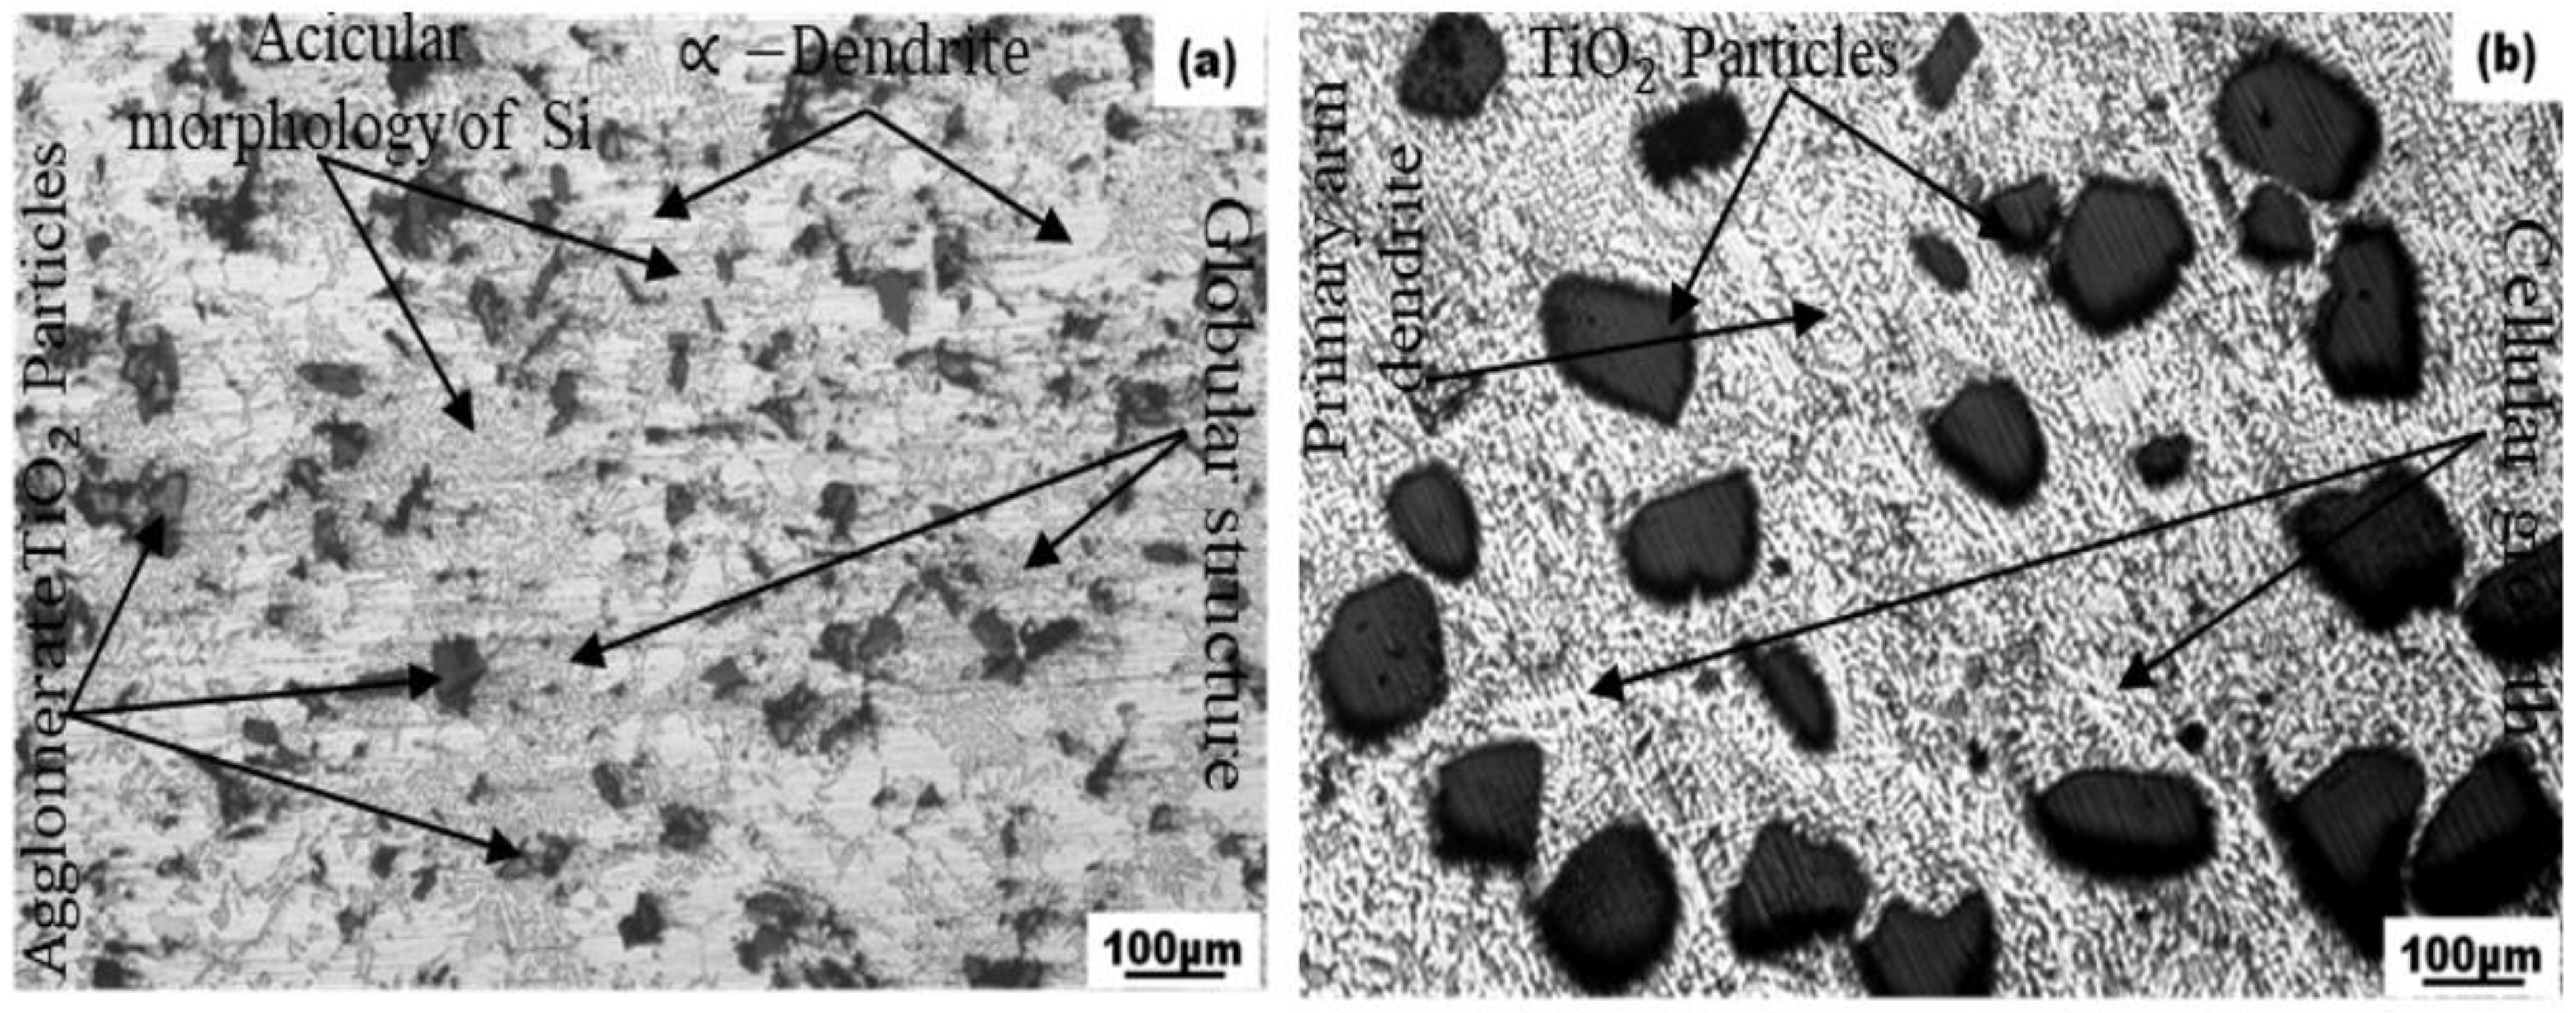
The optical micrographs of the composites with fine-sized (50–75 μm) and coarse-sized (106–125 μm) particles are shown in Figure 2, Figure 3 and Figure 4. The micrographs clearly show that all samples have changed in surface morphology due to the rutile particles being pushed by the solid-liquid interface during the solidification process, occupying the space in the interdendritic regions.

Figure 2.
The optical micrograph of composite with different reinforced size at 6 wt.% (a) fine and (b) coarse particles of TiO2.

Figure 3.
The optical micrograph of composite with different reinforced size at 9 wt.% (a) fine and (b) coarse particles of TiO2.

Figure 4.
The optical micrograph of composite with different reinforced size at 12 wt.% (a) fine and (b) coarse particles of TiO2.
The micrographs clearly show that all samples have changed in surface morphology due to the rutile particles being pushed by the solid-liquid interface during the solidification process, occupying the space in the interdendritic regions. The heterogeneous nucleation of silicon in the vicinity of the reinforced particles, as shown in Figure 2a, has been attributed to the refinement in silicon morphology from needle-shaped to acicular in composites reinforced with fine rutile particles. The dendritic structure of coarse-sized rutile particles reinforced composites is larger because of the larger distance between particles (Figure 2b). The interspaces between the reinforced particles in the matrix decrease as the reinforcement weight fraction increases. As a result, dislocation movement is hindered, and composites’ hardness increases [11]. Increasing the reinforcement content causes the eutectic silicon to become finer and to form colonies close to the rutile particle, as shown in Figure 3a,b. In addition, interference from coarse and fine particles at the growing solid-liquid interface changes the matrix from dendritic to cellular [2]. Figure 4a,b shows the uniform distribution of particles with a 12wt% increase in particle content. Adding rutile particles increases melt viscosity, reducing convection in the molten composite and slowing the diffusion and flow of solutes. Because of the mismatch between matrix and particle, reinforced particles affect the thermal and solute fields (by convection interrupting diffusion of solute silicon). The morphology of silicon changes from a needle to a blunted type due to a slow cooling rate and restricted diffusion in the melt [13]. Adding coarse-sized particles to the melt, as shown in Figure 2b, Figure 3b and Figure 4b, makes it less likely that the particles will stick together. Crystal grain refinement between dendritic arm spacing adds hardness and improves mechanical behavior by revealing strain through dendritic fragmentation [6]. Removing fine particles from the surface during sample preparation and polishing creates void space, resulting in some black spots on the coarse particles. Due to the fracturing that occurs during the moving process, even the smallest fragmented particles can be seen. Fine particles reinforced composites are pushed faster during stirring due to the convection effect, which causes agglomeration of particles at specific locations. The dendritic solidification front pushes particles during solidification, which worsens agglomeration [18,19,20]. Figure 2b, Figure 3b and Figure 4b show dendritic growth in the particle-depleted regions. The solid-liquid interface pushes or engulfs fine particles during solidification, creating enough room for dendritic growth in the matrix. Cellular growth is facilitated by dendritic fragmentation, which occurs during rotation. Dendritic growth is slowed by the presence of rutile particles in the matrix, which also increases the wear rate of the composite. To achieve nearly uniform particle distribution, the impeller must be constantly stirred to provide the average shear strain and delay the particles’ tendency to settle during stirring. It has been reported that the resulting microstructural arrays (e.g., dendritic arms or cellular spacing) have important roles upon the distinctive material’s properties. Furthermore, the distributed particles also have a great effect on the resulting mechanical behavior of the composites [21,22,23]. The uniformity of particle distribution depends on the molten alloys’ wettability with the rutile particles.
4.3. Microhardness Analysis
The resistance to indentation of a sample can be used to determine its microhardness. Table 2 shows that the hardness value increased as the weight fraction of rutile particulates increased. A localized plastic flow occurs below the indentation, but this does not affect the overall elastic behavior of the composite sample. This plastic flow causes a rise in density compared to areas away from the depression. At the same time, the metal matrix’s volume contracted due to the extremely high hydrostatic pressure under the indentation. As a result, the non-uniform matrix flow in the localized region increases the particle concentration during the indentation. As more rutile is added, the hardness increases, but this depends on the size of the particles. Due to a decrease in dendrite size, fine particles offer more surface area for a given volume fraction, resulting in a stronger bond between the particle and matrix. However, the addition of coarse-sized particles has a minor impact on the matrix’s hardness than the addition of fine-sized particles. Structural energy at the material’s periphery can also contribute to the interface’s hardness. Indentation resistance is a standard test for determining a sample’s hardness. Table 3 shows that as the weight fraction of rutile particulates increased, the hardness value also increased.
Table 3.
Variation of hardness at different phases in composites.
Microhardness measurements have been performed at various stages of the composite to determine the impact of reinforced particulates on the alloy matrix. The hardness of reinforced particles decreases as we move away from the individual particles (Table 3). The high hardness indicates good interfacial bonding at the particle/matrix interface. The formation of the AlTiO2 phase at the interface between ceramic particles and the Al matrix improves the hardness at the interface, as seen in XRD (Figure 1b). As compared to the matrix phase, this phase at the particle/matrix interface exhibits greater hardness and is also responsible for tying the particles to the matrix. High microhardness values at particle, interface and matrix are achieved by good interfacial bonding and microstructure refinement in a composite containing 12% fine size rutile by weight.
4.4. Wear Behaviour Analysis
Wear is the phenomenon of loss of material due to relative motion between a surface and the contacting substances. The wear damage leaves the scratches, cracks and ploughing marks on the contacting surfaces accompanied by the removal of material by plastic deformation under the high loading conditions. Due to the presence of surface asperities, the real contact area between the two surfaces is very small as compared to the apparent area of contact. The applied load affects the surfaces through those asperities and the wear rate determined by number of factors like load, speed, frictional heat and properties of the surfaces in contact.
4.4.1. Effect of Rutile Reinforcement on Wear Rate
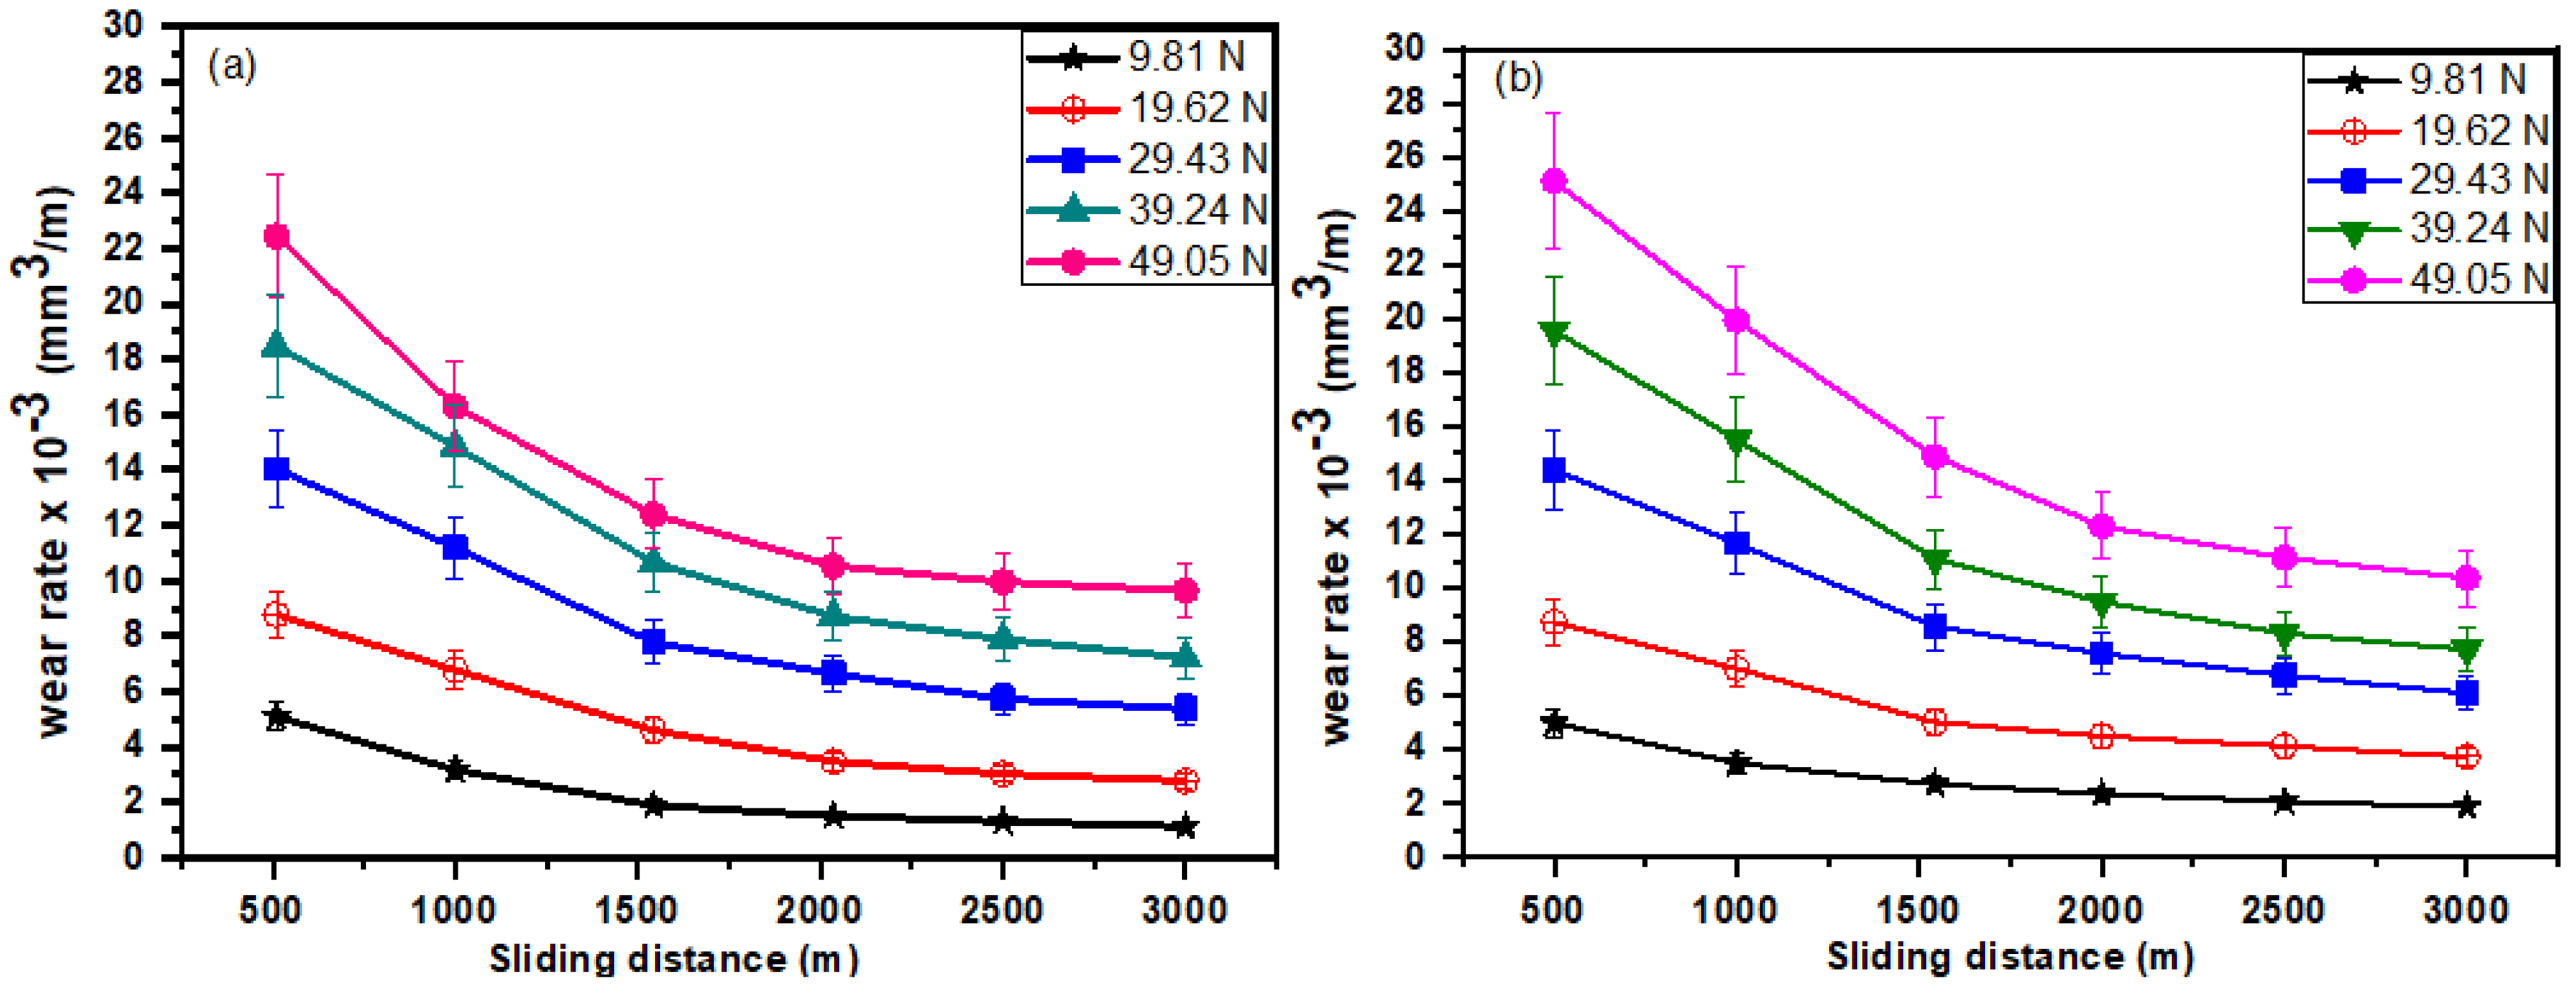
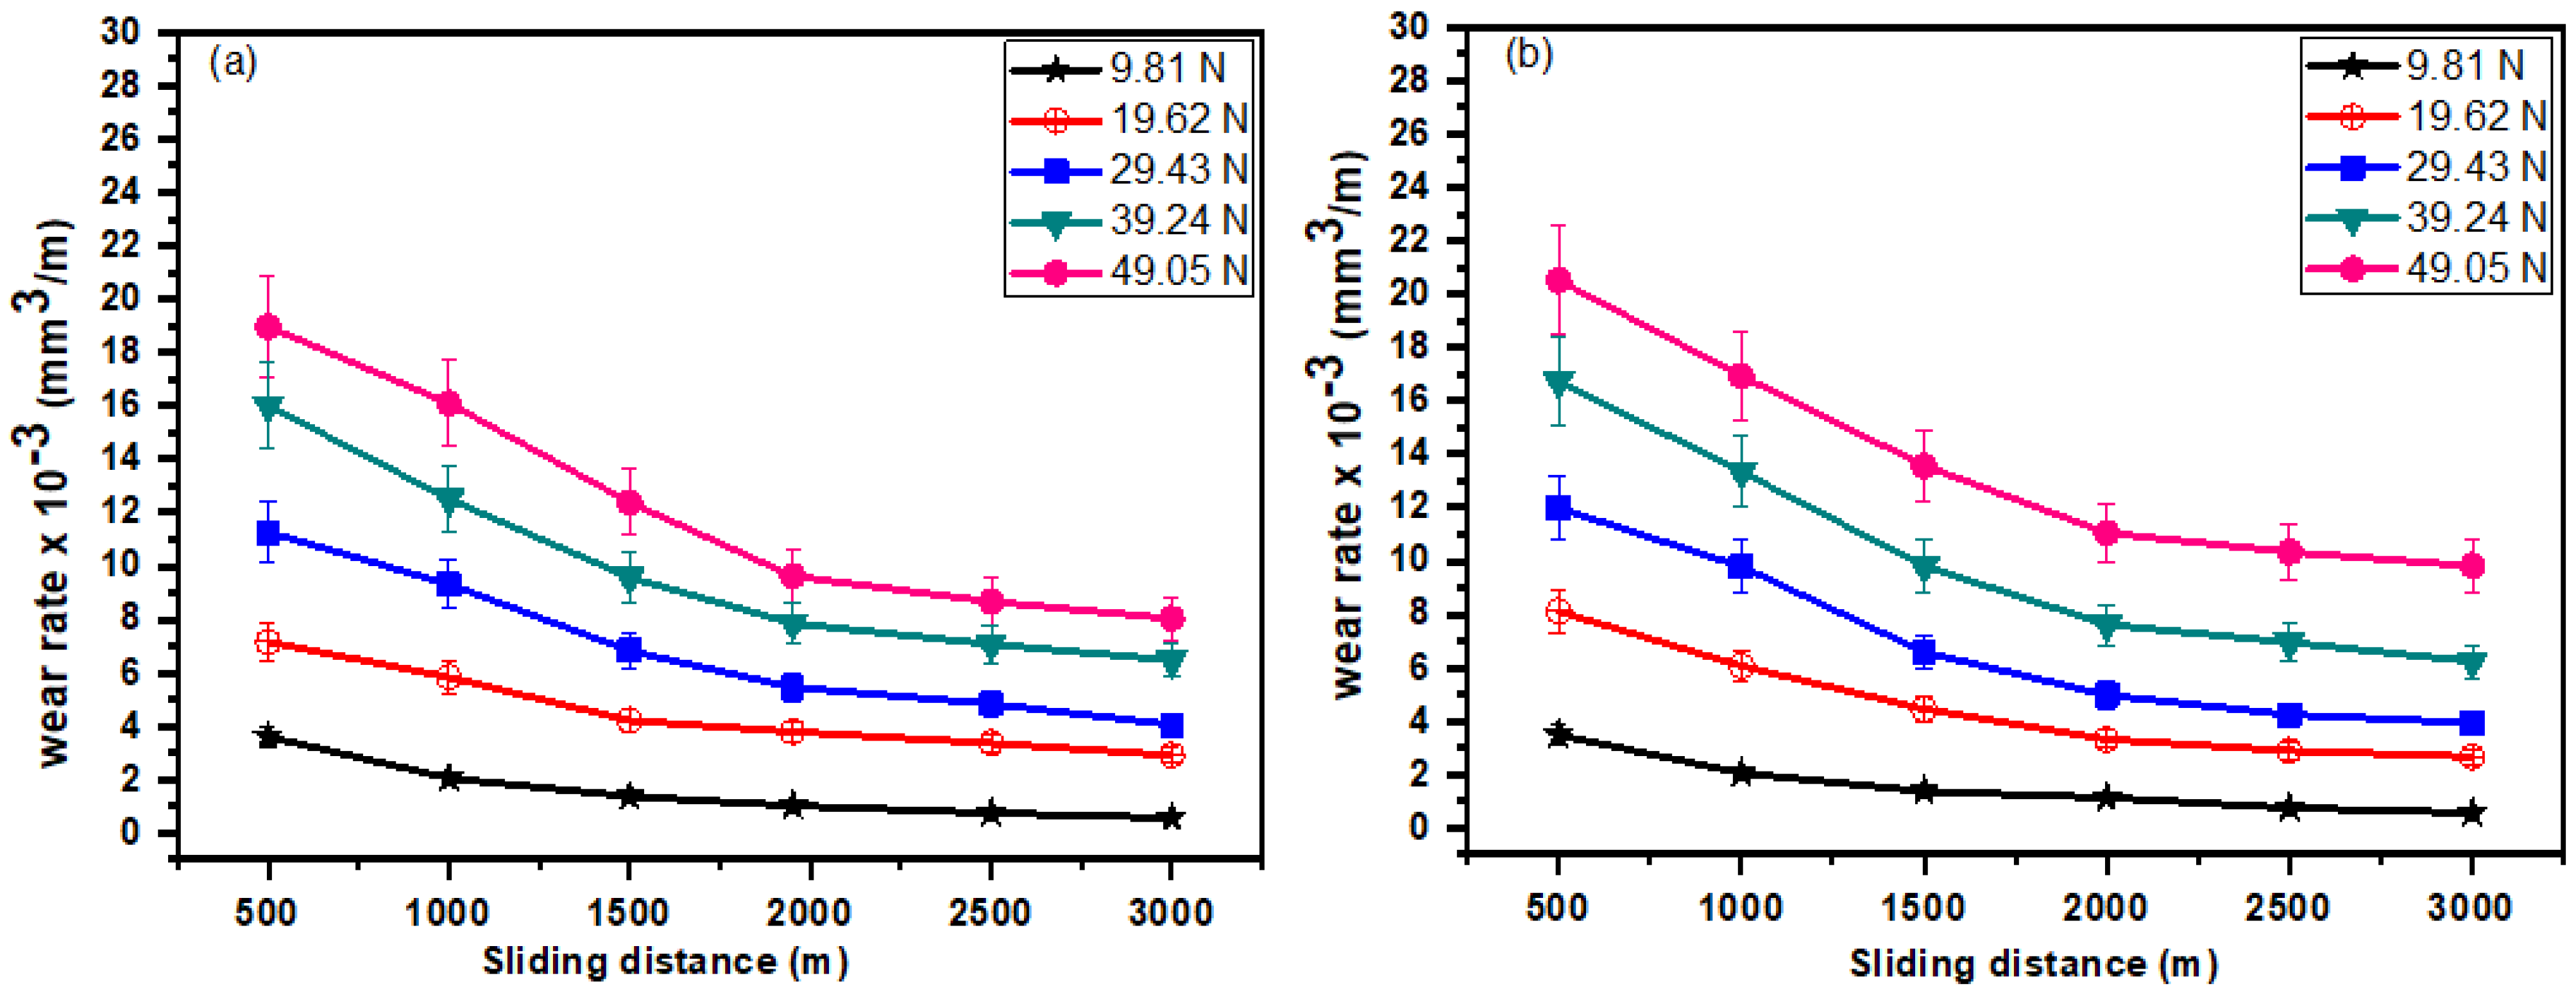
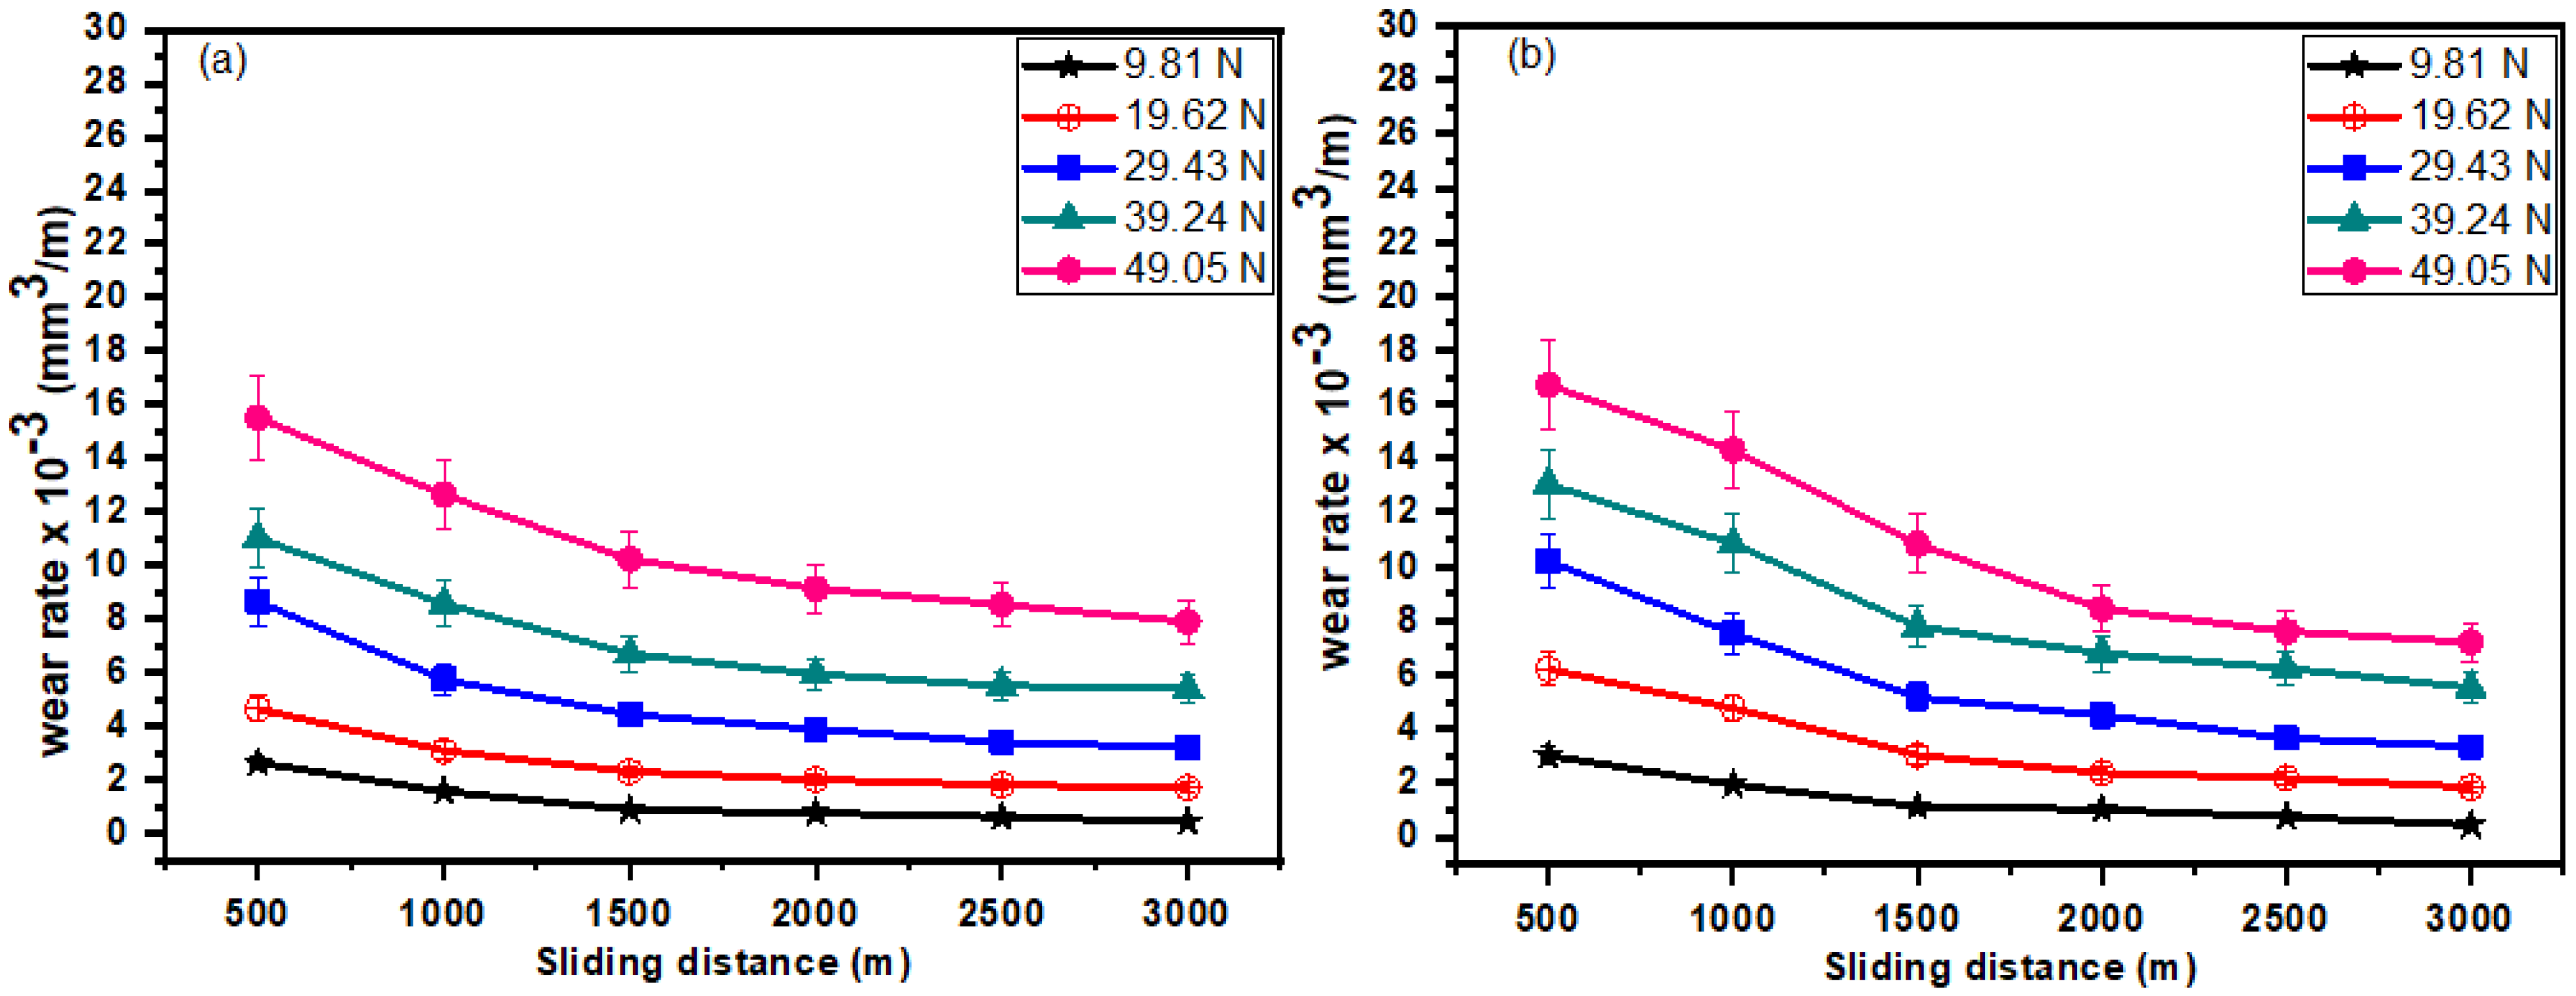
Adding rutile particles to the LM27 alloy made it much more resistant to wear, as shown by the graphs in Figure 5, Figure 6 and Figure 7. The asperity-to-asperity contacts between the two sliding surfaces determine the initial stages of the run’s heavy wear loss. The adhesive wear phenomenon which is dominant in the initial stages is also known as run in wear. The abrasive nature of the hard particles during sliding scratched the material from the soft matrix as well as from the rotating disc causing more volume loss. The continuous grinding of these abrasive particles with the running course of sliding changed these to blunt shaped smooth particles, thus reducing the sudden fall in wear loss [22]. This wear behaviour of the material is regarded as the steady state. It is also observed from the wear graphs that an increase in content of the reinforcement from 6 to 12 wt.% decreased the wear rate of the composite. The addition of increased particle concentration turned out to be very helpful in improving the wear resistance. The continuous grinding of these abrasive particles with the running course of sliding changed these to blunt shaped smooth particles, thus reducing a sudden decline in wear loss [23]. This wear behaviour of the material is regarded as the steady state.
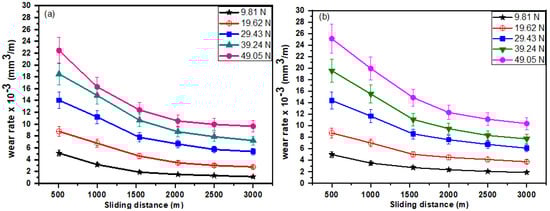
Figure 5.
Wear rate of composites against sliding distance at different loads for (a) composite ‘6F’ and (b) composite ‘6C’.
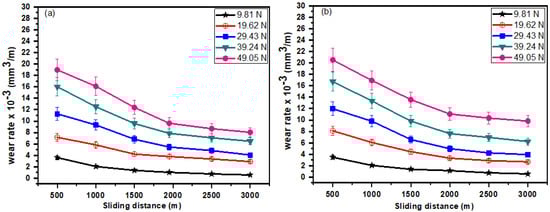
Figure 6.
Wear rate of composites against sliding distance at different loads for (a) composite ‘9F’ and (b) composite ‘9C’.
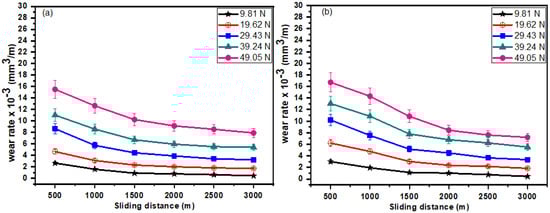
Figure 7.
Wear rate of composites against sliding distance at different loads for (a) composite ‘12F’ and (b) composite ‘12C’.
It is also observed from the wear graphs that an increase in content of the reinforcement from 6 to 12 wt.% decreased the wear rate of the composite. The addition of increased particle concentration turned out to be very helpful in improving the wear resistance. The continuous grinding of these abrasive particles with the running course of sliding changed these to blunt shaped smooth particles, thus reducing the sudden fall in wear loss [23]. This wear behaviour of the material is regarded as the steady state. It is also observed from the wear graphs that an increase in content of the reinforcement from 6 to 12 wt.% decreased the wear rate of composite. The addition of increased particle concentration turned out to be very helpful in improving the wear resistance.
4.4.2. Effect of Particle Size on Wear Rate
The reinforced particle’s size greatly affects how well the material holds up to wear. Table 4 shows that the composite material with fine particles (50–75 µm) has a higher hardness than the one with coarse particles (106–125 µm).
Table 4.
Flow stress comparison for fine size reinforced compositions.
The increased hardness of the material also changed how it wears. Because the fine-sized spheres had a larger surface area, they wore better than the coarse-sized ones [11]. The larger effective surface areas of the fine particles in the matrix make composites more resistant to wear. Fine particles with sharp edges may also be easier to push into the matrix when a load is put on them than coarse particles. When the coarse particles stick out, the material may wear out faster in these situations. In composites, the sliding indenters, made of reinforced particles, remove material by indenting and ploughing [12]. How deep the abrasive particles go into the material depends on how hard it is. Because the material has hard ceramic particles in it, it gets harder. The current studies also found that the size of the reinforced particle affects the rate of wear of the composite, as shown in Figure 7. As the size of the rutile particles got bigger, the wear rate got faster. By adding smaller, finer reinforced particles, the wear resistance of the composite material was raised.
4.4.3. Effect of Load on Wear Rate
The effect of load on wear rate is investigated between 9.81 N and 49.05 N. The wear graphs in Figure 5, Figure 6 and Figure 7 clearly show that the prepared composite specimens show similar wear behavior under different load conditions. According to the wear graphs, there is a significant increase in the material’s wear rate when the load is increased from 9.81 N to 49.05 N. According to Maria et al. [14], increasing load causes an increase in wear rate. A large amount of material was removed due to plastic deformation when a high load was applied. The oxide film that acts as a protective covering for the metal surface breaks down during dry sliding, bringing the two solid surfaces into contact. High sliding pressure fractured the oxide film, exposing the substrate material and causing plastic deformation of the underside surfaces. The welding of the materials that can be transferred and those that will fall out as wear debris occurred because of this proximity. The graphs above show that the wear rate increases as the applied load increases (Figure 5, Figure 6 and Figure 7). With one exception, the wear resistance of fine-particle composites is lower than fine-particle-reinforced composites because of weak interfacial bonding at the interface of matrix and particle, as is the case with coarse-particle-reinforced composites. In the composite materials the mechanical properties such as hardness, compressive strength, and tensile stress strongly affects the wear behaviour. The increased hardness of the composite material efficiently transfers the load from the matrix to the rigid particle and thus substantially improves the wear resistance, making it vulnerable to use as an innovative engineering material.
4.5. Compressive Strength
From a utility point of view, the compressive strength of the composite containing different sizes and volume fractions of reinforcement in the composites was measured. The details of the samples used are given in Table 1.
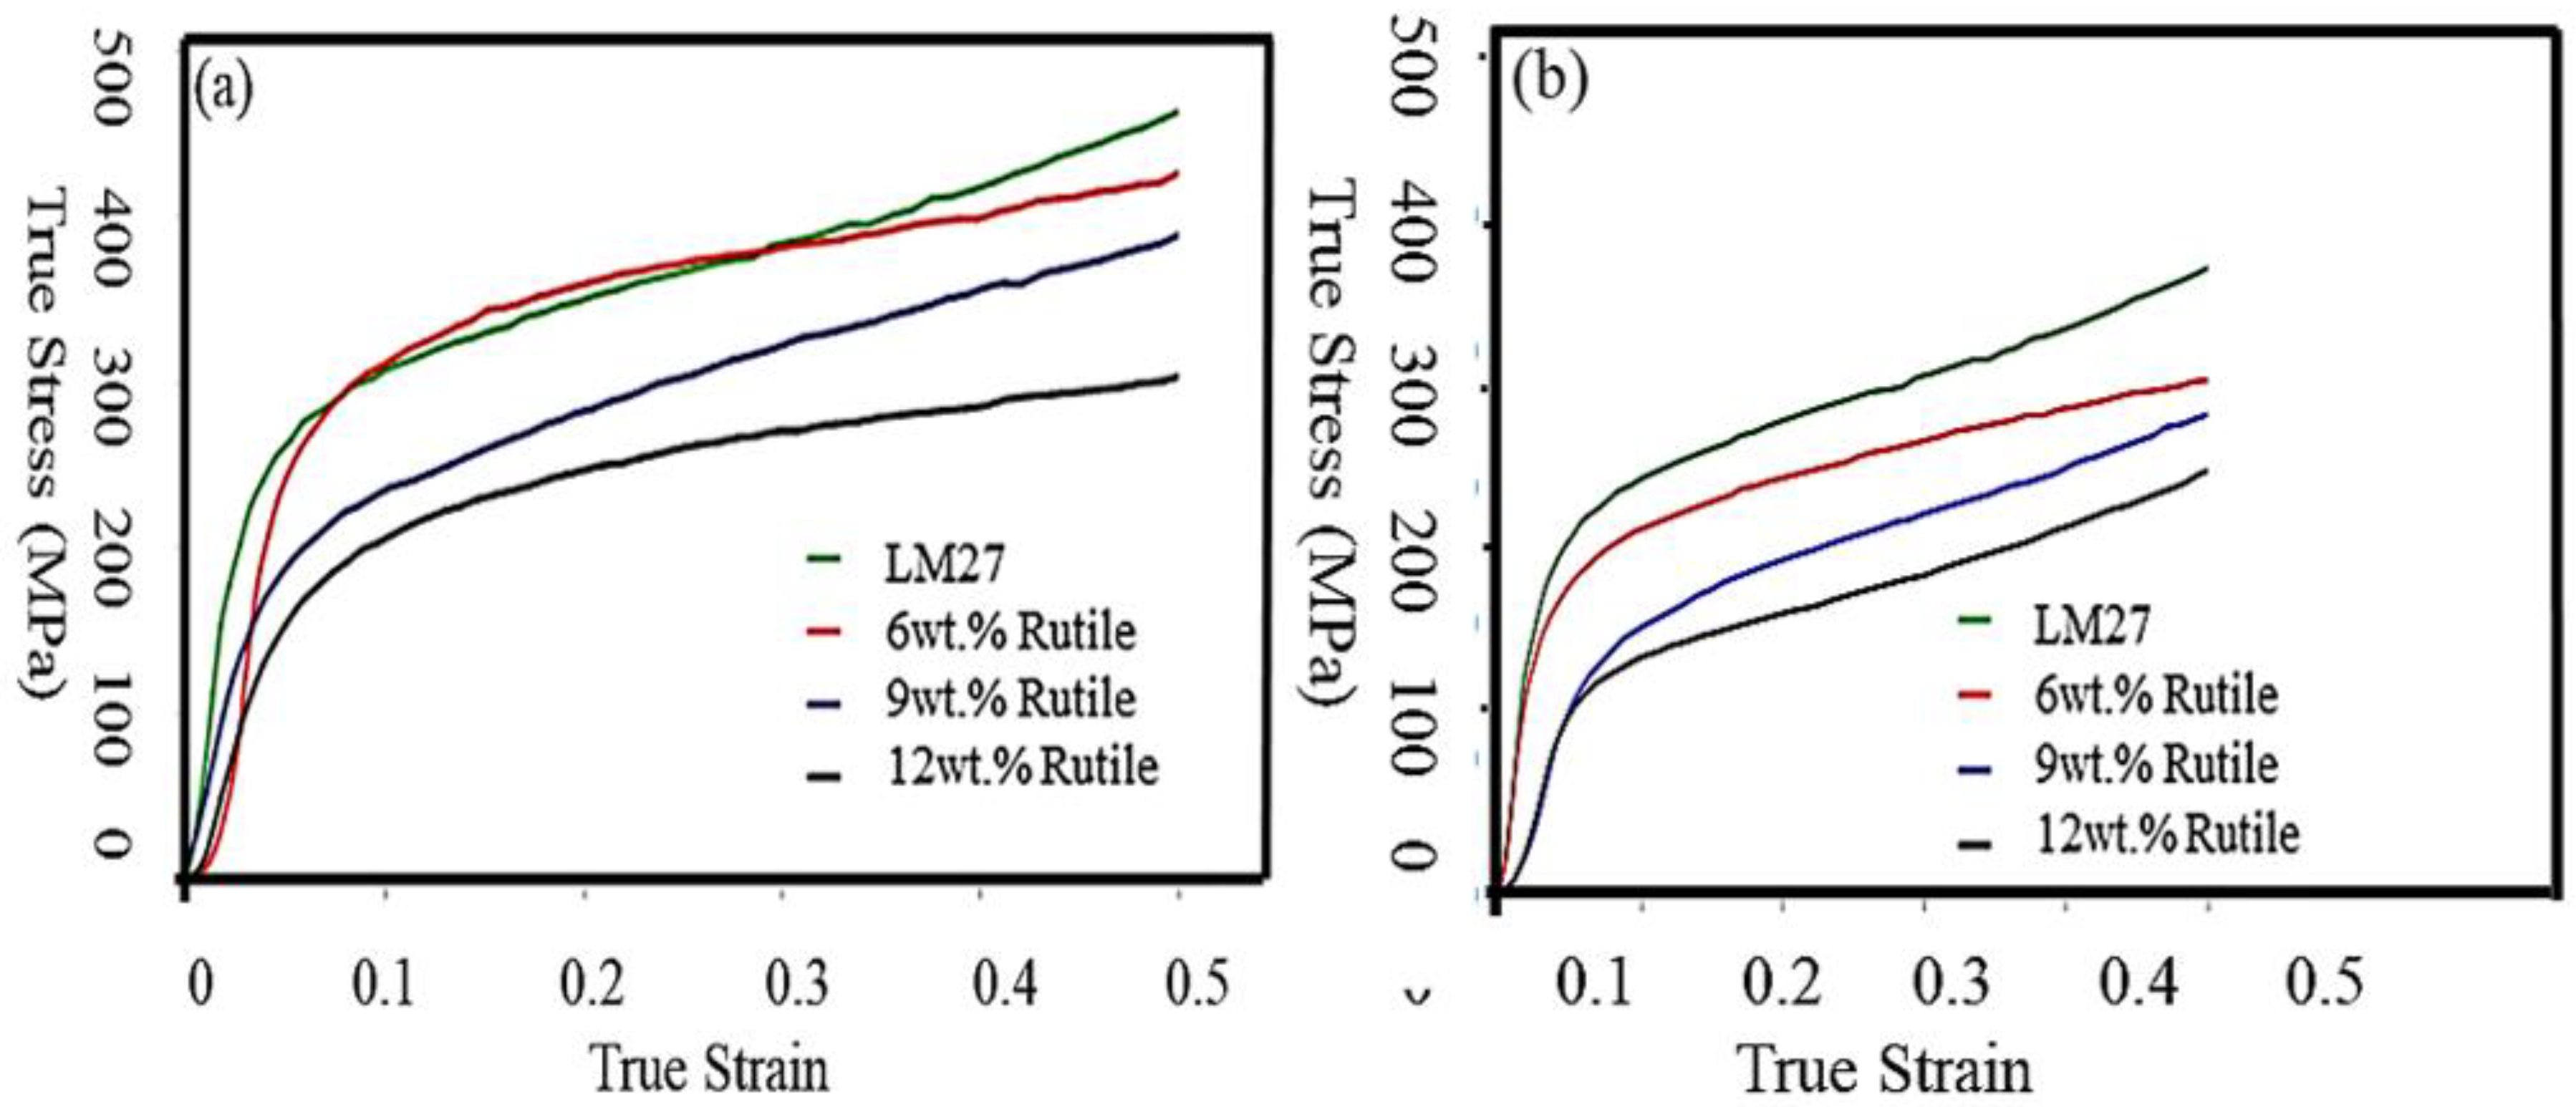
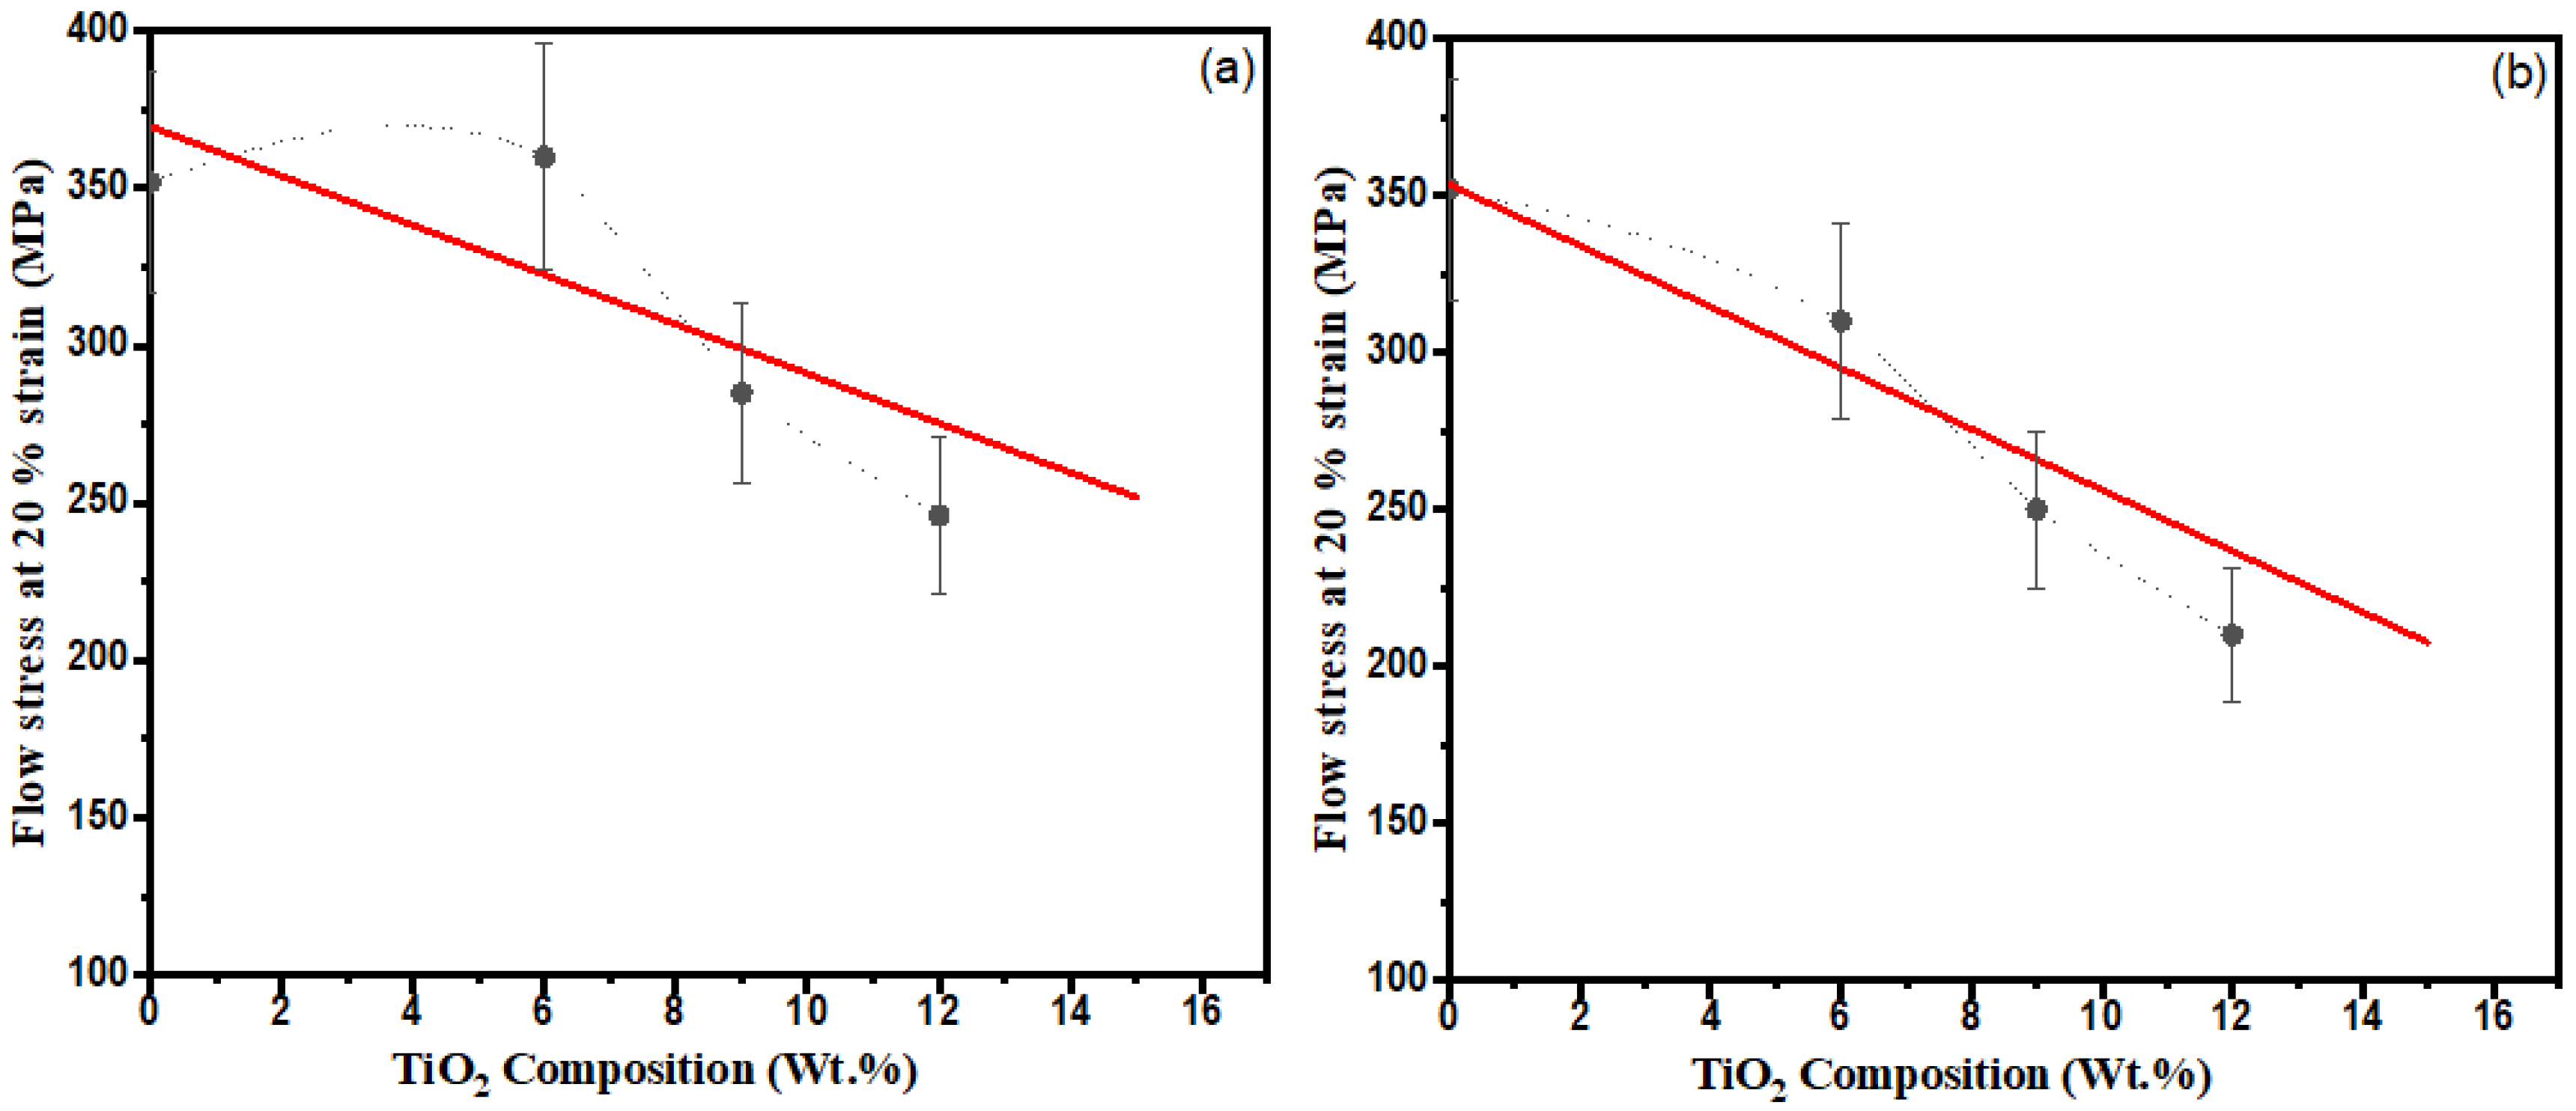
The compressive strength of the prepared composite was found to increase with the increase in the amount of the reinforcement. Stress-strain curves for fine size (50–75 µm) and coarse size (106–125 µm) reinforced particle compositions are shown in Figure 8. It can be observed from these figures that flow stress of the material is decreasing as the reinforced particles content is increasing in the composite [21]. The same trend is observed for both fine and coarse size particle compositions. The stress-strain behaviour of composites is shown in Figure 8, which shows a linear decrease in flow stress with an increase in the composition of rutile particles as shown in Figure 9. For comparison, the stress at 20% proof strain for fine and coarse size particle compositions is shown in Table 4 and Table 5, respectively. From the experimental observation tabulated in Table 4 and Table 5, it is evident that the increase of particle size reduces the compressive strength to the considerable extent which is also supported by the data generated with the addition of TiB2 and B4C in the aluminium matrix [23]. Large size particles are surrounded by the more thickened gas envelopes as well as enhancing the gas shrinkage in the melt. Both of these factors may be contributing towards the enhancement of the porosity volume, which is responsible for the decrease in compressive strength of the composite [24,25,26].
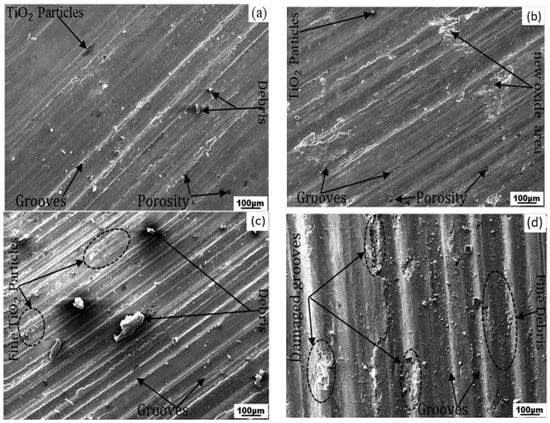
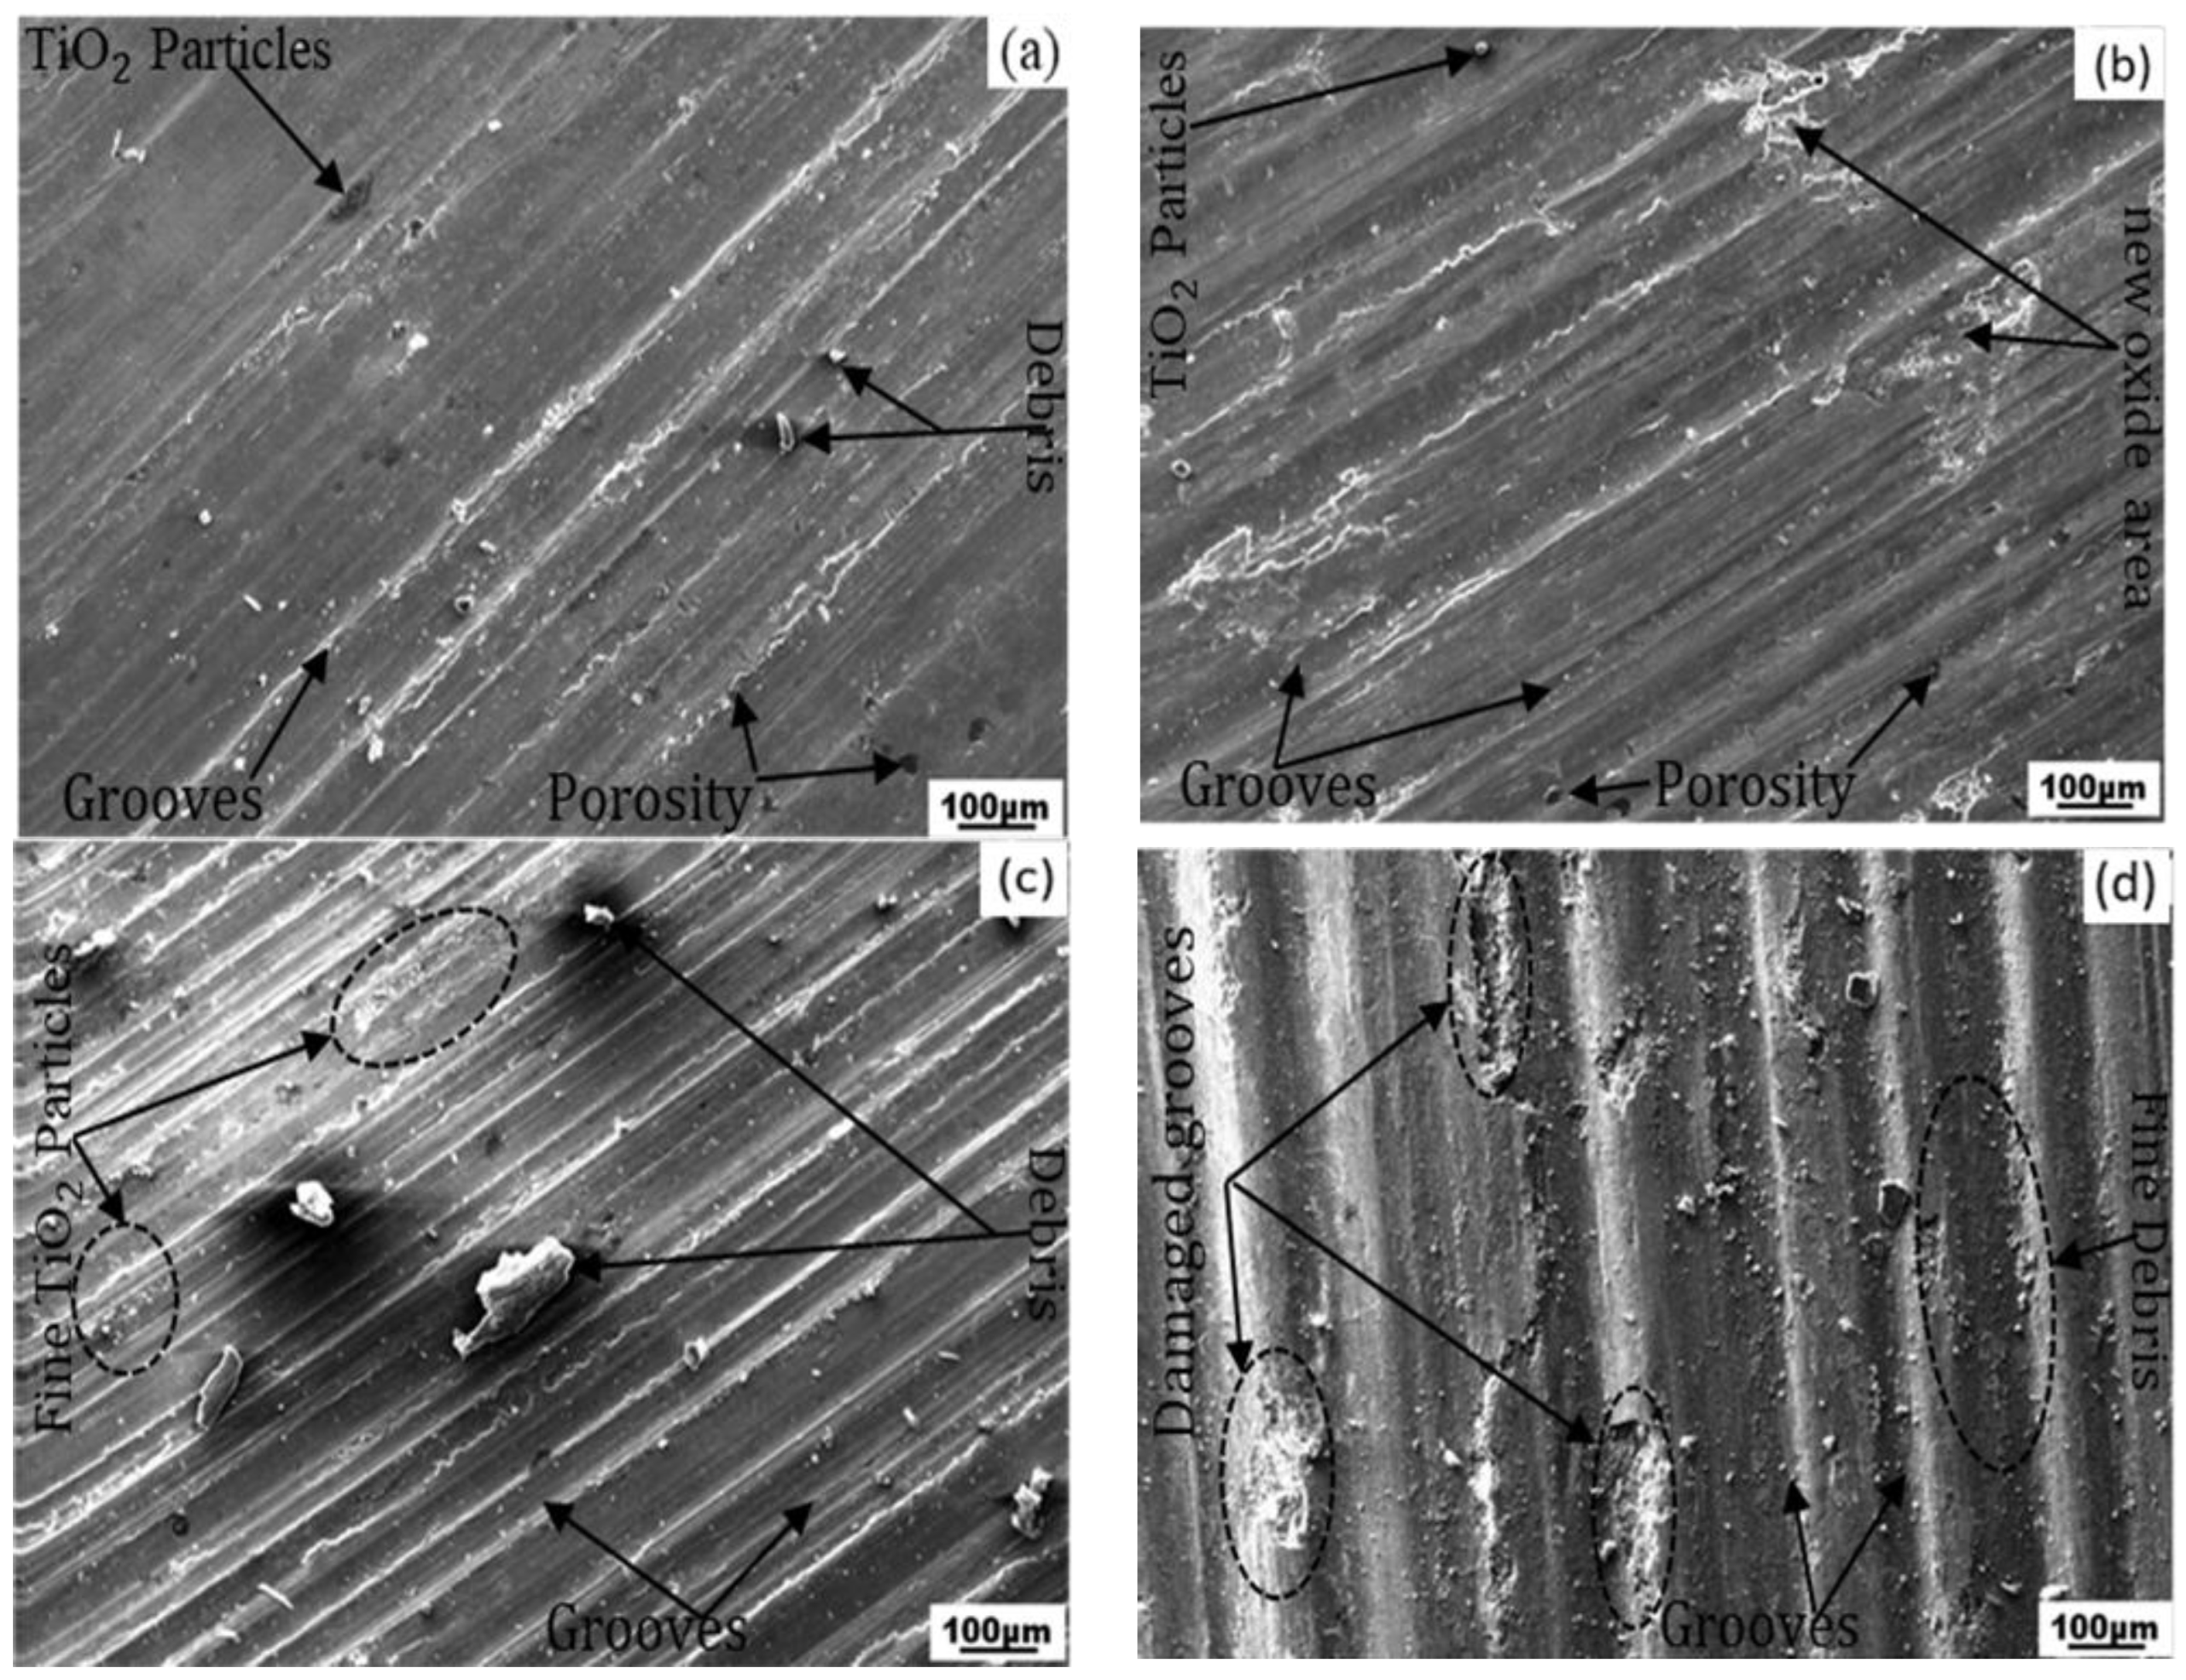
Figure 8.
Wear tracks of (a) composite ‘12F’ (b) composite ‘12C’ at 9.81 N load and (c) composite ‘12F’, (d) composite ‘12C’ at 49.05 N load against sliding distance.
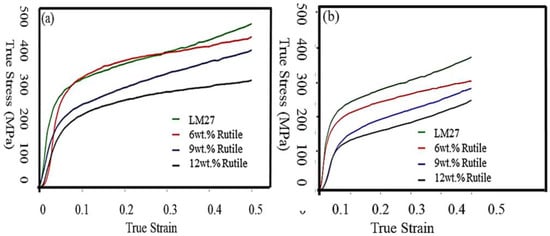
Figure 9.
Stress-strain curves of composite with different reinforced sized (a) fine and (b) coarse particles.
Table 5.
Flow stress comparison for coarse size reinforced compositions.
Thus, from the studies of the compressive strength of different prepared samples, it can be concluded that with an increase in reinforcement volume fraction and size of the particulate, the viscosity of the melt increases, which leads to the increase in the entrapment of gases and thus increased porosity, which is a major controlling factor contributing towards the mechanical properties such as tensile, compressive strength, and hardness of the composite materials. The increase in porosity content with the increase of reinforcement of flash particle reinforced A356 aluminium composites were also quoted by Sudarshan et al. [22]. The volume fraction of porosity and its size and distribution in the cast metal matrix strongly influenced the mechanical behaviour. The increased addition of particulate increased the stirring time as well as gas entrapment and hydrogen evolutions of the melt. Positive correlation had been found with the increase in volume percentage of porosity with the increase in reinforced particulate content incorporation [25,26]. An increase in the volume fraction of particles accelerates the agglomeration or clustering which further increased the size of air pockets between the particles and in turn increased the volume fraction of porosity in the material. Even shrinkage during solidification due to the large difference of thermal conductivity of the material and the rutile particles could also be responsible for the inclusion of porosity. Therefore, it can be concluded from the above results that compressive strength of aluminium alloy decreases with the increased amount of rutile reinforcement, with the exception that is marginal increase with addition of 5 wt.% of fine sized reinforcement.
4.6. Fracture Studies
The fractured surface of composites reinforced with rutile particles of different sizes tested under compressive stress has been studied with scanning electron microscopy (SEM). Figure 9a,b depicts the stress-strain curves for materials deformed in compression with specimens with the same aspect ratios as those in the real world (0.5). A combination of multiple crack formation and specimen buckling is shown in Figure 10a. When the samples were tested above their maximum stress, the compression curves revealed a distinct failure mode [26]. Compared to coarse-reinforced composites, fine-reinforced composites exhibit higher strength in Figure 10. It has been shown that the flow stress causes the cracks to grow in the radial direction of the sample. Compared to coarse-reinforced composite samples, fine-reinforced composite samples have larger distances between the growth of cracks at the nucleation point. Figure 10a shows a different morphology for the same-sized particles reinforced with the same type of material.
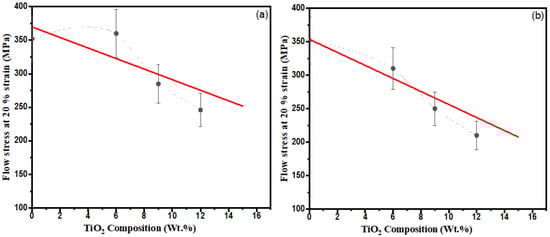
Figure 10.
Flow stress comparison for different composition of (a) fine and (b) coarse size rutile particle compositions.
In addition to the radial crack, peripheral cracks, as shown in Figure 11b, cause an increase in the stress for failure due to an increase in the force per unit per area. The formation of interfacial micro-voids, which disturbs the stress concentration in the composite sample, is influenced by the variation in reinforced particle size [27]. At the matrix-particle interface, voids form as a result of deformation. The higher stress concentration in the voids causes the sample to fracture. This localized stress increases the likelihood of microvoids forming when internal fracturing occurs for the first time. As a result, a reduced cross-section occurs at these locations. Until a fracture occurs, these microvoids coalesce rapidly. Microvoids coalescence is a term commonly used to describe this process of forming small holes in materials and then filling them in. As the larger crack grows, the process of microvoid coalescence continues [20]. Compared to fine-sized reinforced composites, Figure 11b shows a higher volume fraction of the crack network (Figure 11a).
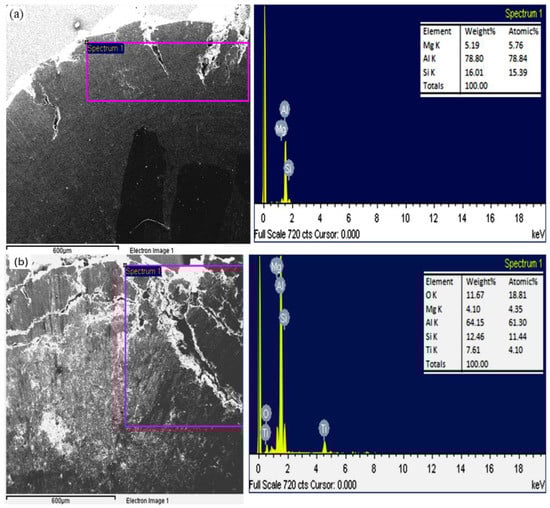
Figure 11.
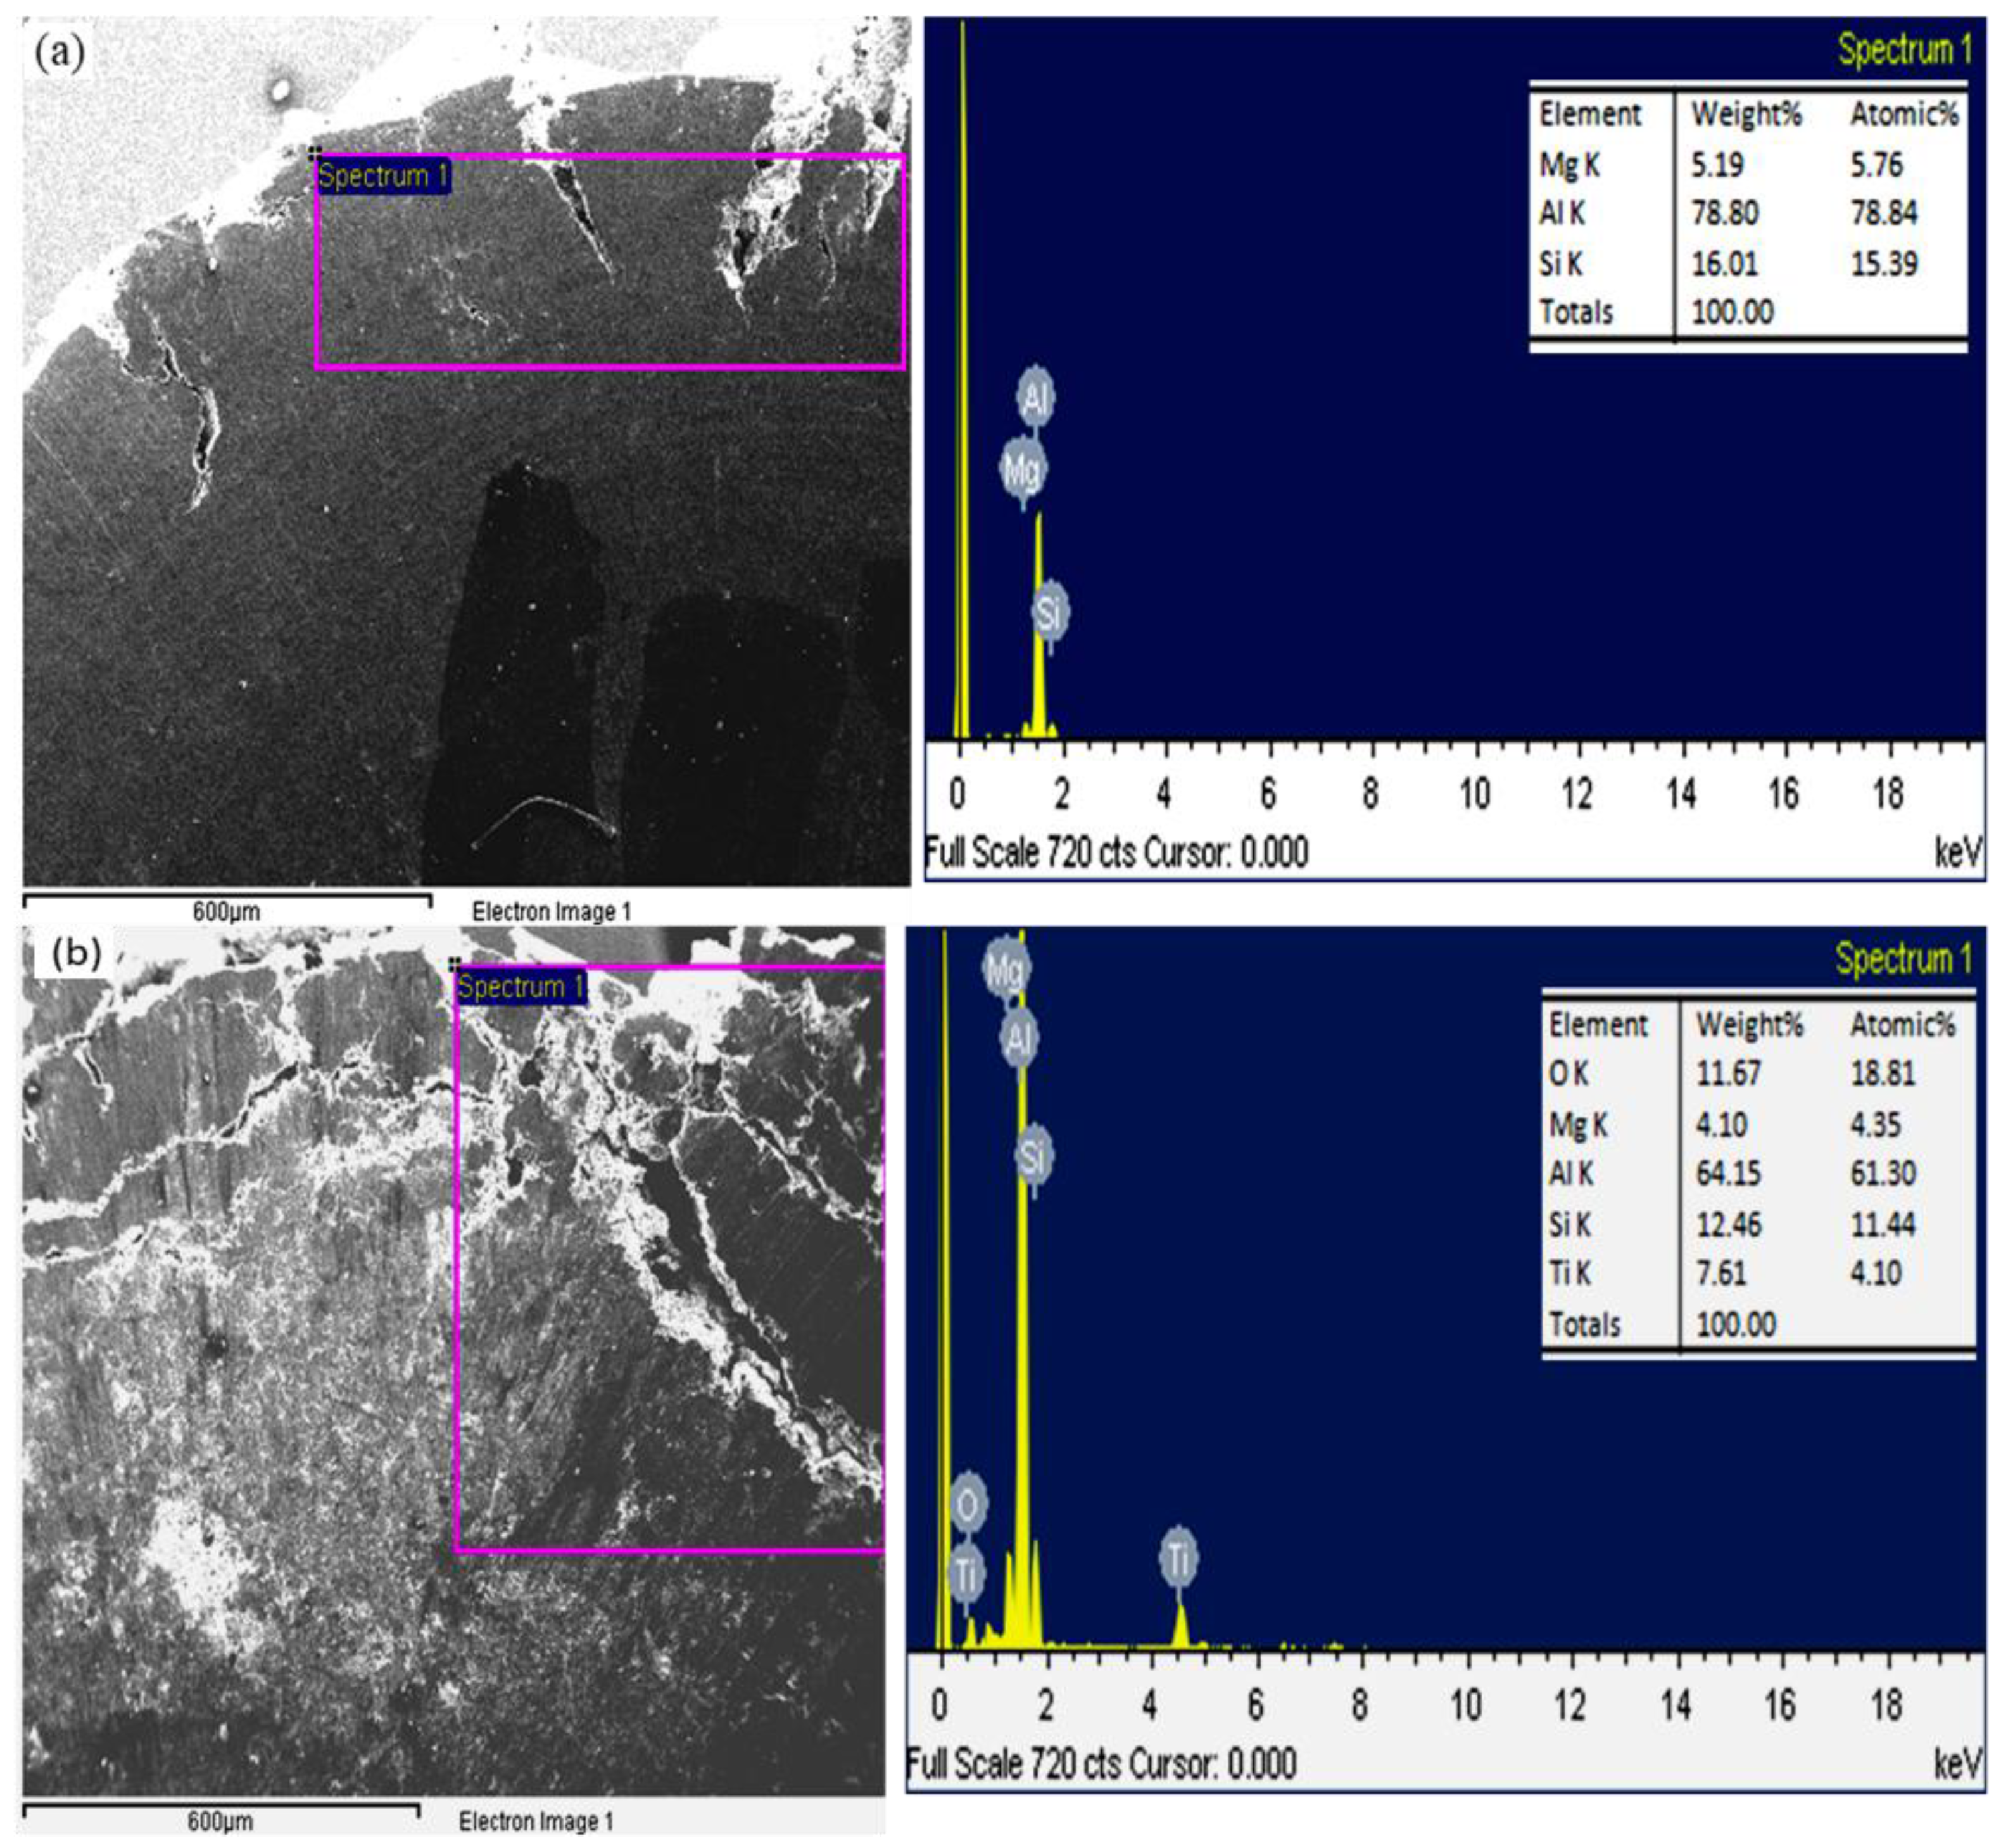
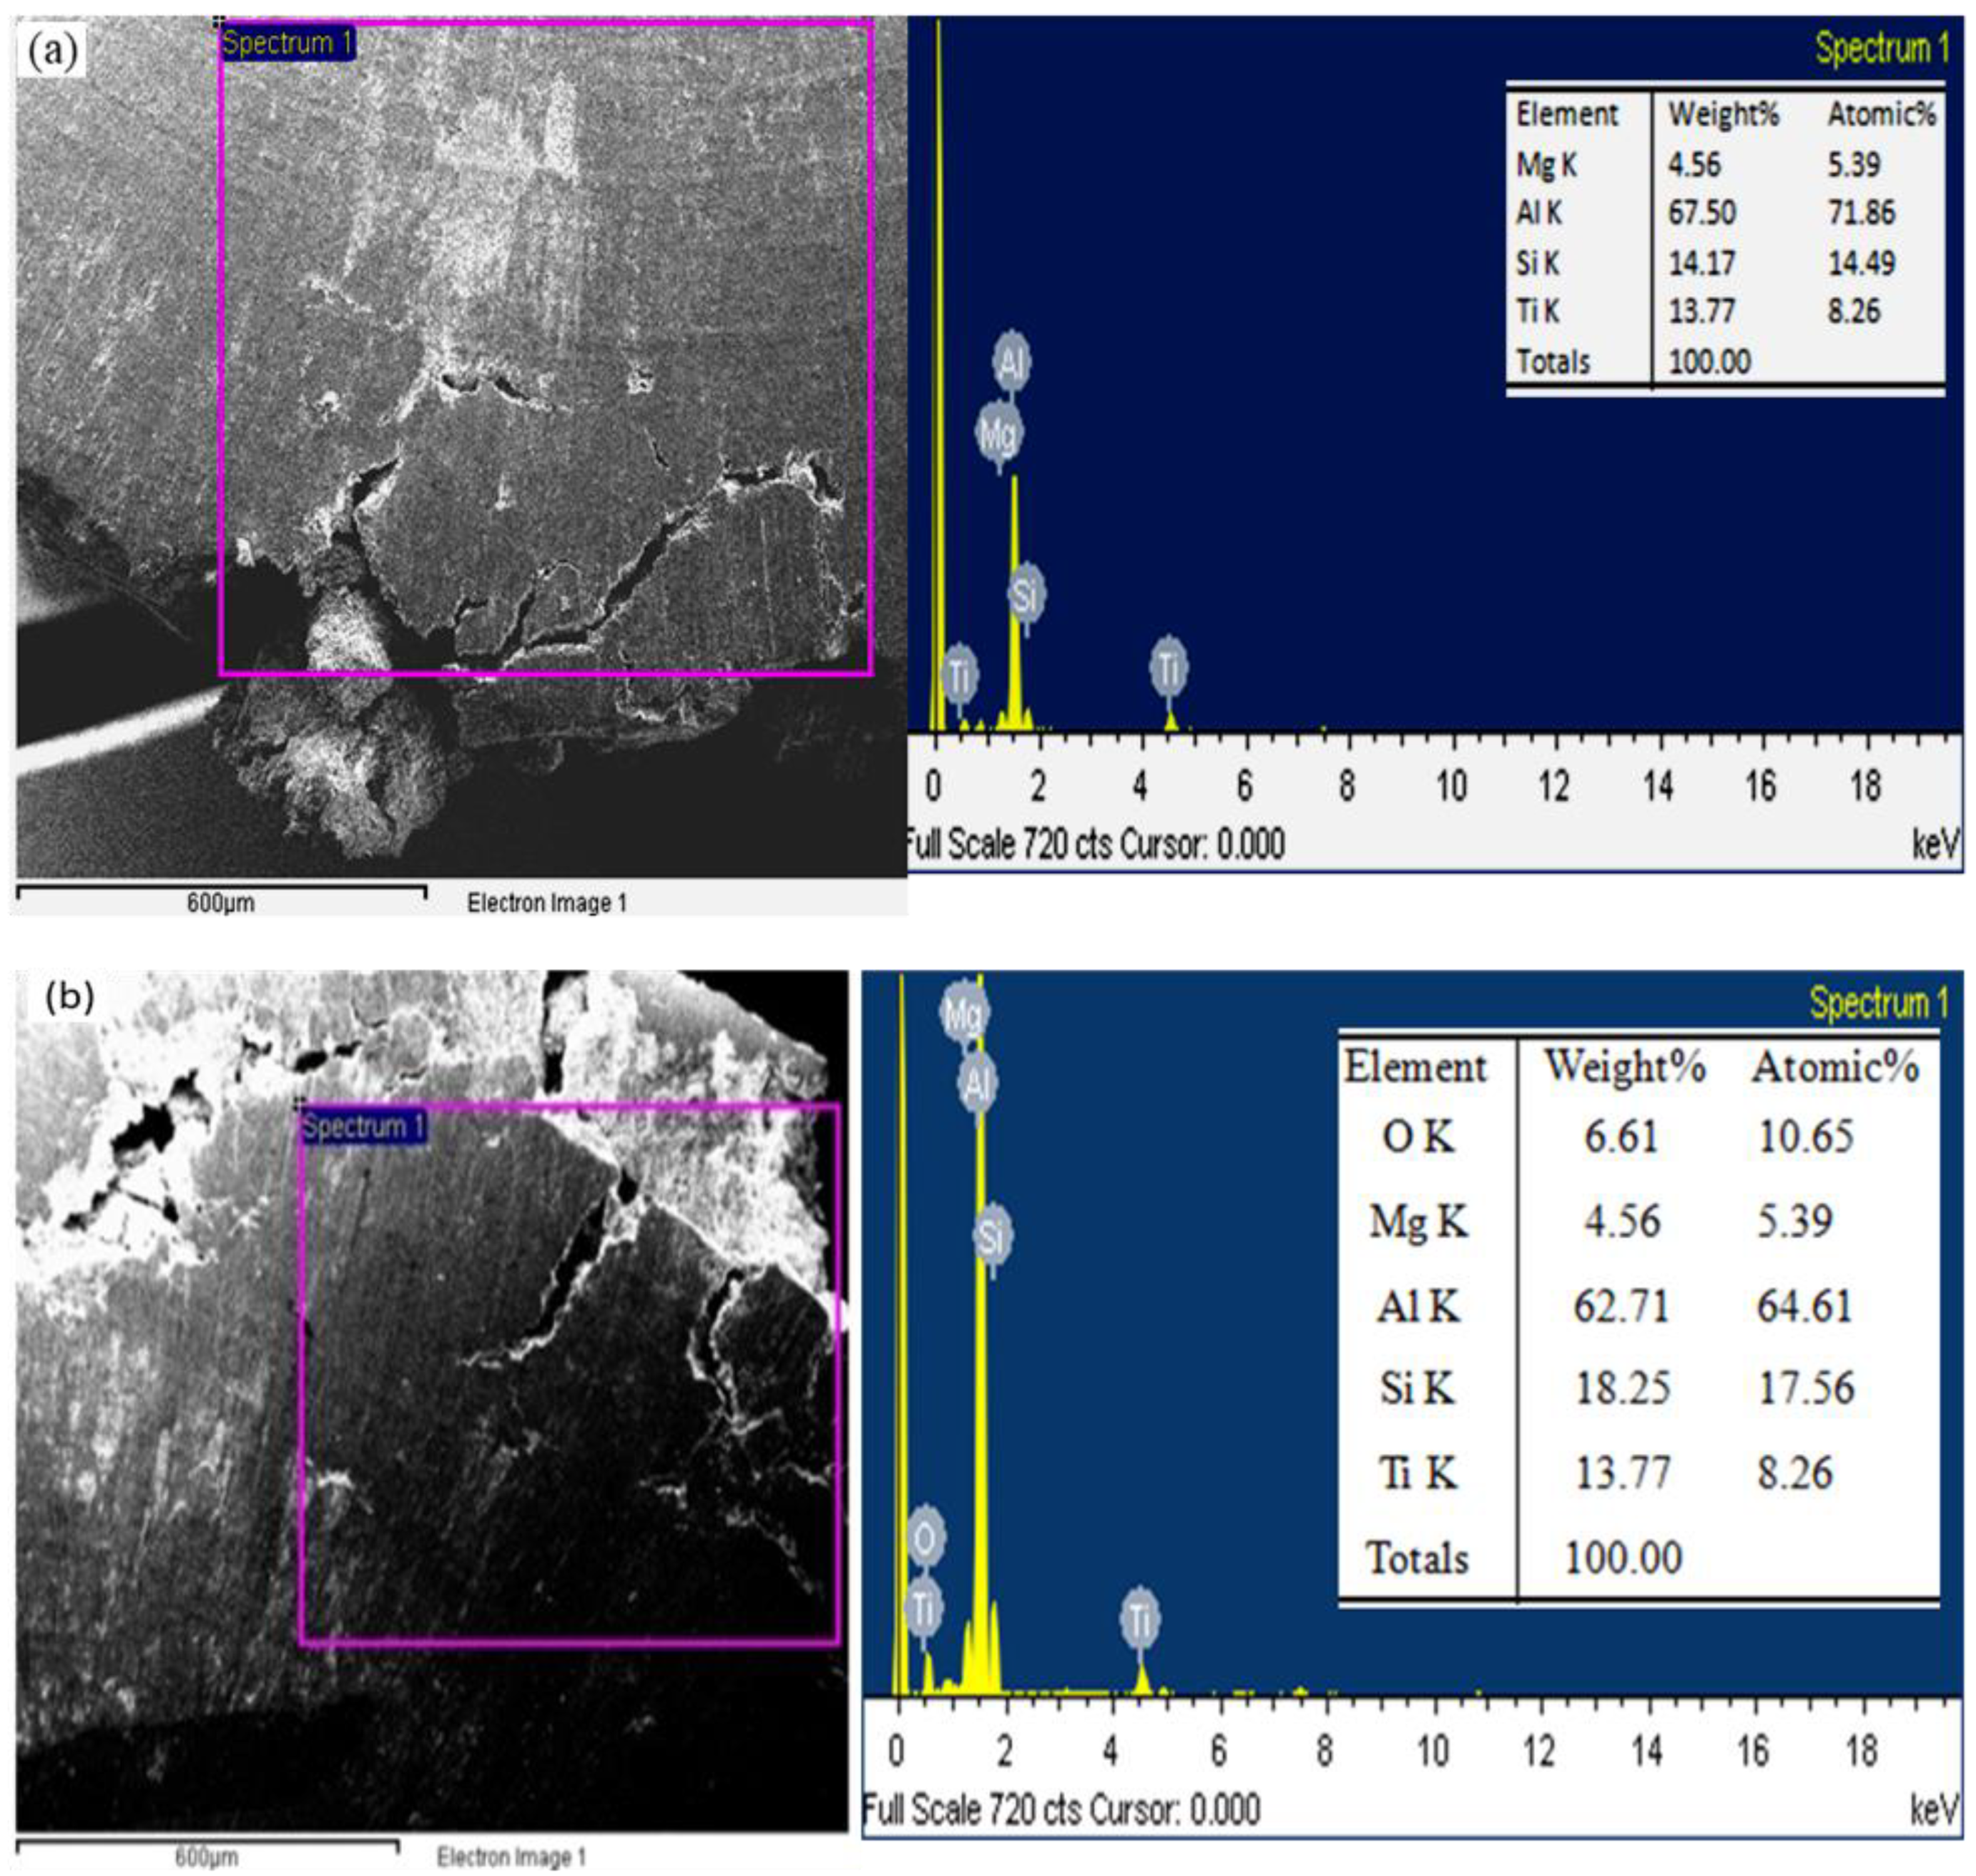
Failure analysis of compressive strength of composite with different reinforced size (a) composite ‘6F’ and (b) composite ‘6C’ by SEM EDS.
Figure 11b shows the growth of cracks on the disc composite sample’s peripheral surface. For example, as shown in Figure 11a,b, the EDS spectrum reveals the element’s weight percentage (Mg, Al, Si and Ti). The EDS spectra of composite ‘6F’ and composite ‘6C’ show a significant difference in oxygen content. Newly formed cracks are covered in an oxide layer. Further evidence suggests that multiple cracks are present in the coarse-sized reinforced composite ‘6C’. Composite ‘9C’ exhibits this characteristic as well, as can be seen (Figure 12b). Increasing strength is made possible in all cases by the lack of oxygen in small reinforced particles (Figure 12a). The particle-matrix interfacial bonding properties of Mg and Ti are powerful. Interfacial bonding is responsible for the sample’s easy flow stress if there are no gaps at the particle-matrix interface [24]. Although composite ‘C’ samples have lower flow stress values than ‘F’ composites, this does not necessarily mean that the composites are weaker. A 0.2 percent offset strain was found to occur at a much higher percentage of the total strain-to-failure in the composite ‘C’ than the composite ‘F’. This behavior occurs because of the influence of rutile particle size variation, shape, agglomeration, and particle-to-particle distance. The particle-matrix interfacial bonding properties of Mg and Ti are powerful. Interfacial bonding is responsible for the sample’s easy flow stress if there are no gaps at the particle-matrix interface [24]. Also, this would indicate that the applied stress on the composite reaches the yield stress with fewer particles damaged. Figure 12b shows a rapid failure of the material after yielding, where the crack’s peripheral growth is more pronounced.
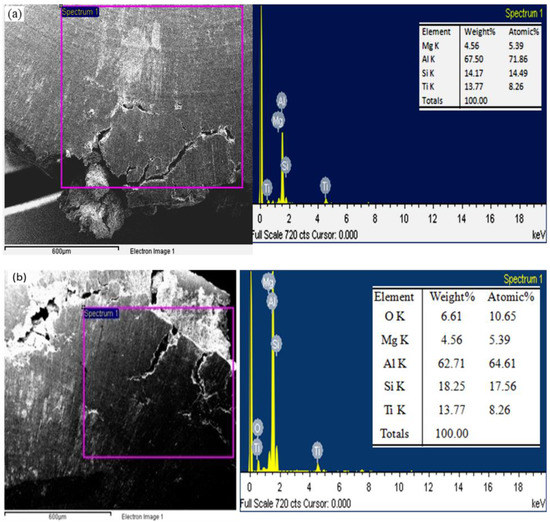
Figure 12.
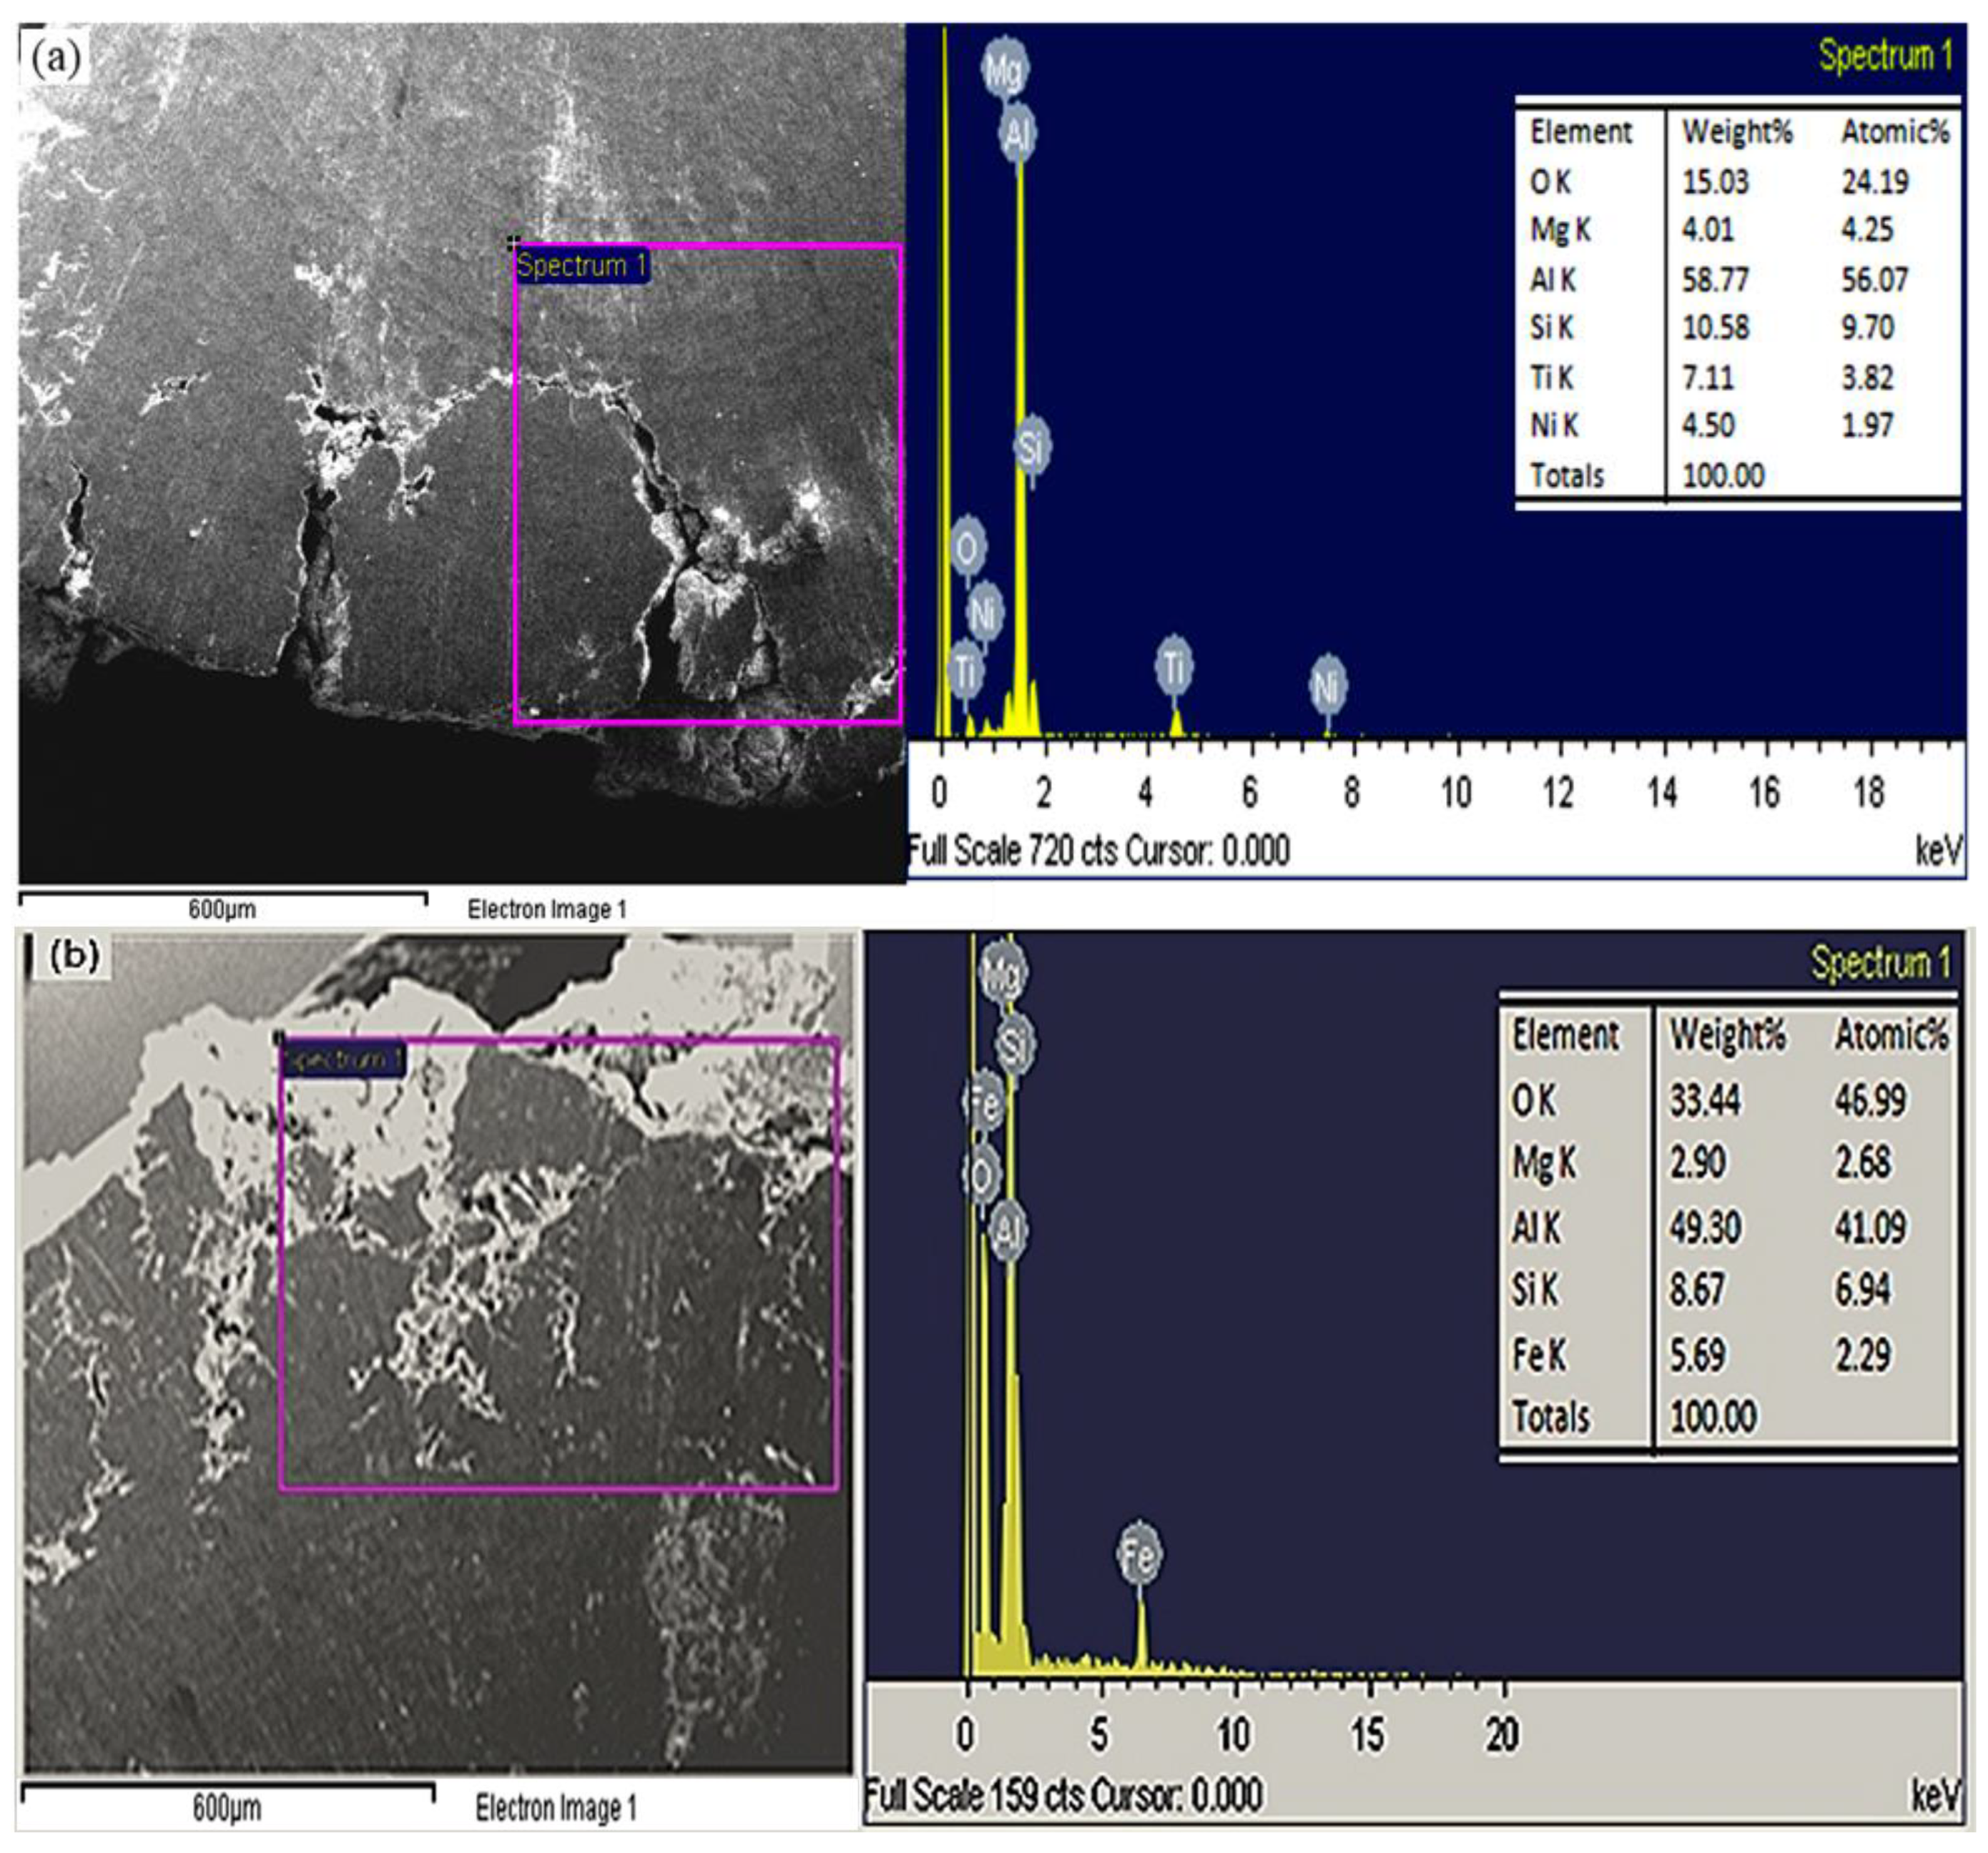
Failure analysis of compressive strength of composite with different reinforced size (a) composite ‘9F’ and (b) composite ‘9C’ by SEM EDS.
As the disc sample gets larger, the number of cracks that spread around the perimeter of the disc increases, and the distance between particles in this sample (composite ‘9C’) decreases. Composite ‘9F’ has a smaller particle-to-particle distance than composite ‘9C’, which has a larger interface area that contributes to the material’s strength. The presence of reinforcement particles dispersed in the matrix material generally affects the mechanical strength of composite materials. Greater dislocation density and smaller grains result in higher local yield stress in the matrix than in the monolithic material. The addition of reinforced particles, which act as nucleation sites during solidification, reduces the matrix grain size. By rearranging dislocations into boundaries within the grain, subgrains are formed that reduce grain size. Due to the smaller grain size, more nucleation sites are present in the composite 12F than in the composite 12C. Subgrains form around rutile particles in grains with high dislocation densities. For dislocations to be rearranged, energy must be released from their matrix at the interface. Aside from that, dislocation motion is impeded by rutile particles. Metal matrix is lighter than reinforced particles [26]. Consequently, local stresses in the matrix may be lower than the applied stress. In addition, as shown in Figure 13a, the rutile particles can support this stress until it grows large enough to cause damage by failure at or near the matrix-particle interface. As a result of the strong interfacial bonding between the rutile particles and the matrix in the composite ‘12F,’ it is anticipated that particle fracture will cause the first wave of damage. A study by Ali Mazahery and Mohsen Ostad Shabani [23] found that the fracture process shifts from matrix-failure-controlled to particle-cracking-controlled when SiC particles are larger than 20 μm. As a result, the stress on the undamaged material increases as more particles are damaged. The microvoids that result from damage can also lead to large-scale cracks in composite materials. Figure 13b shows evidence of both transcrystalline and predominately intercrystalline cracking mechanisms on the surface cracking of composite ‘12C’.

Figure 13.
Failure analysis of compressive strength of composite with different reinforced size (a) composite ‘12F’ and (b) composite ‘12C’ by SEM EDS.
In the presence of rutile particles, unreinforced aluminum alloys are susceptible to particle cracking, matrix debonding, and particle agglomerate decohesion [17]. Composite materials’ ultimate compressive strength can be lowered due to this phenomenon. The last two mechanisms become less significant when the particles are evenly dispersed and tightly bound. Particle cracking greatly affects the ultimate compressive strength of the rutile-reinforced composite materials. A greater risk of cracking occurs with increasing particle size and reinforcement weight. As previously stated, fine rutile particles are less likely to fracture than coarse rutile particles under the same applied stress. Composite ‘6F’ is much more likely to be fractured than ‘12F’ (Figure 11, Figure 12 and Figure 13), which can be seen in the fracture surfaces. There will be less damage from the composite ‘12F’ failure compared to ‘12C’. Some coarse particles contain fine cracks during the manufacturing process, so the propagation crack front preferentially travels through them (Figure 13b). To decohere the particles and matrix, more significant stress is required than is typical for the rutile-aluminum interface. When the material contains fine-grained particles, internal damage is more likely to occur because of the lower stress concentrations [27]. Thus, the ‘12F’ composite has a more excellent ultimate compressive strength because it contains the fine-sized reinforced composite ‘12F’.
5. Conclusions
The experiments were conducted to measure the mechanical and tribological properties with different size and amount of reinforcement of stir cast LM27 alloy composite. From this study the following conclusions can be reached:
- Because of the uniform distribution of the rutile particles in the microstructure of the LM27 alloy composites, the mechanical and tribological properties have been significantly improved.
- Fine size reinforced particles are responsible for the delayed cooling rate near the particles, which restricted the diffusion within the melt and it served as a center for the development of silicon with fuzzy morphological changes.
- This composite has higher microhardness, wear resistance, and compressive strength because the fine-sized rutile reinforcement particles are evenly distributed throughout the matrix. There is a decrease in the wear rate difference observed between composites with different reinforcement size ranges as the loads increase.
- A limited amount of fine size rutile particle addition in the matrix enhances the compressive strength as compared to coarse size rutile particles at the same weight percentage of reinforcement.
- The higher compressive strength is achieved with 6 wt.% fine size reinforced composite material.
- A higher amount of reinforced particle contains higher interfacial micro-voids, which disturbs the stress concentration in the composite. In this condition, the higher stress concentration on the voids is responsible for the nucleation of cracks and their ultimate fracture.
Author Contributions
Conceptualization, P.K.N. and S.K.; methodology, P.K.N.; formal analysis, J.D.S.; investigation, S.K.M.; writing-original draft preparation, P.K.N.; writing—review and editing, S.K.; visualization, S.S.; supervision, H.M.A.H.; All authors have read and agreed to the published version of the manuscript.
Funding
This research received no external funding.
Data Availability Statement
The datasets generated during and/or analysed during the current study are available on request from the corresponding author.
Acknowledgments
The authors are grateful to Ritu Singla, Chairman and Managing Director of Winner Nippon Leatherette Pvt Ltd., a unit of the Raglan Group, for providing various support for this study within our R&D laboratory.
Conflicts of Interest
On behalf of all authors, the corresponding author states that there is no conflict of interest.
References
- Surappa, M.K. Aluminium matrix composites: Challenges and opportunities. Sadhana 2003, 28, 319–334. [Google Scholar] [CrossRef]
- Kumar, S.; Sharma, A.; Arora, A.; Pandey, O.P. The microstructure and wear behaviour of garnet particle reinforced Al matrix composites. J. Mater. Res. Technol. 2019, 8, 5443–5455. [Google Scholar] [CrossRef]
- Prabhu, S.R.; Shettigar, A.K.; Herbert, M.A.; Rao, S.S. Microstructure and mechanical properties of rutile-reinforced AA6061 matrix composites produced via stir casting process. Trans. Nonferr. Met. Soc. China 2019, 29, 2229–2236. [Google Scholar] [CrossRef]
- Shorowordi, K.M.; Laoui, T.; Haseeb, A.S.M.A.; Celis, J.P.; Froyen, L. Microstructure and interface characteristics of B4C, SiC and Al2O3 reinforced Al matrix composites: A comparative study. J. Mater. Process. Technol. 2003, 142, 738–743. [Google Scholar] [CrossRef]
- Sharma, S.C. The sliding wearbehavior of Al6061-garnet particulate composites. Wear 2001, 249, 1036–1045. [Google Scholar] [CrossRef]
- Sharma, S.; Nanda, T.; Pandey, O.P. Heat treatment T4 and T6 effects on the tribological properties of sillimanite mineral-reinforced LM30 aluminium alloy composites at elevated temperatures. Proceed. Int. Mech. Eng. J.-J. Eng. 2022, 236, 946. [Google Scholar] [CrossRef]
- Badran, A.H.; Alamro, T.; Bazuhair, R.W.; Gad El-Mawla, A.A.; El-Adben, S.Z.; Fouly, A. Investigation of the mechanical behavior of synthesized Al6061/TiO2 microcomposites using an innovative stir casting method. J. Nanomater. 2022, 12, 1646. [Google Scholar] [CrossRef]
- Ouyang, J.H.; Li, Y.F.; Zhang, Y.Z.; Wang, Y.M.; Wang, Y.J. High-temperature solid lubricants and self-lubricating composites: A critical review. Lubricants 2022, 10, 177. [Google Scholar] [CrossRef]
- Akbari, M.K.; Baharvandi, H.; Shirvanimoghaddam, K. Tensile and fracture behavior of nano/micro TiB2 particle reinforced casting A356 aluminum alloy composites. Mater. Des. 2015, 66, 150–161. [Google Scholar] [CrossRef]
- Wang, J.; Zafar, M.Q.; Chen, Y.; Pan, P.; Zuo, L.; Zhao, H.; Zhang, X. Tribological properties of brake disc material for a high-speed train and the evolution of debris. Lubricants 2022, 10, 168. [Google Scholar] [CrossRef]
- Kumar, S.; Pandey, R.; Panwar, R.P.; Pandey, O.P. Effect of particle size on wear of particulate reinforced aluminum alloy composites at elevated temperatures. J. Mater. Eng. Perform. 2013, 22, 3550–3560. [Google Scholar] [CrossRef]
- Bhoi, N.K.; Singh, H.; Pratap, S. Developments in the aluminum metal matrix composites reinforced by micro/nano particles-A review. J. Compos. Mater. 2020, 54, 813–833. [Google Scholar] [CrossRef]
- Alagarsamy, S.V.; Ravichandran, M. Synthesis, microstructure and properties of TiO2 reinforced AA7075 matrix composites via stir casting route. Mater. Res. Express. 2019, 6, 6519. [Google Scholar] [CrossRef]
- Rodiouchkina, M.; Berglund, K.; Forsberg, F.; Rodushkin, I.; Hardell, J. Influence of counter surface roughness and lay on the tribological behaviour of self-lubricating bearing materials in dry sliding conditions at high contact pressures. Lubricants 2022, 10, 167. [Google Scholar] [CrossRef]
- Chern, S.Y.; Chen, Y.Y.; Liu, W.L.; Horng, J.H. Contact characteristics at interface in three-body contact conditions with rough surfaces and foreign particles. Lubricants 2022, 10, 164. [Google Scholar] [CrossRef]
- Lhermerout, R.; Perkin, S. The influence of mechanical deformations on surface force measurements. Lubricants 2021, 9, 69. [Google Scholar] [CrossRef]
- Lata, S.; Pandey, A.; Labhansh; Sharma, A.; Meena, K.; Rana, R.; Lal, R. An experimental study and analysis of the mechanical properties of titanium dioxide reinforced aluminum (AA5051) composite. Mater. Today Proceed. 2018, 5, 6090–6097. [Google Scholar] [CrossRef]
- Donelan, P. Modelling microstructural and mechanical properties of ferritic ductile cast iron. Mater. Sci. Technol. 2000, 16, 261–269. [Google Scholar] [CrossRef]
- Petch, N.J. The cleavage strength of polycrystals. J. Iron Steel Inst. 1953, 174, 25–31. [Google Scholar]
- Bonatti, R.S.; Siqueira, R.R.; Padilha, G.S.; Bortolozo, A.D.; Osorio, W.R. Distinct Alp/Sip composites affecting its densification and mechanical behavior. J. Alloys Compd. 2018, 757, 434–447. [Google Scholar] [CrossRef]
- Gnjidic, Z.; Bozic, D.; Mitkov, M. The influence of SiC particles on the compressive properties of metal matrix composites. Mater. Charact. 2001, 47, 129–138. [Google Scholar] [CrossRef]
- Sudarshan; Surappa, M.K. Dry sliding wear of fly ash particle reinforced A356 Al composites. Wear 2008, 265, 349–360. [Google Scholar] [CrossRef]
- Mazahery, A.; Shabani, M.O. Tribological behaviour of semisolid-semisolid compocast Al-Si matrix composites reinforced with TiB2 coated B4C particulates. Ceram. Int. 2012, 38, 1887–1895. [Google Scholar] [CrossRef]
- Wang, B.; Janowski, G.M.; Patterson, B.R. Particle cracking in P/M processed SiC reinforced aluminum matrix composite materials. Metall. Mater. Trans. A 1995, 26A, 2457. [Google Scholar] [CrossRef]
- Doel, T.J.A.; Bowen, P. Tensile properties of particulate reinforced metal matrix composites. Compos. Part A 1996, 27A, 655. [Google Scholar] [CrossRef]
- Rees, D.W.A. Deformation and fracture of metal matrix particulate composites under combined loading. Compos. Part A 1998, 29A, 171. [Google Scholar] [CrossRef]
- Miller, W.S.; Humphreys, F.J. Strengthening mechanisms in metal matrix composites. Scr. Metall. Mater. 1991, 25, 33. [Google Scholar] [CrossRef]
Publisher’s Note: MDPI stays neutral with regard to jurisdictional claims in published maps and institutional affiliations. |
© 2022 by the authors. Licensee MDPI, Basel, Switzerland. This article is an open access article distributed under the terms and conditions of the Creative Commons Attribution (CC BY) license (https://creativecommons.org/licenses/by/4.0/).