Article

Effect of the Applied Voltages on the Corrosion–Wear Behavior of Thermal Spray Al Coating

1
Department of Material Engineering, Ming Chi University of Technology, New Taipei City 243, Taiwan
2
Department of Chemical & Materials Engineering, Chung Cheng Institute of Technology, National Defense University, Dasi, Taoyuan 335, Taiwan
3
System Engineering and Technology Program, National Yang Ming Chiao Tung University, Hsin-Chu 300, Taiwan
4
Casting Technology Section, Metals Processing Research and Development Department, Metal Industries Research and Development Centre, Kaohsiung 811, Taiwan
5
Additive Manufacturing Center, Traditional Industries Innovation Centre (TIIC), Ministry of Economic Affairs (MOEA), Kaohsiung 811, Taiwan
6
Department of Chemical and Materials Engineering, Lunghwa University of Science and Technology, Taoyuan 334, Taiwan
7
Department of Optoelectronics and Materials Technology and Center of Excellence for Ocean Engineering, National Taiwan Ocean University, Keelung 202, Taiwan
8
Environmental Protection Bureau Kaohsiung City Government, Kaohsiung 833, Taiwan
*
Author to whom correspondence should be addressed.
Lubricants 2022, 10(8), 197; https://doi.org/10.3390/lubricants10080197
Submission received: 16 July 2022 / Revised: 12 August 2022 / Accepted: 16 August 2022 / Published: 22 August 2022
(This article belongs to the Special Issue Advances in Surface Engineering and Tribology)

Abstract

:
In this work, an Al coating prepared using the arc spray process was carried out with a corrosion–wear analysis by a block-on-ring system. The interaction of corrosion and wear of coatings in seawater was also investigated. The effect of different corrosion potentials on the corrosion and wear of the coating was discussed, and the structure and corrosion products of the coating were observed by SEM. The results of dynamic potential polarization curves and friction coefficient measurements were used to clarify the corrosion and wear behavior of aluminum coatings in seawater. After quantitative analysis of a corrosion and wear test, it was found that with the increase in polarization potential, the total weight loss of corrosion and wear (Wtotal) of the aluminum coating increased significantly. This means that the corrosion–wear interaction accounts for most of the weight loss of the coating.

1. Introduction

The ocean contains many corrosive elements, including UV explosion, chloride surroundings, frequent dry–wet cycles, high humidity, low temperature, and marine bacteria, as well as microorganisms, which accelerate the corrosion rate and reduce the time of use of structural materials. Taiwan is located in the subtropics, where the weather is high in temperature with strong sunshine, and it is surrounded by the ocean, which causes high humidity and salt content in the air. Therefore, the foundations of any construction and important instruments serving in this environment are threatened by serious corrosion [1,2]. Recently, the use of Al alloys has risen to second place among all metal uses, lower only than steel. Due to their low density and high strength/weight ratio, Al and its alloys have been widely applied in the aerial, automobile, and defense industries. Due to stable prices and the distinct physical properties of low weight, low density, and good thermal and conductive properties, the process technologies and applications of Al have developed quickly, and corrosion and wear resistance can be improved by an anode oxidation process and Ni–Co sealing [3,4].
Thermal spray was employed to modify the coating in the early stage using flame fusion technology or arc fusion technology with Al and Zn wire as feeding materials. With the development of equipment and technologies, thermal spray technology has been used to repair tools and develop a corrosion resistance layer on steel. The thermal spray coating was fabricated by fusing metals, alloy ceramics, polymer powders, or wires and injecting them on the substrate layer by layer in a rate; and it was widely applied in wear, corrosion, thermal, and insulation resistance coatings, as well as recovering coatings [5]. There are many common coatings, including Al-based coatings [6,7,8], Ni-based coatings [9,10], Fe-based alloy coatings [11,12], Co-based alloy coatings [13], and carbide and ceramic coatings [14,15].
In Al-based thermal spray coatings, pure Al and Al–Zn alloy thermal spray coatings have better corrosion resistance than pure Zn thermal spray coatings due to the formation of a thin oxide layer on the surface of Al-based coatings—the greater the coating thickness, the better corrosion resistance of coatings [16,17,18]. Liang et al. [19] studied the exposure of Al materials in sea splash, tide, and full immersion for 2 years. The results showed that the most serious pitting and corrosion occurred at the coatings in full-immersion seawater. The corrosion types included shallow and deep pits, intergranular corrosion, and crystal erosion; however, there was no high corrosion on other sites. The corrosion behavior of a pure Al bulk and its composite materials with catalyst enhancement was studied by salt spray for 100 hr, and the result indicated that the enhanced composite materials had better wear and corrosion resistance [20]. Ding et al. [21] studied the wear behaviors of the 2024 Al alloy in distilled water, artificial seawater, and rainwater, and the results showed that the friction coefficient of the 2024 Al alloy in seawater decreased by 47% compared with that in distilled water, indicating that the 2024 Al alloy formed a lubricating film, which affected the friction coefficient of the 2024 Al alloy.
In addition to thermal spraying technology, there is also the use of high-current pulsed electron beam (HCPEB) technology to prepare cold sprayed aluminum coatings. The results show that the coatings prepared by this technique have the potential to develop anticorrosion and antiwear properties [22]. After preparing a thermally sprayed aluminum layer on a steel substrate and using plasma electrolytic oxidation technology for surface modification, it was found that the wear resistance of the thermally sprayed aluminum layer can be effectively improved [23]. However, the above-mentioned studies only carried out research on the corrosion resistance of thermal sprayed aluminum layers, and the corrosion–wear behaviors that act simultaneously on corrosion and wear in the workpieces are rarely explored in depth. In the marine corrosive environment, the workpiece is often accompanied by corrosion and wear, so the corrosion–wear behavior of related protective coatings is a very important topic that needs to be studied in depth. Moreover, Lee et al. [24,25,26] found that corrosion and wear in metals were mutual; corrosion can accelerate wear, and wear can enhance corrosion to deteriorate metals.
In this study, a pure thermal spray Al coating was prepared on 304 L substrates. Then applying different voltages under seawater, the corrosion–wear characters of thermal spray Al coatings were studied.

2. Experimental Procedures

2.1. Preparation of Substrates

In the present study, a 304 L cylindrical cube with a diameter of 20 mm and a length of 500 mm was degreased by using alcohol, sand-blasted by using Al2O3 to obtain a surface roughness of Ra = 60–80 μm, and preheated to 150 °C in order to enhance the bonding coherence between coating and substrate.

2.2. Thermal Spraying of Al Coatings

An arc-melting technology (Metco 11E, Metalcoat Inc., Jodhpur, India) was employed to manufacture the thermal spray Al coating, with a working current of 260–280 A, a working voltage of 28–30 V, and a pressure of approximately 8 kg/cm2. After the coating process, the coated steel was put into the oven to bake at 70 °C for 15 min and taken out to cool for the following study and analysis.

2.3. Mechanical Properties of the Coatings

The coated samples were cut and glued face-to-face using G1 EpoxyBond 110 (Fadracer Technology Inc., Taipei, Taiwan), mechanically ground with grade 2400 emery paper, and polished by 1 to 0.5 μm diamond pastes. The hardness of the coating was measured directly on the polisher cross section using a micro-Vickers hardness tester (FM series, Taiwan Nakazawa Co., Ltd., New Taipei City, Taiwan) under a 0.1 g loading magnitude and a 15 s loading duration, with 10 points for average. The contact angle tester (Phoenix-Smart M, KYOWA Co., Ltd., Tokyo, Japan) was employed with RO (reverse osmosis) water, 3.5 wt.% NaCl solution, and seawater, respectively, on the coating after the thermal spray Al coating was polished, with the average of four different points taken. The scratch test (Scratch Tester: RST³ (Anton Paar, Graz, Austria)) was used on the polished coating surface, with loading from 0 to 30 N and a length of 5 mm. The scratch of coatings was observed using an optical microscope to find the position of cracks of coating and estimate the critical loading.

2.4. Characterization of the Coatings

A high-resolution XRD (D8 SSS, BRUKER Co., Ltd., Billerica, MA, USA) was used to identify the phases of the spray coating using monochromatic Cu Kα (λ = 1.54439 Å) radiation at 40 kV and 40 mA. A SEM (Hitachi SEM S-3400N, Hitachi High-Tech. Co., Ltd., Tokyo, Japan) was used to observe the microstructures and corrosion morphology of coatings, and the energy dispersive spectrometry (EDS) in the SEM was used to analyze the compositions of the coatings and corrosion products. Moreover, an X-ray photoelectron spectroscopy (XPS, PHI 5000 Versa Probe, ULVAC-PHI, Co., Ltd., Tokyo, Japan) was utilized to analyze the oxide layer of Al spray coatings after the corrosion–wear process. The X-ray photoelectron spectra of samples were calibrated using carbon 1 s (284.6 eV). The surface of each coating was cleaned using Ar+ ion sputtering for 300 s. An optical microscope (OM, Nikon LV150N, Nikon Co., Ltd., Tokyo, Japan) was used to observe the position of cracks of coating during a scratch test.

2.5. Corrosion and Wear Evaluations

The coating was exposed to seawater, and the rotating corrosion tester was used in the present study to examine corrosion and wear. The measured methods, parameters and the schematic diagram of the instrument for corrosion wear are described in detail in our past published literature [24,25]. For the wear test, a sintered Al2O3 bulk with dimensions of 21 × 21 × 21 mm, a surface roughness of 1 μm, and a hardness of 1460 ± 20 Hv as the grinding test sample was employed. The coated specimen was attached to the rotating spindle, which ran at a speed of 200 rpm, a load of 3.92 N, and a test duration of 1200 s. The friction force was measured and recorded by a load cell, and then the friction coefficient was obtained via Equation (1).
μ = F/N
The corrosion behavior of the coating was evaluated using a potentiodynamic polarization test. The electrochemical stripping was conducted via an Zahner Zennium (E 41100, ZAHNER-elektrik GmbH & Co., Kronach, Germany) using a conventional three-electrode cell. The coating with an exposure area of approximately 1.0 cm2 was employed as the working electrode. A platinum plate of 16 cm2 and a saturated calomel electrode (SCE) were used as the counter and reference electrodes, respectively. The test solution for the polarization test was seawater at 25.5–26 °C, with a dissolved oxygen content of 4.5–8.4 mg/L, a Cl concentration of 14,000–24,300 ppm, a pH value of 7.25–8.64, and a conductivity of 38.0–52.5 mΩ/cm. The polarization curve was measured by sweeping the potential from −1000 to 2000 mV relative to the open circuit potential (OCP) or corrosion potential at a scan rate of 0.5 mV/s; the steady OCP of the tested specimen was reached when the potential vibration was less than 5 mV over a time period of 300 s, in this study, the OCP equal to −713 mVSCE. The corrosion evaluation was also conducted at different applied potentials, including −713, −600, −200, and +600 mVSCE.

2.6. Quantitative Analysis of the Mutual Corrosion and Wear

In the corrosion environment, the weight loss of the coating is not only simply the combination of wear and corrosion but also the accelerating effect of corrosion. Therefore, the multi-influence from wear and corrosion is usually the combined action of wear and corrosion.
The total weight loss of the coating is written as Equation (2) [23].
Wtotal = Wwear + Wcorr + ∆Wwear+cor
In Equation (2), Wtotal is the total weight loss from the corrosion test. Wwear is the weight loss from simple wear in seawater, and Wcorr is the weight loss from simple corrosion. Therefore, ∆Wwear+corr is the weight loss from the synergic effect. In order to characterize the origin of the synergic effect, ∆Wwear+corr is further divided into two components, as shown in Equation (3):
Wwear+corr = ∆Wcorr + ∆Wwear
By using Faraday’s law, the weight loss ∆Wcorr arising from the corrosion from the extra increase in corrosion current ∆icorr, again, ∆Wcorr was obtained via Faraday’s law and can be written as Equation (4):
W corr   = M n F × i corr ×   S   ×   t
In Equation (4), M is the equivalent Al molecular weight (g/mole), n is the equivalent number of valence electrons for the oxidation of the Al coating, and ∆icorr is the current density (mA/cm2). Moreover, S (cm2) and t (s) show the surface area of the specimen and testing duration, respectively. Finally, the ∆Wwear component from the mutual effects can be obtained from Equation (5):
Wwear = WtotalWwearWcorr − ∆Wcorr

3. Results

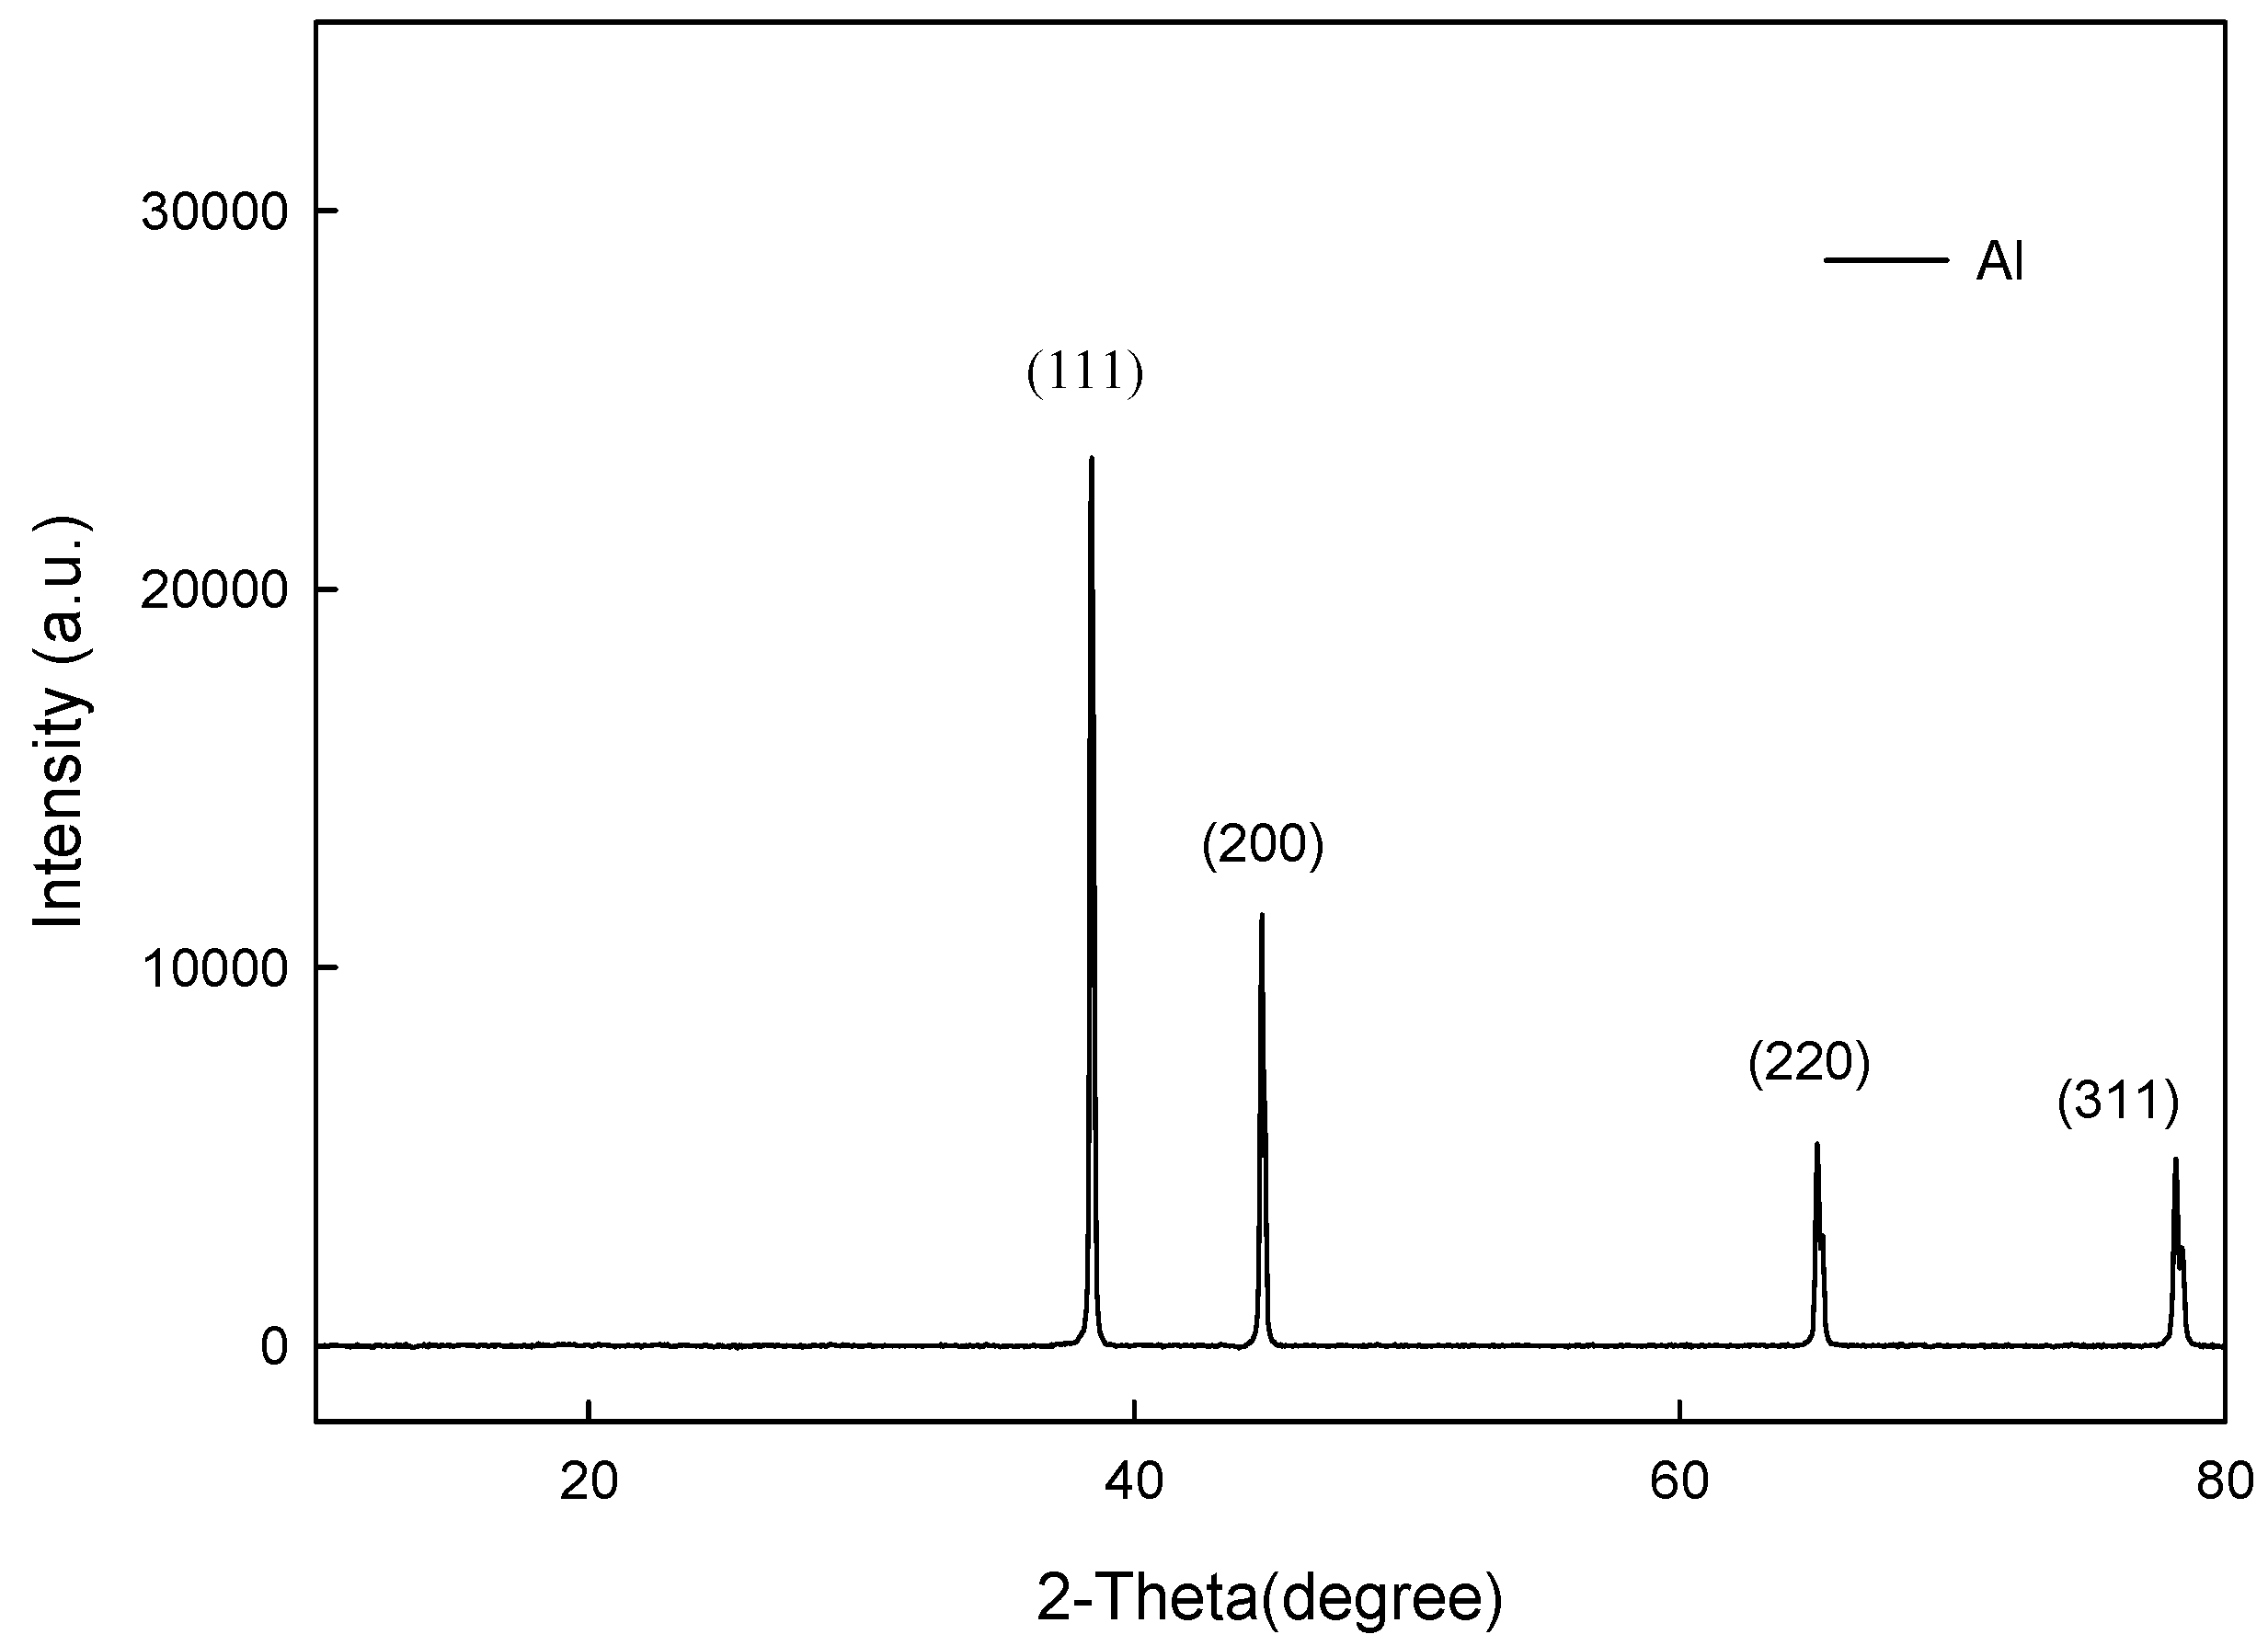
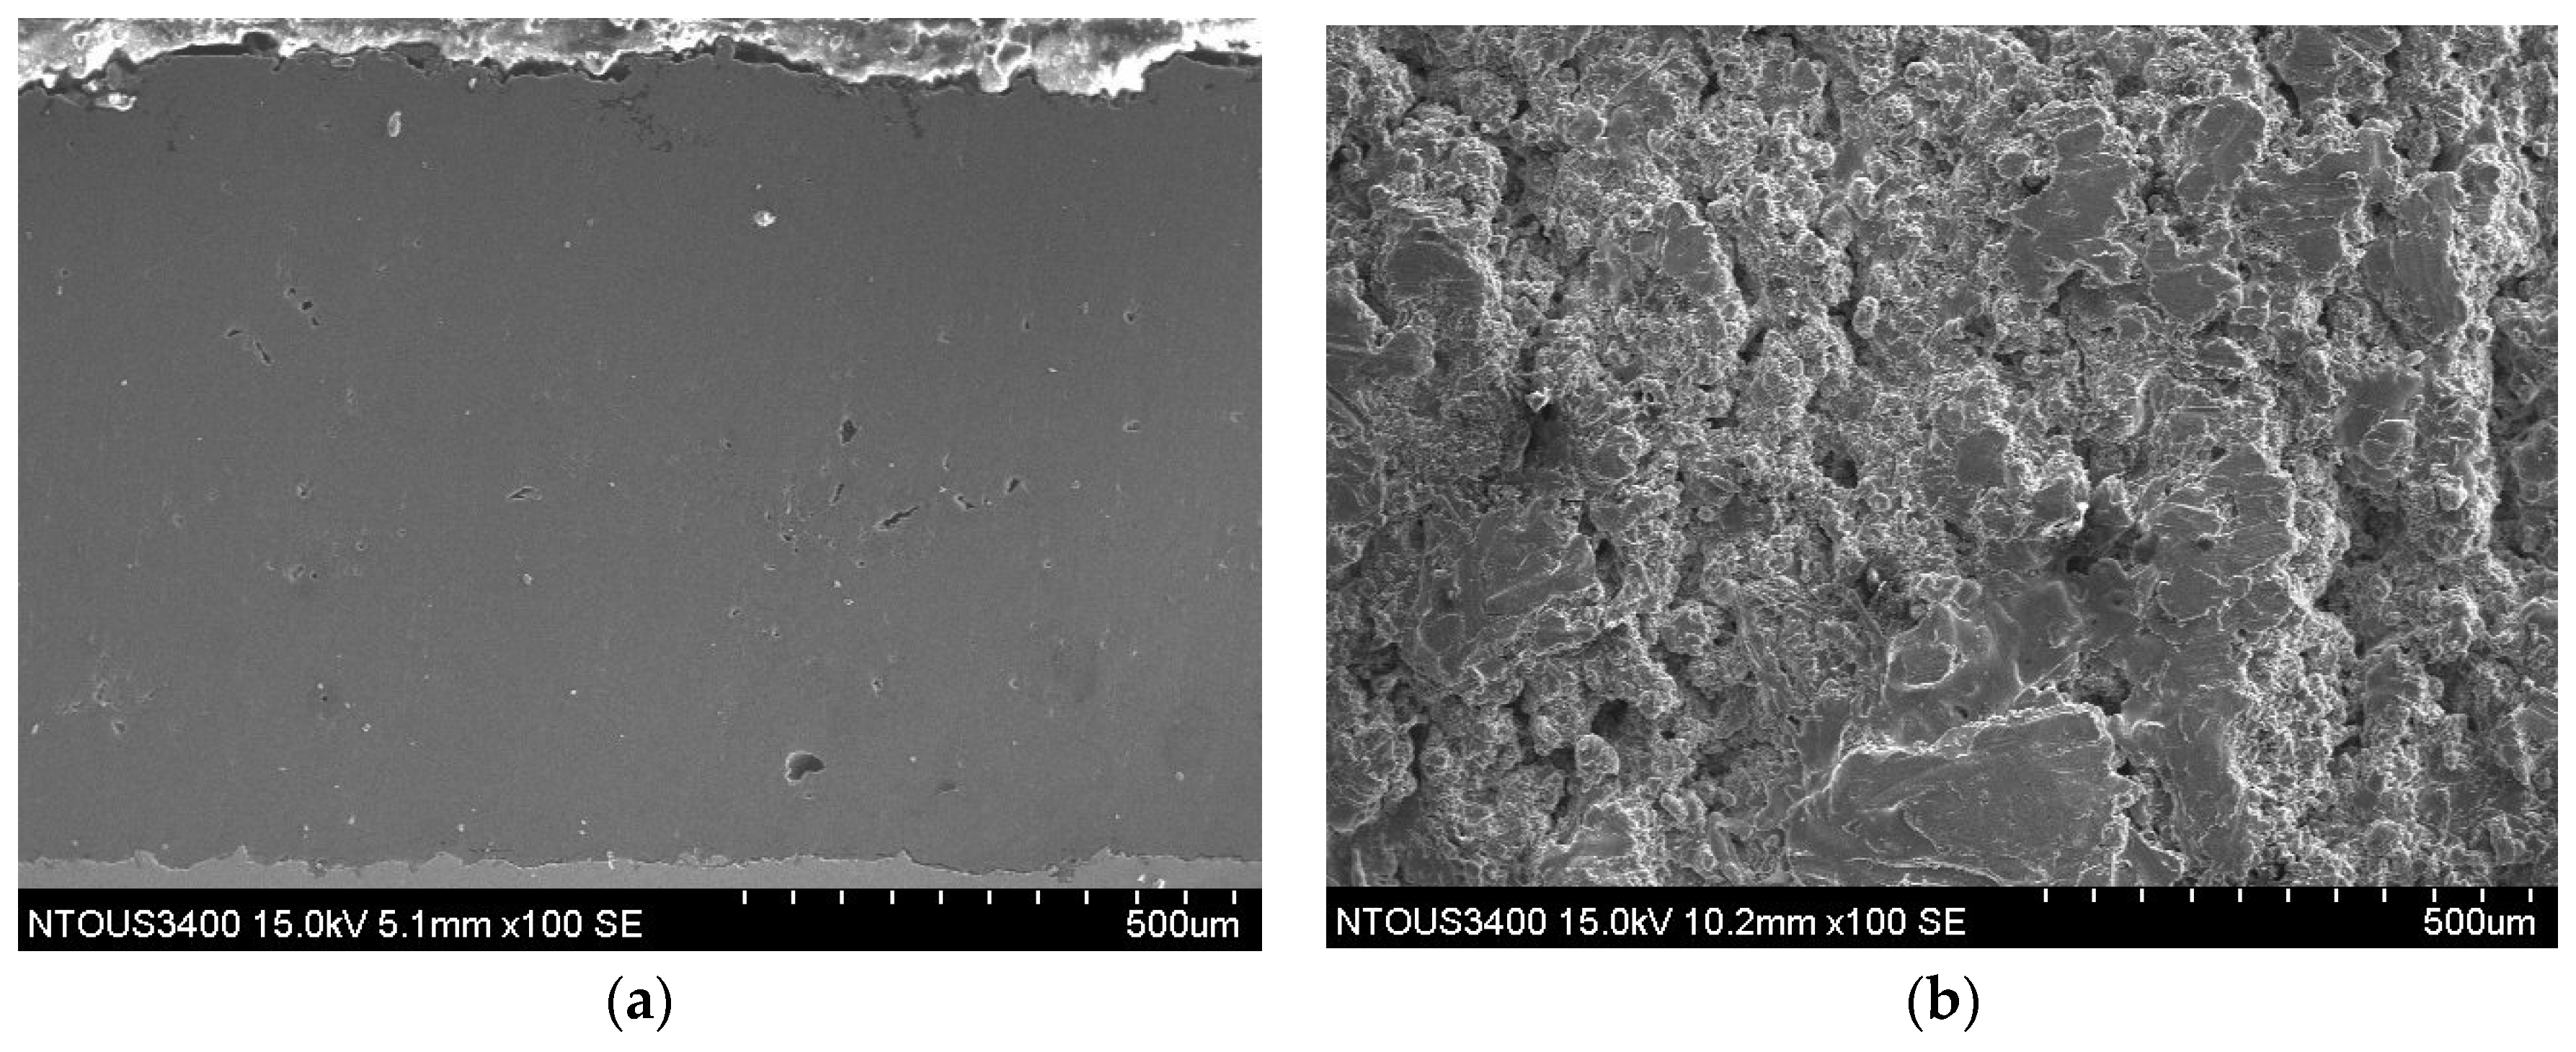
3.1. Microstructures of the Spray Al Coating

Figure 1 presents the XRD pattern of the spray coating of pure Al. The diffraction peaks of (111), (200), (220), and (311) planes are similar to the pure Al powder, and there is not any texture structure in the spray coating.
The SEM cross sectional and surface morphology images of spray coating are shown in Figure 2. Figure 2a shows that there are no obvious cracks at the interface between the coating and the substrate, but many microvoids are formed inside the coating. This is because under the condition of low arc spraying power, the melting of aluminum particles is insufficient, resulting in a loose structure between semiliquid aluminum metals, and when some aluminum particles have a thermal softening temperature close to the melting temperature, it is easy to form aluminum droplets. During the solidification process, due to the release of thermal stress, it is easy to form microcracks near the voids [26]. In Figure 2b, the surface of the spray coating is uneven, and some voids are found. This can be attributed to the accumulation of molten or semimolten metal particles on each other during thermal spraying.
Figure 3 shows the contact angle tests of spray pure Al coating in RO water, 3.5 wt% NaCl solution, and seawater. The average contact angle of the coating in seawater is about 99° to 110°, and in 3.5 wt% NaCl solution, it is about 96° to 102°, while the average contact angle of RO water is about 86° to 94°. This shows that the pure aluminum coating using arc spraying is hydrophobic in seawater and 3.5 wt% NaCl solution, which helps to prevent pollutants and droplets from sticking to the surface of the coating, which is helpful for corrosion resistance.
The SEM and OM images of the scratch test of the spray Al coating are shown in Figure 4a. Figure 4b shows that the scratching profile results were 0 to 1.2 mm, and the slope of the penetrating depth increased, which was consistent with the loose coating surface in the SEM observations. Then, as the applied force (N) increased, the penetrating depth also increased until the surface area was identical and the relative friction coefficient became stable.

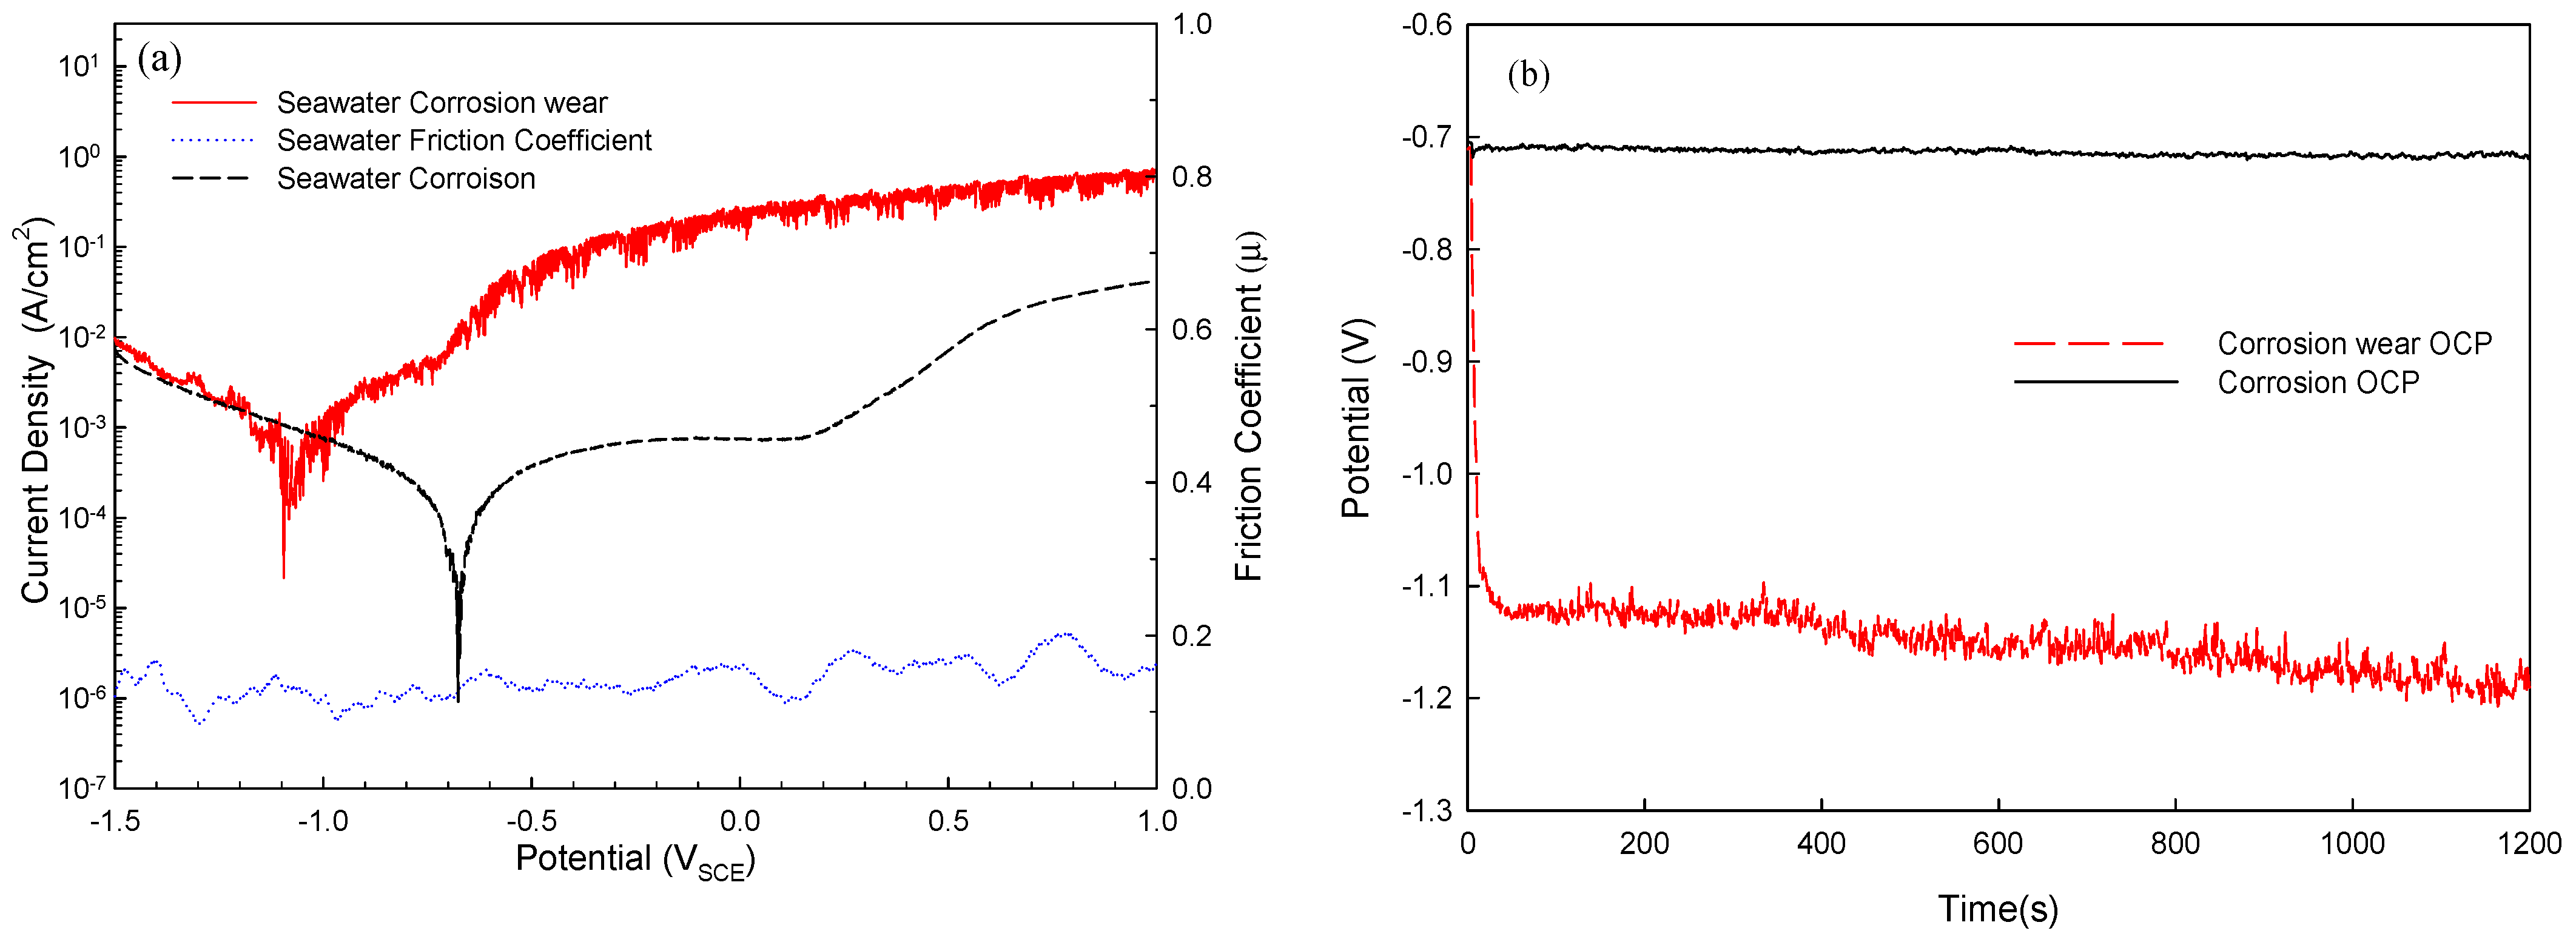
3.2. Electrochemical Analysis of Corrosion and Corrosion–Wear Behavior of Al Coating

In this study, the Tafel extrapolation method was used to calculate the values of icorr; the Tafel slope of anode (βa) and cathode (βc) was estimated from polarization curves. In corrosion, by employing the Stern–Geary equation, quantitative information about corrosion potentials along with corrosion currents can be obtained from the slope of the curves. Figure 5a shows the polarization curve of the corrosion of Al coating and corrosion–wear of Al coating in seawater, and the values of Ecorr, icorr, friction coefficient, and weight loss of specimens are also shown in Table 1 and Table 2. In only the corrosion condition, the corrosion potential and the corrosion current density of spray Al coating are −0.672 VSCE and 57 μA/cm2, which illustrate the corrosion behavior of active→passive→transpassive of spray Al coating under seawater. In the corrosion–wear of Al coating, the corrosion potential and the corrosion current density of spray Al coating are −1.051 VSCE and 459 μA/cm2, and the friction coefficient of Al coating is 0.13 during the corrosion–wear condition. In the corrosion–wear of the Al coating result, there was unclear passive behavior due to the elimination of the oxidation of Al2O3 by continuous wearing, which resulted in an increase in the slope in the anodic polarization zone [26]. In addition, the corrosion and corrosion–wear tests of the aluminum coating were carried out in seawater, respectively. The open circuit potentials of the aluminum coating under the above two conditions were measured to be −0.713 and −1.151 VSCE, respectively, with both corrosion potentials remaining stable within 1200 s (Figure 5b). In the corrosion of Al coating, the corrosion potential is −0.713 VSCE, and the weight loss of coating is 2 mg. In the corrosion–wear of Al coating, the corrosion potential is −1.151 VSCE, the weight loss is 56 mg, and the friction coefficient of coating is 0.14. The corrosion potential in the corrosion of Al coating evaluation was larger than in the corrosion–wear of Al coating evaluation, which demonstrated the interactive effect of corrosion and wear, which caused weight loss in the coating.

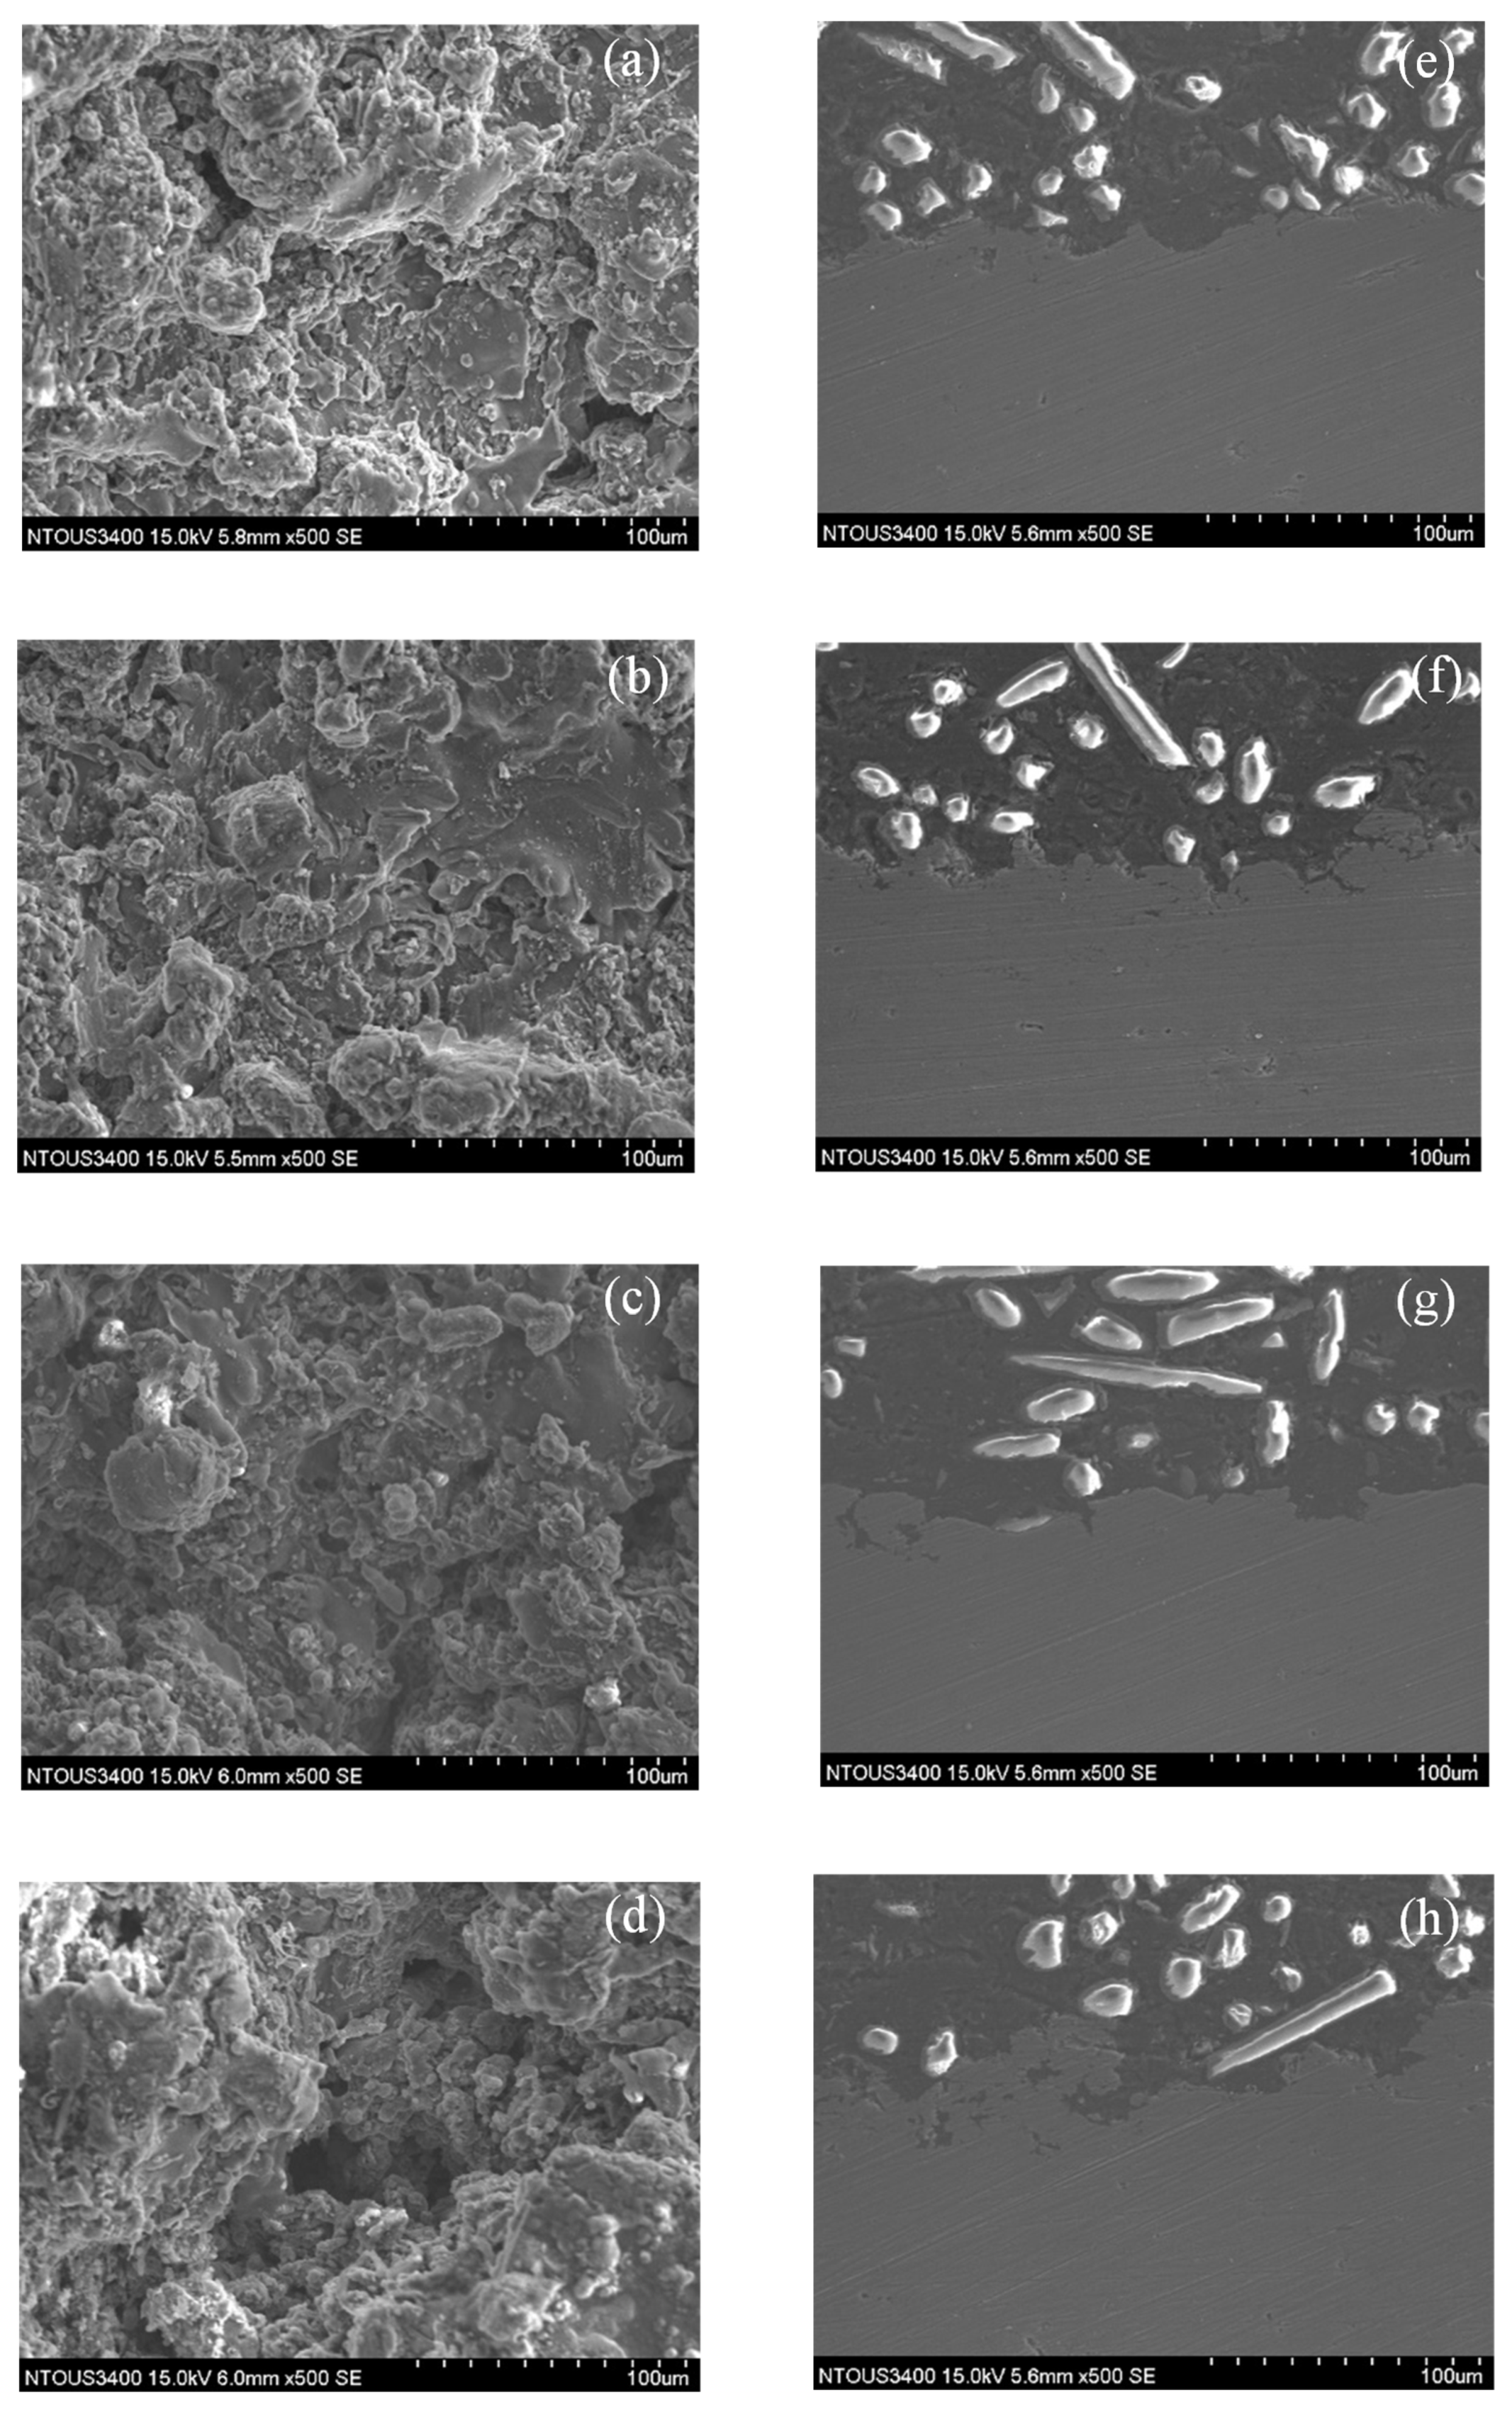
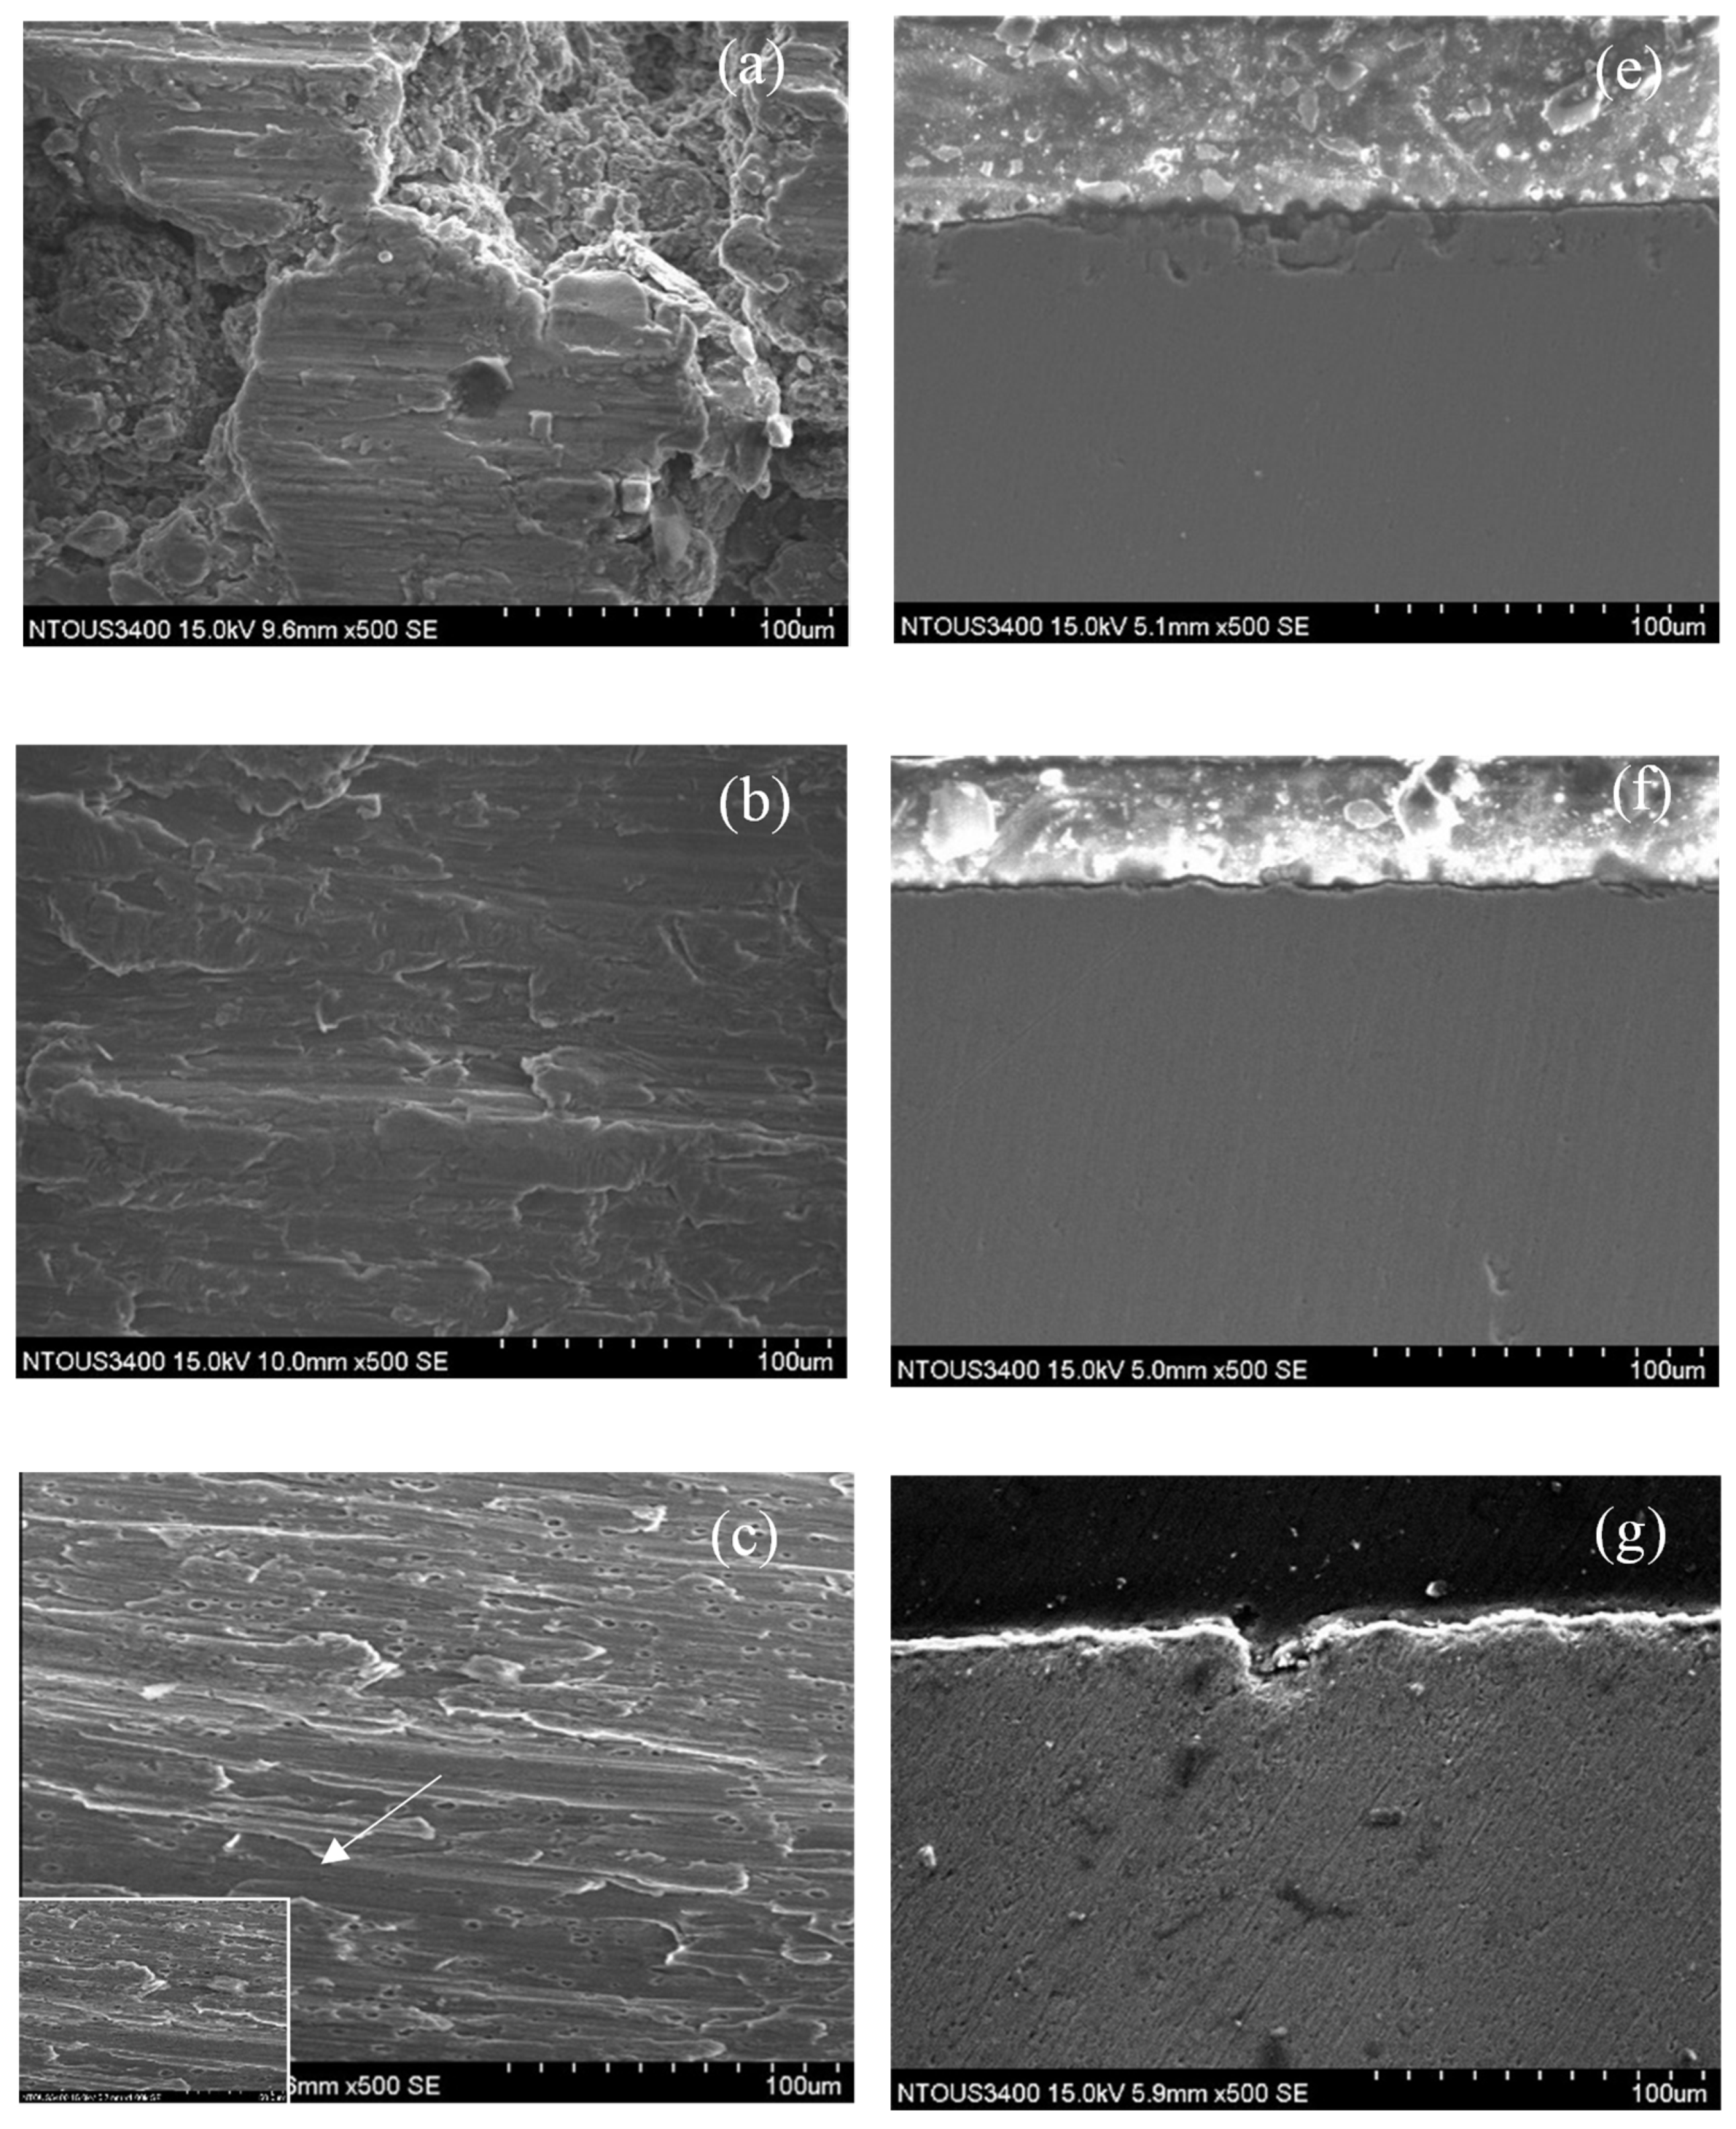
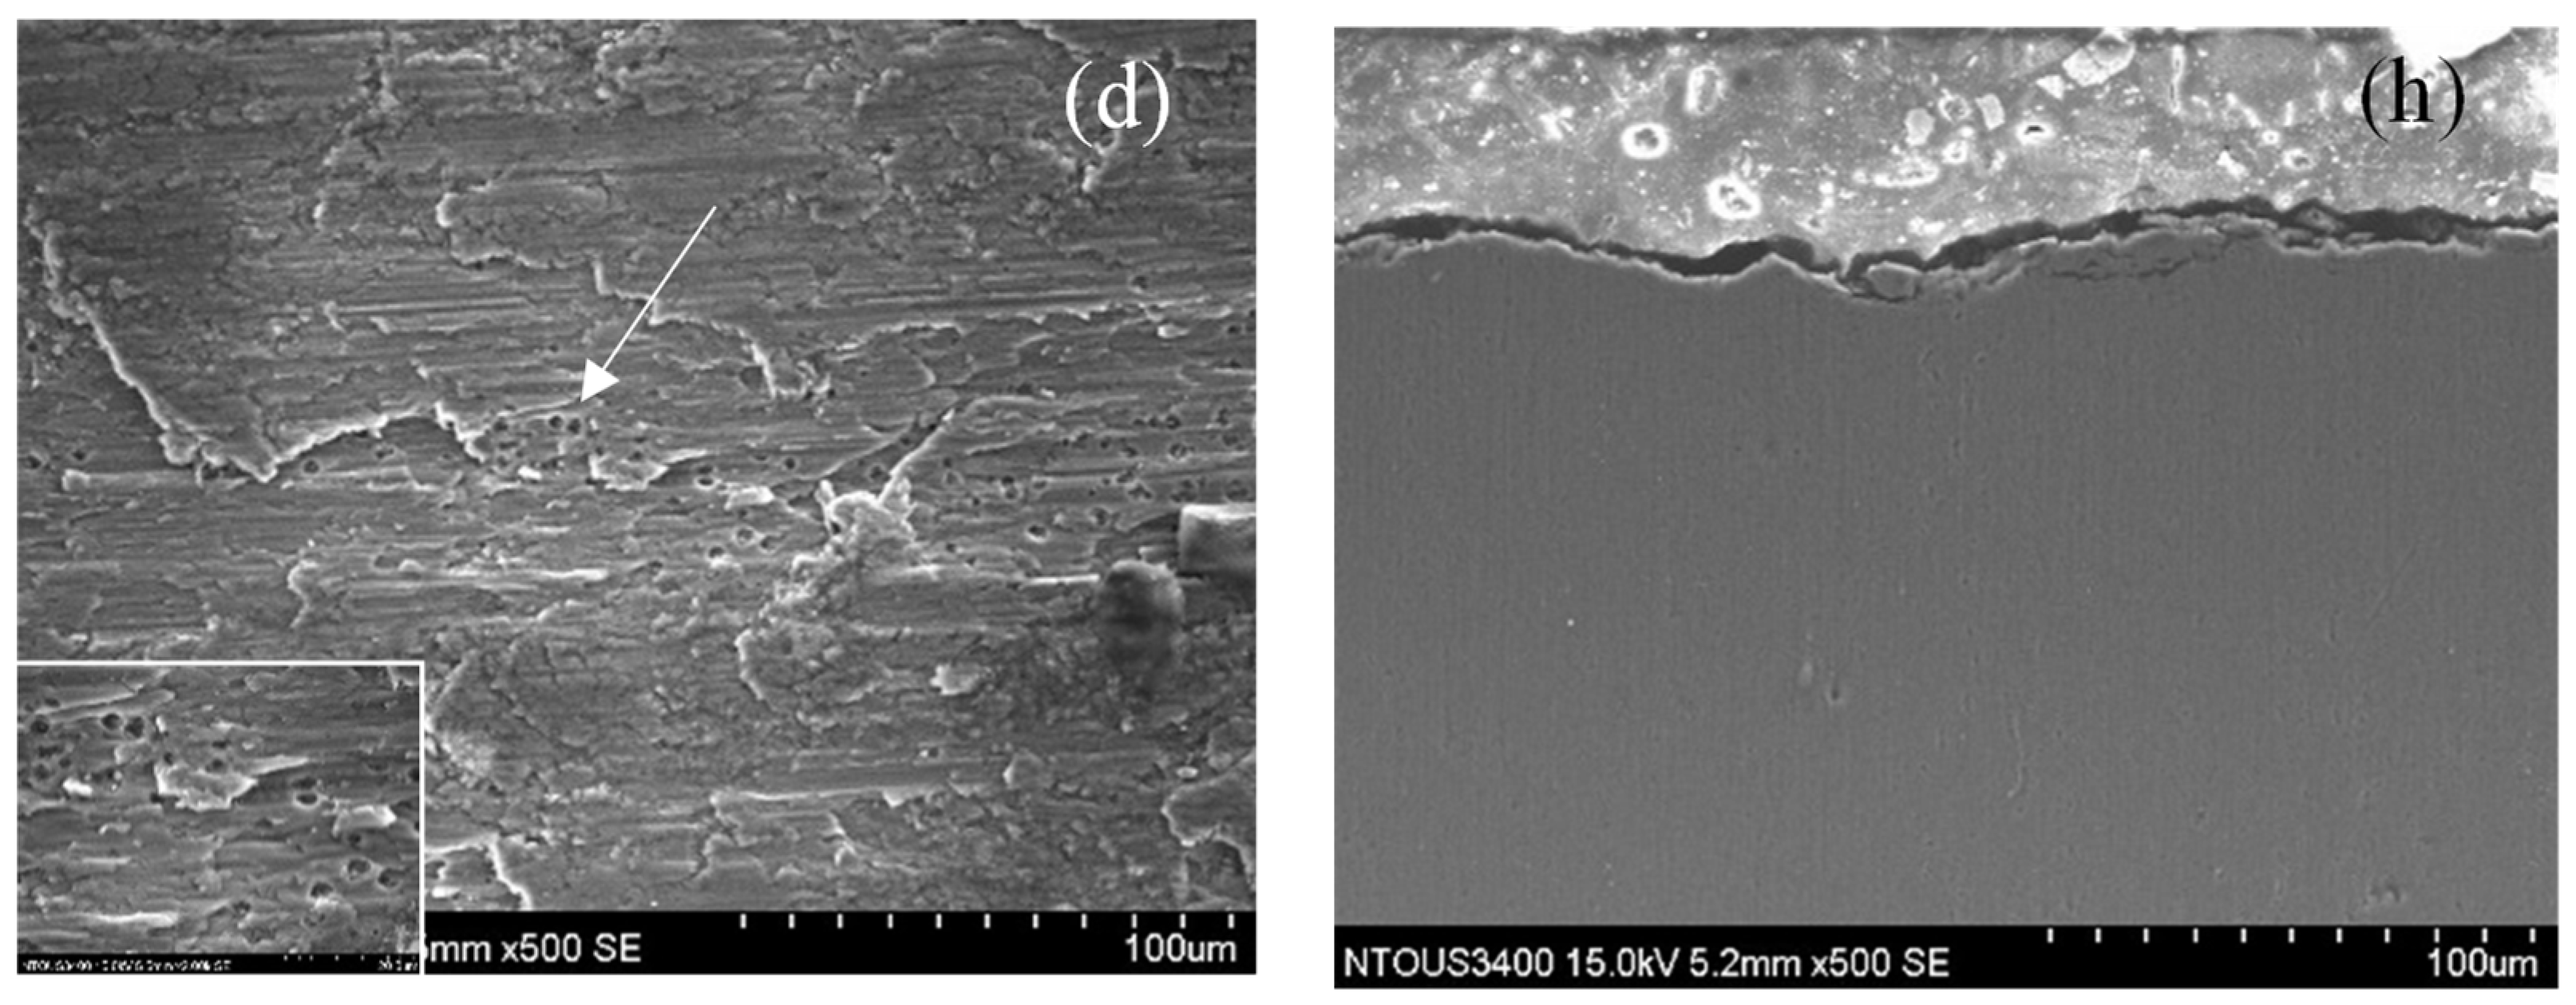
3.3. Corrosion and Corrosion–Wear Characteristics in the Spray Al Coating

Figure 6 shows the SEM surface morphology of the corrosion result of the spray Al coating in seawater. The voids grew as the applied polarization potential increased, and the coating became looser than the initial smooth coating, as shown in Figure 6a. Figure 6a and Table 3 show the corrosion current density, weight loss of the coating, and relative surface roughness raised after −713 mVSCE for 1200 s. The results show that when the test piece is immersed in the corrosive solution, when the applied voltage is larger, the surface of the test piece is corroded more seriously (increase of weight loss), resulting in a significant increase in surface roughness.
As shown in Figure 7a, the spray Al coating was smooth but was not destroyed in the dip area when the coating was conducted in the corrosion–wear of the Al coating test in the seawater under a load of 3.92 N. However, the coating was destroyed but smooth when conducted in −600 mVSCE, as shown in Figure 7b. The coating was completely destroyed, and many voids formed when conducted in −200 mVSCE, as shown in Figure 7c. The voids on the coating continuously grew and worsened in the applied potential of +100 mVSCE, as shown in Figure 7d. From the cross-section result, some area under load was smooth, while other areas were still rugged under −713 mVSCE, as shown in Figure 7e. The coating was smooth, although it continued wearing in the −600 mVSCE, as shown in Figure 7f. The coating roughness increased, and more voids and cracks formed, caused by the corrosion–wear of Al coating while conducting in −200 mVSCE and +100 mVSCE, as shown in Figure 7g,h.
Figure 8a is a curve showing the change of the corrosion current on the surface of the coating as a function of the corrosion time with the change of the applied voltage when the aluminum coating is only in the corrosion condition (without being in the wear condition). It can be observed from the curve that the coating is corroded to a greater depth as the applied voltage increases, which is consistent with the results observed by SEM (Figure 6).
From Figure 8b and Table 4, it can be seen that the corrosion current density, weight loss, and surface roughness of the coating all increase with the increase in polarization potential. The corrosion current density and the weight loss of Al coating in the corrosion–wear test were larger than that of the coating only carried out with the corrosion test; however, the surface roughness was lower than that of the only proceeding corrosion test.

4. Discussion

4.1. XPS Analysis of Thermal Spray Al Coating after the Corrosion–Wear Test

In the depth analysis of the coating by using XPS, Ar+ ablation is usually adopted for etching. In this study, the operated voltage for Ar+ was 2 kV, and the scanning range was 2 × 2 mm. This parameter setting corresponds to an etching rate of 11.38 nm/min on silicon dioxide (SiO2). The element analysis of the Al thermal spray coating corroded at seawater included Al and O, and the results are shown in Figure 9. Using XPS Peak Version 4.0 software (ULVAC-PHI, Co., Ltd., Tokyo, Japan) along with the combination of the NIST (National Institute of Standards and Technology) database and the recent literature with the background subtraction method, Table 5 presents the peak maps of the Al element and alumina, and their associated fitting results. The deconvolution curve fitting results on the binding energy peaks of the Al element and alumina in the measured XPS spectra of the thermal spray Al coating corroded at seawater is shown in Figure 10. The binding energy at 72.9 and 74.6 eV indicates the Al element and alumina in the coatings, respectively, and agreement with the binding energy in the past study [27].

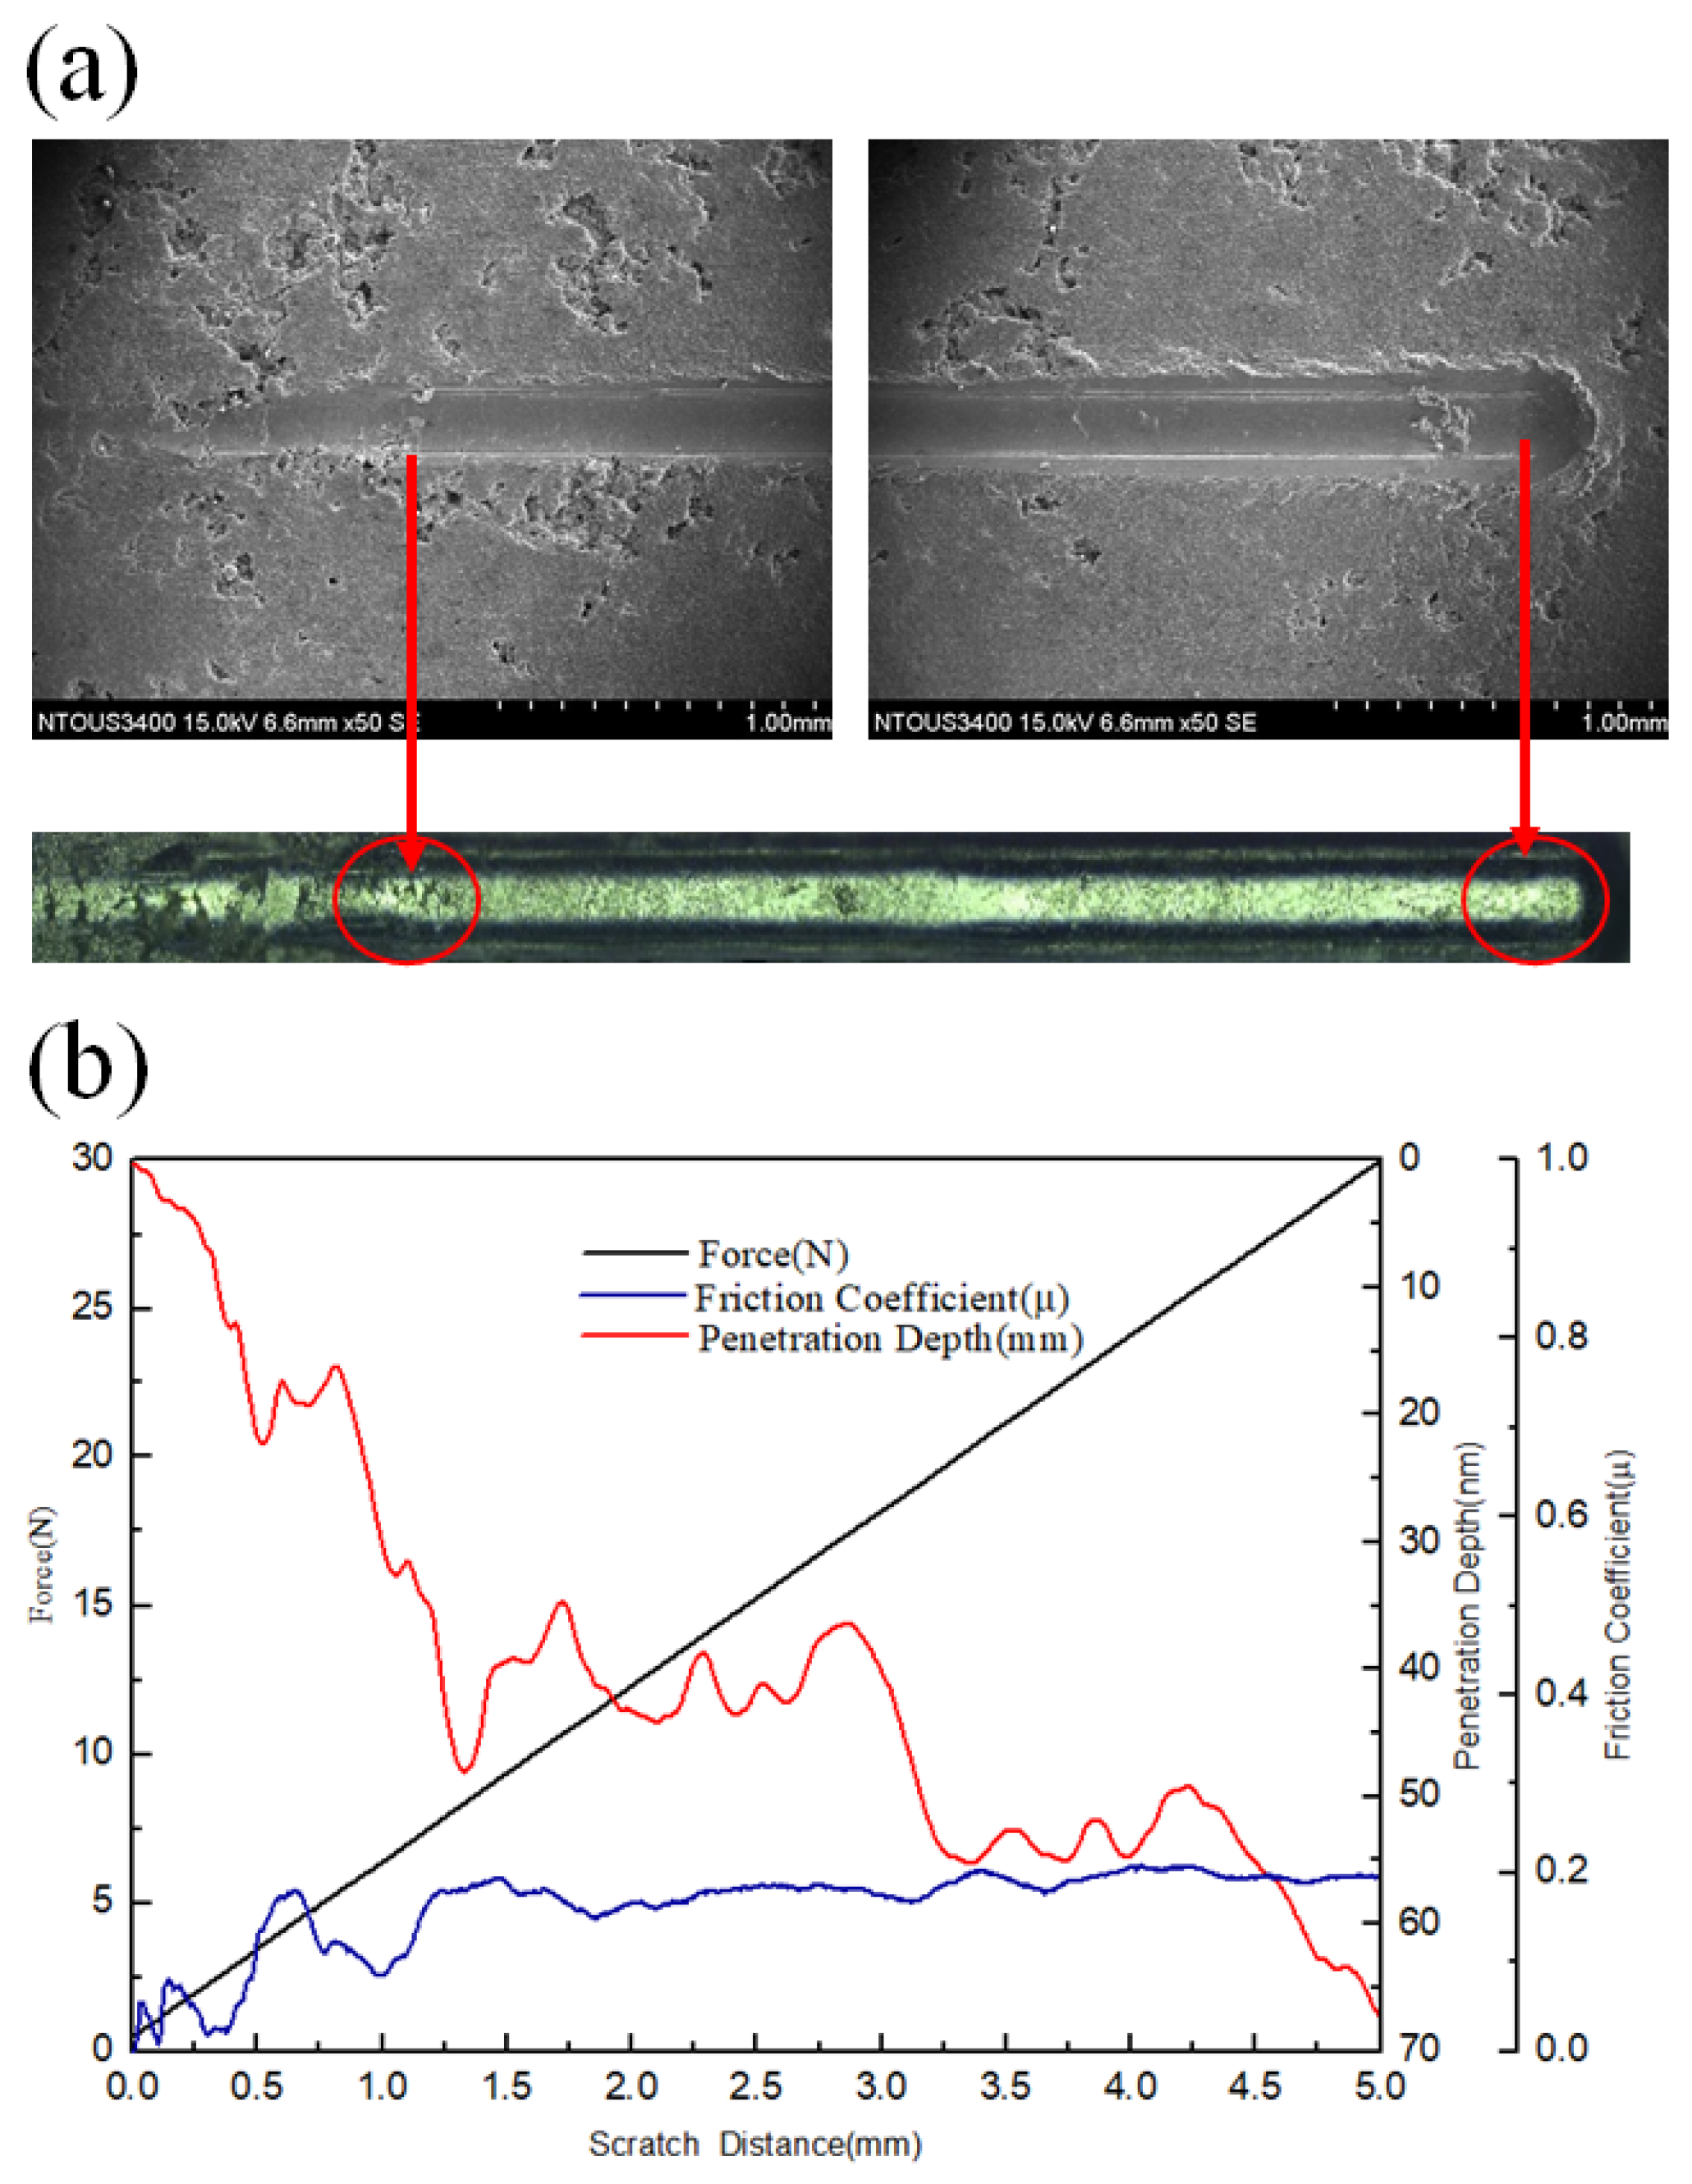
4.2. Relation between Corrosion–Wear and Friction Coefficient

Figure 8 and Figure 11 and Table 3 show that the weight loss, surface roughness, and friction coefficient of the spray Al coating were measured in a corrosion solution under a −713 mVSCE condition, respectively. Due to the large surface roughness of the Al coating, the contact area between the wear part and the coating is small during the wear process, resulting in the measured friction coefficient being lower. An external applied potential of −600 mVSCE due to the contact area increased, and the oxide layer was thin without a lubricating effect, resulting in the friction coefficient of coating being large. With an external applied potential of −200 mVSCE, in addition to the production of more surface corrosion oxides, it also causes the formation of corrosion voids on the surface of the coating, which increases the surface roughness. At the same time, it is easy to be scraped off by abrasive blocks or washed away by seawater solution, which increases the weight loss of the coating, while the liquid in the corrosion voids and alumina block contacts, resulting in the effect of heterogeneous phase boundary lubrication and the increased pressure of solution carrying results in less contact area, which reduces the coefficient of friction. With the largest external applied potential of +100 mVSCE, the surface was clearly damaged because the large potential caused the surface to loosen, and voids, as well as cracks, grew, which caused the surface roughness and weight loss to increase. Due to the continuous serious corrosion, the surface lost the lubricating effect, which caused the contact area to increase and made the friction coefficient rise again [22,24,25].

4.3. Corrosion of Al Coating and Corrosion–Wear of Al Coating Interaction

The weight loss of the coating can be used to describe the corrosion of Al coating and corrosion–wear of Al coating interaction: corrosion of Al coating and corrosion–wear of Al coating loss can be the sum of the corrosion of Al coating and corrosion–wear of Al coating results. Wtotal = Wwear + Wcorr + ∆W, where ∆W includes Wwear + Wcorr. By block-on-ring corrosion–wear of Al coating quantitative analysis, ∆Wcorr can be calculated. ∆Wwear = (M/nF) × ∆icorr × S × t, where M is the Al atomic weight of 26.98 g/mole, the corrosion current density is ∆icorr= icorripure-corr (mA/cm2, as shown in Table 3 and Table 4), S is the tested area, and t is the test time of 1200 s, as shown in Table 6. Figure 12 illustrates the weight loss and friction coefficient under different polarization potentials [22,23,24,25].
It can be seen from Table 5 that under the conditions of −713 and −600 mVSCE, the amount of ΔWcorr is small and the amount of ΔWwear is large, which can be attributed to the fact that when the polarization potential is low, the coating is not easily corroded, while most of the weight loss of the coating comes from the alumina block contacting the coating surface, which also causes the coating to peel off when the abraded surface area increases and thus increases the coefficient of friction.
For a polarization potential of −200 mVSCE and +100 mVSCE, as shown in Figure 8, voids formed on the surface, which showed the corrosion current causing Wcorr. While conducting the corrosion–wear of the Al coating test, the Al2O3 block contacted the coating surface and continued scraping the surface to accelerate corrosion and increase the current density, which raised ∆Wwear, as shown in Figure 8b. With corrosion and wear conducting simultaneously and increasing the polarization potential, Wtotal strongly increased and the corrosion–wear mutual interaction was primary [22,23,24,25].

5. Conclusions

A corrosion and wear test in marine water under the speed of 200 rpm was conducted on a pure Al coating. After applying different polarization potentials to evaluate the corrosion rate, the SEM surface observation, weight loss, and friction coefficient, the conclusions are summarized as follows:
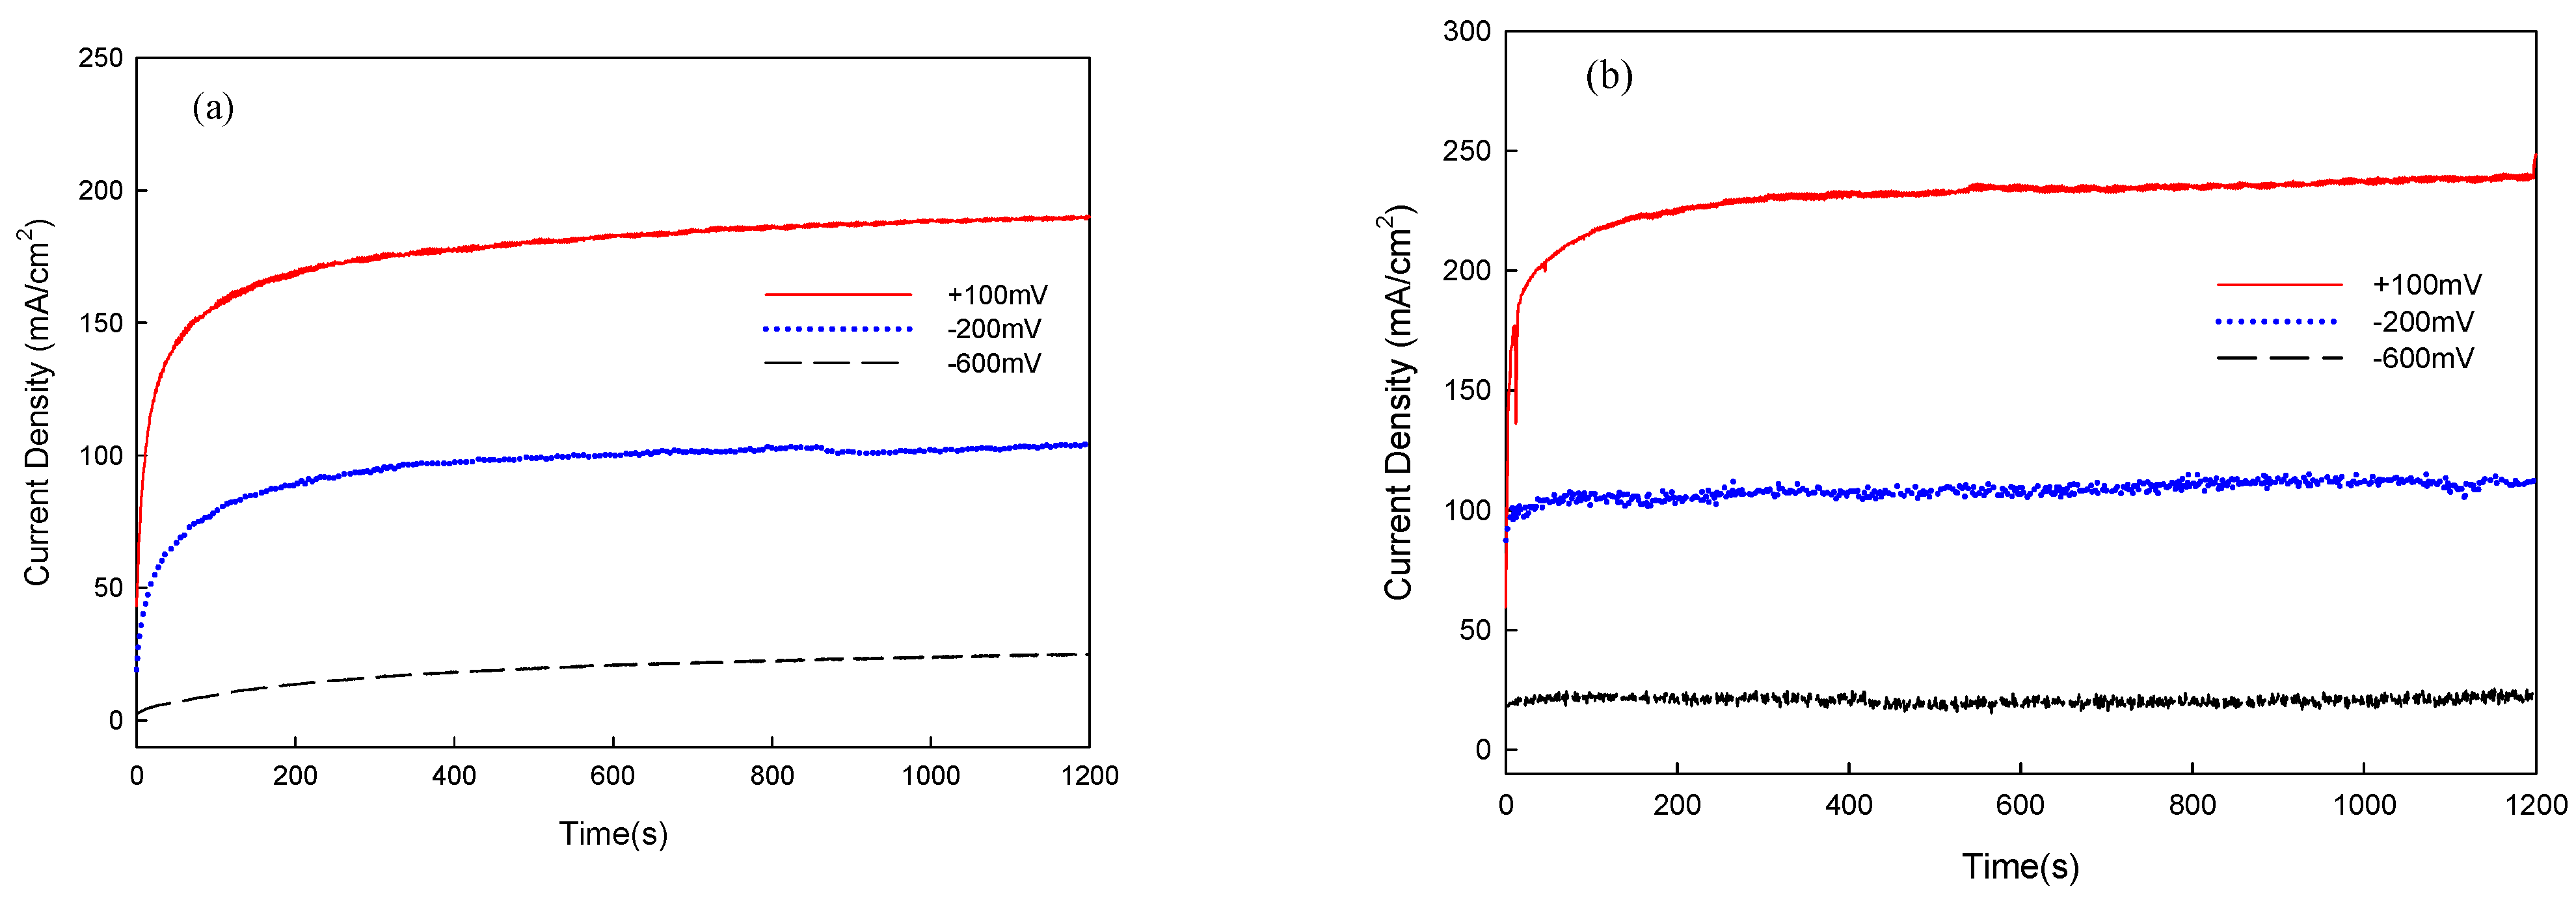
  • In the corrosion test, the weight loss increased as the polarization potentials rose, and the weight loss was only 15 mg with an applied potential of +100 mVSCE, indicating that the coating had excellent corrosion resistance.
  • In the results from the corrosion–wear of the Al coating test, the weight loss was from 56 to 178 mg, with the applied polarization potentials from −713 mVSCE to +100 VSCE. The surface morphologies changed from wear scratch to inner voids in the scratches, which explained that the coating suffered not only from wear but also from serious corrosion.
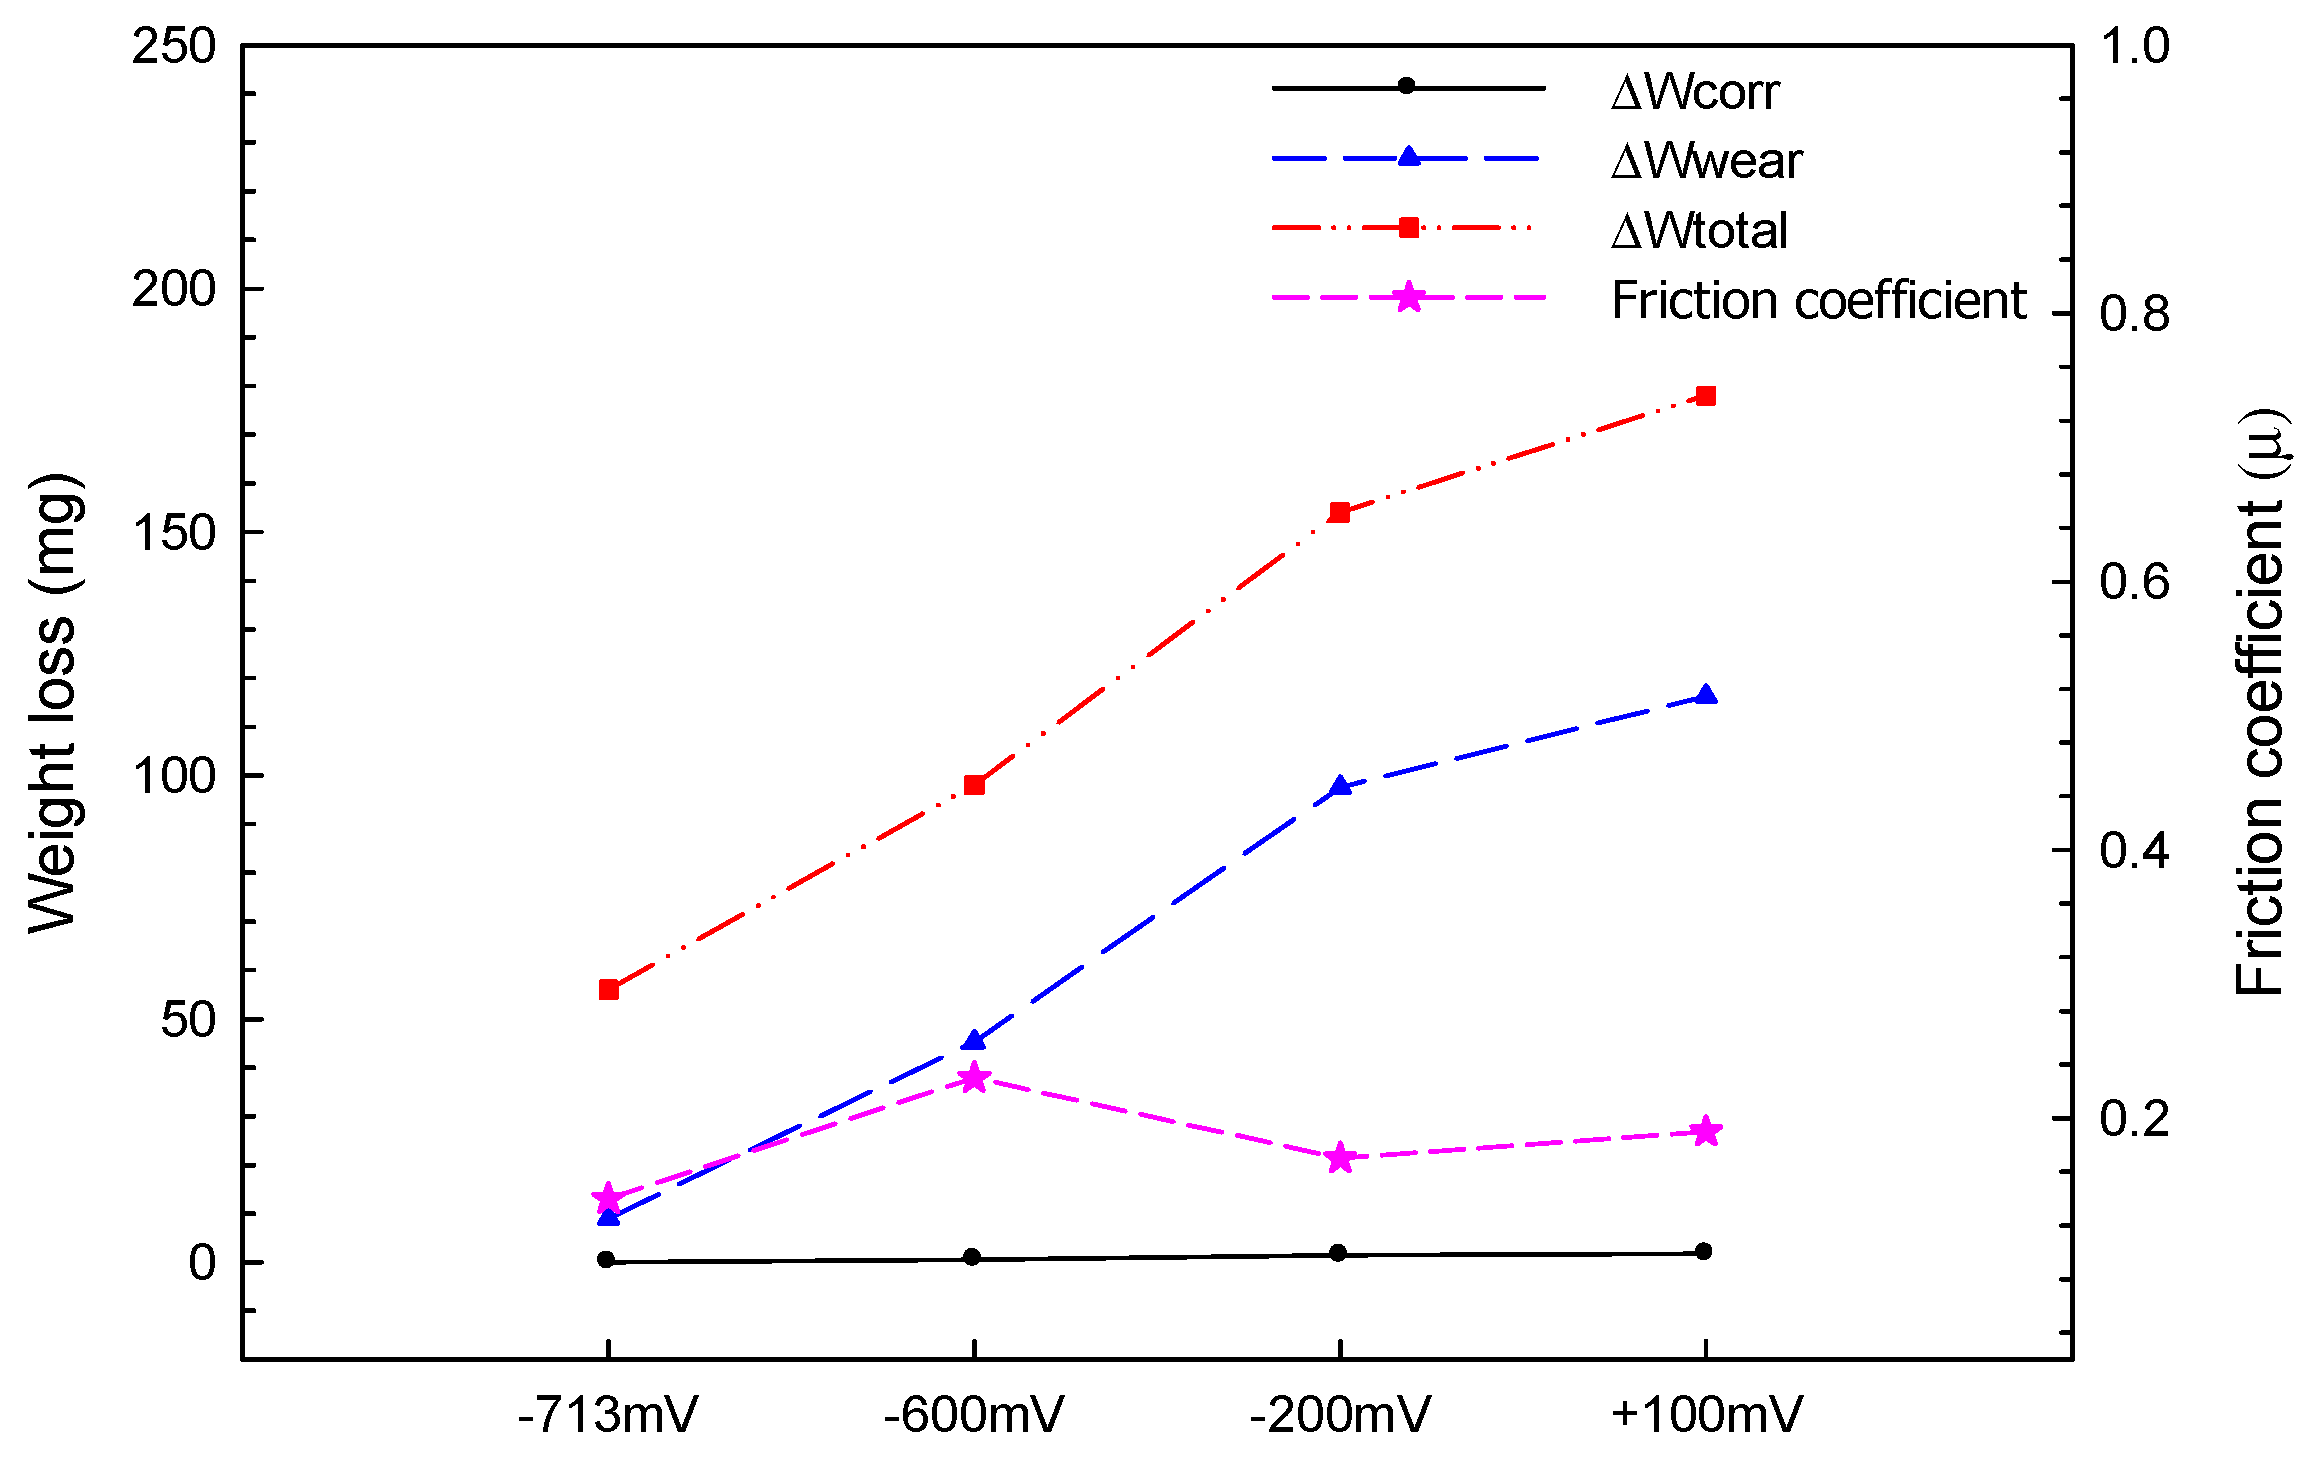
  • Mutual corrosion of Al coating and corrosion–wear of Al coating were the primary causes of deterioration of the pure Al coating in seawater in the corrosion–wear test. Via the quantitative analysis, ∆Wcorr changed somewhat as the applied polarization potentials increased; however, ∆Wwear continued rising due to the mutual corrosion and wear and primarily caused the weight loss of the coating.

Author Contributions

Conceptualization, S.-Y.J. and M.-H.L.; data curation, S.-Y.J., H.-H.S., J.-K.C., C.-H.C. and Y.-H.H.; formal analysis, H.-H.S., J.-K.C. and Y.-H.H.; funding acquisition, M.-H.L.; project administration, H.-B.L.; resources, H.-B.L. All authors have read and agreed to the published version of the manuscript.

Funding

The financial support from the Ministry of Science and Technology, Taiwan, under Grant No. MOST 110-2221-E-019-027 is gratefully acknowledged.

Data Availability Statement

All the data is available within the manuscript.

Conflicts of Interest

The authors declare no conflict of interest.

References

  1. López-Ortegaa, A.; Areitioaurtenaa, O.; Alvesa, S.A.; Goitandiaa, A.M.; Elexpea, I.; Aranab, J.L.; Bayóna, R. Development of a superhydrophobic and bactericide organic topcoat to be applied on thermally sprayed aluminum coatings in offshore submerged components. Prog. Org. Coat. 2019, 137, 105376. [Google Scholar] [CrossRef]
  2. Chen, T.C.; Chou, C.C.; Yung, T.Y.; Tsai, K.C.; Huang, J.Y. Wear behavior of thermally sprayed Zn/15Al, Al and Inconel 625 coatings on carbon steel. Surf. Coat. Technol. 2016, 303, 78–85. [Google Scholar] [CrossRef]
  3. Chen, G.; Wang, J.; Wang, D.; Xue, L.; Zeng, B.; Qin, B.; Tang, Z. Effect of liquid oxy-nitriding at various temperatures on wear and molten aluminum corrosion behaviors of AISI H13 steel. Corros. Sci. 2021, 178, 109088. [Google Scholar] [CrossRef]
  4. Lin, M.Y.; Hsiao, P.S.; Sheu, H.H.; Chang, C.C.; Tsai, M.S.; Wuu, D.S.; Lee, H.B. Improving the Corrosion Resistance of 6061 Aluminum Alloy Using Anodization and Nickel-Cobalt based Sealing Treatmen. Int. J. Electrochem. Sci. 2021, 16, 211053. [Google Scholar] [CrossRef]
  5. Park, I.C.P.; Kim, S.J. Corrosion behavior in seawater of arc thermal sprayed Inconel 625 coatings with sealing treatment. Surf. Coat. Technol. 2017, 325, 729–737. [Google Scholar] [CrossRef]
  6. Arrabal, R.; Pardo, A.; Merino, M.C.; Mohedano, M.; Casajús, P.; Merino, S. Al/SiC thermal spray coatings for corrosion protection of Mg-Al alloys in humid and saline environments. Surf. Coat. Technol. 2010, 268, 826. [Google Scholar] [CrossRef]
  7. Arrabal, R.; Pardo, A.; Merino, M.C.; Mohedano, M.; Casajús, P. Corrosion behaviour of a magnesium matrix composite with a silicate plasma electrolytic oxidation coating. Surf. Coat. Technol. 2010, 204, 2767. [Google Scholar] [CrossRef]
  8. Jiang, Q.; Miao, Q.; Liang, W.P.; Ying, F.; Tong, F.; Xu, Y.; Ren, B.L.; Yao, Z.J.; Zhang, P.Z. Corrosion behavior of arc sprayed Al-Zn-Si-RE coatings on mild steel in 3.5 wt% NaCl solution. Electrochim. Acta 2014, 115, 644–656. [Google Scholar] [CrossRef]
  9. Liu, S.; Zheng, X.; Geng, G. Dry sliding wear behavior and corrosion resistance of NiCrBSi coating deposited by activated combustion-high velocity air fuel spray process. Mater. Des. 2010, 31, 913–917. [Google Scholar] [CrossRef]
  10. Zhang, Z.; Wang, Z.; Liang, B. Wear characterization of thermal spray welded Ni-Cr-B-Si-RE alloy coatings. J. Mater. Process. Technol. 2009, 209, 1368–1374. [Google Scholar] [CrossRef]
  11. Uozato, S.; Nakata, K.; Ushio, M. Corrosion and wear behaviors of ferrous powder thermal spray coatings on aluminum alloy. Surf. Coat. Technol. 2003, 169–170, 691–694. [Google Scholar] [CrossRef]
  12. Edrisy, A.; Perry, T.; Cheng, Y.T.; Alpas, A.T. Wear of thermal spray deposited low carbon steel coatings on aluminum alloys. Wear 2001, 251, 1023–1033. [Google Scholar] [CrossRef]
  13. Frenk, A.; Kurz, W. Microstructural effects on the sliding wear resistance of a cobalt-based alloy. Wear 1994, 174, 81–91. [Google Scholar] [CrossRef]
  14. Qi, X.; Eigen, N.; Aust, E.; Gärtner, F.; Klassen, T.; Bormann, R. Two-body abrasive wear of nano- and microcrystalline TiC–Ni-based thermal spray coatings. Surf. Coat. Technol. 2006, 200, 5037. [Google Scholar] [CrossRef]
  15. Aruna, S.T.; Balaji, N.; Shedthi, J.; Grips, V.K.W. Effect of critical plasma spray parameters on the microstructure, microhardness and wear and corrosion resistance of plasma sprayed alumina coatings. Surf. Coat. Technol. 2012, 208, 92. [Google Scholar] [CrossRef]
  16. Katayama, H.; Kuroda, S. Long-term atmospheric corrosion properties of thermally sprayed Zn, Al and Zn–Al coatings exposed in a coastal area. Corros. Sci. 2013, 76, 35–41. [Google Scholar] [CrossRef]
  17. Kuroda, S.; Kawakita, J.; Takemoto, M. An 18-year exposure test of thermal-sprayed Zn, Al, and Zn-Al coatings in marine environment. Corrosion 2006, 62, 635–647. [Google Scholar] [CrossRef]
  18. Han, M.S.; Woo, Y.B.; Ko, S.C.; Jeong, Y.J.; Jang, S.K.; Kim, S.J. Effects of thickness of Al thermal spray coating for STS 304. Trans. Nonferrous Met. Soc. China 2009, 19, 925–929. [Google Scholar] [CrossRef]
  19. Liang, M.; Melchers, R.; Chaves, I. Corrosion and pitting of 6060 series aluminium after 2 years exposure in seawater splash, tidal and immersion zones. Corros. Sci. 2018, 140, 286–296. [Google Scholar] [CrossRef]
  20. Pragathi, P.; Elansezhian, R. Wear and corrosion behaviour on pure aluminium matrix reinforced with SiC and spent catalyst by using the stir casting method. Mater. Today Proc. 2021, 38, 3246–3252. [Google Scholar]
  21. Dinga, H.; Zhoua, G.; Dai, Z.; Bua, Y.; Jiang, T. Corrosion wear behaviors of 2024Al in artificial rainwater and seawater at fretting contact. Wear 2009, 267, 292–298. [Google Scholar] [CrossRef]
  22. Guo, F.; Jiang, W.; Xie, Z.; Dai, H.; Wang, E.; Chen, Y.; Liu, L. Enhancing anti-wear and anti-corrosion performance of cold spraying aluminum coating by high current pulsed electron beam irradiation. Vacuum 2020, 182, 109772. [Google Scholar] [CrossRef]
  23. López-Ortega, A.; Arana, J.L.; Rodríguez, E.; Bayón, R. Corrosion, wear and tribocorrosion performance of a thermally sprayed aluminum coating modified by plasma electrolytic oxidation technique for offshore submerged components protection. Corros. Sci. 2018, 143, 258–280. [Google Scholar] [CrossRef]
  24. Lee, H.B. Synergy between corrosion and wear of electrodeposited Ni-W coating. Tribol. Trans. 2013, 50, 407–419. [Google Scholar] [CrossRef]
  25. Lee, H.B.; Wuu, D.S.; Lee, C.Y.; Lin, C.S. Wear and immersion corrosion of Ni-P electrodeposit in NaCl solution. Tribol. Int. 2010, 43, 235–244. [Google Scholar] [CrossRef]
  26. Lee, H.B.; Wu, M.Y. A Study on the Corrosion and Wear Behavior of Electrodeposited Ni–W–P Coating. Metall. Mater. Trans. A 2017, 48, 4667–4680. [Google Scholar] [CrossRef]
  27. Greczynski, G.; Petrov, I.; Greene, J.E.; Hultman, L. Al capping layers for nondestructive x-ray photoelectron spectroscopy analyses of transition-metal nitride thin films. J. Vac. Sci. Technol. A Vac. Surf. Film. 2015, 33, 05E101. [Google Scholar] [CrossRef] [Green Version]
Figure 1. XRD pattern of the arc thermal spray Al coating.
Lubricants 10 00197 g001
Figure 2. SEM images of the arc thermal spray Al coating: (a) cross-sectional; (b) surface morphology.
Lubricants 10 00197 g002
Figure 3. Contact angle test results of the arc thermal spray Al coating in RO water, 3.5 wt% NaCl solution, and seawater.
Lubricants 10 00197 g003
Figure 4. Scratch test of the arc thermal spray Al coating: (a) SEM morphology; (b) scratch profiles.
Lubricants 10 00197 g004
Figure 5. Electrochemical test results: (a) polarization of corrosion and corrosion–wear condition in seawater; (b) the corrosion and corrosion–wear condition in seawater at −713 mVSCE (OCP).
Lubricants 10 00197 g005
Figure 6. SEM surface and related cross section of coating after corrosion of the Al coating test in seawater: (a) −713 mVSCE, (b) −600 mVSCE, (c) −200 mVSCE, (d) +100 mVSCE and cross section, (e) −713 mVSCE, (f) −600 mVSCE, (g) −200 mVSCE, and (h) +100 mVSCE.
Lubricants 10 00197 g006
Figure 7. SEM surface morphology of coating after corrosion–wear of the Al coating test in seawater: (a) −713 mVSCE, (b) −600 mVSCE, (c) −200 mVSCE, (d) +100 mVSCE and cross section, (e) −713 mVSCE, (f) −600 mVSCE, (g) −200 mVSCE, and (h) +100 mVSCE.
Lubricants 10 00197 g007aLubricants 10 00197 g007b
Figure 8. Chronoamperometric curves: (a) corrosion of Al coating in different potential; (b) corrosion–wear of Al coating in different potential.
Lubricants 10 00197 g008
Figure 9. XPS depth profiles of the Al thermal spray coating corroded at seawater.
Lubricants 10 00197 g009
Figure 10. Deconvolution curve fitting analyses on the binding energy peaks of Al elements in the measured XPS spectra of the thermal spray Al coating after corrosion test in seawater.
Lubricants 10 00197 g010
Figure 11. Friction coefficient of the corrosion–wear of the Al coating test under different potentials.
Lubricants 10 00197 g011
Figure 12. Weight loss and friction coefficient of Al coating corrosion–wear under different potentials.
Lubricants 10 00197 g012
Table 1. Corrosion of Al coating and corrosion–wear of Al coating at corrosion polarization condition.
Ecorr (V)icorr (μA/cm2)Friction Coefficient
Corrosion–wear of Al coating−1.0514500.13
Corrosion of Al coating−0.67257-
Table 2. Corrosion of Al coating and corrosion–wear of Al coating when the applied potentials at −713 mVSCE.
Potential (V)Weight Loss (mg)Friction Coefficient
Corrosion–wear of Al coating−1.151560.14
Corrosion of Al coating−0.7132-
Table 3. Current density, weight loss, and surface roughness after the corrosion test on the coating.
Applied VoltageI
( m A / c m 2 )
Weight Loss
(mg)
Ra
(μm)
−713 mVSCE-29.35
−600 mVSCE19.0710.57
−200 mVSCE95.41011.18
+100 mVSCE214.21513.46
Table 4. Current density, weight loss, surface roughness, and friction coefficient after the corrosion–wear test on the coating.
Applied VoltageI
( m A / c m 2 )
Weight Loss
(mg)
Ra
(μm)
Friction
Coefficient
−713 mVSCE-562.640.14
−600 mVSCE24.1983.630.23
−200 mVSCE108.41544.960.17
+100 mVSCE229.91785.540.19
Table 5. NIST USA XPS element binding energy data.
ElementSpectral LineFormulaBinding Energy (eV)
NISTReferenceExperimental on the Surface
Al2pAl72.972.9 72.9
Al2pAl2O374.674.2 74.6
Table 6. Mutual corrosion–wear of Al coating test results.
Applied VoltageWtotal
(mg)
Wwear
(mg)
Wcorr
(mg)
ΔW (mg)
ΔWcorrΔWwear
−713 mVSCE5645209
−600 mVSCE984570.5745.3
−200 mVSCE15445101.4597.55
+100 mVSCE17845151.76116.2
Publisher’s Note: MDPI stays neutral with regard to jurisdictional claims in published maps and institutional affiliations.

