Article

Analysis of the Thermo-Mechanical Behavior of a Multi-Plate Clutch during Transient Operating Conditions Using the FE Method

Gear Research Center (FZG), Technical University of Munich, 85748 Garching, Germany
*
Author to whom correspondence should be addressed.
Lubricants 2022, 10(5), 76; https://doi.org/10.3390/lubricants10050076
Submission received: 20 March 2022 / Revised: 13 April 2022 / Accepted: 14 April 2022 / Published: 21 April 2022
(This article belongs to the Special Issue Automotive Tribology II)

Abstract

:
Failures of multi-plate clutches must be reliably excluded due to safety-critical functionalities in the drive train. The main reason for failures of multi-plate clutches due to long-term and spontaneous damage is thermal damage. In this paper, a parameterizable two-dimensional finite element model is developed and validated for damage prevention and for analyzing the thermo-mechanical behavior of a clutch in transient operation. Both numerical verification and validation with experimental results are very good despite the simplifications in the model. Subsequently, the temperature and pressure distribution of the individual friction areas is determined. The results show that the maximum temperatures tend to occur at the outer diameter of the friction area. The pressure distribution is very homogeneous. In a parameter study, the influence of Young’s modulus of the friction lining, the thermal conductivity of the friction lining, and the steel plate thickness on the temperature and pressure behavior in the clutch is investigated. Although the Young’s modulus of the friction lining influences the pressure distribution in the friction contact, the temperature behavior is only slightly changed by the variation of the elastic modulus due to the load case. The thermal conductivity of the lining and steel plate thickness have a strong influence on the temperature level in the clutch. However, the distribution of pressures is still very homogeneous compared to the reference model.

1. Introduction

1.1. Motivation and State of the Art

Wet multi-plate clutches and brakes are widely used in vehicle transmissions and industrial applications and usually perform safety and comfort-related functions [1]. Damage to wet-running multi-plate clutches can be divided into spontaneous and long-term damage and is often associated with very high friction surface temperatures [2,3]. The transformation of kinematic energy into thermal energy at the friction surfaces leads to temperature gradients and thermal stresses in the parts. A temperature increase above the permissible value often leads to undesirable effects such as fluctuations in the coefficient of friction, oil damage, brake fading, surface cracks, thermal deformation, material transfers, and degradation of the lining material [4,5]. In the literature, two-dimensional axisymmetric and three-dimensional models are increasingly being developed and solved using the finite element method for numerical calculations of the thermo-mechanical behavior of clutches. Kennedy and Ling [6] were one of the first to build such a very simplified axisymmetric model of a high-energy disk brake system. Mechanical and thermal stresses were summed by superposition. This made it possible to investigate thermal and mechanical behavior while accounting for wear and non-uniform contact pressure. Zagrodzki [7,8] built axisymmetric FE models for single and multi-plate clutches. Their study demonstrated a dominant influence of the radial component of the temperature gradient on the values and distribution of thermal stresses. The calculated Von Mises stresses do not exceed the yield stresses of the investigated materials. Furthermore, a local pressure maximum is formed on the mean friction diameter, which can be explained by the high temperature rise in this area and the associated expansion of the material. Tirovic [9] performed numerical calculations with FEM to optimize the design of the brake disc of a high-speed train (TGV). The FE calculations of temperature and quasi-static stresses made it clear that a detailed study of the geometry and the choice of materials play an important role in preventing damage to the brake system. Hwang and Wu [10] simulated temperature distribution and thermal stresses for friction linings and brake disks during a single braking process with linearly decreasing angular velocity. Pressure distribution in the friction lining, as well as temperature distribution and thermal strains of the components was analyzed in more detail. Comparing the simulation with experimental results confirms the model design and the numerical calculations.
In the literature, thermo-mechanical models of truck and train brakes have been developed more often [11,12,13,14]. In contrast, Zhao et al. [15] investigated the thermo-mechanical behavior of a multi-plate dry clutch made of a carbon–carbon composite material. An axisymmetric contact FE model was used to calculate transient changes in temperature and stress tensor components for clutch engagement. For the brake engagement, the peak temperature occurs about 2 s after the clutch engagement with an engagement duration of 4 s. The peak temperature decreases with increasing clutch disc thickness, and the specific heat and transverse thermal conductivity significantly influence the thermo-mechanical behavior of the clutch system. Abdullah [16,17,18,19] has published numerous papers on the thermo-mechanical behavior of braking mode of single-disc and multi-disc friction clutches. For this purpose, different two-dimensional axisymmetric FE models were built. It was shown that Young’s modulus and the thickness of the friction lining are essential factors that drastically influence the distribution of the generated heat, the contact pressure, the temperature, and the actual contact area. It is proposed to adjust the friction lining thickness and Young’s modulus for the operating conditions of the clutch (friction power, friction work, pressure, differential speed) in the design process.
In current publications, three-dimensional models are increasingly being presented in addition to two-dimensional axisymmetric FE models. A distinction can be made between full and partial models. Wang [20] presents a 3D full model of a wet multi-disc brake created with the commercial software ANSYS. The thermo-mechanical simulations show that the frictional heat flux is very high during emergency braking, and there is a high temperature at the outer diameter of the friction pads. In addition, the discs distort during emergency braking, and large temperature and stress gradients occur at the edges of the radial grooves. The high circumferential stresses tend to cause radial cracks in the friction disc.

1.2. Research Objectives

This study aims to develop a two-dimensional thermo-mechanical model of a multi-plate clutch. This model should be code-based to allow maximum flexibility in parameter studies and data mining. In the literature, the focus is very much on the study of emergency braking and the very high frictional power associated with it. In contrast, the thermal and mechanical behavior for the transient slip mode will be investigated in more detail in the following. Here, lower frictional powers are to be considered compared to emergency braking. The model will be validated with experimental data from test bench runs. Subsequently, the thermal behavior of the clutch and the pressure distribution in the friction interfaces will be analyzed in more detail. In addition, the influence of several successive clutch engagements will be considered. The finished model also provides the basis for varying a wide range of geometry and material parameters and analyzing and evaluating their influence on the thermo-mechanical behavior of the clutch.

2. Mathematical Model

2.1. Thermal Principles

The calculation of the thermo-mechanical behavior of a clutch is a broad and multidisciplinary field of expertise. In general, the fields of heat transfer and contact mechanics have to be coupled. In the following, all the required physical relationships will be presented.
Under the conditions of heat flow coupling, no energy losses are assumed in the energy conversion process converting mechanical energy into thermal energy. The local heat flux density q ˙ between two contacting surfaces of a clutch can be calculated as follows:
q ˙ = μ · ω r e l · r · p .
υ r e l = ω r e l · r
Most of the frictional heat generated at the contact surfaces is absorbed by the lining and steel plates. A smaller part of the thermal energy is absorbed by the lubricating film, particles, and so on. Therefore, this ratio is described by the proportionality coefficient δ:
q ˙ · δ = λ s · T s z λ f · T f z .
At the contact surface, the boundary condition is that the temperature at the actual contact point on the friction pair is continuous. Meaning that for frictional contact, the temperature of the steel plate is equal to the temperature of the friction lining plate, where T s and T f represent the contact point temperatures of the steel and friction lining plates, respectively:
T s = T f .
The parabolic heat conduction Equation (5) in cylindrical coordinates is used to calculate the temperature distribution in the steel or friction lining plate. The equation can be simplified for axisymmetric modeling and assuming that the heat flow is uniform in the circumferential direction. The heat flux does not depend on the θ -direction, and the Equation (6) can be simplified:
ρ i · c i λ i · T i t = 2 T i r 2 + 1 r · T i r + 1 r 2 · 2 T i θ 2 + 2 T i z 2 ,
ρ i · c i λ i · T i t = 2 T i r 2 + 1 r · T i r + 2 T i z 2 .
Heat conduction also takes place between the friction lining and the lining carrier, whereby the temperatures at the contact surface between the friction lining and the lining carrier are assumed to be identical:
λ f T f z + λ s T c z = 0 ,
T f = T c .
The clutch components also transfer thermal energy to the inner and outer carriers and axial mounting parts. Between these components, there is a steel–steel contact. As early as in 1969, Cooper et al. [21] released a publication dealing with the model-based description of thermal conductivity in the contact between two bodies. This was subsequently extended fundamentally by Mikic [22]. Recent publications such as those by Asif [23], Tariq [24], and Dou [25] are based on these equations and show that the heat flow rate in a steel-steel contact can be calculated as follows:
Q ˙ = h c · A · Δ T .
When two surfaces are in contact, it should be noted that the actual contact occurs only at a few locations separated by relatively large distances. The actual contact area of metallic contacts is only approx. 1–2% of the nominal contact area [26]. Therefore, the heat flow lines are narrowed to pass only through the actual contact points, creating resistance to heat flow that causes a sharp drop in temperature at the interface. This additional resistance to the heat flux caused by the reduction of the contact area at the interface is called the thermal contact conductance h c , and its reciprocal is defined as the thermal contact resistance [25]. Dou [25] performed empirical studies to determine the thermal contact conductance h c and proposes the following Equation (10) for calculation, where the coefficient c 1 , c 2 , and c 3 depend on the roughness of the contact partners:
h c = k 0 · a R a · c 1 · ( T 1 T 0 ) c 2 · ( p H 0 ) c 3 .

2.2. Mechanical Principles

The mechanical equations are required in addition to the thermal equations to calculate the clutch’s thermomechanical behavior. The distribution of the contact pressure, which according to Equation (1) strongly influences the local heat input, depends on the expansions of the materials. The total strain can be divided into thermal strain and mechanical strain:
ε = ε E + ε T .
Mechanical strain can be calculated from the quotient of the length change L and the initial length L 0 . Thermal expansion is a change in the geometric dimension of a body caused by temperature changes. The coefficient of thermal expansion depends on the temperature difference T and the material-specific coefficient of thermal expansion α :
ε E = L L 0 L 0 = L L 0 ,
ε T = α · ( T T 0 ) = α · T .
The stresses in the individual parts of the clutch can be calculated by the total strain according to Equation (11) and the elastic matrix of the materials:
σ = D · ( ε E + ε T ) .
To calculate the heat flow rate in the contact to the inner and outer carriers according to Equation (10), it is necessary to know the nominal contact pressure. Based on the torque at the steel plate or the lining carrier, the following relationship can be formulated for the pressure between carrier and plate toothing:
p C a r = 2 · F A · μ · r m d   · z t e e t h · A F l a n k .
The presented equations can now be used to calculate the temperature behavior as well as the stresses and pressure distribution as a function of temperature for clutches.

3. Finite Element Formulation

The thermo-mechanical simulation of the clutch is set up and performed in ANSYS Mechanical using the internal scripting language APDL. The basic principle of the simulation setup is based on published preliminary work [27,28,29]. Static-mechanical calculations are coupled with transient-thermal calculations by a sequential process. In the static-mechanical simulation, the deformation of the plates and the pressure distribution on the friction interfaces are first determined. The pressure is an input parameter of the transient thermal simulation. The local heat flux density q ˙ ( r , θ , t ) is calculated according to the local pressure p ( r , θ , t ) and the local sliding velocity υ r e l ( t , r ) for each element on the friction interfaces according to Equation (1). According to Equation (6), the computed temperature distribution is subsequently used as an input parameter for the mechanical simulation. The total strains are calculated based on the thermal and mechanical strains, and new pressure distribution is determined.

3.1. Geometry

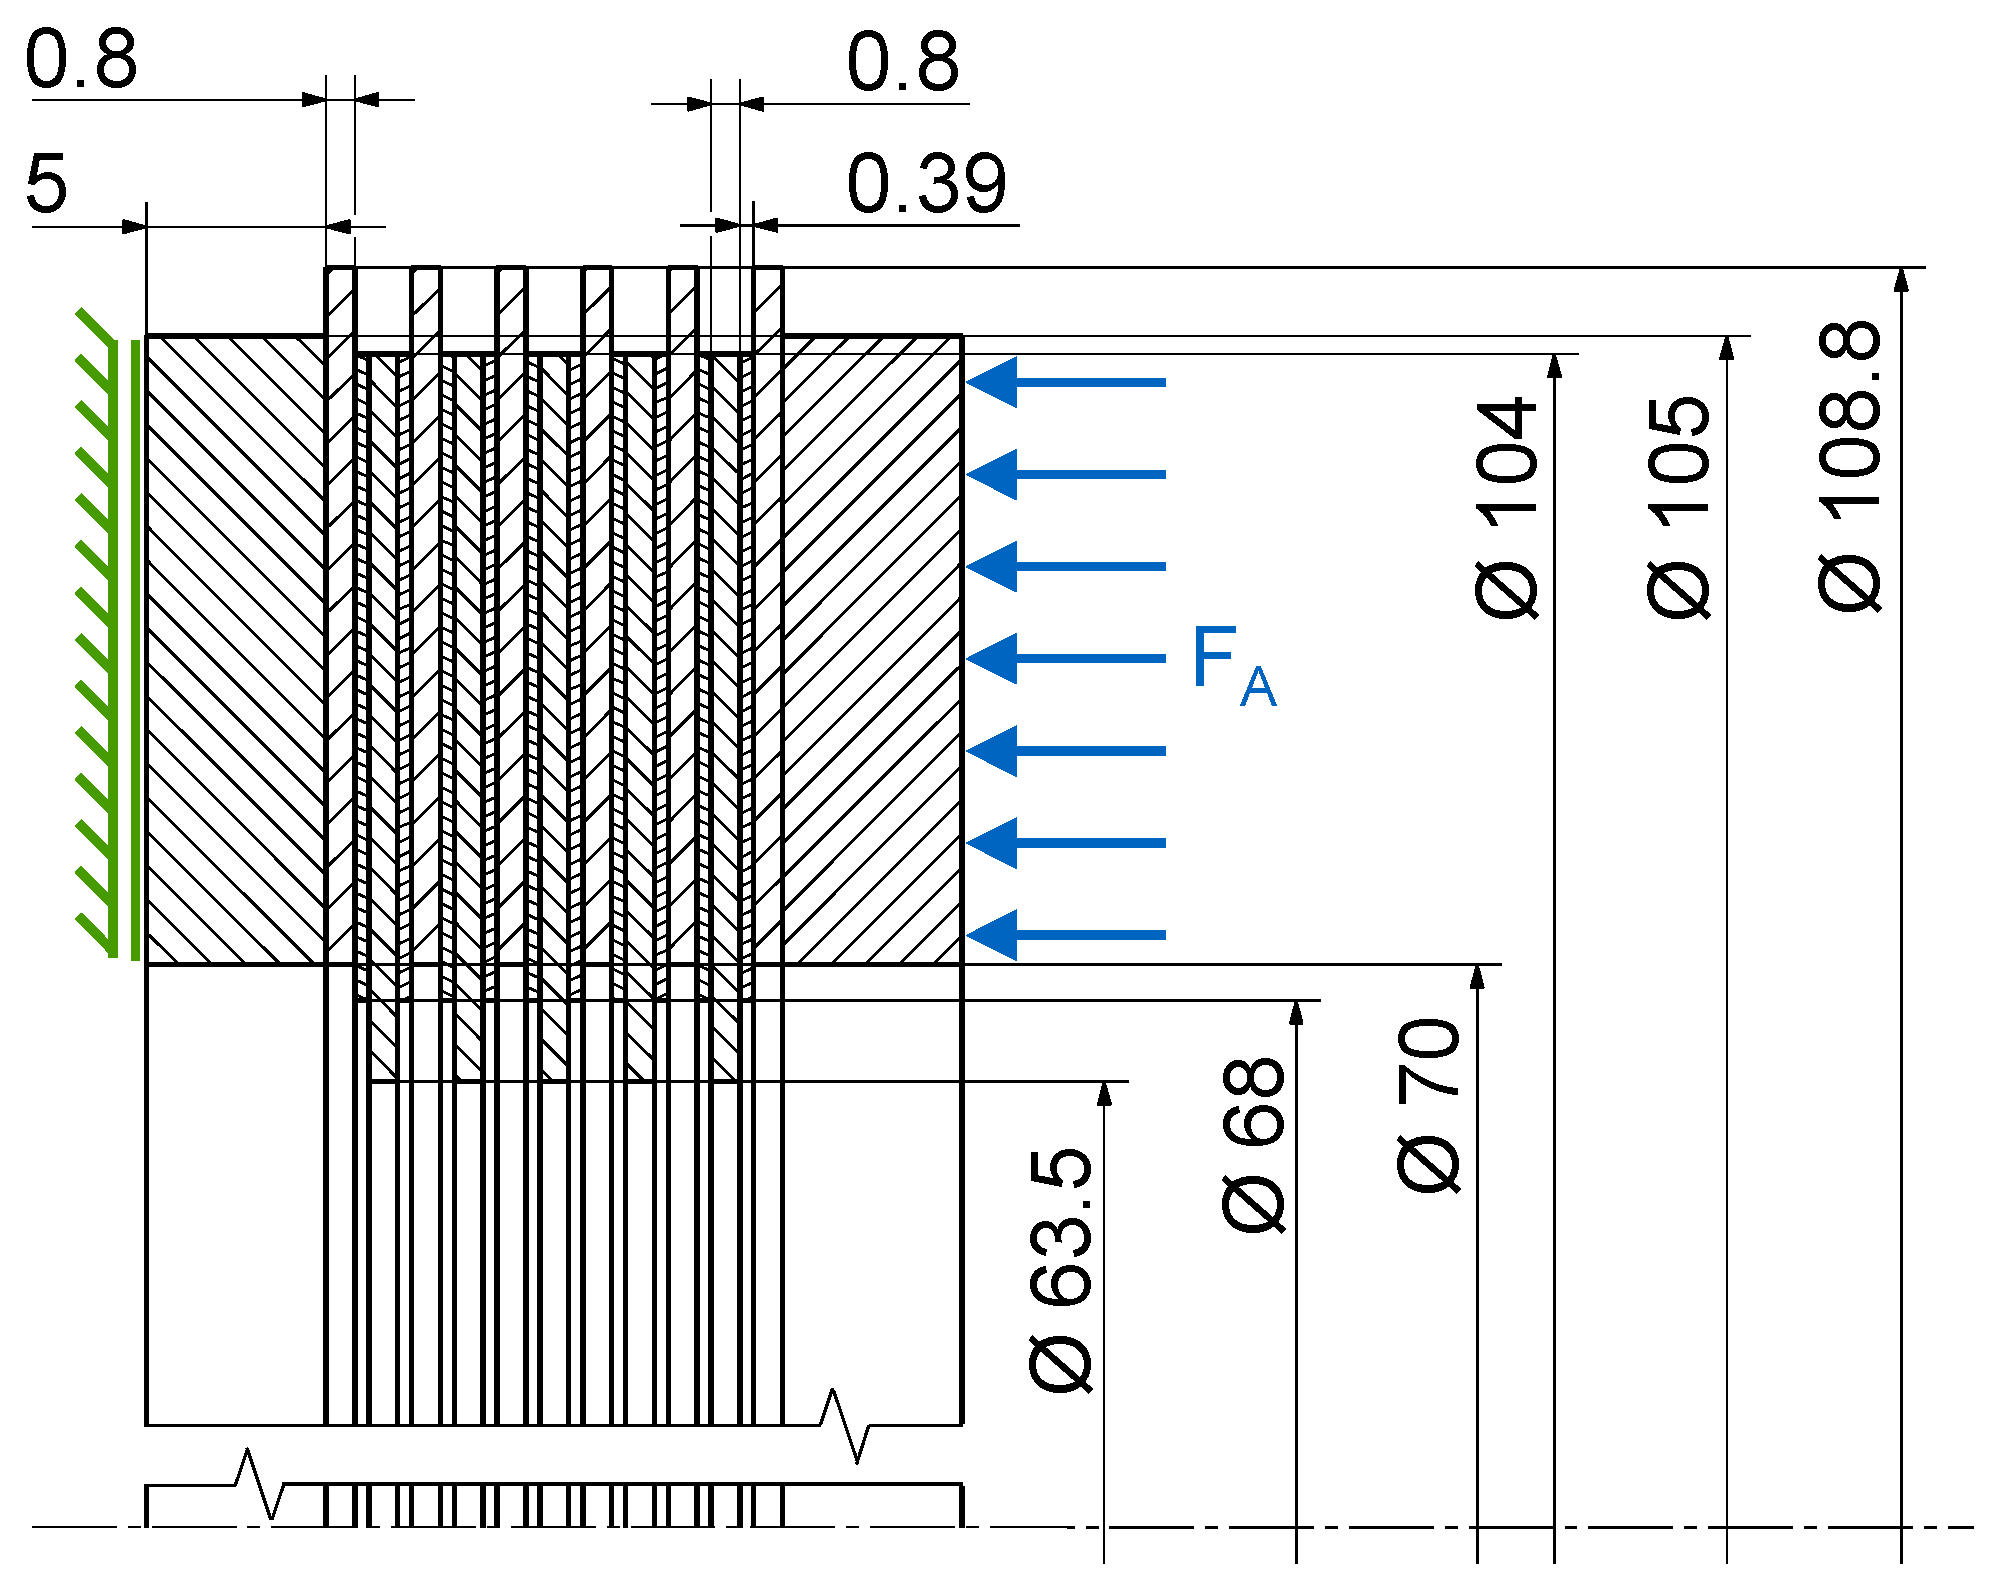
Technical drawing of the parts to be investigated is shown in Figure 1. The steel plates are designed as outer plates and the friction plates as inner plates.

3.2. Finite Element Method Settings

The area elements PLANE182 (mechanical calculation) and PLANE55 (thermal calculation) with four nodes each are used for the geometry structure. In addition to the area elements, the contact elements must also be evaluated and defined. Therefore, a pair-based contact condition with TARGE169 and CONTA172 elements was chosen. The contact elements overlay the underlying area elements in the simulation model. As contact algorithm the Augmented Lagrangian method is used.
For the simulation, it is necessary to define the Dirichlet and the Neumann boundary conditions for the mechanical and thermal calculations. There are two aspects to the Dirichlet boundary conditions of the mechanical calculations. On the one hand, it is assumed that the left side of the reaction plate, according to Figure 2, does not allow any displacement in the axial direction. On the other hand, the axial displacement of the right face of the pressure plate, where the axial force is applied, is uniform. For the thermal calculation, it is assumed that the multi-plate clutch already has a temperature of 80 °C at the beginning of the simulation. In addition, passive cooling is implemented through the contact surfaces of the teeth in the circumferential direction and the axial mounting parts. The heat flow rate is calculated according to Equation (9) by taking into account Equation (10), and the following assumptions are made. For the passive cooling studies, all contact partners are made of steel. According to Asif [23], a predominantly plastic contact behavior is to be assumed in this case. Measurements are taken on the steel plates to determine surface roughness R a . Effective arithmetic average slope a represents the slopes of the individual roughnesses in contact. From the study of Tariq [23] it can be seen that effective arithmetic average slope a is mainly influenced by the effective surface roughness. The dependence is linear. Therefore, in this study, a is determined from the measured values of Dou et al. [25] by means of interpolation. To calculate the thermal contact conductance, the hardness, which is also required, is measured. Finally, the contact area for heat conduction through the teeth is needed. In the 2D model, the shape of the teeth of the steel plates and the lining carrier plate cannot be reproduced due to the rotational symmetry. Since the lateral surface of the components in the FE model is much larger than the contact surfaces of the teeth to the carriers, this is considered via a dimensionless factor:
A r a t = A F l a n k A F E M o d e l .
Table 1 provides an overview of the values required for the calculation of Equation (10). For the factors c 1 , c 2 , and c 3 , the values of Dou et al. [25] for a surface roughness R a = 0.40 were adopted.
The share of free convection and thermal radiation is about 0.15% each. For this reason, both heat transport mechanisms are neglected in the following.
The thermal Neumann boundary condition is the heat flux rate in the contact elements, which is calculated according to Equation (1). The determination and application of q ˙ ( r , θ , t ) must be performed individually for each network element. The reason for the element-wise calculation is the relative velocity, which increases with the radial coordinate, as can be seen in Figure 1.

3.3. Operating Conditions

In the following, the load parameters of the clutch, which represent the mechanical Neumann boundary conditions, are explained. The clutch is to be operated under transient slip conditions. After the axial force has been applied, the clutch is repeatedly accelerated, and the differential speed is reduced to zero again. The individual ramps for the build-up and reduction of the differential speeds are each 2 s long. Between the slip phases, there is a pause of 0.5 s. Figure 3 shows the axial force and differential speed curve with exemplary values.

3.4. Material Properties

In addition to the load parameters, it is also necessary to specify the material properties for the simulation. The outer plates, the lining carrier plates, and the mounting parts are made of steel. The friction linings are paper friction linings consisting of organic blended fabric. Table 2 lists the used material properties for the simulation model. With the exception of the Young’s modulus, the values are taken from the literature [30].
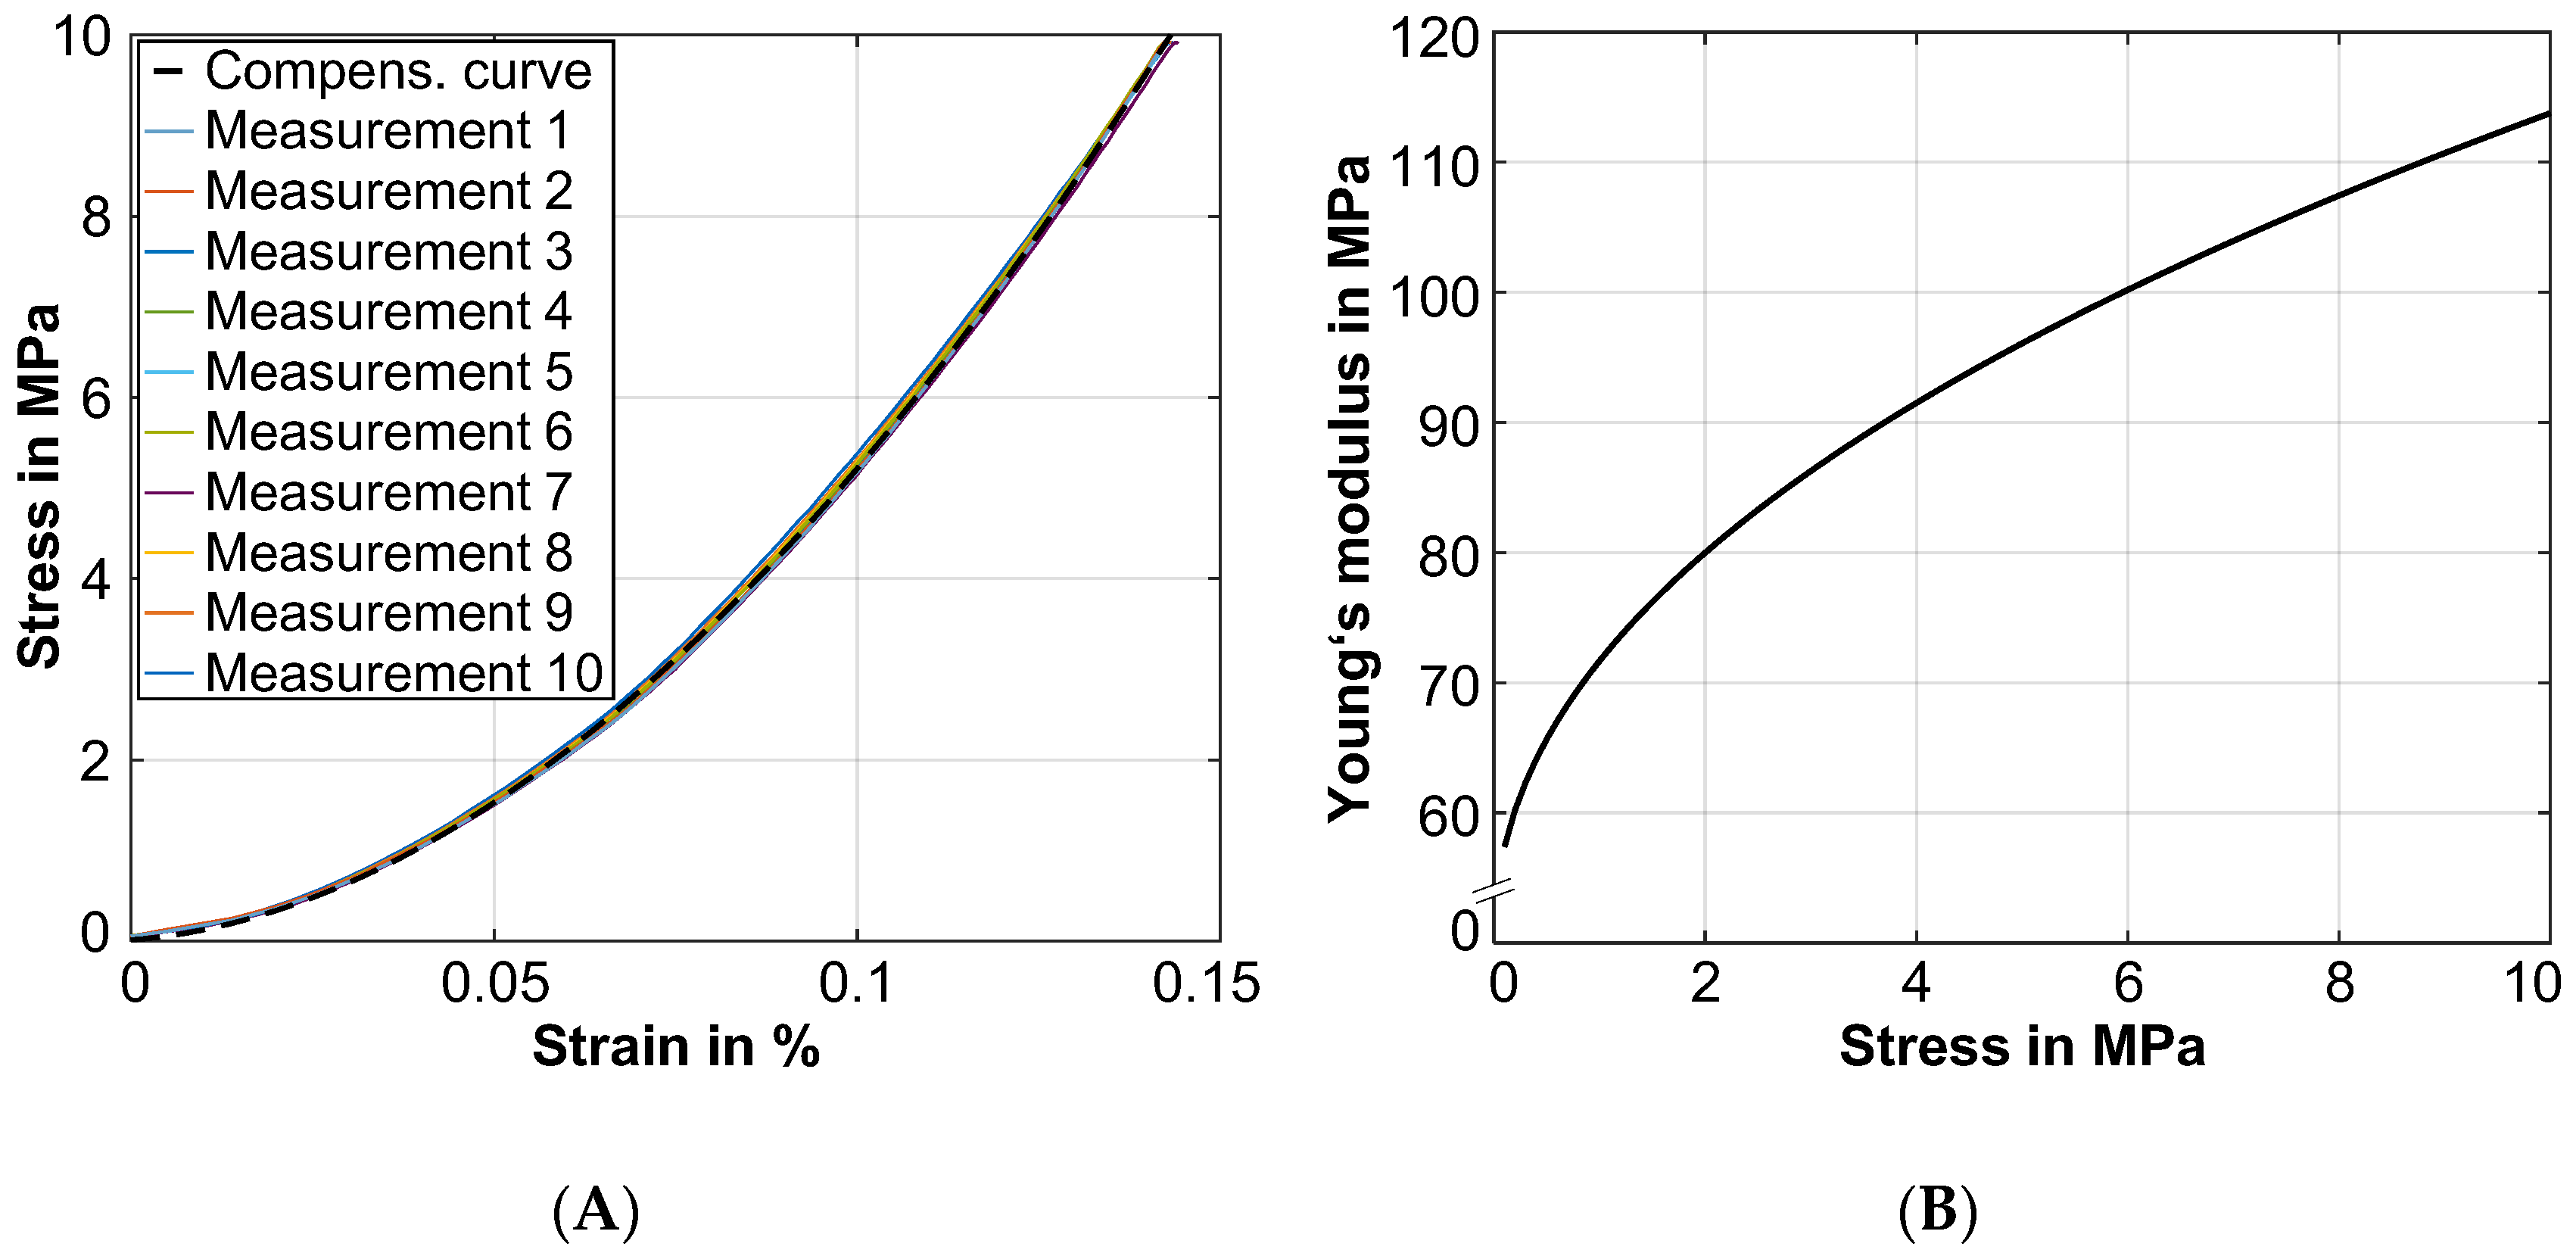
The Young’s modulus of the friction lining is measured. For this purpose, ten compression tests are carried out with a set of plates (six steel plates, five friction plates). The measured data are shown in Figure 3 on the left. The material behavior is nonlinear. The measured data are described by a compensation curve to determine the Young’s modulus:
σ = ( x c a ) 1 b .
The Young’s modulus is the slope of the curve in the stress–strain diagram or, in mathematical terms, the first derivative of stress with respect to strain. The first derivative of Equation (17) is:
E ( σ ) = σ ( σ ) = σ 1 b 1 a · b .
Thus, the Young’s modulus of the friction lining can be described as a function of stress. The curve is shown on the right in Figure 4.

3.5. Simulation Process

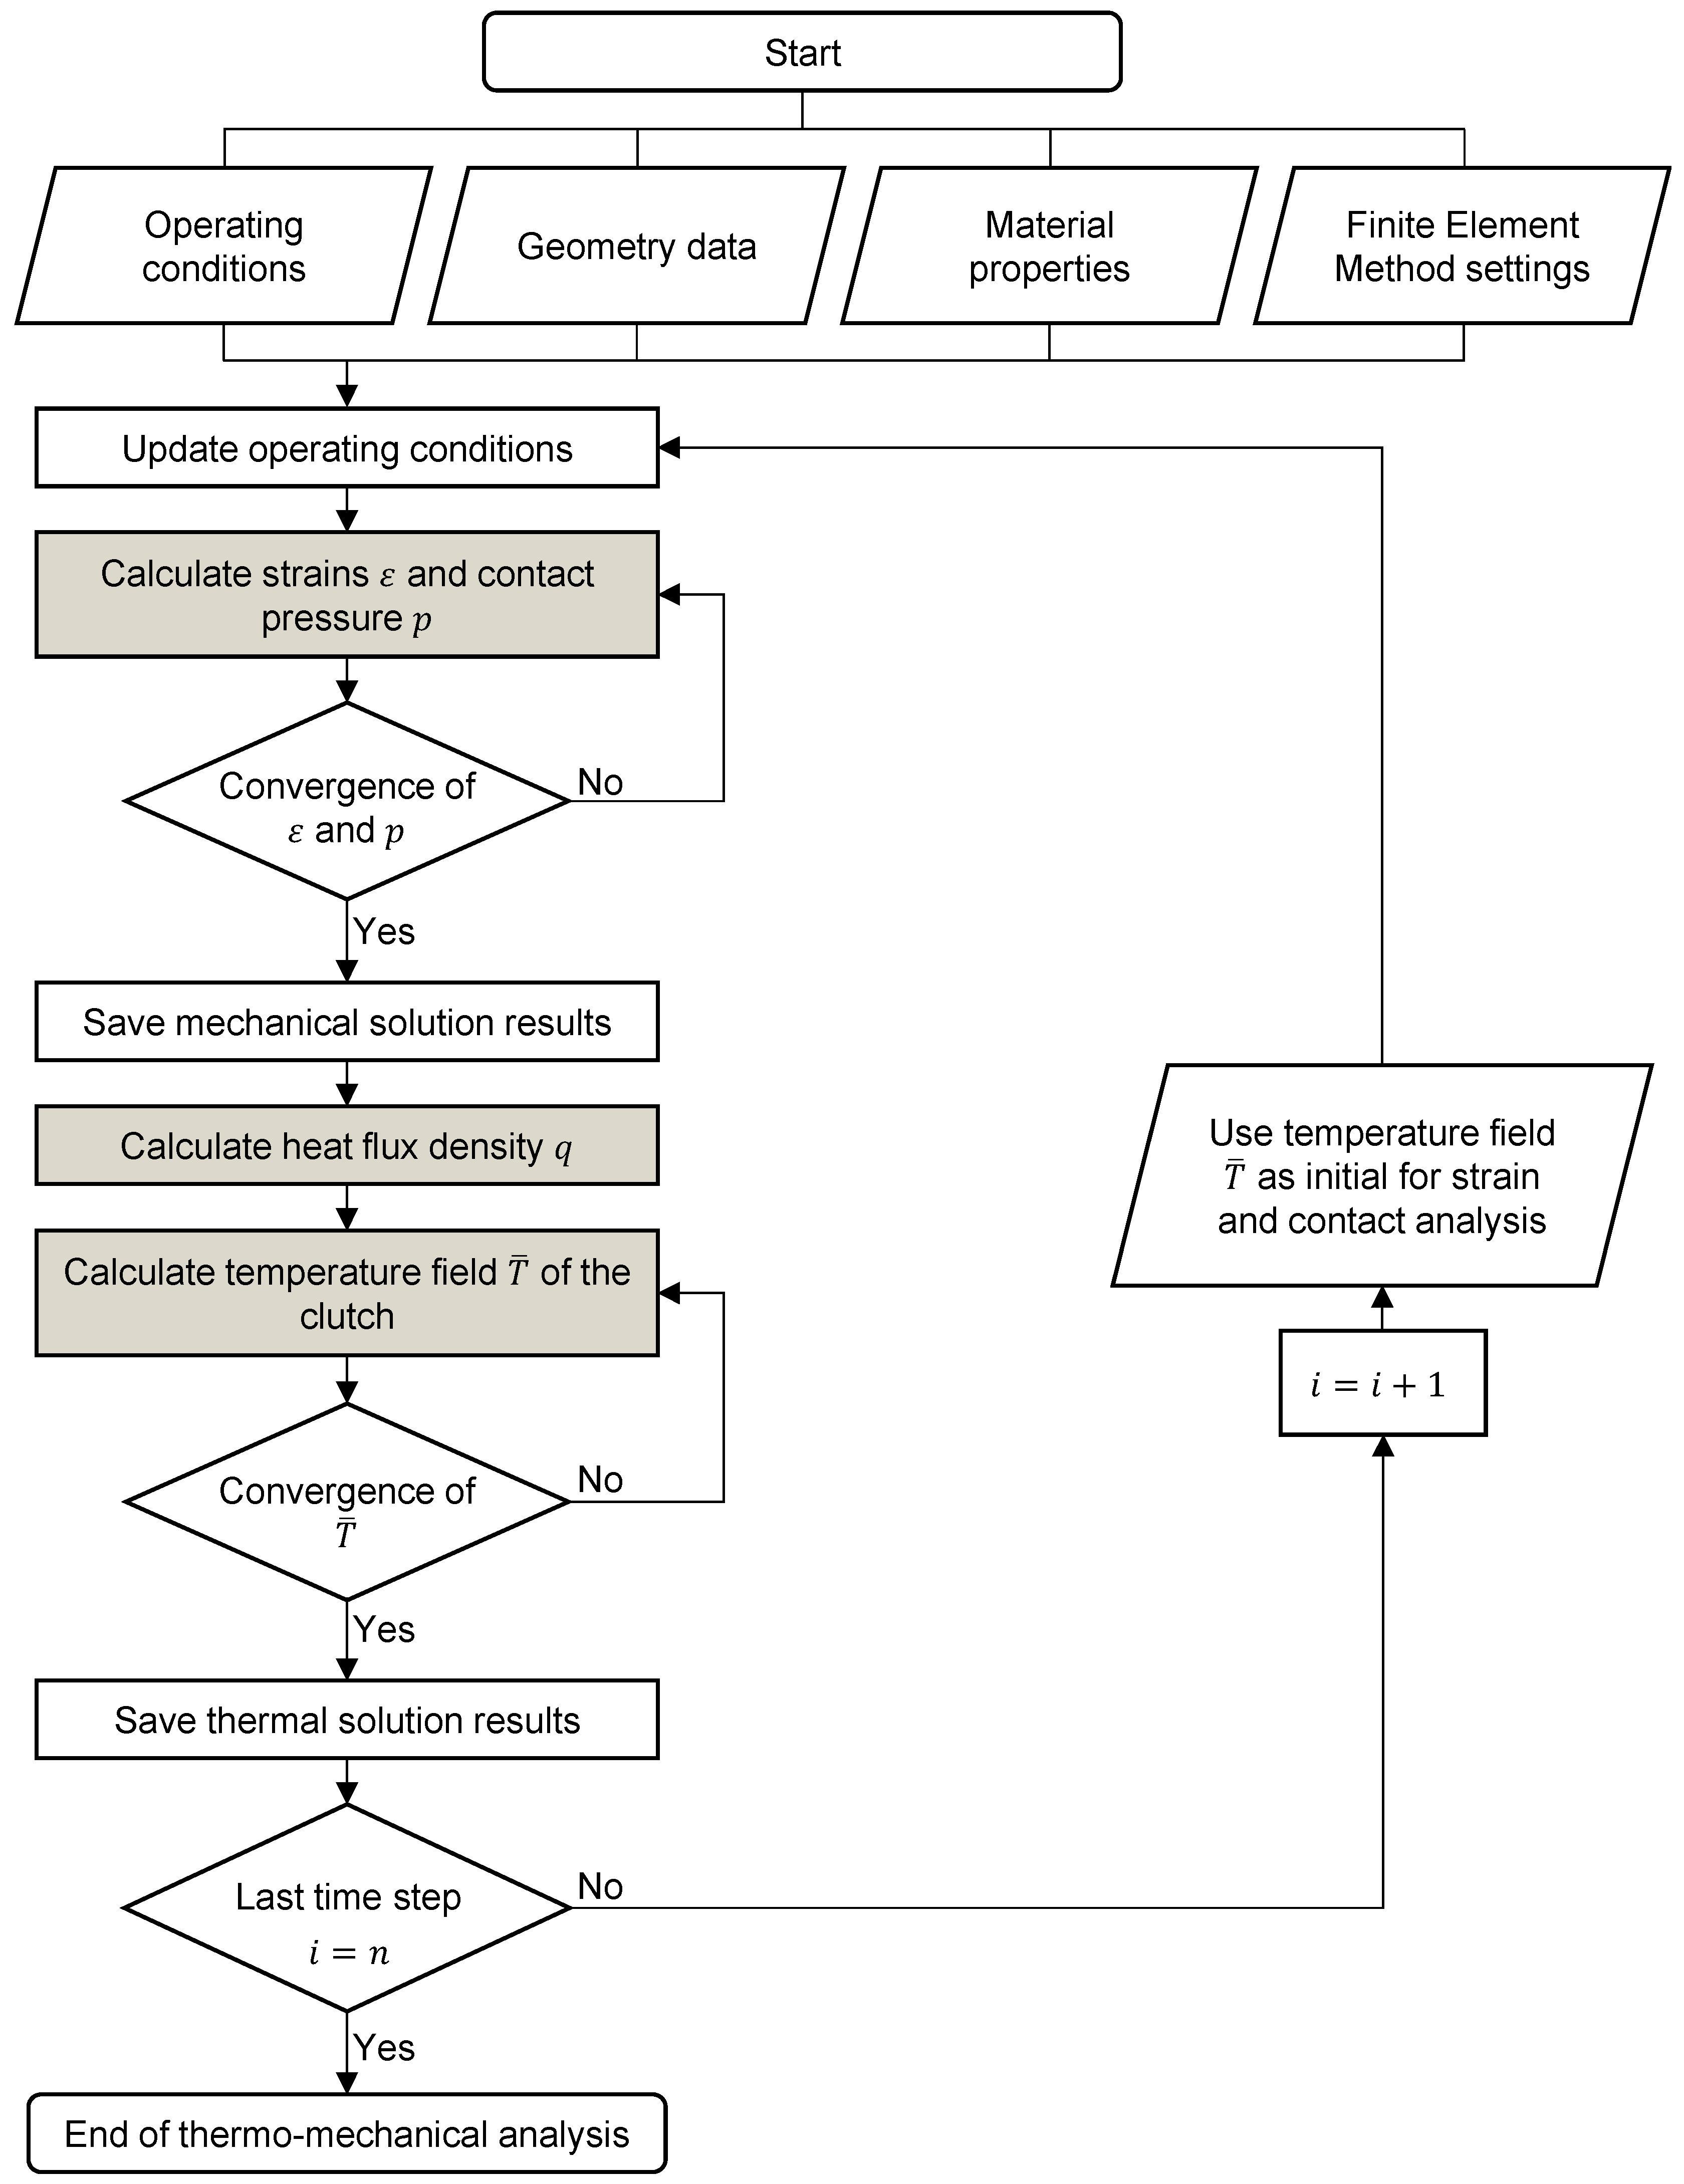
The previous sections presented the operating conditions, geometric conditions, material parameters, and simulation settings (element selection, Neumann boundary conditions, Dirichlet boundary conditions). In Figure 5, the simulation process is visualized again as a flow chart for better understanding. After all necessary parameters for the simulation have been defined, the mechanical calculation starts. The calculated pressures are needed for the calculation of the heat flux density. The heat flux is introduced, and the temperature field of the clutch is determined in the thermal simulation. After completing the sub-steps, a comparison ( i = n ) with the number of time steps takes place. For the following calculation step, the thermal analysis results are used as input files for the mechanical calculations.

4. Results

In the following subchapters, the mesh and time-step size studies are performed first. These studies ensure that the simulation results are independent of the numerical parameters. The validation of the simulation results with experimental test data follows. After the functionality and plausibility of the simulation model have been proven, selected results are presented.

4.1. Mesh and Time-Step Sensitivity Analysis

Figure 6 represents the FE model for the mesh and time-step sensitivity analysis. The maximum temperature ϑ m a x in the axial center and at the level of the mean friction diameter r m of the third steel plate was used as convergence criterion (see Figure 6). Thus, the temperatures at the identical location are compared for all simulations performed.
The loading parameters of the simulations for the studies are listed in Table 3.
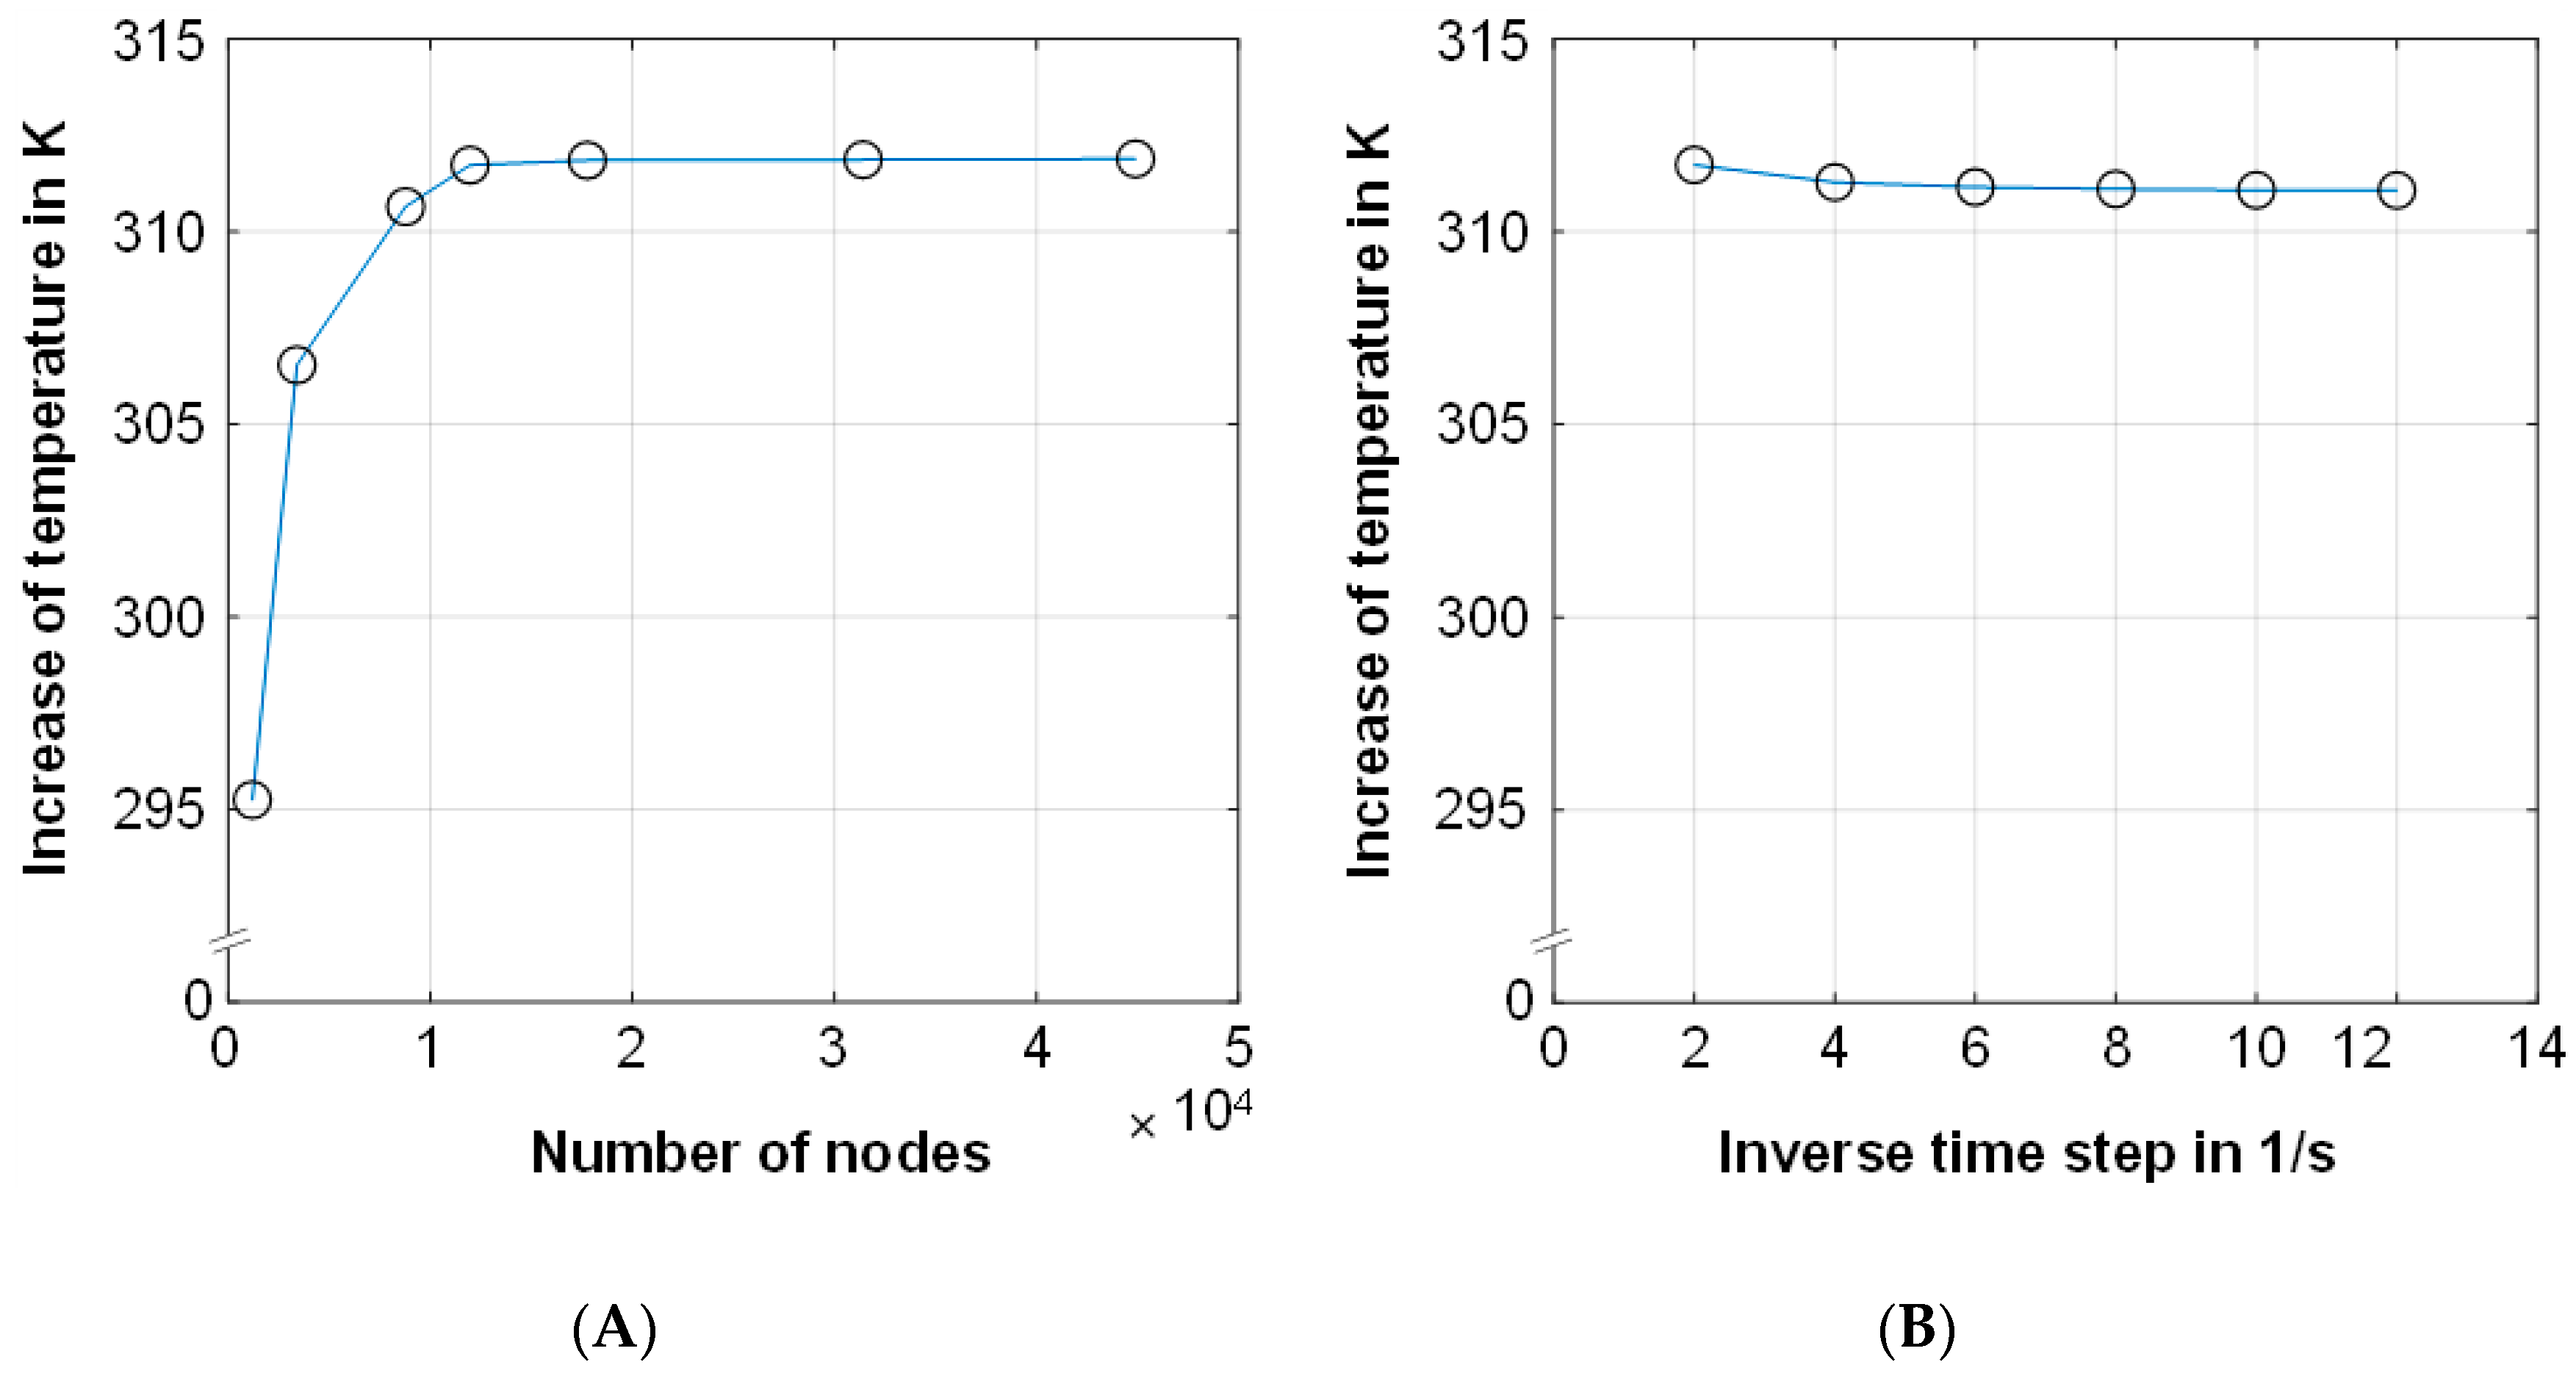
Figure 7 shows the simulated maximum temperature ϑ m a x as a function of different numbers of nodes and time-step sizes. For the mesh analysis, the lowest number of nodes corresponds to 1190 and is successively increased. The numerical solution is only slightly affected by the computational mesh and converges as the number of elements increases. A node number of more than about 11,000 is evaluated as sufficient for the following calculations. This corresponds to an edge length of 0.2 mm. The smallest time-step size corresponds to 0.5 s and is given by the pause between two slip phases (see Figure 3). The differences of the numerical solution as a function of the time-step size are very small, and the solution is thus only slightly influenced by the time-step size. A halving of the time-step size corresponds approximately to a doubling of the computation time. The increase in accuracy does not justify the increase in computation time here. For the following calculations, a time-step size of 0.5 s is used.

4.2. Validation with Experimental Data

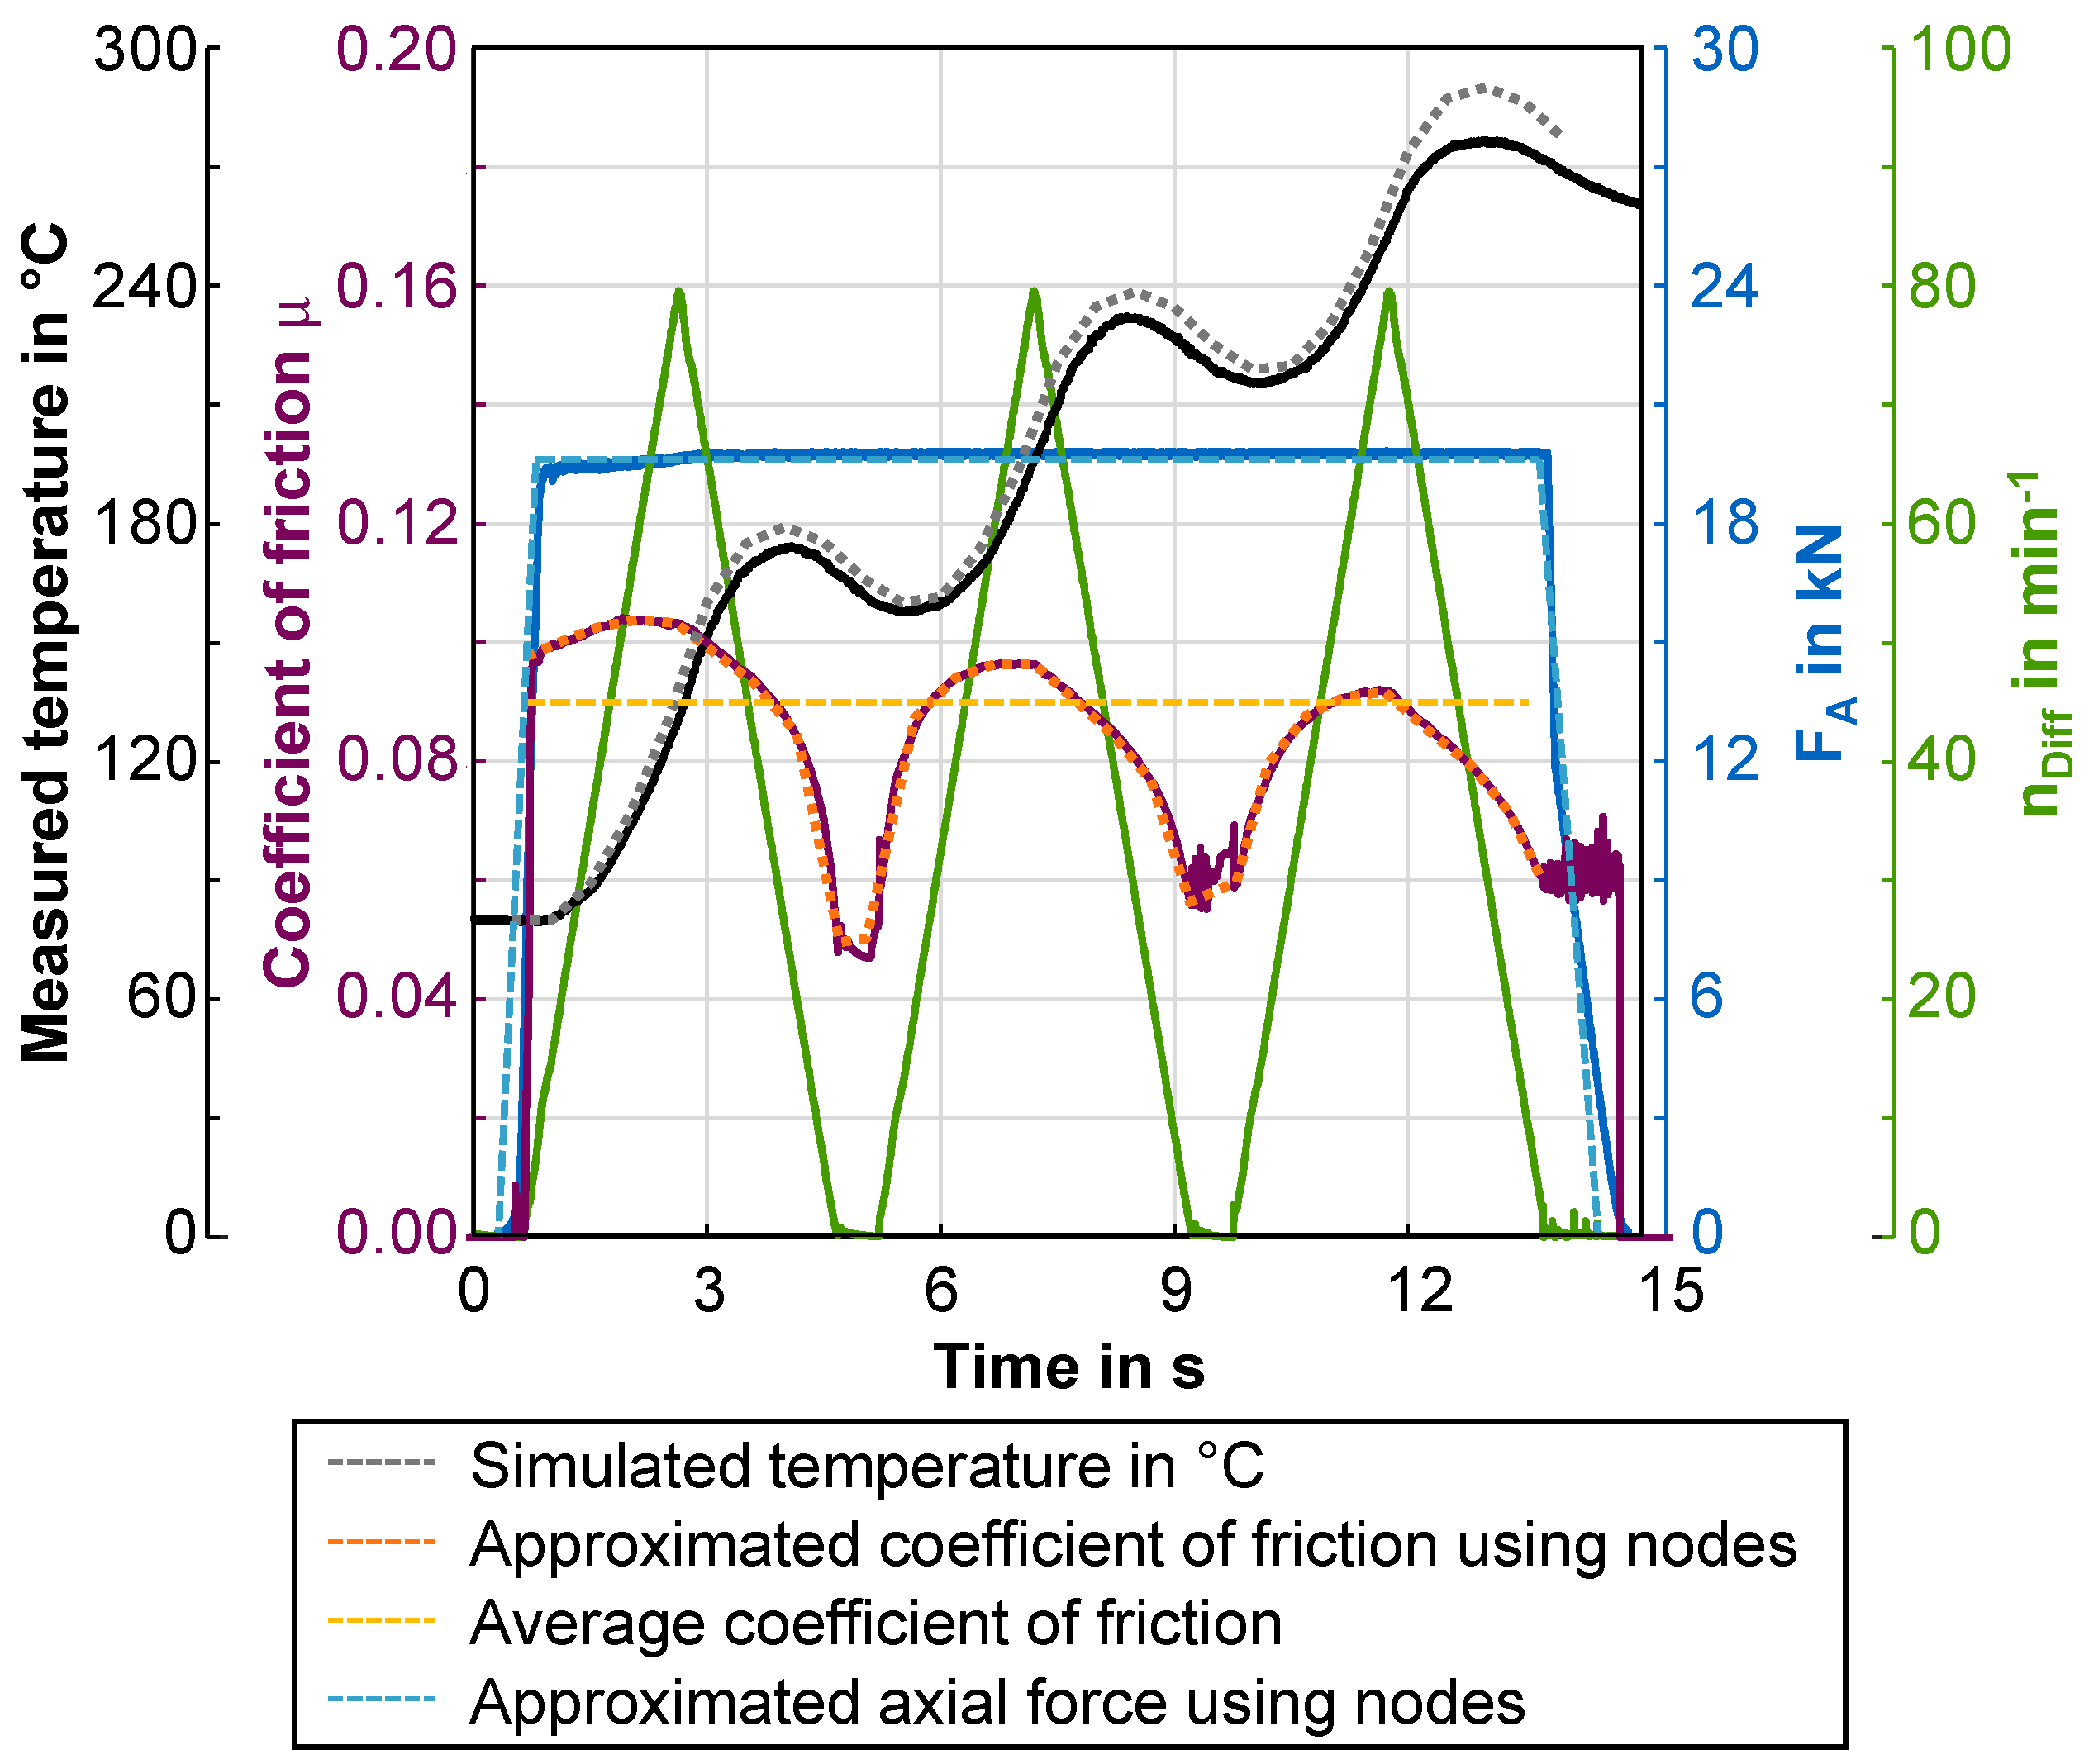
Experimental tests are used to validate the simulation model to ensure that it represents reality. For this purpose, temperature measurements are carried out and compared with the simulation results. First, a single test with three slip phases is modeled in the simulation framework. The measured coefficient of friction from the experimental test is reproduced in the simulation using many reference nodes. Differential speed and axial force were assumed to be linear and absolute values were taken from the measurement. The data are listed in Table 4. The location of the temperature measurement point in the experiment and the evaluation point of the temperature in the simulation are the same (see Figure 6). The measured data from the experimental test, the approximated friction coefficient curve, and the simulated temperature curve are shown in Figure 8. The measured and simulated temperature curves agree very well over the total test duration. The deviations between measurement and simulation are in the range of ±10 K. Figure 8 shows that the simulated temperatures tend to be higher than the measured ones and that the measured temperature increases are flatter than the simulated ones.
For a more comprehensive validation of the simulation model, many individual tests were carried out on the test rig, and the measurement results were compared with the simulation results. For each test, the average value of the measured coefficient of friction over the entire slip cycle was determined and input into the simulation model. The tests were performed with the following parameters:
  • p = 4.0 8.0   N / m m 2
  • n D i f f , m a x = 60 140   min 1
  • Number of slip phases N = 1 3
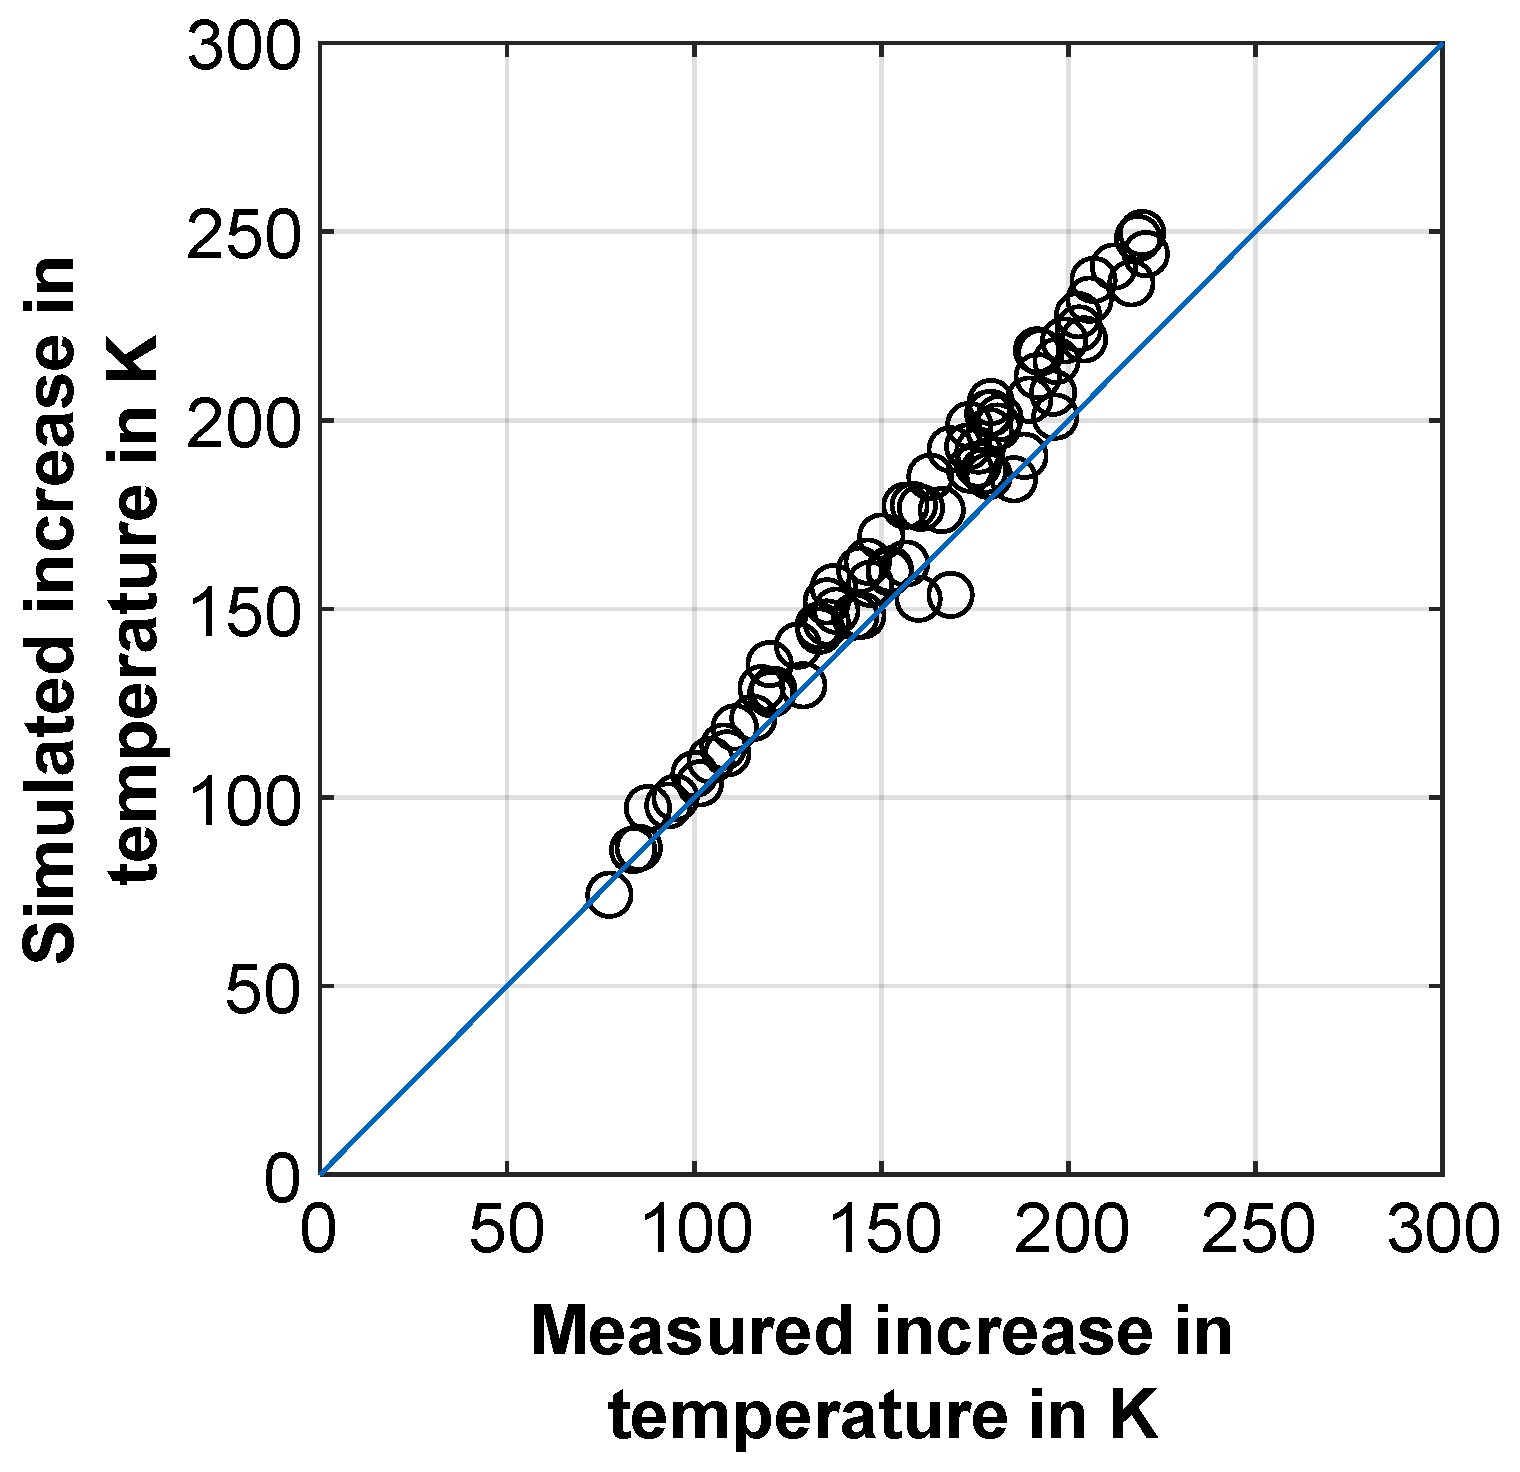
A comparison between simulated and experimental results is shown in Figure 9. Identical results between simulation and measurement exist if the data points are located exactly on the bisector of the angle. A correlation of the simulation results with the experimental measured values for all load cycles is seen. The deviations between simulation and test rig results are larger at high temperatures. Overall, the differences are very small and do not exceed 10% at any point.

4.3. Temperature and Pressure Distribution

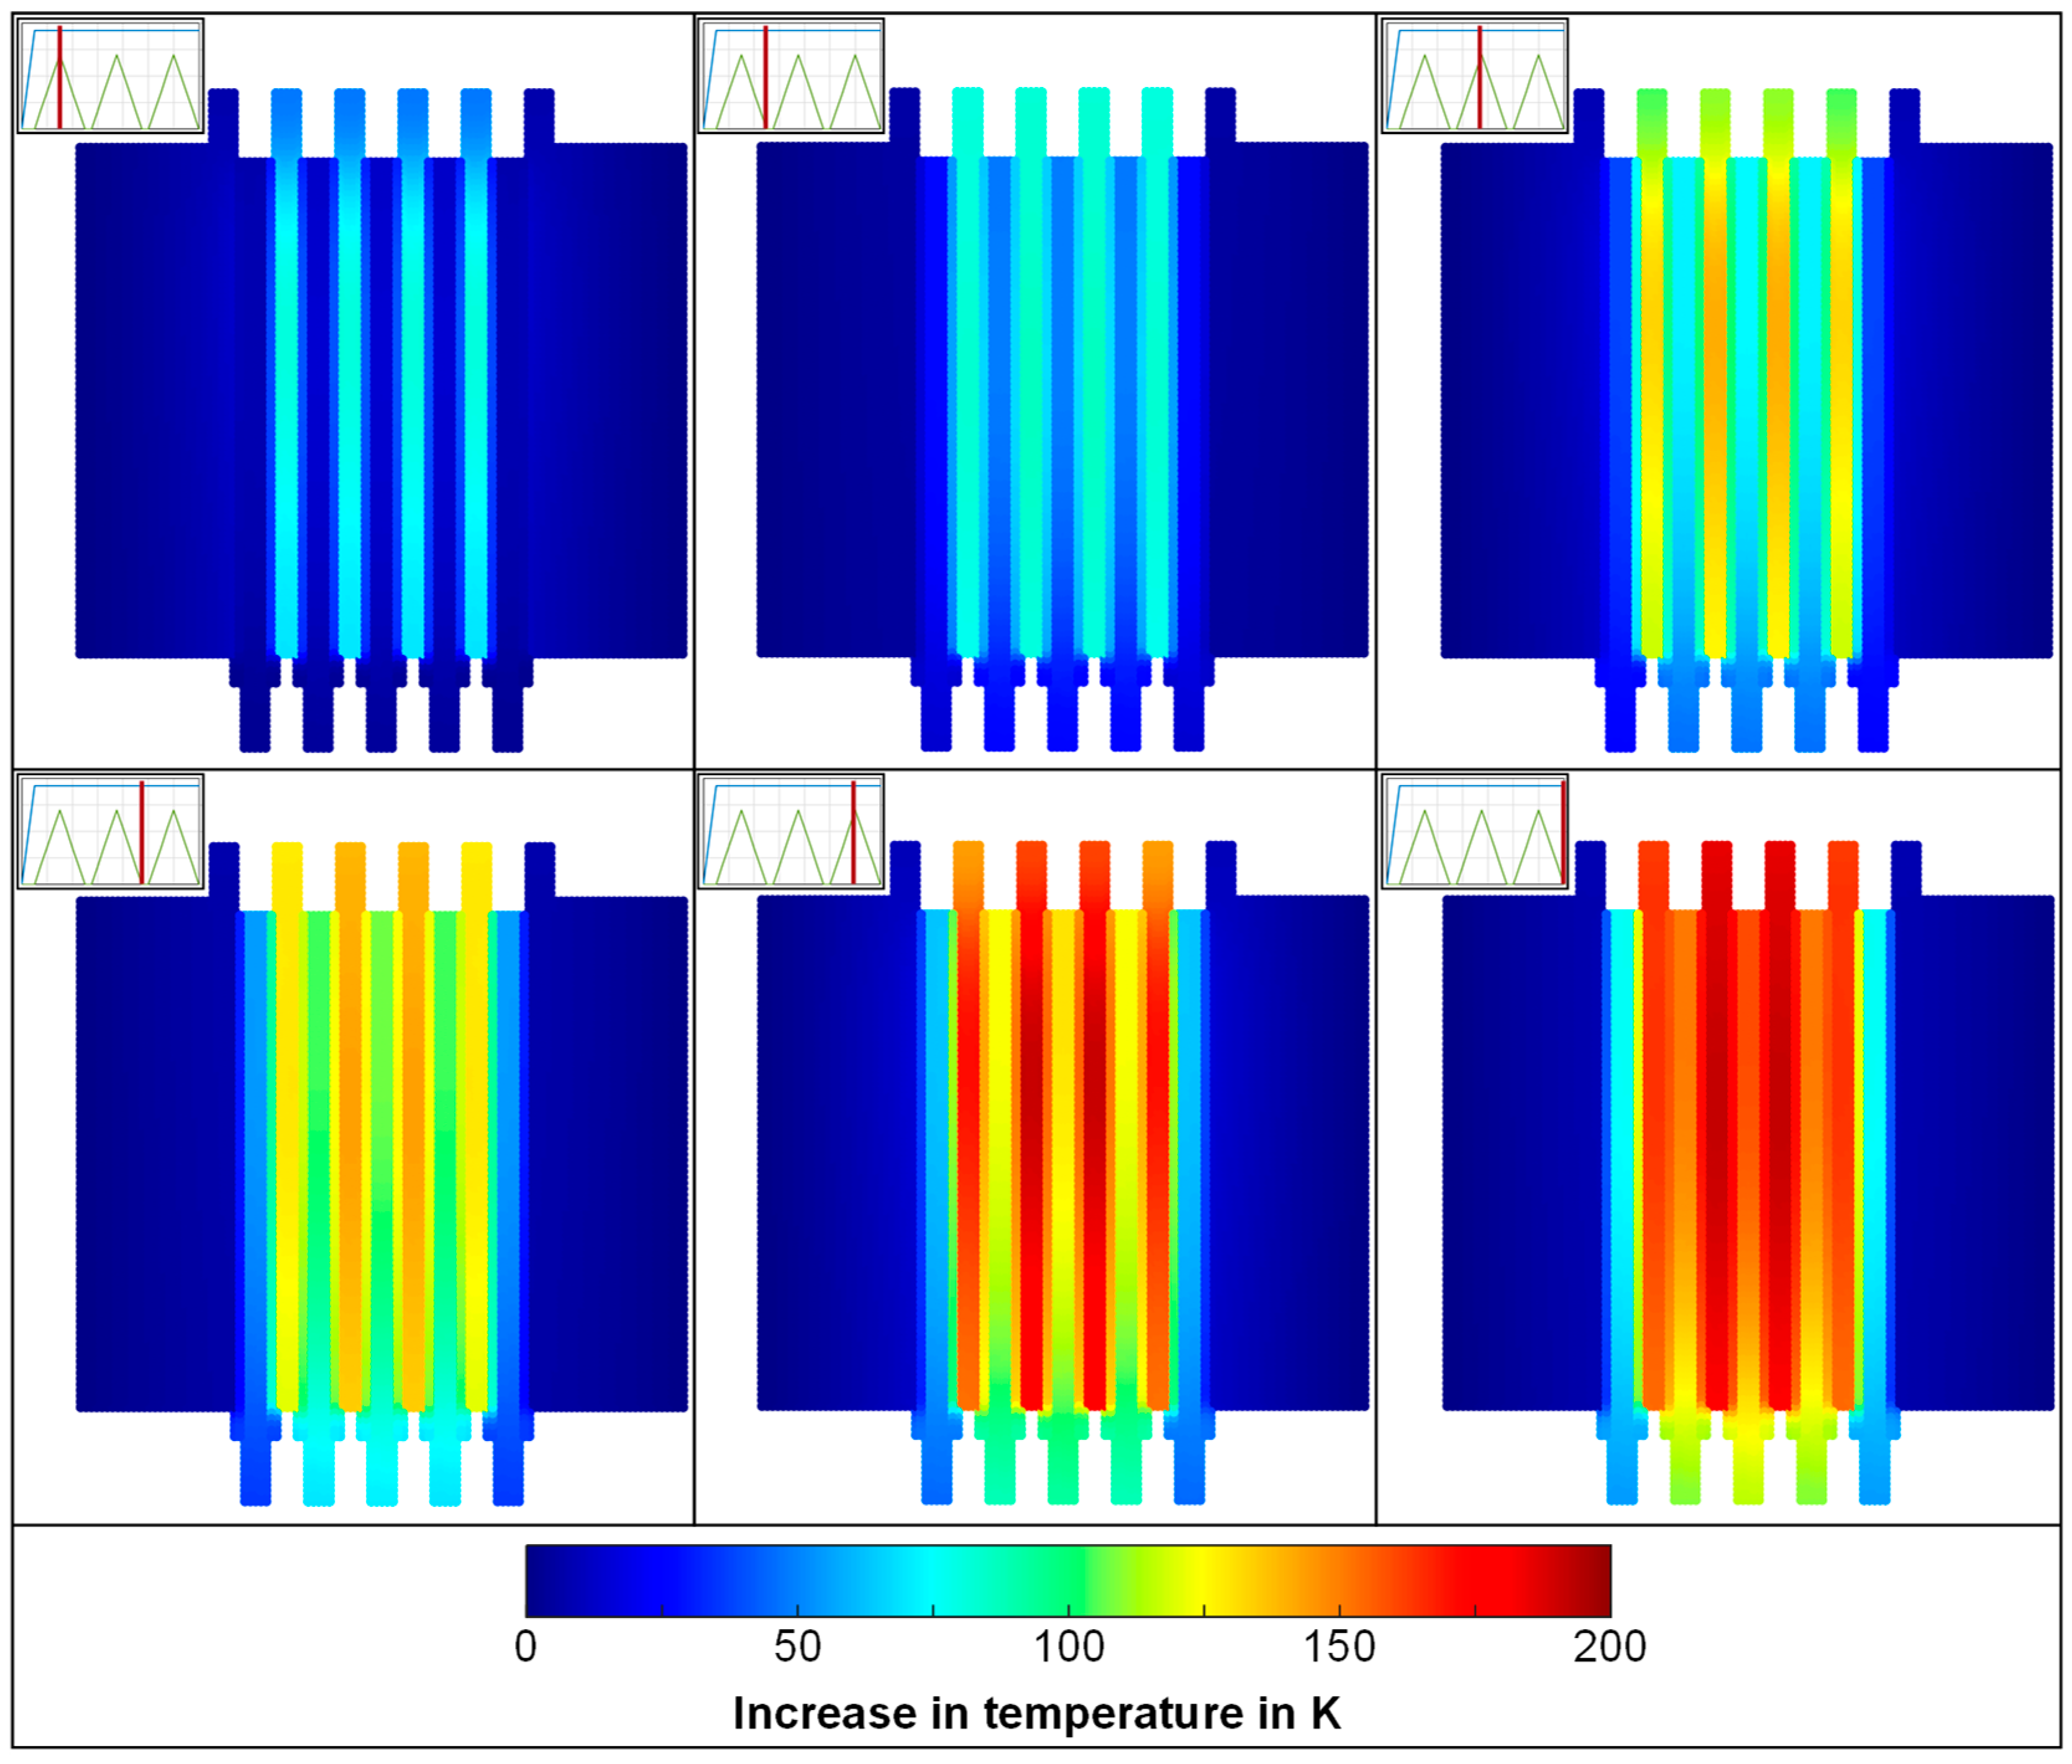
After verifying the simulation model concerning numerical parameters (number of nodes, time-step size) and validating with experimental data, the temperature and pressure distribution during a slip cycle is examined in more detail below. Figure 10 shows the temperature distribution of the clutch at different times during the slip cycle. The load and simulation parameters correspond to the circuit shown in Figure 8 and are listed in Table 3. Figure 10 shows that the clutch assembly continues to heat up due to excitation with several slip phases. The highest heating occurs within the steel plates. The heat dissipation to the carriers and the lack of frictional contact at the inner and outer diameters create a temperature gradient in the radial direction across the individual plates. This gradient is more noticeable at the maximum speed difference than at the end of a slip phase. Corresponding to the heat dissipation at the reaction and pressure plate, the outer areas of the multi-plate clutch heat up less in the axial direction. The temperature maximum is observed in the two steel plates in the clutch center.
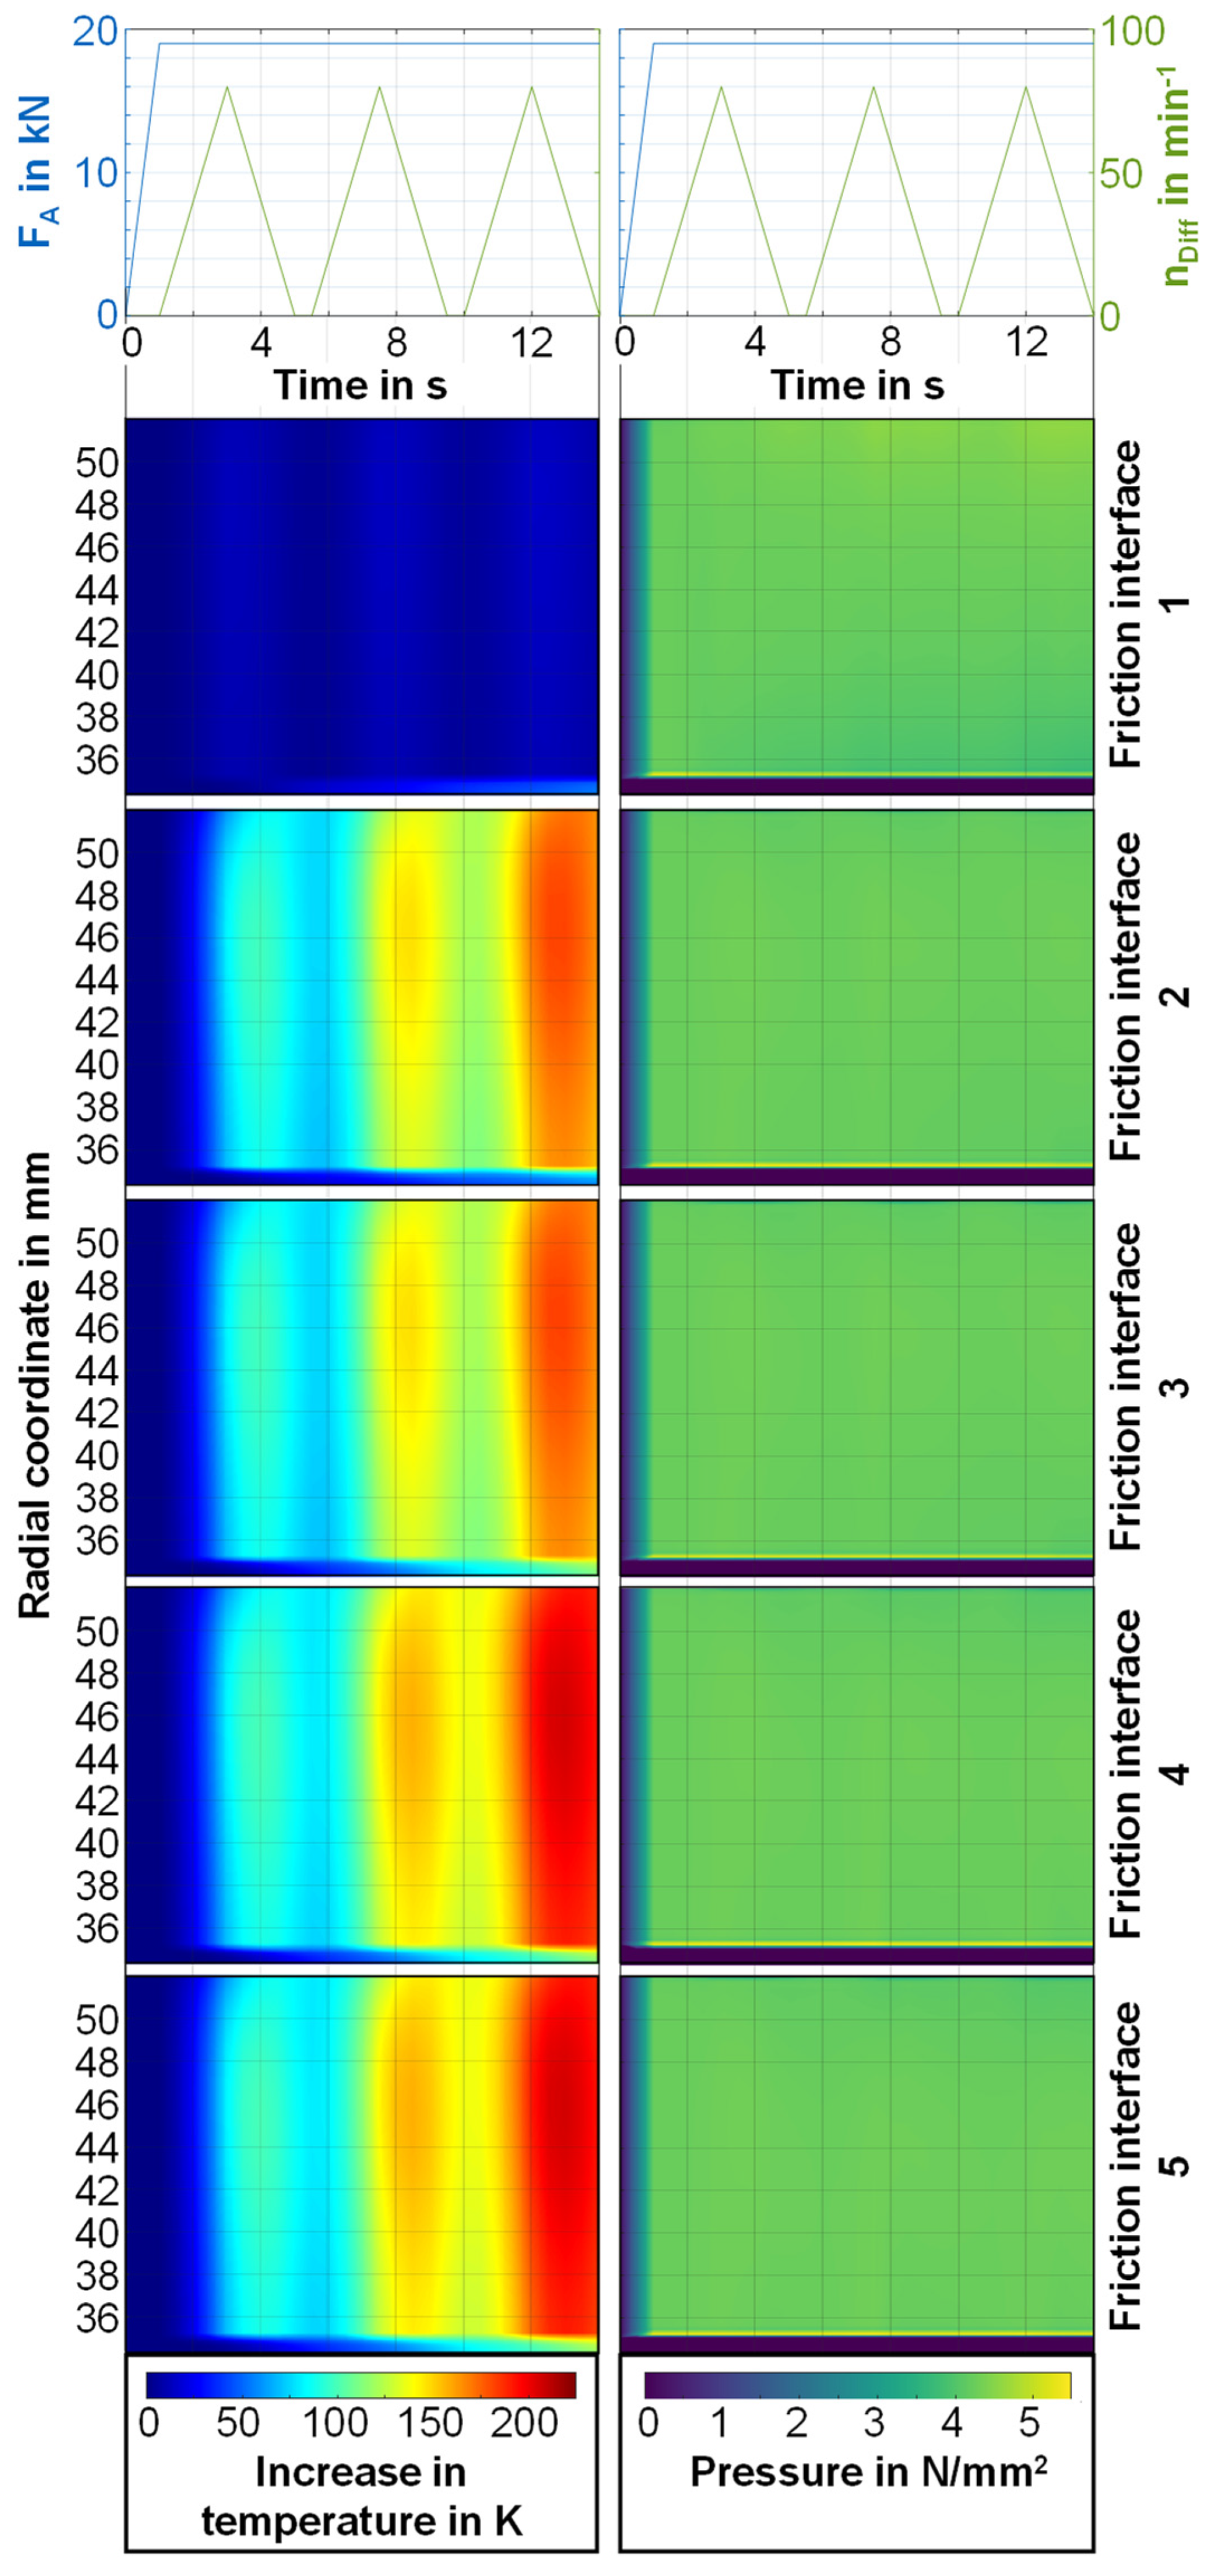
Figure 11 shows the temperature and pressure distribution of friction interfaces 1–5 as a function of time. The results for friction interfaces 6–10, which are identical to those of friction interfaces 1–5 due to the symmetrical structure of the model, can be found in Figure A1 in the Appendix A. As shown in Figure 10, the temperature distribution shows that the friction interfaces in the center of the clutch heat up more than the outer friction interfaces. The temperature distribution with respect to time shows that the heating occurs with the individual sliding phases. The temperature maximum for each slip phase is reached after the respective speed maximum. Between the individual slip phases, the temperature at the friction interfaces decreases. In the radial direction, it can be observed that the highest temperatures occur at approximately 46 mm and thus rather at the outer diameter. The inner diameter heats up with a delay because no heat is introduced due to the non-existent contact (see Figure 6). These interfaces are heated by heat conduction alone. The absolute temperature rise decreases from slip phase to slip phase, as can also be seen in Figure 8. The pressure distribution is very homogeneous after the axial force buildup. A slight increase in pressure can be observed on the inner diameter at the contact edge. In radial direction < 35 mm, no contact takes place so that the pressures are 0. Over the complete slip cycle, no differences in the pressure level can be seen. There are also no differences in the pressure distribution in radial direction except for the contact edge on the inner diameter or over the respective friction interfaces.

5. Discussion

Previous studies made clear how important the temperature behavior of the clutch is for the damage behavior [4,5]. Simulation models for calculating the temperature distribution for single-disc brakes (Tirovic [9]) and multi-disc brakes (Wang [20]) were presented. However, on the one hand, these studies dealt with emergency braking and generally considered only the thermal and not the thermo-mechanical behavior of the clutch or brake. This study presented a thermo-mechanical FE simulation model for multi-disc clutches’ transient slip operating mode.
First, a mesh and time-step sensitivity analysis were performed, showing good convergence. These convergence studies ensure that the simulation results were independent of the numerical parameters. A comparison of the simulation results with experimental measurements followed. First, a single slip cycle was simulated very accurately by passing the coefficient of friction over many reference nodes as an input parameter to the simulation. It was found that the simulated temperature tends to be higher than the measured one. In addition, the temperature rise in the simulation is steeper than in the experiment. These observations have also been described many times in the literature [28,31]. The reasons for this deviation are poor contact between the sensor and the component despite the use of thermal paste, a manufacturing deviation of the bores for the thermocouple, inaccurate material parameters, and thermo-mechanical deformation of the bore. Subsequently, many different slip cycles were recalculated and compared with the measured data. For each slip cycle, the respective mean value of the measured coefficient of friction was used as an input parameter for the simulation model. Simulated and measured temperatures matched very well. The simulated temperature values are higher than the measured ones at higher temperature levels. In the simulation model, temperature-independent material parameters were used. The difference between simulated and measured values can be explained by temperature-dependent material properties of the steel and friction lining material. The temperature and pressure distributions presented in Section 4.3 showed that the clutch heats up most in the axial center. Consideration of thermal conduction to the mounting parts such as the pressure and reaction plate is responsible for cooling the outer plates. The mounting parts have a very large thermal mass and heat up only slightly compared to the plates. Heat exchange occurs with the outer and inner carriers in the radial direction. Hence, the inner and outer diameters of the plates heat up slightly. In addition, it must be taken into account that the thermal mass of the teeth for 2D modeling was added evenly to the outer and inner diameters. The thermal mass of steel plates and lining plates in the simulation model thus corresponds to the thermal mass of the physical components. The results showed higher temperature gradients in the parts in the area of the speed peaks than between the breaks and at low speeds. The high frictional power (see Equation (1)) results in intense heating of the friction interfaces. In the case of low frictional power, temperature equalization occurs due to thermal conduction (see Equation (6)). The thermal conduction between the individual plates is limited by the low thermal conductivity of the friction linings. In the temperature plots of the individual friction surfaces over time (see Figure 11), the results of the overall plot of the clutch (see Figure 10) are confirmed. The temperature maximum for each slip phase is reached slightly after the speed maximum. Subsequently, there is a decrease in temperature on the friction surface since thermal conduction (see Equation (6)) outweighs the heat input (see Equation (1)). The pressure distribution is very homogeneous over time for all friction surfaces. Previous studies from the literature showed significant pressure differences in the friction surface radius during the shifting [10,20]. The differences can be explained by a lower friction power compared to emergency brakes. Due to the very high sliding speeds (see Equation (1)), the frictional power is high during emergency braking, and thermal conduction takes a subordinate role. The high friction power results in high temperature differences and associated pressure differences that occur through the thermal expansion of the individual materials.
With the simulation model presented, parameter studies can now be carried out and the influence of individual geometry and material parameters on the thermal behavior of the clutch can be evaluated. The following material and geometry parameters are varied in a parameter study and the values are listed in Table 5:
  • Young’s modulus
  • Thermal conductivity of the friction lining
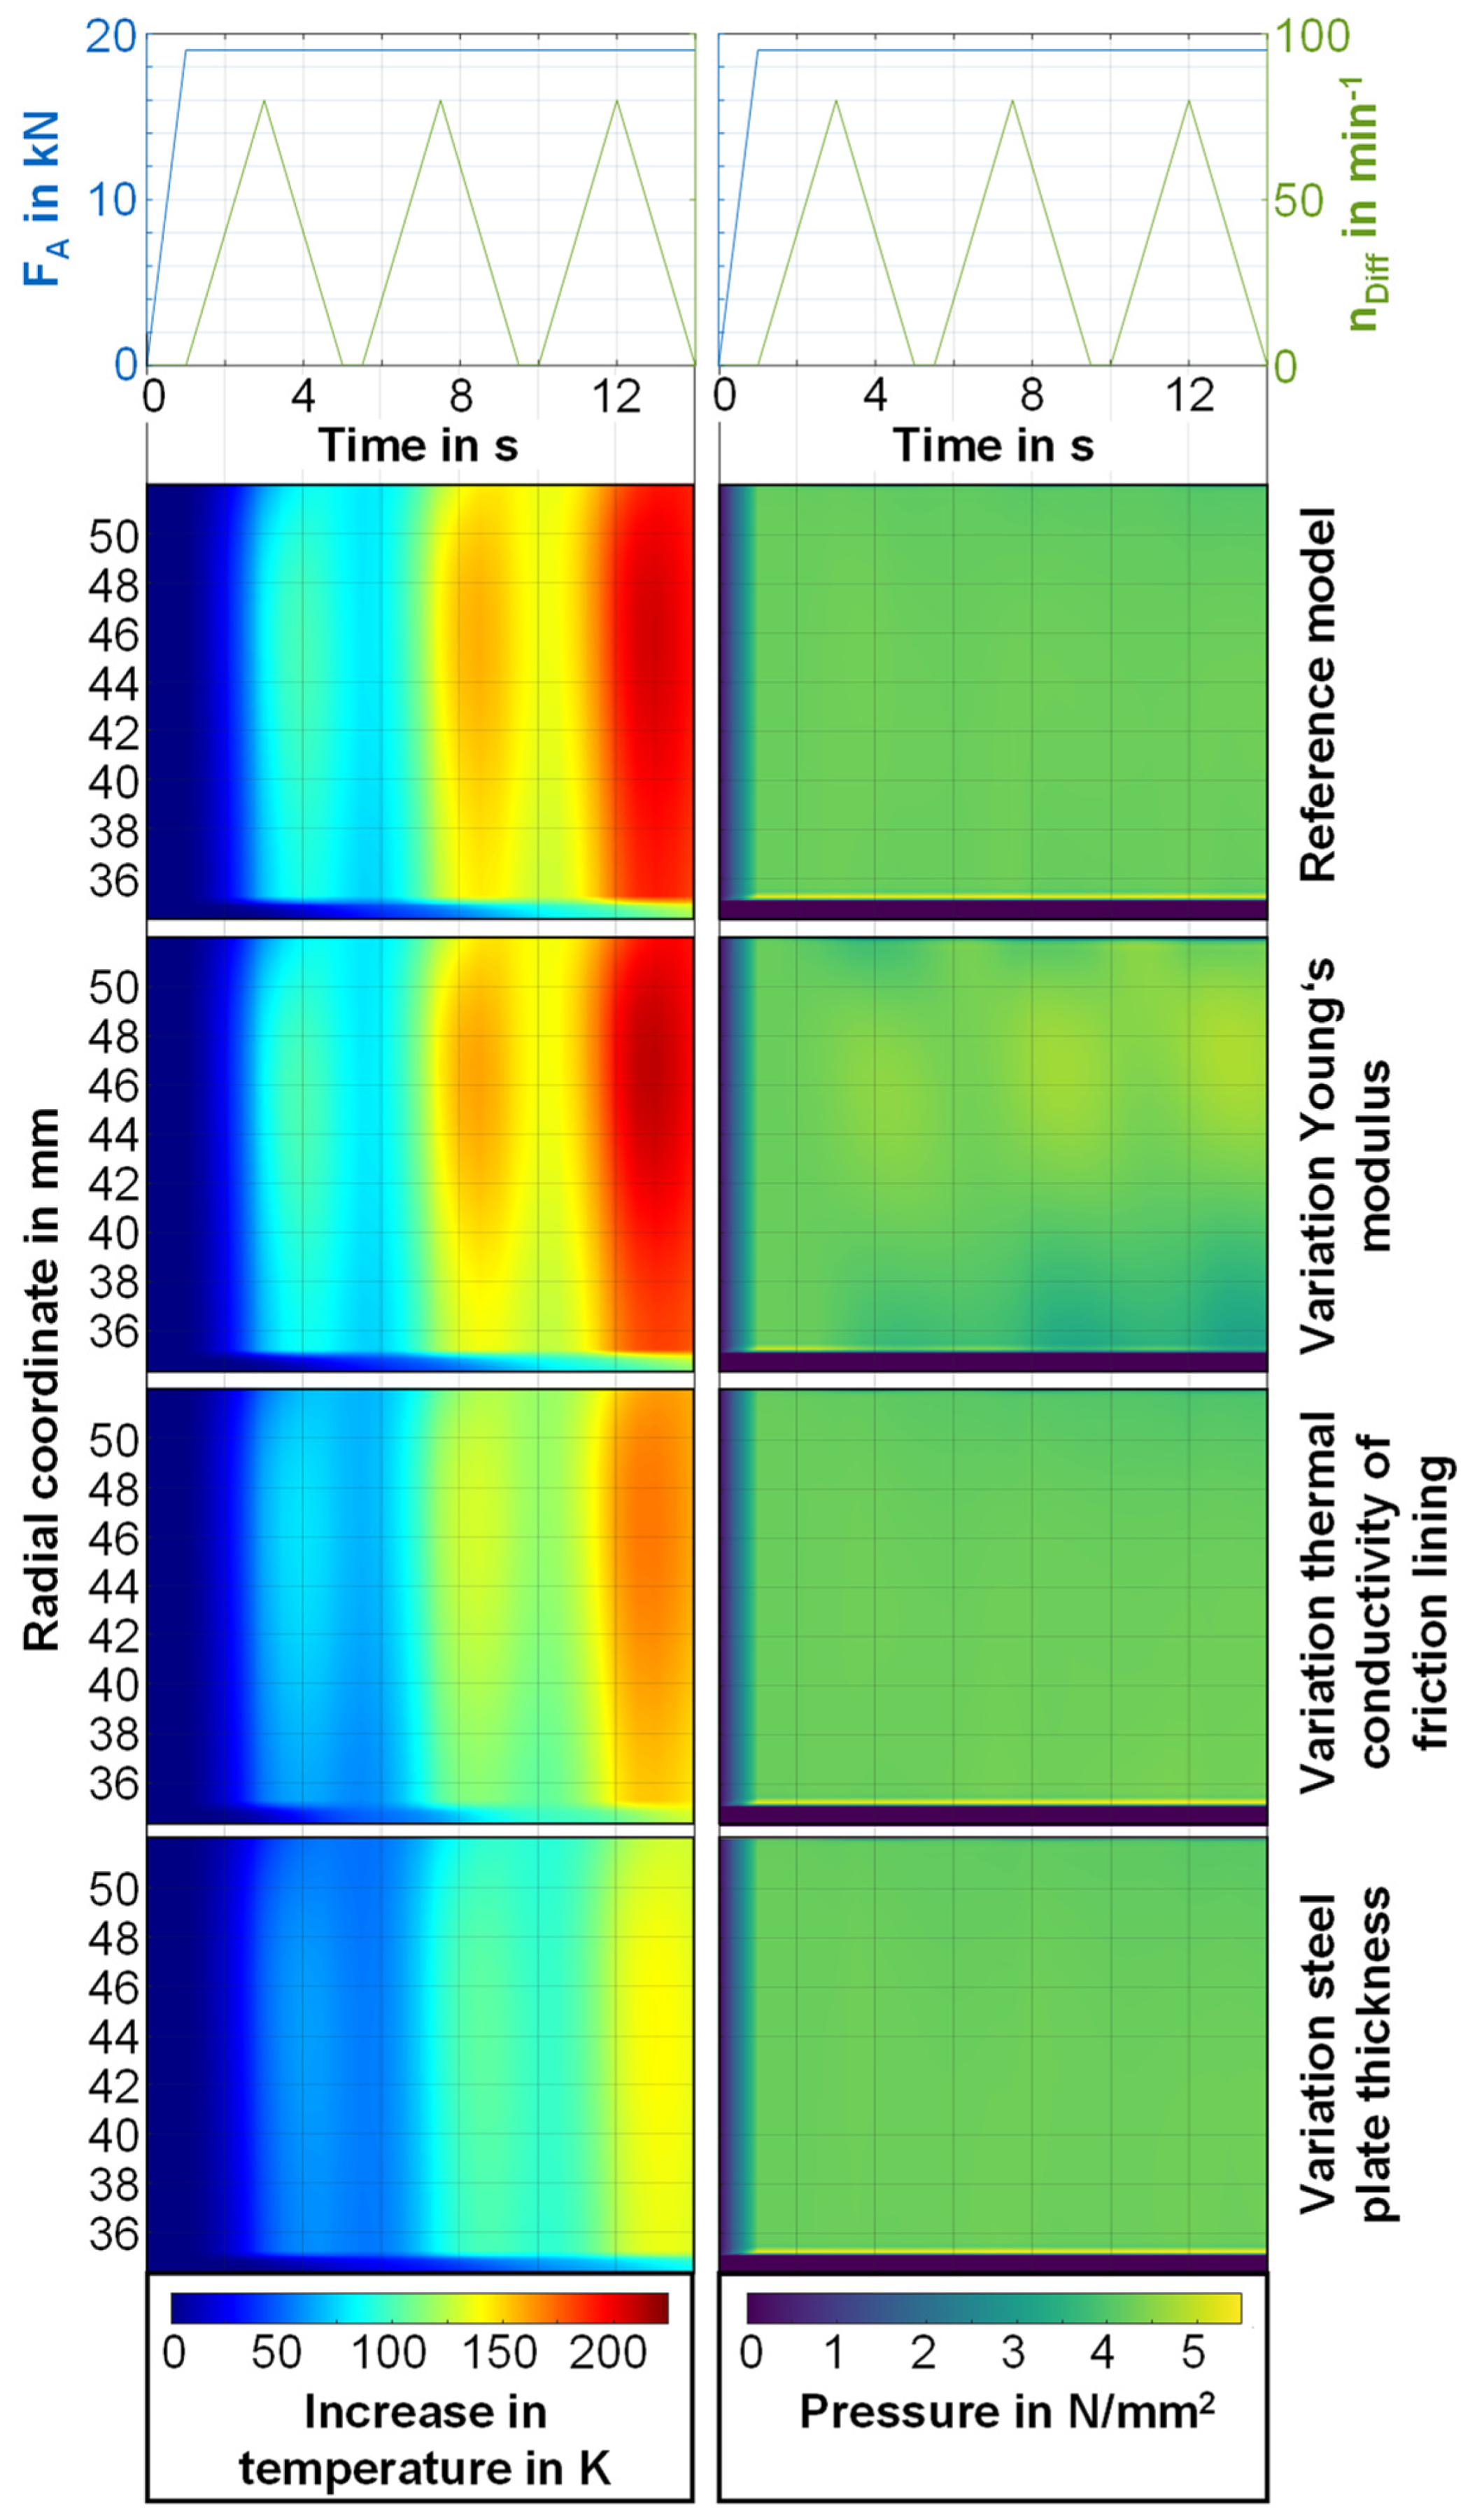
  • Steel plate thickness
According to Figure 10 and Figure 11, the highest temperature of the clutch during a slip cycle is observed in the center. Therefore, Figure 12 compares the temperature and pressure distribution for the friction interface 5 for the parameter variation. The increase in Young’s modulus by a factor of 10 results in more uneven pressure distribution and a slightly higher temperature. In the radial direction, the pressure increases in the area by around approximately 46 mm and thus rather at the outer diameter. At the same time, the pressure decreases at the inner diameter. The pressure inhomogeneity increases from slip phase to slip phase. The maximum pressure for each slip phase is reached after the respective maximum differential speed. Between the individual slip phases, i.e., during the pauses, the pressure inhomogeneity at the friction interfaces decreases. The temperature behavior corresponds to that of the reference model. The temperatures are at a slightly higher level. A direct correlation between temperature and pressure distribution is shown. In the area of high temperature differences, pressure differences can also be seen. The higher Young’s modulus of the friction lining means that micro geometric differences due to the thermal expansion of the materials are less compensated. The increased pressures simultaneously lead to higher heat flux density (see Equation (1)). Thus, the slightly higher temperatures on the friction interface can be explained. Sabri [32] describes the influence on temperature and pressure behavior during load shifting of a dry single-disc clutch. The main result is that the contact pressure decreases with a reduction of Young’s modulus of the friction linings. Furthermore, Abdulla [19] shows that the pressure homogeneity increases as the friction lining thickness increases. The results of this study confirm literature findings and extend them for multi-disc clutches under transient slip conditions. It was shown that Young’s modulus influences pressure behavior even at lower frictional power levels. However, the temperature differences resulting from the variation of Young’s modulus are evaluated as small due to the low frictional power (see Equation (1)).
As the next variation parameter, the thermal conductivity of the friction lining was tripled. In terms of pressure distribution, no differences are apparent compared to the reference model. The temperatures, in turn, are at a lower level and differ by up to 36 K in the temperature maximum. Due to the thermal conductivity of the lining, more heat conduction takes place in the axial direction between the individual plates and the mounting parts. Hence, the mounting parts have a more substantial cooling effect and at the same time, more heat energy is absorbed by the carrier plates of the friction plates compared to the reference model. Similarly, Zhao [15] showed an influence of the thermal conductivity of the friction lining on the maximum temperature of a multi-plate clutch during load shifting in a simulation model without heat conduction to mounting parts.
As the last parameter, the thickness of the steel plate was doubled. Concerning the pressure distribution, no differences from the reference model are evident. The maximum temperature is 66 K lower than in the reference model. The temperature behavior over time is comparable to that of the reference model, except for the temperature level. These results confirm the simulative results of Zhao [15] and Abdulla [19], as well as the experimental results of Zagrodzki [33], Schneider [34] and Grötsch [35], describing an influence of the steel plate thickness on the thermal behavior.

6. Conclusions

A parameterizable two-dimensional FE model was developed to investigate the thermo-mechanical behavior of a multi-disc clutch in transient operation. The pressure and temperature distributions on the friction interfaces were determined. Numerical verification as well as validation with experimental results are very good despite the simplifications in the model. The results show that, in the axial direction, the steel plates in the center of the clutch are heated the most. In the radial direction, the maximum temperatures tend to be at the outer diameter of the friction interface. In a parameter study, the influence of the Young’s modulus of the friction lining, the thermal conductivity of the friction lining, and the steel plate thickness on the temperature and pressure behavior in the clutch is investigated. Even though the Young’s modulus of the friction lining influences the pressure distribution in the friction contact, the temperature behavior is only slightly changed by the variation of the Young’s modulus due to the load case. The thermal conductivity of the lining and the steel plate thickness have a strong influence on the temperature level in the clutch. However, the pressure distribution is very homogeneous despite the temperature change due to variation of thermal conductivity and steel plate thickness, as in the reference model. Since wear affects the pressure behavior [36], the coefficient of friction [37,38], and the tendency to thermoelastic instability [39,40], it should be taken into account in future investigations. Other geometric and material specifics such as carrier plate thickness, friction lining thickness, inner and outer diameters of steel and lining plate, heat capacity and density can be varied in future investigations. In addition, the influence of the load parameters (axial force, differential speed) on the temperature and pressure behavior is of interest.

Author Contributions

Conceptualization, T.S.; methodology, T.S.; validation, T.S. and M.D.; formal analysis, T.S. and M.D.; investigation, T.S.; resources, K.S.; data curation, T.S.; writing—original draft preparation, T.S.; writing—review and editing, M.D., K.V., H.P. and K.S.; visualization, T.S. and M.D.; supervision, H.P., K.V. and K.S.; project administration, T.S. All authors have read and agreed to the published version of the manuscript.

Funding

The presented results are based on the research project FVA/FVV No. 515/VI; self-financed by the Research Association for Drive Technology e.V. (FVA)/Research Association for Combustion Engines e.V. (FVV). The authors would like to thank for the sponsorship and support received from the FVA/FVV and the members of the project committee.

Data Availability Statement

Not applicable.

Conflicts of Interest

The authors declare no conflict of interest.

Nomenclature

SymbolUnitDescription
A m 2 Apparent contact area
a Regression coefficient = 0.04345
A F E M o d e l m 2 Contact area in model
A F l a n k m 2 Tooth flank area
A r a t Area ratio of model to real part
b Regression coefficient = 0.5312
c Regression coefficient = 0.004454
c 1 Factor 1 for different interface roughness
c 2 Factor 2 for different interface roughness
c 3 Factor 3 for different interface roughness
c i J / kg · K Specific heat capacity of solid i
D N / m 2 Elastic matrix
d m Diameter of the force application point on the carrier
E N / m 2 Young’s modulus
F A N Axial force to actuate the clutch
H 0 MPa Hardness of contact material at temperature T 0
h c W / m 2 · K Thermal contact conductance
k 0 W / m · K Thermal conductivity of contact material at temperature T 0
L m Stretched length
L 0 m Initial length
p N / m m 2 Surface pressure
p C a r N / m 2 Pressure between carrier and plate toothing
q ˙ W / m 2 Heat flux density
Q ˙ WHeat flow rate
r m Radius
r m m Mean friction diameter
R a μmSurface roughness
t s Time
T 0 °C Reference temperature 20 °C
T 1 °C Interface temperature
T c K Temperature field carrier plate
T f K Temperature field friction lining
T i K Temperature field of solid body i
T s K Temperature field steel plate
υ r e l m / s Sliding speed
x % Strain
z m Axial coordinate
z t e e t h Number of teeth
α K 1 Linear thermal expansion
δ Proportional coefficient
a Effective arithmetic average slope
L m Length change
T K Temperature change
ε E % Mechanical strain
ε T % Thermal strain
λ f W / m · K Thermal conductivity friction lining
λ i W / m · K Thermal conductivity of solid i
λ s W / m · K Thermal conductivity steel plate
μ Effective coefficient of friction between lining and steel plate
ρ i kg / m 3 Density of solid i
σ N / m 2 Stress
θ ° Angular coordinate
ω r e l rad / s Relative angular velocity

Appendix A

Figure A1. Temperature and pressure distribution of friction interfaces 6–10 as a function of time.
Lubricants 10 00076 g0a1

References

  1. Schneider, T.; Strebel, M.; Pflaum, H.; Stahl, K. Spontaneous damage to wet-running multi-plate clutches with organic and metallic friction linings [Spontanschädigungsverhalten von nasslaufenden Lamellenkupplungen mit organischen und metallischen Reibbelägen]. Eng. Res. 2019, 83, 199–207. [Google Scholar] [CrossRef]
  2. Schneider, T.; Völkel, K.; Pflaum, H.; Stahl, K. Influence of Pre-damage on the Friction Behaviour of Wet-running Multi-plate Clutches in an Endurance Test [Einfluss von Vorschädigung auf das Reibungsverhalten nasslaufender Lamellenkupplungen im Dauerschaltbetrieb]. Eng. Res. 2021, 85, 859–870. [Google Scholar] [CrossRef]
  3. Schneider, T.; Voelkel, K.; Pflaum, H.; Stahl, K. Friction Behavior of Pre-Damaged Wet-Running Multi-Plate Clutches in an Endurance Test. Lubricants 2020, 8, 68. [Google Scholar] [CrossRef]
  4. Yevtushenko, A.A.; Grzes, P.; Adamowicz, A. Numerical Analysis of Thermal Stresses in Disk Brakes and Clutches (A Review). Numer. Heat Transf. Part A Appl. 2015, 67, 170–188. [Google Scholar] [CrossRef]
  5. Abdullah, O.I.; Schlattmann, J.; Senatore, A.; Sabri, L.A.; Al-Sahb, W.S.A. Effect of Sliding Speed on the Thermal Stresses of Single-Disk Friction Clutches. J. Fail. Anal. Prevent. 2020, 20, 1534–1540. [Google Scholar] [CrossRef]
  6. Kennedy, F.E.; Ling, F.F. A Thermal, Thermoelastic, and Wear Simulation of a High-Energy Sliding Contact Problem. J. Lub. Tech. 1974, 96, 497–505. [Google Scholar] [CrossRef]
  7. Zagrodzki, P. Numerical analysis of temperature fields and thermal stresses in the friction discs of a multidisc wet clutch. Wear 1985, 101, 255–271. [Google Scholar] [CrossRef]
  8. Zagrodzki, P. Analysis of thermomechanical phenomena in multidisc clutches and brakes. Wear 1990, 140, 291–308. [Google Scholar] [CrossRef]
  9. Tirovic, M.; Day, A.J. Disc Brake Interface Pressure Distributions. Proc. Inst. Mech. Eng. Part D J. Automob. Eng. 1991, 205, 137–146. [Google Scholar] [CrossRef]
  10. Hwang, P.; Wu, X. Investigation of temperature and thermal stress in ventilated disc brake based on 3D thermo-mechanical coupling model. J. Mech. Sci. Technol. 2010, 24, 81–84. [Google Scholar] [CrossRef]
  11. Rouhi Moghanlou, M.; Saeidi Googarchin, H. Three-dimensional coupled thermo-mechanical analysis for fatigue failure of a heavy vehicle brake disk: Simulation of braking and cooling phases. Proc. Inst. Mech. Eng. Part D J. Automob. Eng. 2020, 234, 3145–3163. [Google Scholar] [CrossRef]
  12. Belhocine, A.; Abdullah, O.I. Design and Thermomechanical Finite Element Analysis of Frictional Contact Mechanism on Automotive Disc Brake Assembly. J Fail. Anal. Prevent. 2020, 20, 270–301. [Google Scholar] [CrossRef]
  13. Stojanovic, N.; Glisovic, J.; Abdullah, O.; Grujic, I.; Vasiljevic, S. Pressure influence on heating of ventilating disc brakes for passenger cars. Therm. Sci. 2020, 24, 203–214. [Google Scholar] [CrossRef]
  14. Afzal, A.; Abdul Mujeebu, M. Thermo-Mechanical and Structural Performances of Automobile Disc Brakes: A Review of Numerical and Experimental Studies. Arch. Comput. Methods Eng. 2019, 26, 1489–1513. [Google Scholar] [CrossRef]
  15. Zhao, S.; Hilmas, G.E.; Dharani, L.R. Behavior of a composite multidisk clutch subjected to mechanical and frictionally excited thermal load. Wear 2008, 264, 1059–1068. [Google Scholar] [CrossRef]
  16. Abdullah, O.I.; Majeed, M.H.; Hussain, I.Y. Effects of Frictional Facing Thickness on the Heat Generated in Dry Friction Clutches. IOP Conf. Ser. Mater. Sci. Eng. 2018, 433, 12044. [Google Scholar] [CrossRef] [Green Version]
  17. Abdullah, O.I.; Schlattmann, J. Thermal behavior of friction clutch disc based on uniform pressure and uniform wear assumptions. Friction 2016, 4, 228–237. [Google Scholar] [CrossRef] [Green Version]
  18. Abdullah, O.I.; Schlattmann, J.; Majeed, M.H.; Sabri, L.A. The temperatures distributions of a single-disc clutches using heat partitioning and total heat generated approaches. Case Stud. Therm. Eng. 2018, 11, 43–54. [Google Scholar] [CrossRef]
  19. Abdullah, O.I.; Schlattmann, J.; Majeed, M.H.; Sabri, L.A. The distribution of frictional heat generated between the contacting surfaces of the friction clutch system. Int. J. Interact. Des. Manuf. 2019, 13, 487–498. [Google Scholar] [CrossRef]
  20. Wang, Z.; Zhang, J. Thermomechanical Coupling Simulation and Analysis of Wet Multi-Disc Brakes During Emergency Braking. J. Phys. Conf. Ser. 2021, 1875, 12005. [Google Scholar] [CrossRef]
  21. Cooper, M.G.; Mikic, B.B.; Yovanovich, M.M. Thermal contact conductance. Int. J. Heat Mass Transf. 1969, 12, 279–300. [Google Scholar] [CrossRef]
  22. Mikić, B.B. Thermal contact conductance; theoretical considerations. Int. J. Heat Mass Transf. 1974, 17, 205–214. [Google Scholar] [CrossRef]
  23. Asif, M.; Tariq, A. Correlations of Thermal Contact Conductance for Nominally Flat Metallic Contact in Vacuum. Exp. Heat Transf. 2016, 29, 456–484. [Google Scholar] [CrossRef]
  24. Tariq, A.; Asif, M. Experimental investigation of thermal contact conductance for nominally flat metallic contact. Heat Mass Transf. 2016, 52, 291–307. [Google Scholar] [CrossRef]
  25. Dou, R.; Ge, T.; Liu, X.; Wen, Z. Effects of contact pressure, interface temperature, and surface roughness on thermal contact conductance between stainless steel surfaces under atmosphere condition. Int. J. Heat Mass Transf. 2016, 94, 156–163. [Google Scholar] [CrossRef]
  26. Madhusudana, C.V.; Madhusudana, C.V. Thermal Contact Conductance; Springer: Berlin/Heidelberg, Germany, 1996; ISBN 0387945342. [Google Scholar]
  27. Acuner, R. Synchronisierungen Mit Carbon-Reibwerkstoffen unter Hohen und Extremen Beanspruchungen. Ph.D. Thesis, Technische Universität München, München, Germany, 2016. [Google Scholar]
  28. Mileti, M.; Pflaum, H.; Stahl, K. TorqueLINE Cone Clutch: Thermo-Mechanical Stability of Cone Clutches for ATs. In Proceedings of the Dritev: International VDI Congress Dritev—Drivetrain for Vehicles, EDrive, Transmissions in Mobile Machines, Bonn, Germany, 27–28 June 2018; VDI Verlag GmbH: Düsseldorf, Germany, 2018; pp. 357–368, ISBN 9783180923284. [Google Scholar]
  29. Abdullah, O.I.; Schlattmann, J. Temperature analysis of a pin-on-disc tribology test using experimental and numerical approaches. Friction 2016, 4, 135–143. [Google Scholar] [CrossRef] [Green Version]
  30. Wohlleber, F.; Pflaum, H.; Höhn, B.-R. FVA-Nr. 150 VI—Heft 899—KUPSIM 2.2: Programmerweiterung zur Thermischen Nachrechnung von Lamellenkupplungen und Integration des Programms in die FVA-Workbench; Forschungsvereinigung Antriebstechnik e.V.: Frankfurt am Main, Germany, 2009. [Google Scholar]
  31. Spreckels, M. Einfluss der Temperaturverteilung auf das tribologische Verhalten von Synchronisierungen. Ph.D. Thesis, Leibniz Universität Hannover, Hannover, Germany, 2001. [Google Scholar]
  32. Sabri, L.A.; Stojanović, N.; Senatore, A.; Jweeg, M.J.; Abed, A.M.; Abdullah, O.I. Three-Dimensional Finite Element Analysis of Contact Problem in Dry Friction Clutches. Lubricants 2021, 9, 115. [Google Scholar] [CrossRef]
  33. Zagrodzki, P.; Truncone, S.A. Generation of hot spots in a wet multidisk clutch during short-term engagement. Wear 2003, 254, 474–491. [Google Scholar] [CrossRef]
  34. Schneider, T.; Bedrikow, A.B.; Völkel, K.; Pflaum, H.; Stahl, K. Comparison of Various Wet-Running Multi-Plate Clutches with Paper Friction Lining with Regard to Spontaneous Damage Behavior. Tribol. Ind. 2021, 43, 40–56. [Google Scholar] [CrossRef]
  35. Groetsch, D.; Stockinger, U.; Schneider, T.; Reiner, F.; Voelkel, K.; Pflaum, H.; Stahl, K. Experimental investigations of spontaneous damage to wet multi-plate clutches with carbon friction linings. Eng. Res. 2021, 117, 2480. [Google Scholar] [CrossRef]
  36. Ciavarella, M.; Papangelo, A.; Barber, J.R. Effect of Wear on the Evolution of Contact Pressure at a Bimaterial Sliding Interface. Tribol. Lett. 2020, 68, 27. [Google Scholar] [CrossRef]
  37. Humphrey, E.; Gkinis, T.; Morris, N.J.; Leighton, M.; Rahmani, R.; Rahnejat, H. Clutch lining frictional characteristics under thermal tribodynamic conditions. In Proceedings of the 3rd Biennial International Conference on Powertrain Modelling and Control, Loughborough, UK, 7–9 September 2016. [Google Scholar]
  38. Gkinis, T.; Rahmani, R.; Rahnejat, H.; O’Mahony, M. Heat generation and transfer in automotive dry clutch engagement. J. Zhejiang Univ. Sci. A 2018, 19, 175–188. [Google Scholar] [CrossRef]
  39. Qiao, Y.; Ciavarella, M.; Yi, Y.-B.; Wang, T. Effect of wear on frictionally excited thermoelastic instability: A finite element approach. J. Therm. Stress. 2020, 43, 1564–1576. [Google Scholar] [CrossRef]
  40. Papangelo, A.; Ciavarella, M. Can Wear Completely Suppress Thermoelastic Instabilities? J. Tribol 2020, 142, 051501. [Google Scholar] [CrossRef]
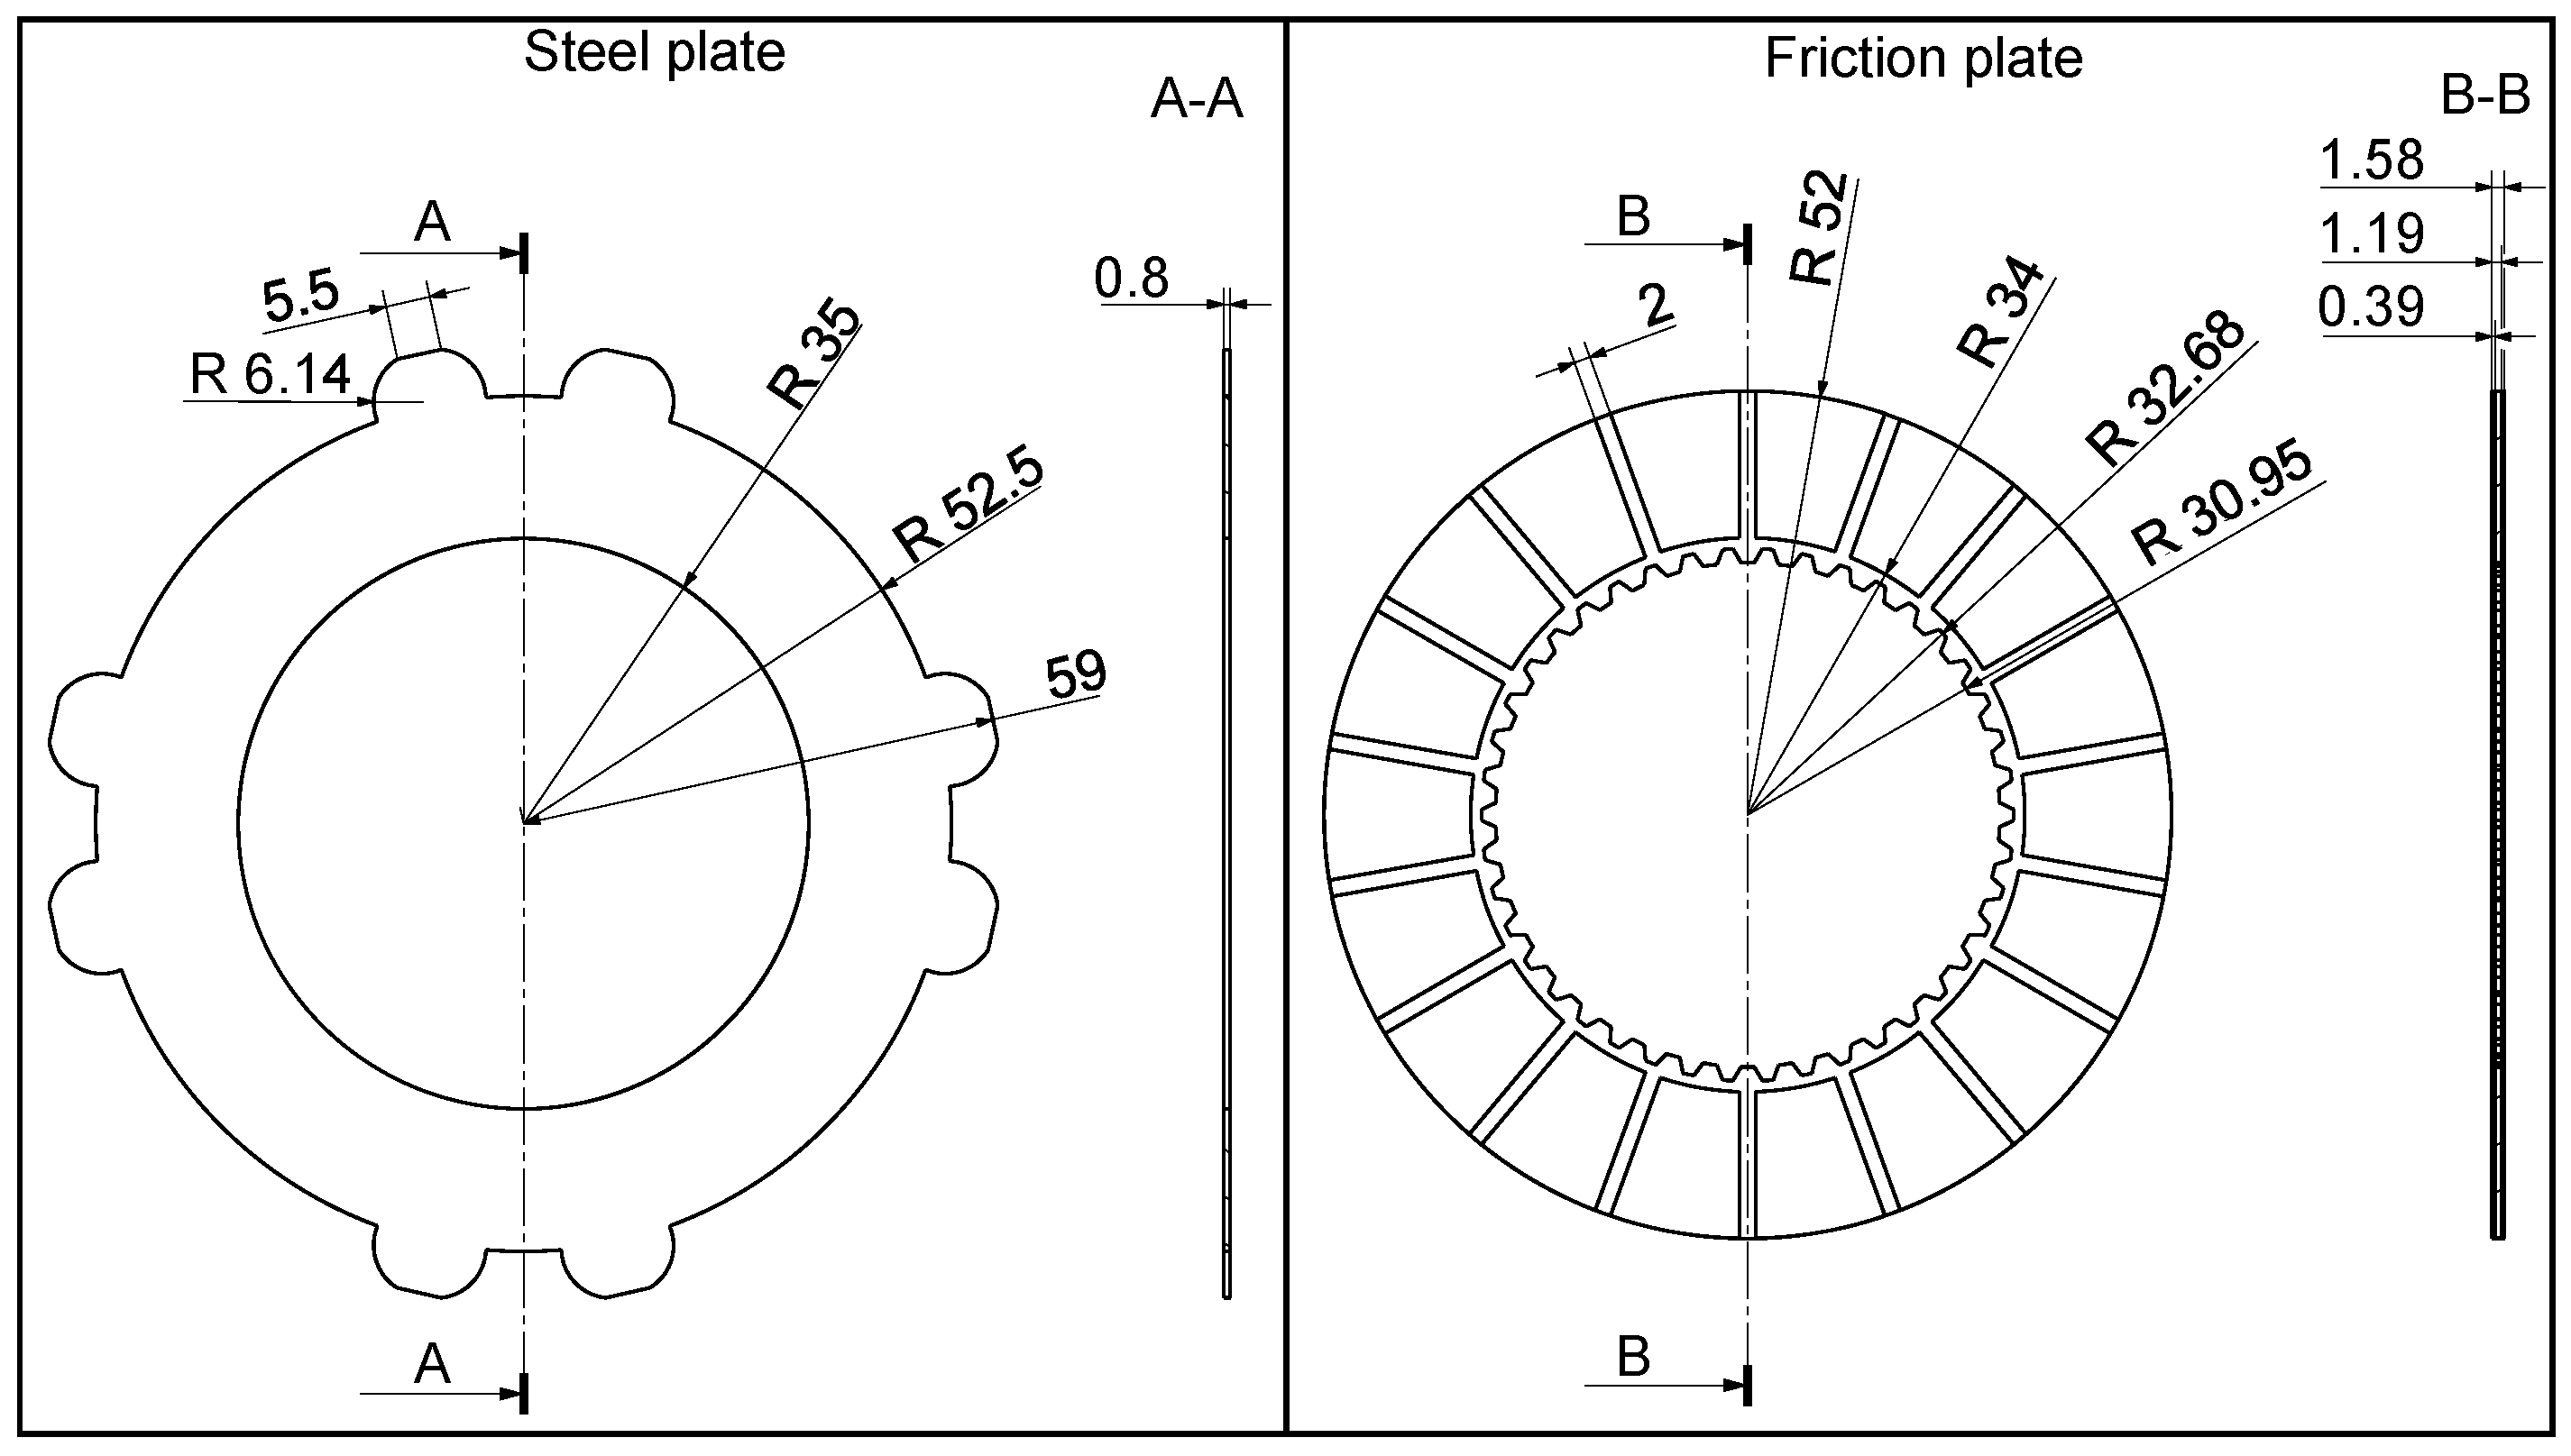
Figure 1. Technical drawing of the parts.The geometry is reduced to two dimensions by exploiting rotational symmetry to reduce the complexity of the FEM simulation model. As a result, the grooves of the lining and the shape and number of teeth of the steel and lining plate are not considered. Adjustment of the diameters of steel or carrier plates ensures that the thermal mass of the simplified parts is equal to the thermal mass of the physical parts. The model structure, geometric dimensions, and mechanical boundary conditions are shown in Figure 2.
Lubricants 10 00076 g001
Figure 2. Model structure, geometrical dimensions, and mechanical boundary conditions of the clutch.
Lubricants 10 00076 g002
Figure 3. Axial force (blue) and differential speed (green) curve.
Lubricants 10 00076 g003
Figure 4. (A) Results of compression tests for friction lining; (B) Young’s modulus as a function of stress for friction lining.
Lubricants 10 00076 g004
Figure 5. Flow chart for the simulation process.
Lubricants 10 00076 g005
Figure 6. FEM model for simulation of the temperature and pressure distribution and as a reference model of the mesh and time-step sensitivity analysis.
Lubricants 10 00076 g006
Figure 7. Calculated increase in temperature for different numbers of nodes (A) and time-step sizes (B) to evaluate the convergence behavior of the numerical solution.
Lubricants 10 00076 g007
Figure 8. Measurement recording of a slip cycle and comparison of the simulated temperature with the measured temperature.
Lubricants 10 00076 g008
Figure 9. Comparison between simulated and measured temperature increase for different loads represented by individual circles.
Lubricants 10 00076 g009
Figure 10. Temperature distribution in the clutch at selected times in the slip cycle.
Lubricants 10 00076 g010
Figure 11. Temperature and pressure distribution of friction interfaces 1–5 as a function of time.
Lubricants 10 00076 g011
Figure 12. Temperature and pressure distribution for the friction interface 5 for the parameter variation.
Lubricants 10 00076 g012
Table 1. Values for the use of the material model.
ParameterUnitValue
Thermal conductivity k 0 of contact material at temperature T 0 W / mK 52
Surface roughness R a μm0.44
Effective arithmetic average slope a 0.107
Vickers hardness H 0 (HV1) 522
Factor c 1 for different interface roughness according to Dou et al. [25] 3.28 × 10⁻⁵
Factor c 2 for different interface roughness according to Dou et al. [25] 0.888
Factor c 3 for different interface roughness according to Dou et al. [25] 0.291
Table 2. Material parameters according to Wohlleber [30].
ParameterUnitSteelFriction Lining
Young’s modulus N / m 2 2.1 × 10¹¹Regression function
Poisson’s ratio 0.30.2
Coefficient of thermal expansion 1 / K 13.3 × 10−670 × 10−6
Density kg / m 3 7850900
Specific heat capacity J / kg · K 5202890
Thermal conductivity W / m · K 520.25
Table 3. Load parameters for mesh and time-step analysis.
ParameterUnitValue
Pressure p N / m m 2 5.0
Max. differential speed n D i f f , m a x m i n 1 110
Table 4. Load parameters for the comparison of the simulated temperature with the measured temperature.
ParameterUnitValue
Pressure p N/mm24.0
Max. differential speed n D i f f , m a x m i n 1 80
Approximated coefficient of friction using nodes 0.0977, 0.1, 0.1026, 0.1038, 0.1033, 0.0982, 0.0933, 0.0847, 0.0596, 0.0603, 0.0874, 0.0942, 0.0964, 0.0963, 0.090, 0.0597, 0.0795, 0.0878, 0.0909, 0.0917, 0.0848, 0.0794, 0.0714, 0.06066, 0.0846, 0.0768, 0.0564
Average coefficient of friction 0.0849
Table 5. Load parameters for parameter study.
Pressure in N/mm2Max. Differential Speed in min−1Young’s Modulus of Friction Lining in MPaThermal Conductivity of Friction Lining in W/mKSteel Plate Thickness in mm
Reference model 4.0 80 E ( σ ) = σ 1 0.5312 1 0.04345 · 0.5312 0.250.8
Variation Young’s modulus 4.0 80 E ( σ ) = 10 · σ 1 0.5312 1 0.04345 · 0.5312 0.250.8
Variation thermal conductivity of friction lining 4.0 80 E ( σ ) = σ 1 0.5312 1 0.04345 · 0.5312 3 · 0.25 0.8
Variation steel plate thickness 4.0 80 E ( σ ) = σ 1 0.5312 1 0.04345 · 0.5312 0.25 2 · 0.8
Publisher’s Note: MDPI stays neutral with regard to jurisdictional claims in published maps and institutional affiliations.