Article

Hard Turning Performance Investigation of AISI D2 Steel under a Dual Nozzle MQL Environment

Machining Research Laboratory (MRL), School of Mechanical Engineering, Kalinga Institute of Industrial Technology (KIIT), Deemed to be University, Bhubaneswar 751024, Odisha, India
*
Author to whom correspondence should be addressed.
Lubricants 2023, 11(1), 16; https://doi.org/10.3390/lubricants11010016
Submission received: 6 December 2022 / Revised: 25 December 2022 / Accepted: 30 December 2022 / Published: 4 January 2023

Abstract

:
In recent years, hard turning has emerged as a burgeoning cutting technology for producing high-quality finishing of cylindrical-shaped hardened steel for a variety of industrial applications. Hard turning under dry cutting was not accepted because of the generation of higher cutting temperatures which accelerated tool wear and produced an inferior surface finish. Nowadays, minimum quantity lubrication (MQL) is widely accepted in hard turning to reduce the problems encountered in dry cutting. This research aimed to augment the MQL performance in the hard turning process of AISI D2 steel by applying a novel concept, namely, a dual jet nozzle MQL system that supplies the cutting fluid into the cutting zone from two different directions. The performances of hard turning are discussed using machinability indicator parameters, such as surface roughness, tool wear, cutting temperature, power consumption, noise emission, and chip morphology. The dual nozzle MQL greatly reduced the friction between contact surfaces in the cutting zone and provided improved surface quality (Ra = 0.448 to 1.265 µm). Furthermore, tool flank wear was found to be lower, in the range of 0.041 to 0.112 mm, with abrasion and adhesion being observed to be the main mode of wear mechanisms. The power consumption was greatly influenced by the depth of cut (46.69%), followed by cutting speed (40.76%) and feed (9.70%). The chip shapes were found to be helical, ribbon, and spiral c type, while the colors were a metallic, light blue, deep blue, and light golden.

Graphical Abstract

1. Introduction

In recent years, hard turning has become an important machining technology for hard-to-cut metal materials. This technology has great potential to replace the traditional grinding process to achieve enhanced productivity, while maintaining superior surface quality. This process is much easier, more environmentally friendly, economical, and more flexible than the existing grinding process [1]. Hard turning is referred to as a plain turning process applied to hardened steel of hardness superior to 45 HRC [1,2]. Previously, hard turning was mostly accomplished in a dry environment, using cubic boron nitride and ceramic cutting inserts, which led to increased cutting costs of machining because of the higher cost of the cutting tools. Nowadays, the economic issue associated with hard turning us solved by implementing low budget, multi-coated, carbide tools with different cutting fluid applications.
Hard turning was greatly influenced by cutting tool materials and their geometrical parameters. In recent technological advancements, many coated carbide tools have been developed to machine hard-to-cut hardened steels. These tools were developed by applying suitable coatings on carbide substrates using CVD or PVD coating technology. In the open literature, the most commonly used coating layers on carbide substrates for hard turning applications are the following: TiAlN [3], AlTiN [4], Al2O3-TiC [5,6], TiN-AlCrN [5], TiAlN-TiN [7,8], Al2O3-TiCN [7,9], TiSiN-TiAlN [10,11], TiCN-Al2O3-TiN [12,13], TiC-TiCN-Al2O3 [14], TiN-TiCN-Al2O3 [15,16], TiN-Al2O3-TiCN [17,18], TiN-TiCN-Al2O3-ZrCN [19], TiN-TiCN-Al2O3-TiN [20], etc. These coatings have different physical and mechanical properties, which greatly affect the hard-turning behavior.
Cutting fluids used in hard turning have negative effects on both the environment and human well-being. In the domain of metal cutting, there has also been an upsurge in the extremely high cutting heat and force generation involved in machining hardened steels. Consequently, research into, and the development of, new, environmentally friendly cooling and lubrication techniques are needed [21]. In this context, nowadays, the minimum quantity lubrication (MQL) technique is popularly utilized in hard turning to deliver air–oil mist lubricant into the cutting region. MQL has been classified as an ecologically approved cooling technique for many different machining processes. The advent of MQL has enabled it to use less coolants, while increasing lubrication performance at high machining speeds [22,23]. The important features of MQL include a reduction in cutting fluid consumption, cost effectiveness, environmental friendliness, and improved overall cutting performance and machined surface quality [24]. Many experimental studies [25,26,27,28] have reported that MQL has great capability to lessen the friction at machining interfaces, prevent temperature growth and adhesion, lengthen tool life, and improve surface quality in several traditional machining operations, such as milling, turning, grinding, and drilling.
The success of MQL technology in cooling applications depends on the characteristics of the cutting fluid used and the operating parameters of the MQL. The usage of eco-friendly cutting fluids, namely, vegetable oils, synthetic esters, and fatty alcohols, in MQL bridged the injurious environmental effect of cutting fluids. Moreover, along with the environment-friendly characteristics of the cutting fluid, higher heat conductive properties are also essential for the rapid transfer of generated heat from the machining area to the environment. The poor heat transfer capability of cutting fluid causes more heat penetration in the workpiece and the cutting tool, and, thus, results in work-surface damage and tool failure. According to Bosewell et al. [29], MQL fluids must have high lubricity, stability, and biodegradability to achieve the conditions of sustainability in machining activity. Many MQL fluids have been implemented so far to investigate their machinability augmentation in the hard turning process. Arsene [30] implemented corn oil as a cutting fluid via MQL in the hard turning of D2 steel. The results revealed that the corn oil developed a strong anti-friction and anti-wear thin film, and, thus, improved the surface quality (about 10–15%) and prolonged tool life. Chavan and Sargade [31] implemented different kinds of vegetable oils, such as coconut oil, soyabean oil, and palm oil, in MQL turning of AISI 52100 hardened steel with a TiSiN-TiAlN-coated carbide cutting tool. Palm oil-assisted machining provided a superior performance to that of other vegetable oils to achieve the least cutting force and machined surface roughness. Das et al. [32] performed experiments to analyze the effect of cutting fluids (compressed air, water-soluble coolant, nano-cutting fluid) on tool flank wear, radial and feed forces, and chip thickness. Nanofluid-MQL was observed to be the most effective in terms of wear, forces, and chip thickness. Mawandiya et al. [33] made a comparison of machining performances under Caster oil MQL and Molybdenum disulfide mixed sunflower oil MQSL in machining 4340 steel. Surface roughness and energy consumption were found to be the least with MQSL when compared to MQL and dry machining. Sani et al. [34] utilized Jatropha-based vegetable oil with ammonium and phosphonium-based ionic fluid through MQL in turning 1045 steel. Ammonium-based ionic fluid exhibited improved results in comparison to phosphonium-based ionic fluid.
Moreover, MQL operating parameters, like air pressure, pulse duration, and flow rate, affects the machinability index of different metallic alloys. The number of MQL nozzles, their positioning, and their directions play a prominent role in augmenting the machinability process to meet sustainable requirements [35,36]. Several researchers studied the efficacy of MQL technology used in chip removal activities. Mia and Dhar [37,38] explored the impact of nozzle positions in tuning Ti-grade 5 alloys and concluded that dual nozzles are more promising for cooling and lubricating the cutting zone, in comparison to a solitary nozzle. According to Sohrabpoor et al. [39], the spraying of MQL fluid was more efficient when the position of the nozzles was oriented towards the rake surface, and the flank surface, of the tool, when turning 4340 steel. Many researchers reported that MQL is a superior cooling technology to dry cutting to lessen cutting tool wear, cutting forces, and surface roughness, while enhancing tool life [40,41,42,43,44]. Ozbek and Saruhan [45] concluded that MQL-enabled machining exhibited a great reduction in tool wear (23%), cutting temperature (25%), and cutting tool vibration amplitude (45%), as compared to dry cutting. Özbek et al. [46] explored the machinability comparison of Vanadis 10 steel in dry and MQL conditions. MQL demonstrated notable improvements in measured outputs (cutting temperature, tooling wear, surface roughness, service life of the tool, and cutting tool vibration amplitude) compared to dry machining. The cutting speed was the most effectual in regard to vibration amplitude (46.22%) and tool wear (32.41%). Gürbüz and Gönülaçar [47] compared the machinability behavior of AISI 4140 steel in MQL, dry and wet machining conditions. It was concluded that the MQL environment considerably minimized tool wear when contrasted with wet and dry machining.
According to the literature review, the MQL technique has high potential for efficaciously supplying mist lubricant into the cutting region in various metal machining processes. Most MQL-based research used a single nozzle to deliver cutting fluid into the cutting zone. Very few works reported on the use of dual nozzle MQL applications in metal machining. In the context of hard turning, the use of dual nozzle MQL could be a novel approach to investigate machinability behavior. Moreover, the characteristics of cutting fluid largely influence the cooling and lubrication performance of MQL. In this research, eco-friendly and commercially available spring oil was used via dual jet nozzle MQL to study the cutting characteristics of AISI D2 steel using a CVD-coated (TiCN/Al2O3) carbide tool. Furthermore, for sustainability concerns, noise emission and power consumption in hard turning are critical parameters, but very few researchers have investigated these parameters in hard turning. Therefore, this study addressed several machinability-indicating factors, like flank wear, surface roughness, surface texture, cutting temperature, noise emission, power consumption, and chip morphology to analyze the machinability behavior of AISI D2 steel under a dual nozzle MQL system.

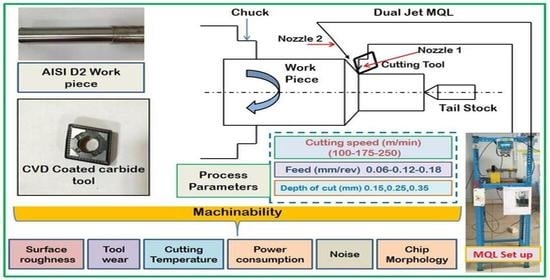
2. Materials and Methods

In this research, a cylindrically shaped AISI D2 steel (57 ± 1HRC), of diameter 45 mm and length 200 mm was considered as the work specimen on which to perform the hard turning operation and investigate machinability qualities under a dual nozzle MQL cooling environment. The elemental composition of AISI D2 steel is Cr (12.2%), C (1.6%), Mn (0.4%), Si (0.2%), Ni (0.09%), P (0.03%), Co (0.71%), S (0.02%), V (0.96%) and Fe (rest). This material has a wide range of applications in the mold–die making, automotive, and press tool industries, etc., but its machining is said to be difficult, due to its high chromium and high carbon contents [48,49,50]. Furthermore, the higher hardness of heat-treated D2 steel makes cutting more difficult, necessitates more cutting force, and results in increased tool wear during machining. A Kennametal manufactured CVD-coated (TiCN/Al2O3) carbide insert, of designation CNMG-120408FN with grade KCK05, was used for machining, having a cutting geometry-like approach angle of 95°, included angle of 80°, rake angle (back) of −6°, clearance angle of 5°, an inclination angle of −6° and nose radius of 0.8 mm. A tool holder, having ISO designation PCLNR2525M12, was used to hold the insert rigidly. For the hard turning operation, a CNC-enabled automated lathe machine, model DX 200 4A (Jyoti CNC Automation Ltd.), was used, having an adjustable speed range of 50–4000 rev/min and a power capacity of 7.5 kW.
The experiments were executed using the Taguchi L27 design (27 experiments) with 3 input factors (depth of cut (a) mm, tool feed rate (f) mm/rev, and cutting speed (V) m/min) and their 3 variables, as presented in Table 1. Moreover, a newer cooling concept, namely, a dual nozzle MQL system, was utilized to spray the cutting lubricant into the cutting region. The cutting lubricant used was LRM 30, which is spring oil. This is an advanced non-toxic lubricating oil with a viscosity of 32 cSt at 30°and flammability point exceeding 200 °C. It does not produce any environmental hazards during operation. The cooling set-up and spring oil were supplied by DropsA, Italy. Furthermore, trial experiments were carried out to select the most effective MQL operating parameters, such as those of flow rate, air pressure, and nozzle position. Based on the results, the MQL flow rate was kept fixed at 50 mL/hr for both nozzles and air pressure was taken as 6 bars. The first nozzle was placed towards the flank face of the tool with a 30° ± 5° angle from the tool axis, while the second nozzle was oriented towards the cutting zone vertically (with a deviation of ±5°) from the top side, as shown in Figure 1. The diameter of the nozzle outputs for both nozzles was 1 mm. The distance of both nozzles from the cutting zones was kept at 25 ± 5 mm. Many researchers fixed the nozzle distance in the range of 20–30 mm [45,51,52].
The turning length was fixed at 160 mm for each experiment. For each experiment, a new tip tool was used. The machinability indicator factors, like surface roughness-Ra (µm), flank wear-VBc (mm), cutting temperature-T (°C), cutting power-Pc (kW), noise emission-Ne (dB), and chip morphology, were measured and the effects of the cutting parameters on these factors discussed. The surface roughness was measured at three distinct portions of the finished surface using the SURFTEST (SV-2100) instrument. The same instrument was used for surface texture measurement. The mean of three roughness readings was taken. The acceptable surface roughness criteria were set as 1.6 µm. The wear land measurement on the too-flank face and surface topology of the machined surface was accomplished using an optical microscope (Olympus STM 6 model). Moreover, SEM and EDS were also carried out to analyze the mechanics of tool wear. The cutting temperature was measured in the course of machining. An FLIR T540 thermal camera was used to measure the temperature. The distance from the cutting zone to the focus lens of the camera was taken as 30 cm. The emissivity was set to 0.81 before measurement [52]. The maximum temperature was considered to be near the tool-tip (flank face) for this study. The power consumption in machining was directly measured using a 3-Phase multi-function power cum energy meter (RISH Delta Energy, EMT 34). Noise emission in machining was recorded using a fluke make sound level meter (Model- Fluke 945). This instrument was kept at a distance of 30 cm from the axis of the workpiece during cutting for noise measurement. The average of five readings of sound value was taken for the assessment of noise emission. The main effects plot, surface plots, interaction plots, and ANOVA were developed using Minitab 17 software. The details of the experimental setup and instrumental setups are schematically given in Figure 1a, while the positioning of the MQL nozzles during machining is shown in Figure 1b.

3. Results and Discussions

The measured results of Ra, VBc, T, Pc, and Ne for the Taguchi L27 experiments are provided in Table 2.

3.1. Assessment of Finished Surface Quality

The surface quality of the finished part was investigated using surface roughness (Ra), surface topology, and surface texture. The Ra is said to be vital in machining and strongly related to cutting tool wear [53]. The Ra denotes the quality standard of the finished part and affects the working life of the product. The Ra was extensively stimulated by the machining parameters, tool geometry, and machining environments. Surface topology images can also be used to visualize surface quality. The larger the groove size, the poorer the surface quality. Similarly, the surface texture showed irregularities present in the finished surface. In the current study, the surface quality was discussed by varying the machining parameters (using Taguchi L27 design) under dual nozzle MQL cooling conditions.
The measured Ra value for each run is displayed in Table 1. The obtained Ra values followed the normal distribution, as p-value (0.183) exceeded the limit of significance level (0.05), as displayed in Figure 2a. The smallest and largest Ra values were found to be 0.448 µm and 1.265 µm, correspondingly, with an average value of 0.748 µm and standard deviation of 0.213, as shown in Figure 1a. According to the results, the obtained Ra values were significantly lower than the recommended control limit of Ra value (1.6 µm) [54].
The effect of cutting factors on Ra were investigated using main effects plots (Figure 2b), surface plots (Figure 2c–e), interaction plots (Figure 2f), and ANOVA (Table 2). The main effects plot indicated that the Ra improved with increasing feed and depth of cut, while it deteriorated with growing cutting speed. With rising feed and depth of cut, cutting forces and tool vibration increased accordingly and surface roughness improved. According to Rajan et al. [55], when turning was performed at higher feed and deeper depth of cut cutting conditions, the dynamic instability in cutting improved, resulting in non-uniform interaction between tool and workpiece and higher surface roughness. Moreover, the surface roughness deteriorated with growing cutting speed, due to the formation of shorter chip-tool contact lengths at higher cutting speed conditions. At an elevated cutting speed, thinner chips were generated that brought down the chip reduction coefficient, and, as a result, cutting strain was lessened and, consequently, surface roughness diminished and surface quality improved. From the surface plot (Figure 2c), the slope of the surface exhibited simultaneous improvement in feed and depth of cut, which ensured an increment in Ra with growing levels of feed and depth of cut. Kulshreshtha [56] also reported a similar consequence of feed and depth of cutting in turning EN 36 steel. Similarly, the machined surface slope descended diagonally with leading speed and feed which ensured that the best surface quality was achieved at the highest cutting speed (250 m/min) and the lowest feed (0.06 mm/min) rate combination. The surface slope was more with leading feed, in comparison to a speed which ensured the dominancy of feed on Ra rather than speed. Moreover, the slope of the surface also reduced diagonally when cutting speed and depth of cut were leading simultaneously. The lowest Ra was seen with the machining conditions of uppermost speed (250 m/min) and lowest depth of cutting (0.15 mm). From the interaction plots, the consequence of the interactions of all pairs of terms (a*V, a*f, and f*V) had significant stimulus effects on Ra. This was also validated by the ANOVA analysis (Table 3), where the p value for each interaction term lowered to a significance level of 0.05. ANOVA reported that all the cutting variables had a relevant impact on Ra as their corresponding p value was lowered to 0.05. Based on the cutting variables, feed had the greatest impact (66.70%) succeeded by depth of cut (14.30%) and cutting speed (14.18%). This result agreed with the theoretical concept that the square of feed is proportional to Ra.
The surface topology images for Run 3 (lowest feed, lowest depth of cut, and highest cutting speed) and Run 25 (largest feed, largest depth of cut, and lowest cutting speed) are displayed in Figure 3a and Figure 3b, respectively. Finer feed marks were observed in Run 3 versus Run 25, due to lower feed with high-speed combination machining, resulting in an improved surface finish. At higher feed with the lowest speed machining condition, the spacing between two consecutive feed marks was found to be greater, resulting in a relatively rough surface. The quality of the surface was addressed using surface texture measurement results, displayed in Figure 4. The assessment of surface texture was scientifically important for real application of the part produced. The surface texture measurement results of the finished part showed the profile of peak and valley distribution, amplitude distribution curve, and bearing area curve. The texture study was accomplished for the least and largest surface roughness samples, as revealed in Figure 4a and Figure 4b, respectively. The distribution of peak and valley for both samples was non-uniform because of the presence of fine particles adhered to the machined surface. The gap between the two consecutive peaks, as well as the valley, was lowered when machining at the lowest feed (0.06 mm/rev) and highest speed (250 m/min), thus providing better surface quality in comparison to machining at the highest feed (0.18 mm/rev) with lowest cutting speed (100 m/min). As thicker material (0.35 mm) required removal with the lowest cutting speed (100 m/min), more cutting force was generated and, as a result, higher surface roughness (1.265 µm) was recorded in Run 25, in comparison to Run 3 (0.448 µm). The ADC provides the overall morphology of the finished sample. According to Smith [57], symmetric curve distribution confirms uniform variation of texture on the finished part, whereas non-symmetric distribution shows skewed amplitude dissemination onto the machined surface. Skewness gives rise to the differences in peaks and valleys present in the finished part. Referring to ADC graphs (Figure 4a,b), the curves were unsymmetrical in both conditions, Run 3 and Run 25, indicating that the surface profile was not uniform for both experimental conditions. Similarly, the BAC plot indicates (Figure 4a,b) the quality of finishing obtained on the machined part. According to Zhu and Huang’s study [58], if the shape of BAC is ‘S’ and the slope is lower this indicates higher surface quality. Cîrstoiu [59] also stated that the closer the shape is to an ‘S’ and the lower slope of BAC the better the surface quality. Referring to these opinions, it can be said the BAC for Run 3 had a lower slope with a shape close to an ‘S’ shape, therefore the surface quality for this condition was better and, hence, it had the experimentally lowest surface roughness (0.448 µm).in comparison to Run 25, where the slope was higher, relatively, and the shape did not follow an ‘S’ shape.

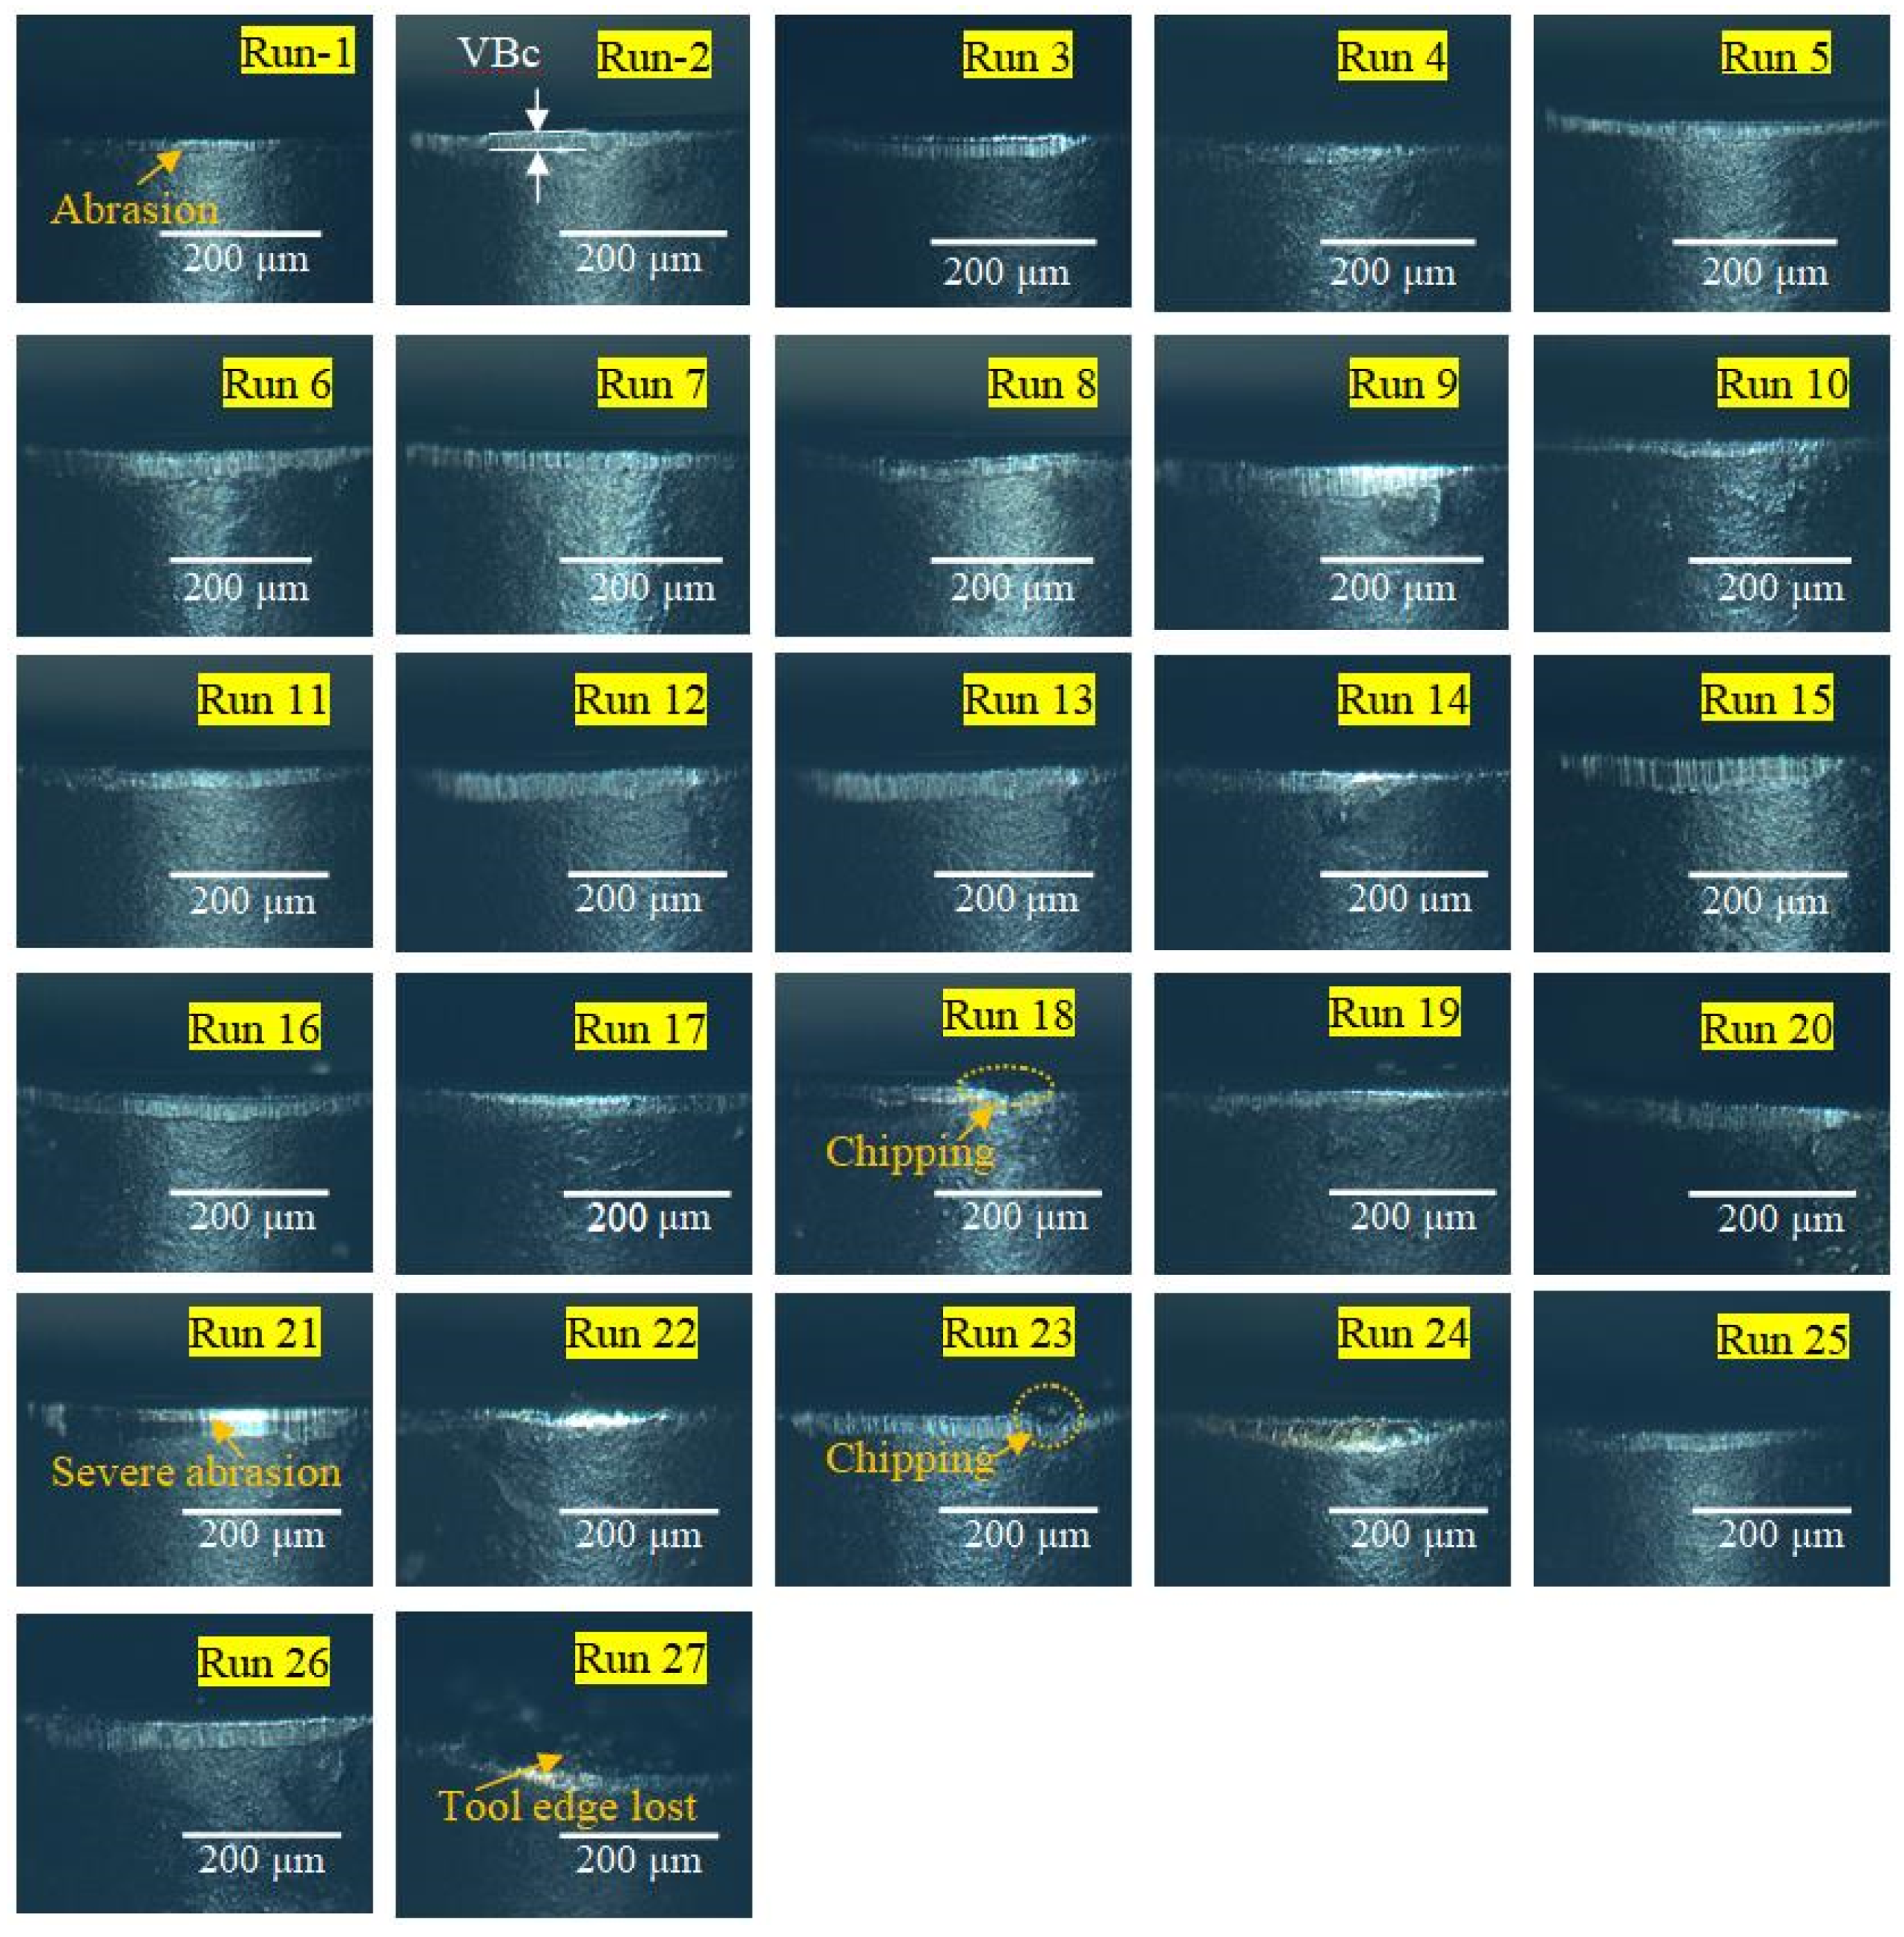
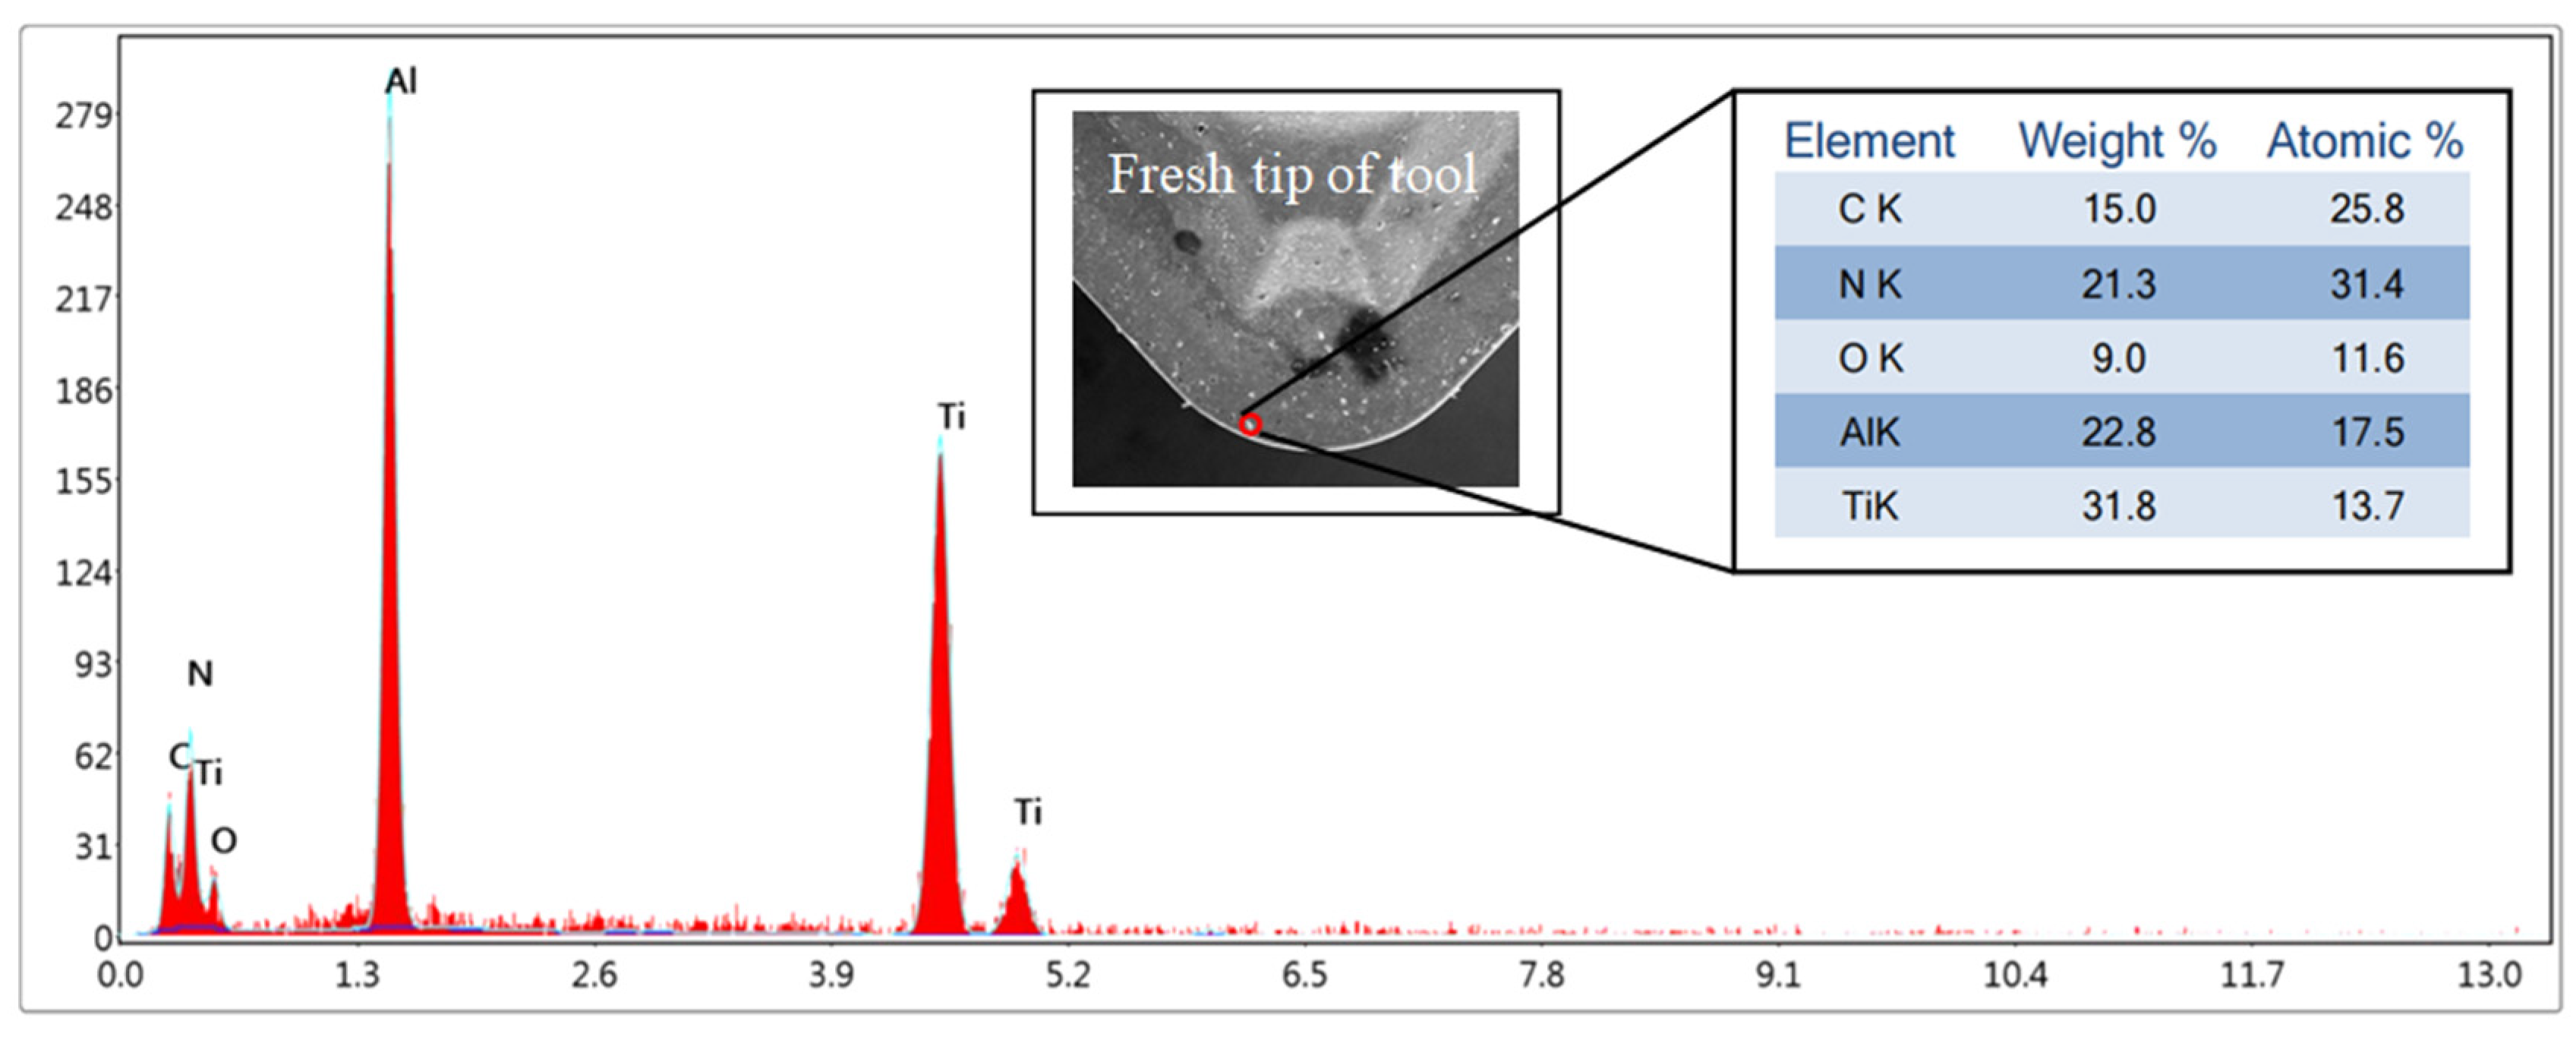
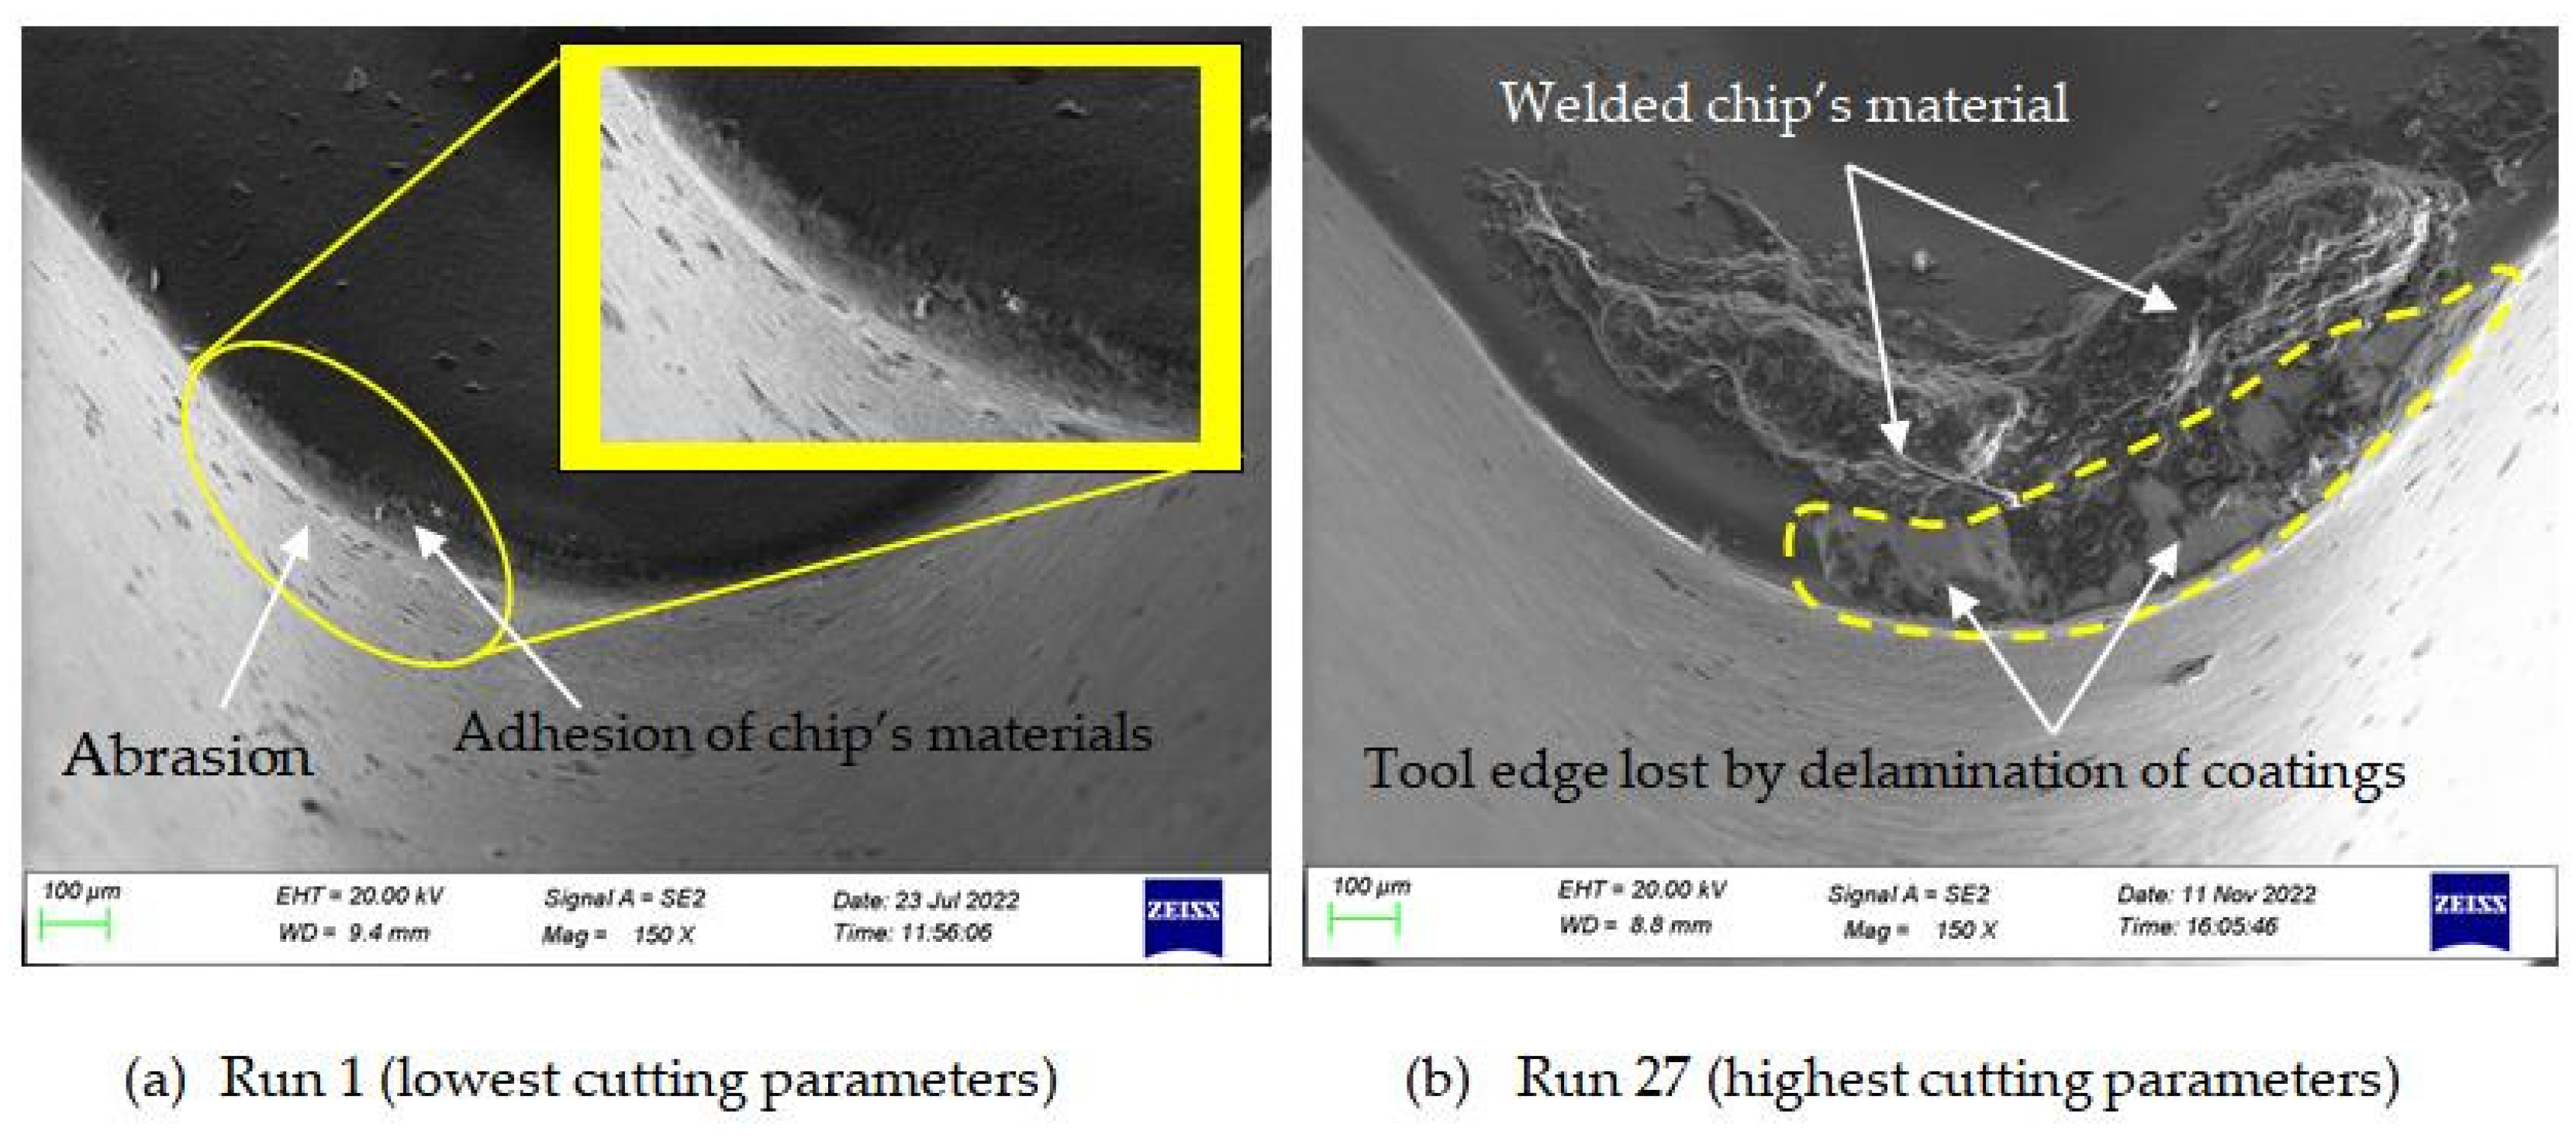
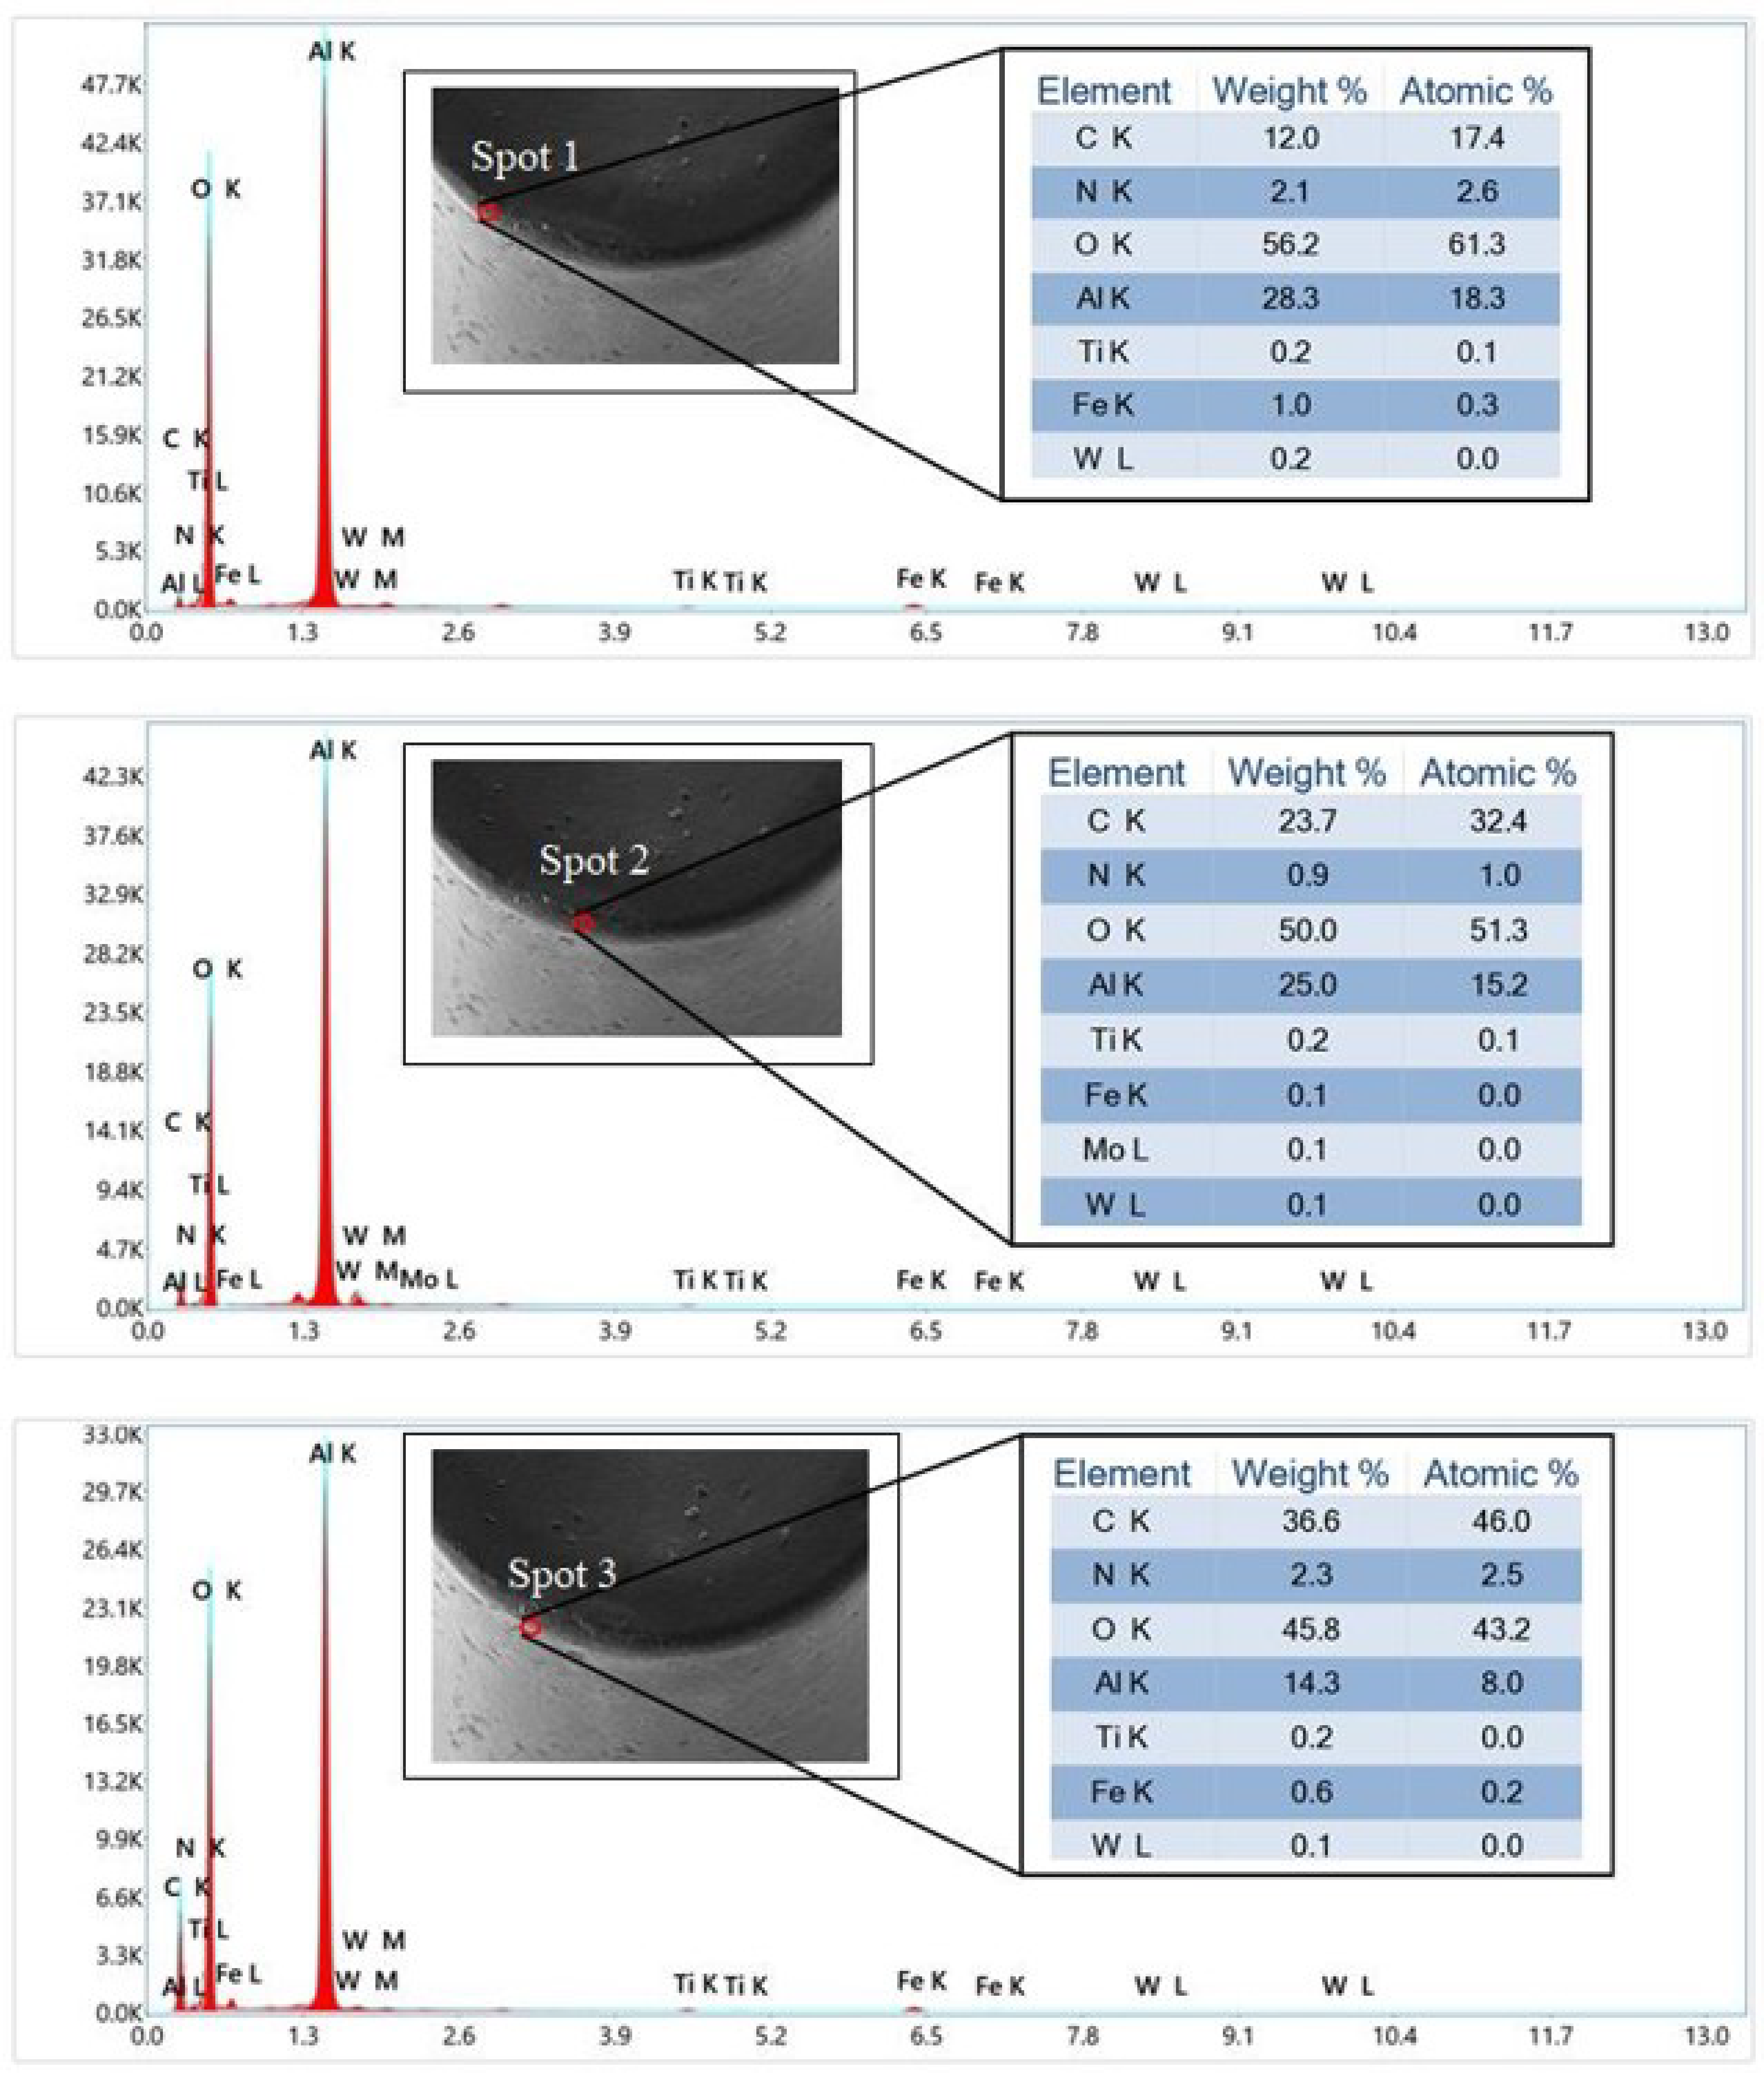
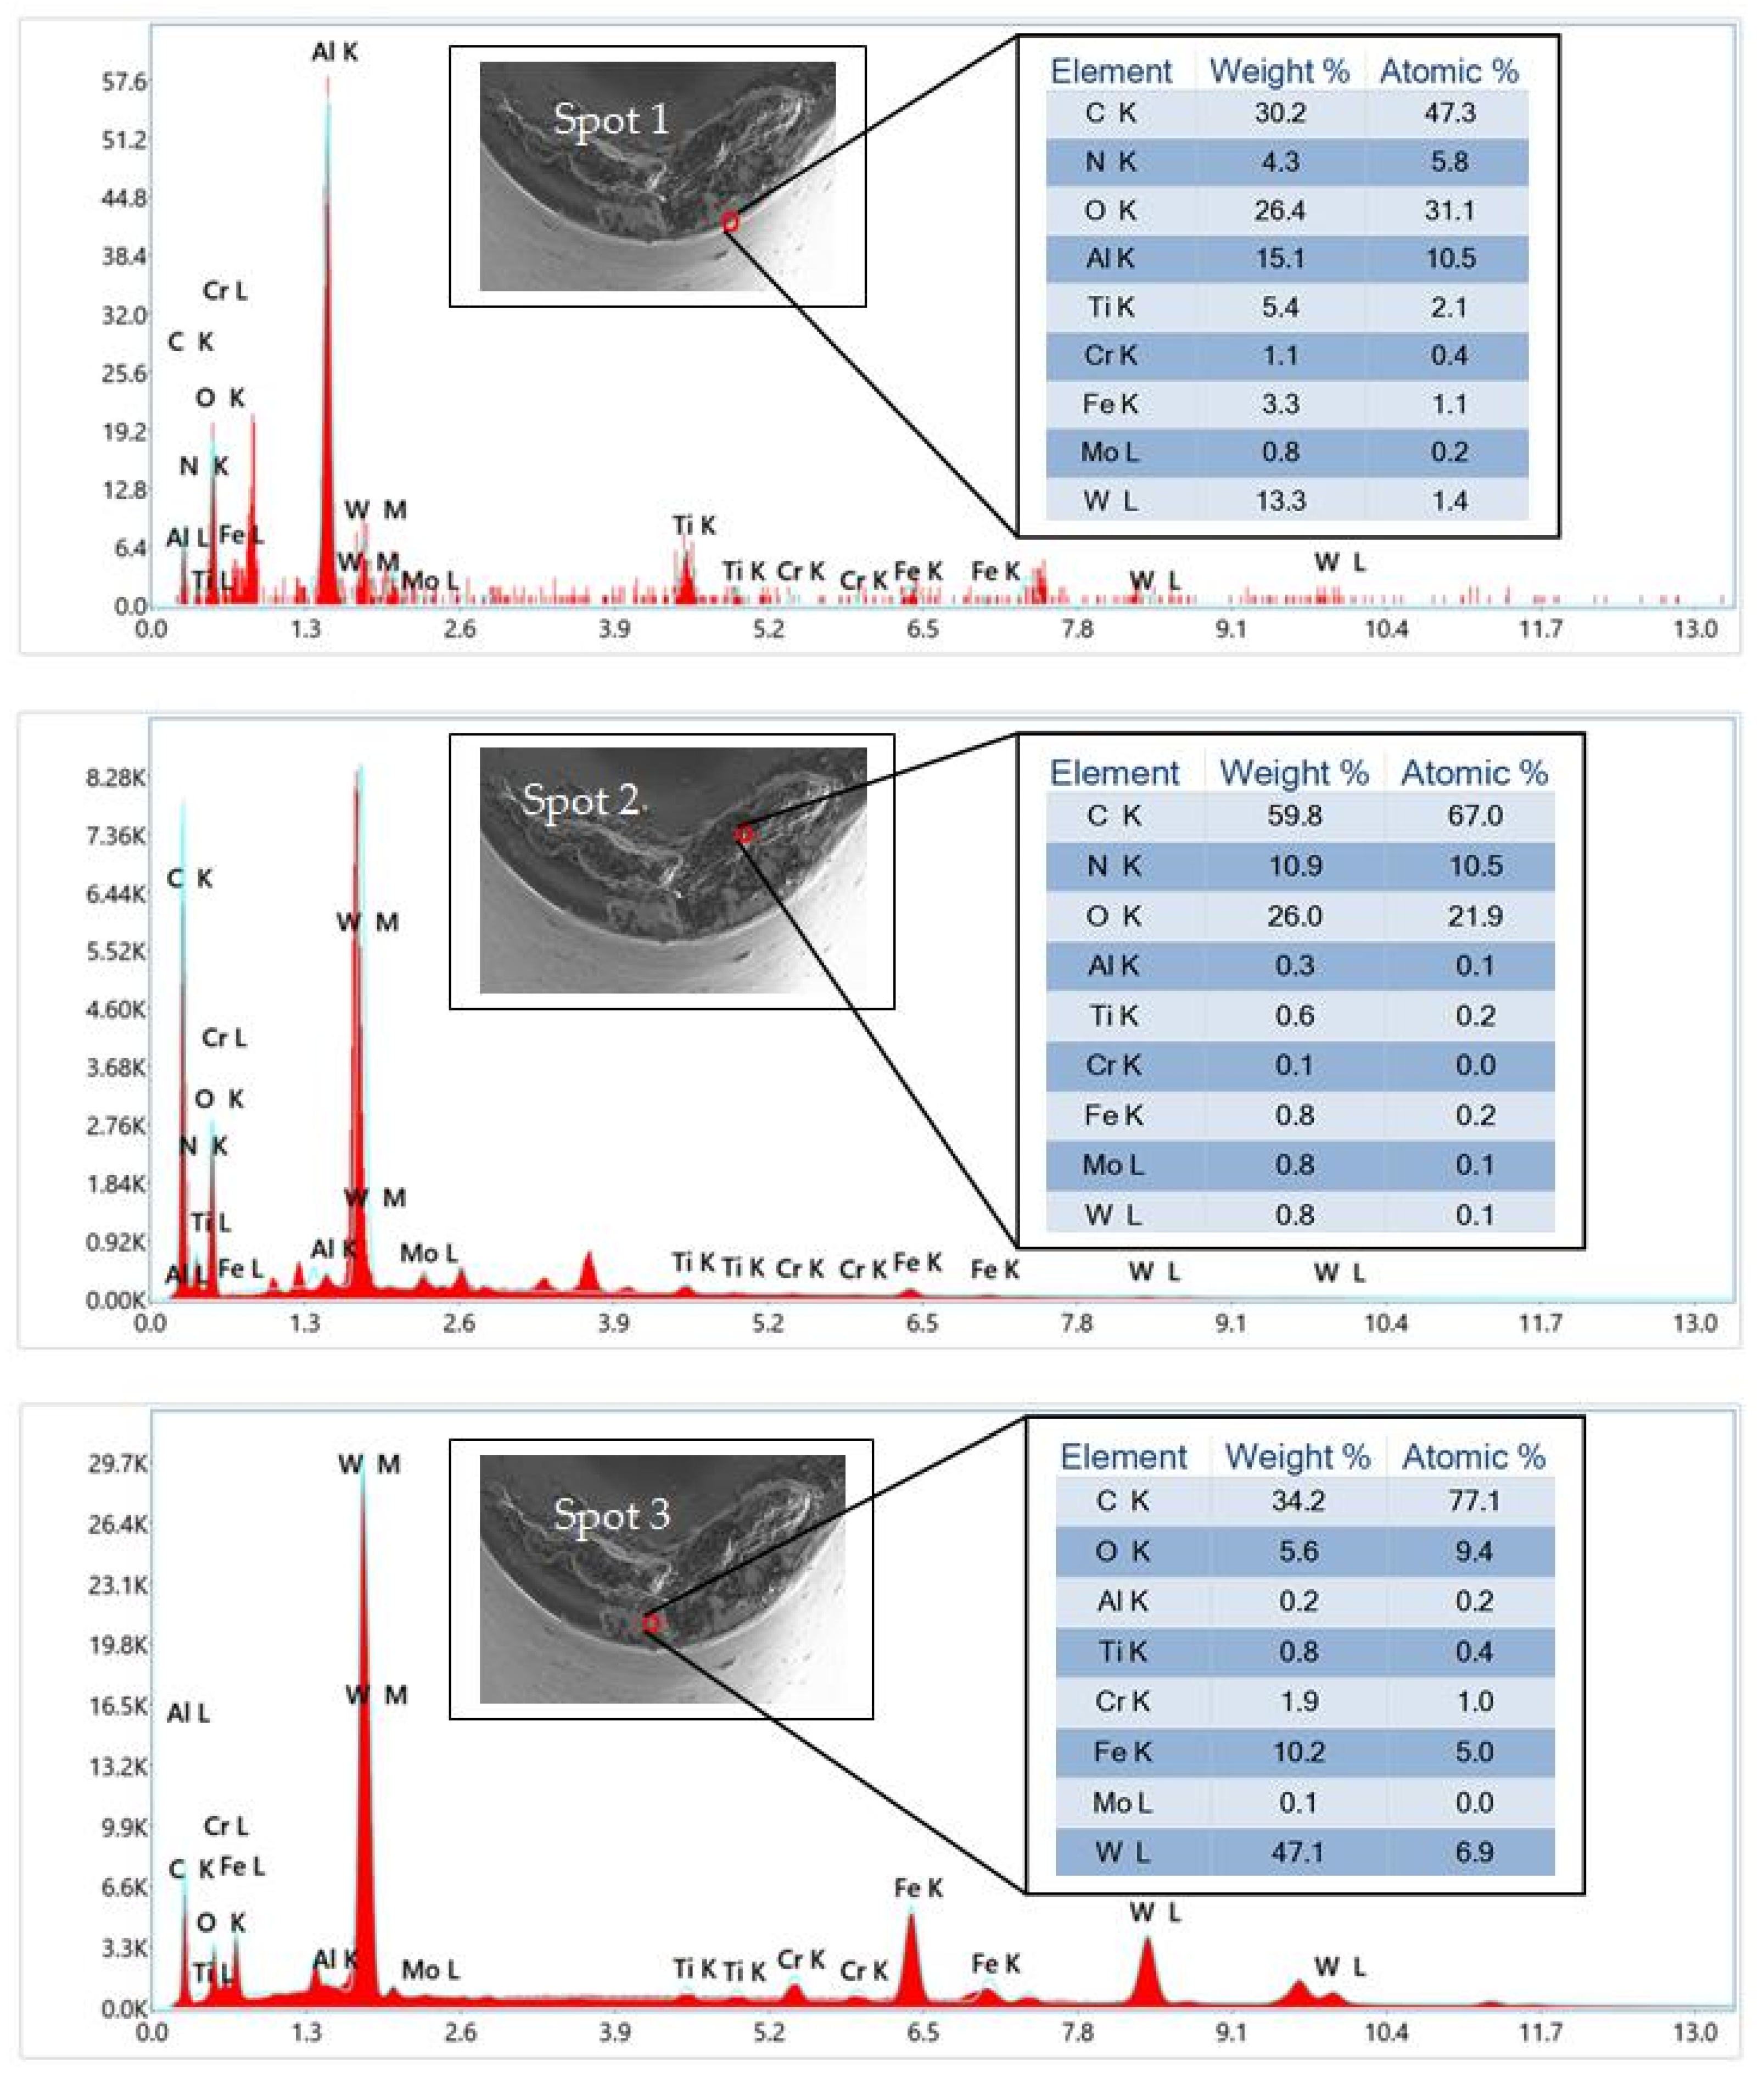
3.2. Assessment of Tool Flank Wear

The state of tool wear determines how well the hard-turning test performs. Higher tool wear causes higher tooling costs, lower productivity, poor surface quality, and higher dimensional errors, making it unsuitable for hard machining. Flank wear is a gradual mode of tool wear that frequently occurs in hard turning due to continuous rubbing of the tool flank surface with the finished work surface [60,61]. This wear cannot be eliminated, but it can be controlled by applying suitable cutting parameters, appropriate tool materials, and advanced cooling technology. In addition, there are several other modes of wear, such as adhesion, diffusion, chipping, notching, and catastrophic tool-tip breakage, in hard turning [61,62]. Adhesion and diffusion wear are temperature dependent and usually analyzed with the help of images taken by a scanning electron microscope (SEM), characterized by energy dispersive X-ray spectroscopy (EDS). Chipping and tool-tip breakage occur, due to higher cutting load subjected to the tool tip during cutting.
In this study, the tool flank wear was measured after each run and the results are shown in Table 2. The obtained wear value for the entirety of the experiments followed normal distribution as the p-value (0.121) exceeded the limit of significance level 0.05, as displayed in Figure 5a. As the tool’s edge was broken in run 27, its wear width was higher as a result and its value can be seen to be outside the normal distribution curve displayed in Figure 5a. In the entire experiment, the lowest and highest flank wear widths were noted as 0.041 mm and 0.112 mm, respectively. These wears using a double nozzle MQL strategy were very promising in terms of hard turning concerns, due to the mist coolant in the interfaces of the tool-work and tool-chip [63]. The smallest wear width (0.041 mm) was obtained when machining was executed at low levels of input cutting variables, whereas the cutting edge was broken when machining was executed at the highest levels of machining parameters. Figure 5b shows that the wear width increased with growing levels of v, a, and f. The higher growth in wear was noticed with leading cutting speed, The wear width was growing almost linearly with improved cutting speed. The surface slope for wear (Figure 5c–e) sloped diagonally upwards with increasing levels of pair of cutting terms f-a, V-a, and V-f, simultaneously. Similarly, the highest levels of cutting terms, f-a, V-a, and V-f, exhibited the largest flank wear (0.112 mm). It was also observed that the stimulus of the pair of parameters V-a on tool flank wear was greatest in comparison to other pairs of terms and this was also evident in the interaction plots (Figure 5f), where the interaction effect of terms a × V potentially existed. ANOVA (Table 4) also presented the significant contribution (2.67%) of interaction terms V*a on flank wear with a significant level limitation of 0.05. ANOVA also showed the contribution of cutting variables towards flank wear. Cutting speed was the most important factor (74.58%), followed by the depth of cut (12.40%) and feed (6.95%). All of these variables had significant impact on flank wear.
Further, the mechanism of tool flank wear was evidenced using optical images (Figure 6). Figure 6 displays the obtained flank wear images of the 27 experiments. In the majority of test conditions, abrasion marks on the tool flank face were seen. The abrasive marks were obtained due to the relative interaction of the tooltip with the hardened workpiece in machining at various cutting speeds. During the turning process, the hard phase of carbon and chromium present in D2 hardened steel was rubbed with a sharp and clean tooltip, hence rubbing marks were produced on the tooltip, referred to as abrasive marks. The width of abrasive marks increased with leading speed and, thus, the tool flank wear increased with time. In some tests (Run 18 and Run 22), chipping on the tool edge was seen due to higher vibration and load on the tool by removing higher-depth material at higher feed conditions. Moreover, wear analysis for the conditions of the lowest and highest cutting parameters was addressed by means of SEM and EDS analyses. To examine the wear morphology in comparison to a fresh tool, SEM with EDS testing was performed for the fresh tool, as displayed in Figure 7. From this analysis, it was confirmed that the cutting tool had TiCN + Al2O3 coatings with elements Ti, C, N, Al, and O having 31.8%, 15.0%, 21.3%, 22.8%, and 9.0% weight, respectively. Abrasive marks were seen in the SEM image (Figure 8a) of the tool (Run 1—lowest cutting parameters), while broken fine chip materials adhered to the tool edge. Similarly in the SEM image (Figure 8b) of the tool Run 27, having the highest cutting parameters, the tool edge was lost, due to the generation of higher mechanical load during cutting at the highest depth of cut (0.35 mm), fastest tool feed (0.18 mm/rev) and largest cutting speed (250 m/min) cutting conditions. Due to the higher cutting temperature, the chip materials welded over the rake surface, shown in Figure 8b.
Moreover, the EDS test was executed at three different spots for both worn tools (Run 1 and Run 27), as shown in Figure 9. The interpretation of the EDS results for Run 1 was as follows: in all spots, elements ‘Fe’ and ‘W’ were shown in the elemental chart. The presence of element ‘Fe’ confirmed the adhesion of work material on the tool edge. Similarly, the presence of ‘W’ confirmed the rubbing of tool coatings by abrasive action and, as a result, tool substrate ‘W’ was slightly exposed. Further, a great reduction in elements ‘Ti’ and N was seen in each spot, due to the transfer of tool coatings with formed chips. In spot 1, the % of element ‘C’ was reduced due to the rubbing of the tooltip, while in other spots (2 and 3), the weight % of ‘C’ increased, which ensured the adhesion of C elements from the workpiece to the tooltip. At each spot, the element ‘O’ was associated with Al2O3 (top coating) and seemed to be higher in comparison to the fresh tool. This might have been due to non-uniformity in the distribution of ‘O’ in the Al2O3 top layer. Furthermore, an increase in the weight percentage of ‘O’ was observed due to the formation of oxidative wear caused by a chemical reaction between the tool surface and the oxygen available in the environment. An increment in % weight of element ‘Al’ (Spot 1–2) was seen due to non-uniformity in the distribution of ‘Al’ in the Al2O3 top layer, while the reduction in ‘Al’ % weight might have been due to abrasion. In spot 2, the workpiece element ‘Mo’ was seen on the tool-tip because of the adhesion of very finely formed chips over it. Overall, the key wear mechanisms responsible for the occurrence of flank wear at the lowest levels of cutting parameters were abrasion and adhesion.
Additionally, the illustration of the EDS result (Figure 10) for the largest wear (obtained at the highest level of process variables) is discussed as follows. In each spot on the cutting tool, the elements of the work, such as ‘Cr’, ‘Fe’, and ‘Mo’, were seen, which indicated the adhesion of the chip’s materials on the cutting edge and rake face of the tool due to the high temperature generated at the highest speed–feed–depth of cut condition. Similarly, the % weight of ‘C’ on the tool-tip was enhanced in all spots, indicating the adhesion of workpiece element ‘C’ over the tool-tip region. The presence of the ‘W’ element in the EDS report of all spots indicated the exposure of the substrate tool material (W) due to catastrophic breakage of the tool-tip at the highest cutting parameters. Catastrophic breakage of the tool edge occurred because of high mechanical load or stress over the tool edge at the highest cutting parameters. An increment in ‘O’ at spot 1 and spot 2 was evident in the oxidation layer formation over the tool edge. Spot 2 lay on the coating removed part of the tool, hence the % of ‘O’ was decreased as it was associated with Al2O3 coating. In Spot 3, the element ‘N’ was not present and the % of Ti, ‘Al, ‘O’, and C were very low, hence it was evidence of the partial removal of tool coatings (TiCN + Al2O3) from the tool-tip. Overall, at the highest cutting conditions, adhesion, oxidation wear, and catastrophic tool-tip failure were found.

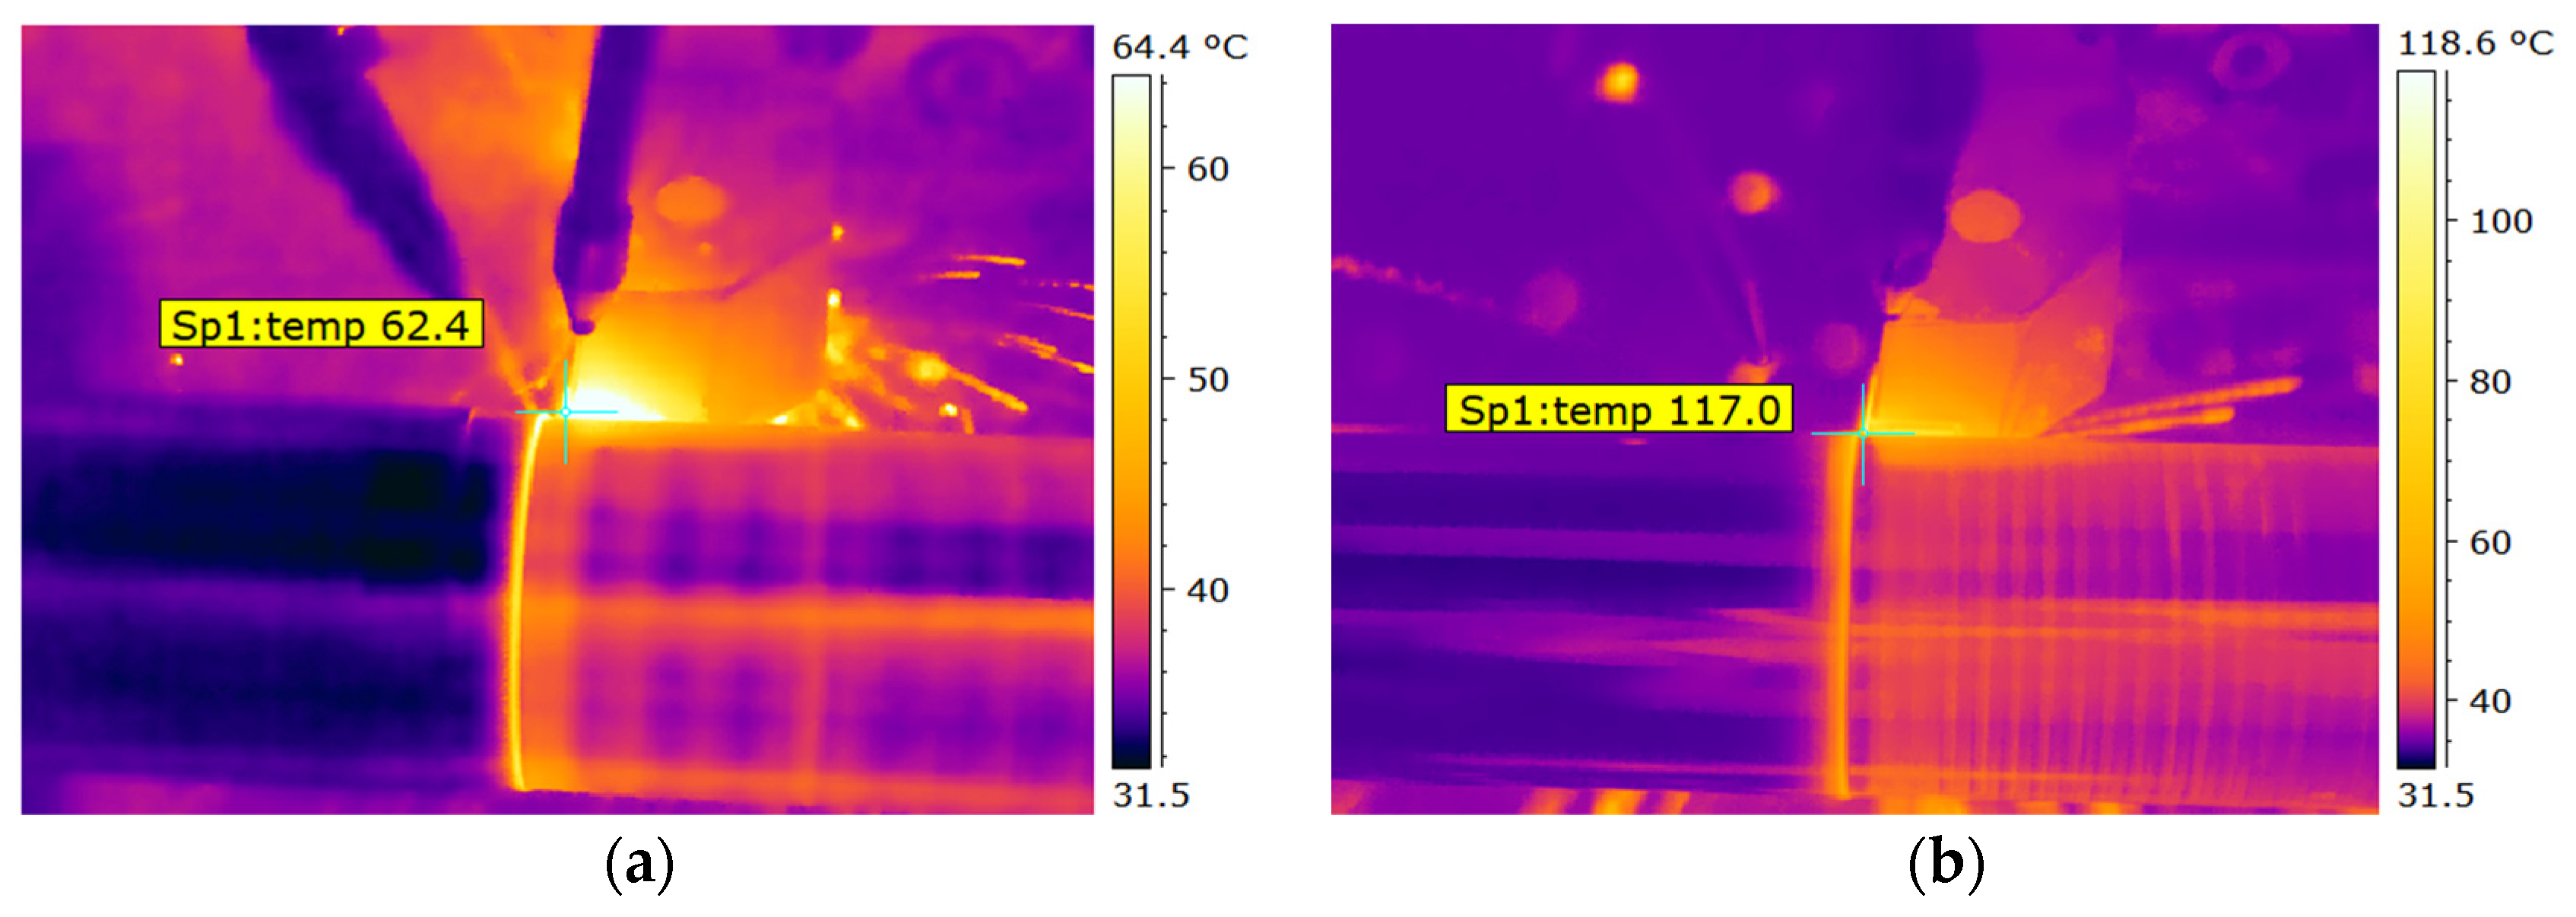
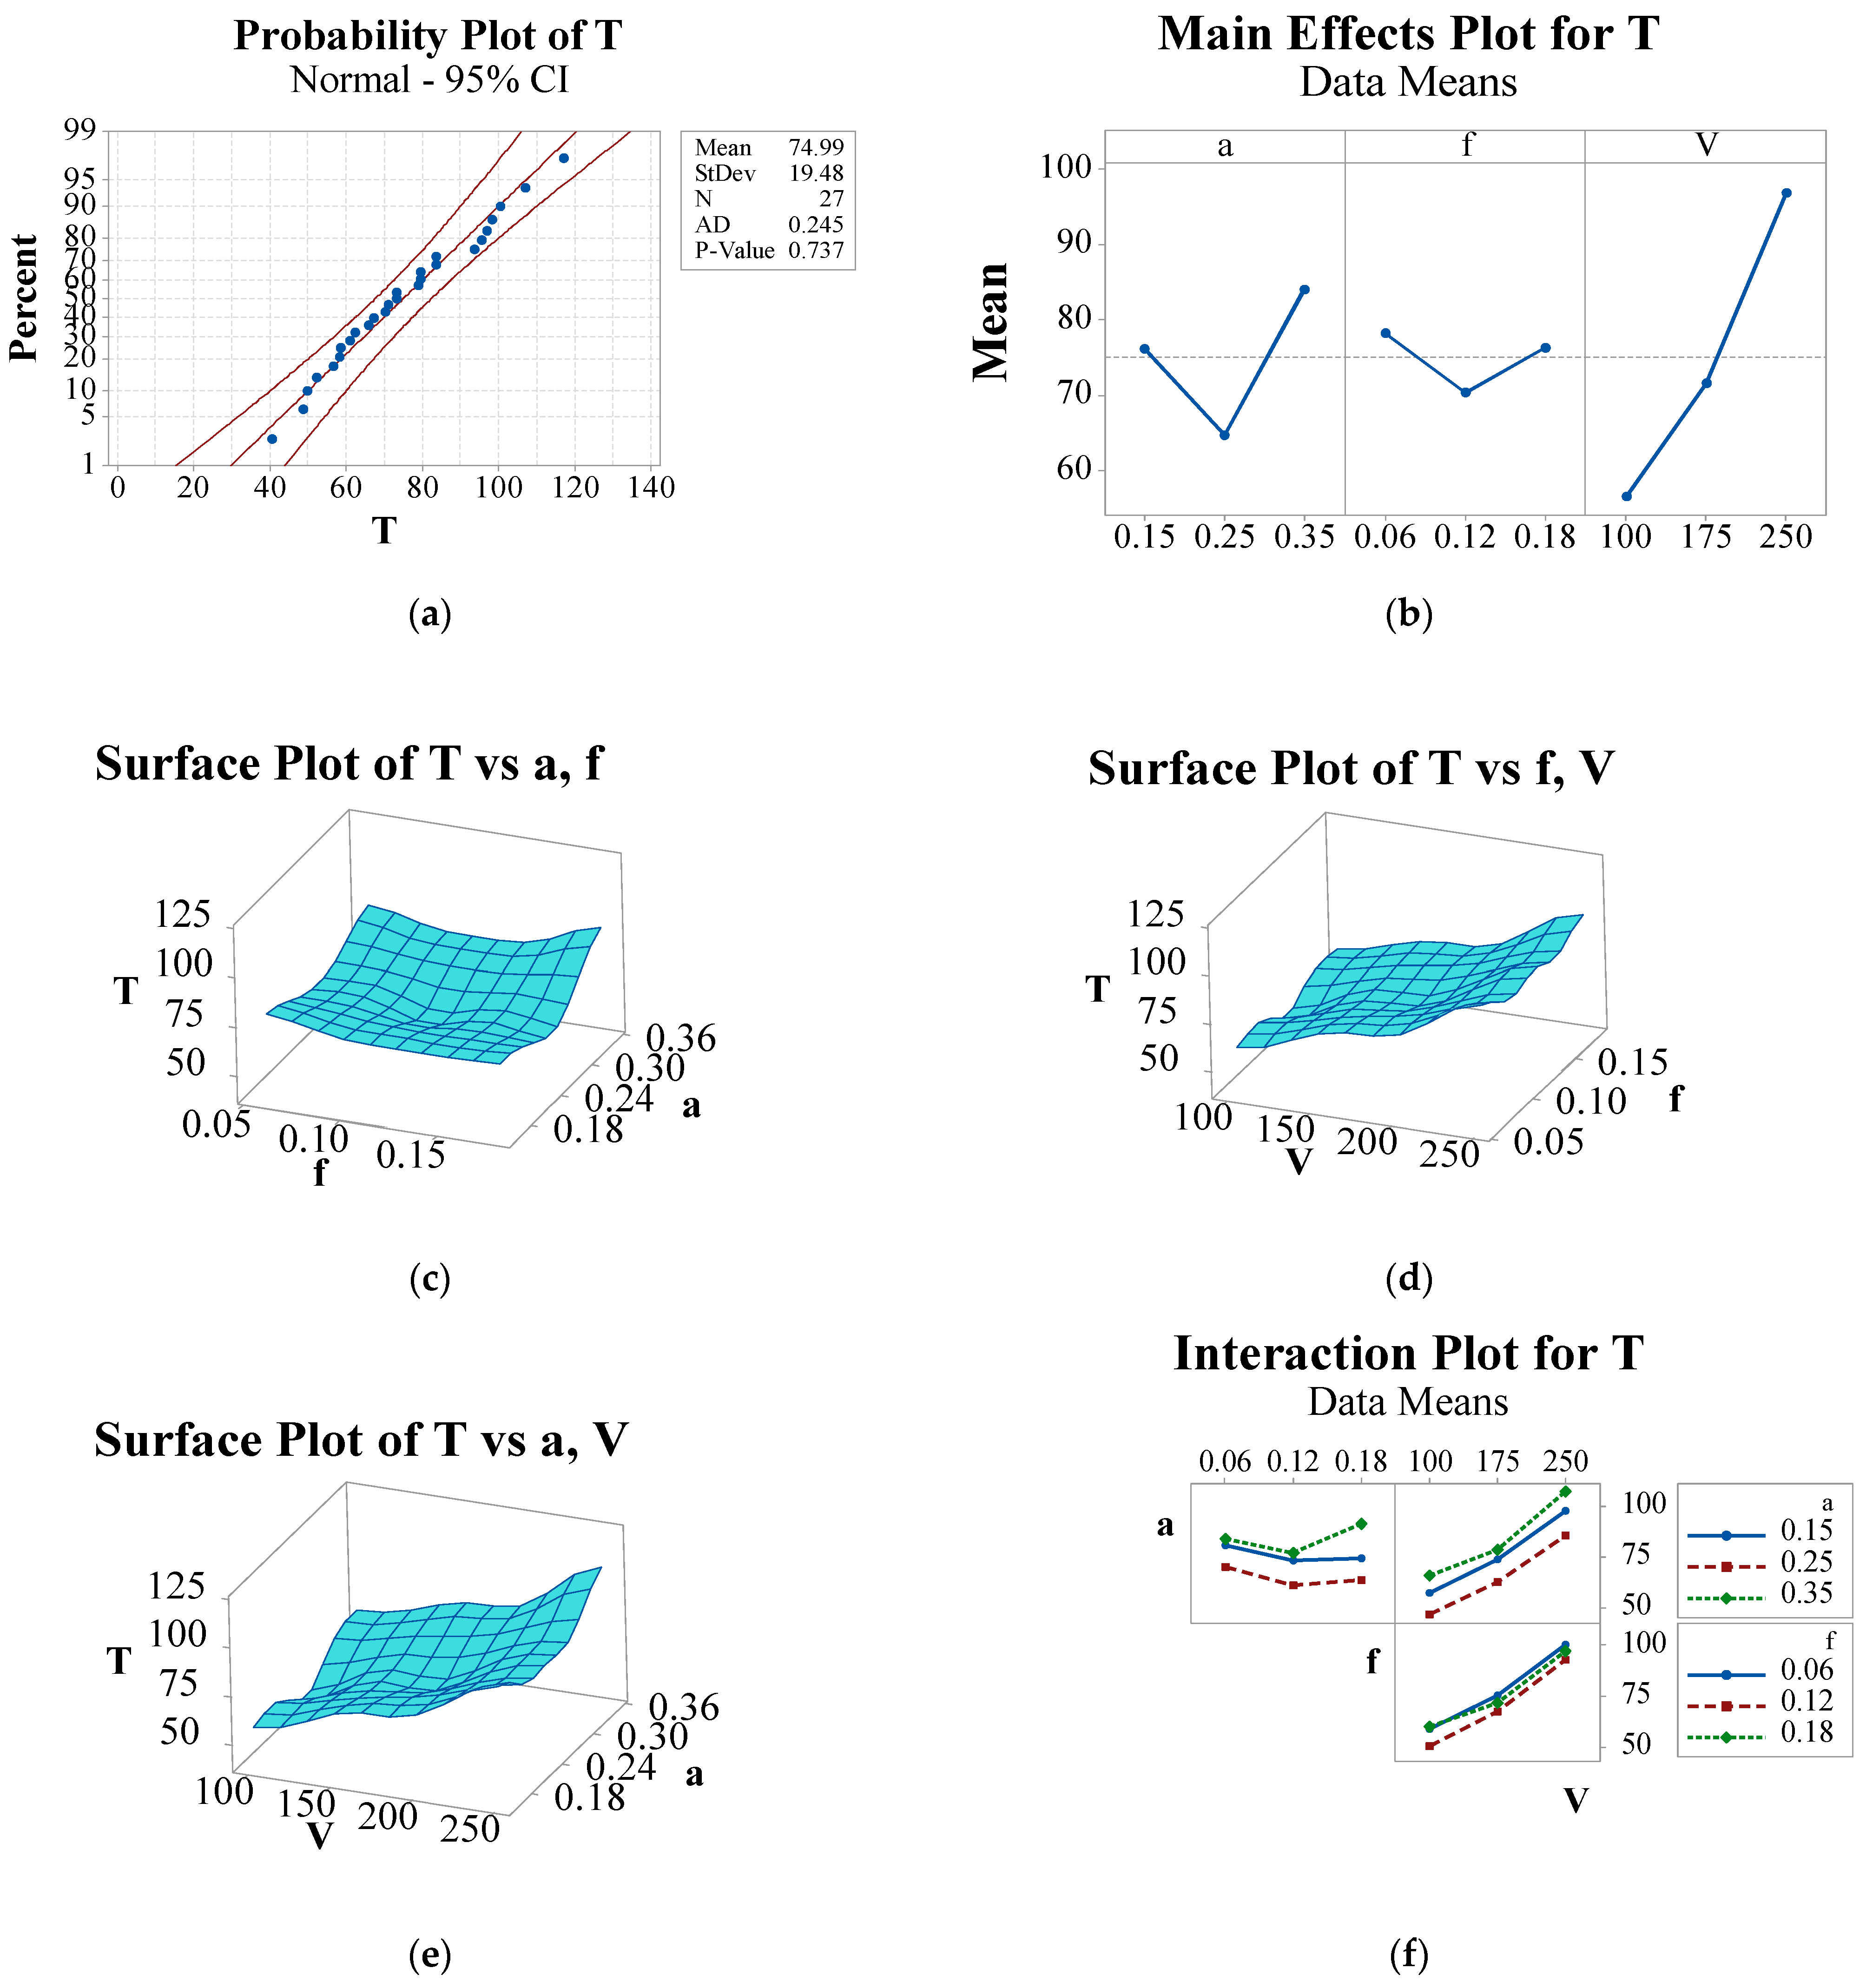
3.3. Assessment of Cutting Temperature

The generation of high-magnitude temperatures in hard turning is a crucial issue for the machinist. High temperatures generated during machining cause severe tool wear in the form of plastic deformation, adhesion, diffusion, and thermal cracking. It is also responsible for chip adhesion on the finished surface, surface deformation, surface damage, and built-up formation, especially in hard turning. Therefore, several cooling strategies have been applied in the past to control the intensity of temperature evolving in hard turning. This research applied a novel cooling approach, called dual nozzle MQL, to explore the machining characteristics enacted in the hard turning procedure of AISI D2 steel with a CVD-coated carbide cutting tool.
For hard turning concerns, the measured cutting temperature was found to be very low (Table 2). This was possibly due to the simultaneous impingement of spring oil into the tool–work contact region from two different directions (from the top of the cutting region and towards the flank surface of the tool). Due to the spraying form of the coolant, the maximum amount of generated heat was used to vaporize the sprayed coolant, resulting in a significant reduction in temperature in the cutting region. In MQL, the coolant impinged with higher frequency, resulting in an improved Nusselt number and, thus, improved heat transfer [64]. The double nozzle system discharged a sufficient amount of coolant, thus providing efficient cooling, and, as a result, temperature significantly reduced. In this CNC lathe, the tool rake face is on the bottom side, hence the tendency of chip movement is in a downward direction, and, as a result, the contact area between the tool and chip is reduced so temperature produced in the cutting region is greatly reduced. Tool-tip temperature (on the flank face) was recorded to have lowered, as displayed in Figure 11a (Run 1) and Figure 11b (Run 27), respectively.
The mean temperature in the entire 27 runs was found to be 74.99 °C, with a standard deviation of 19.48 °C. All the obtained data followed the normal distribution with a p value of 0.747, as displayed in Figure 12a. Thus, these are referred to as statistically significant. According to Figure 12b, the temperature rapidly grew with increasing cutting speed, due to inadequate penetration of the mist lubricant into the shearing zone at a higher cutting speed [65]. The low-temperature range was observed when machining was accomplished with a moderate level of feed (0.12 mm/rev) and cutting depth (0.25 mm). This was also observed in surface plots (Figure 12c), where the slope of the surface was reduced at a moderate level of feed and cutting depth. From surface plots, the temperature increased in tandem with increases in cutting speed–feed (Figure 12d) and cutting speed–depth of cut (Figure 12e). The interaction effect of pairs of cutting factors is illustrated in Figure 12f. The interaction consequence of terms a-f occurred strongly because the graphs are non-parallel, whereas the interaction stimulus of other pairs of terms on temperature did not exist and their graphs were parallel. ANOVA results confirmed these findings. According to the results of ANOVA (Table 5), the interaction term a-f was significant (p < 0.05), whereas the other pairs of interaction terms a-V and f-V were insignificant (p > 0.05) for temperature. ANOVA also showed that the cutting speed was the most influential cutting term with a contribution of 75.84% followed by the depth of cut and feed with contributions of 17.18% and 3.12%, respectively. All the input terms were noteworthy, as their p-values are lower than 0.05. Moreover, the interaction effects of the terms a-f were said to be significant, accounting for 2.44% of the total.

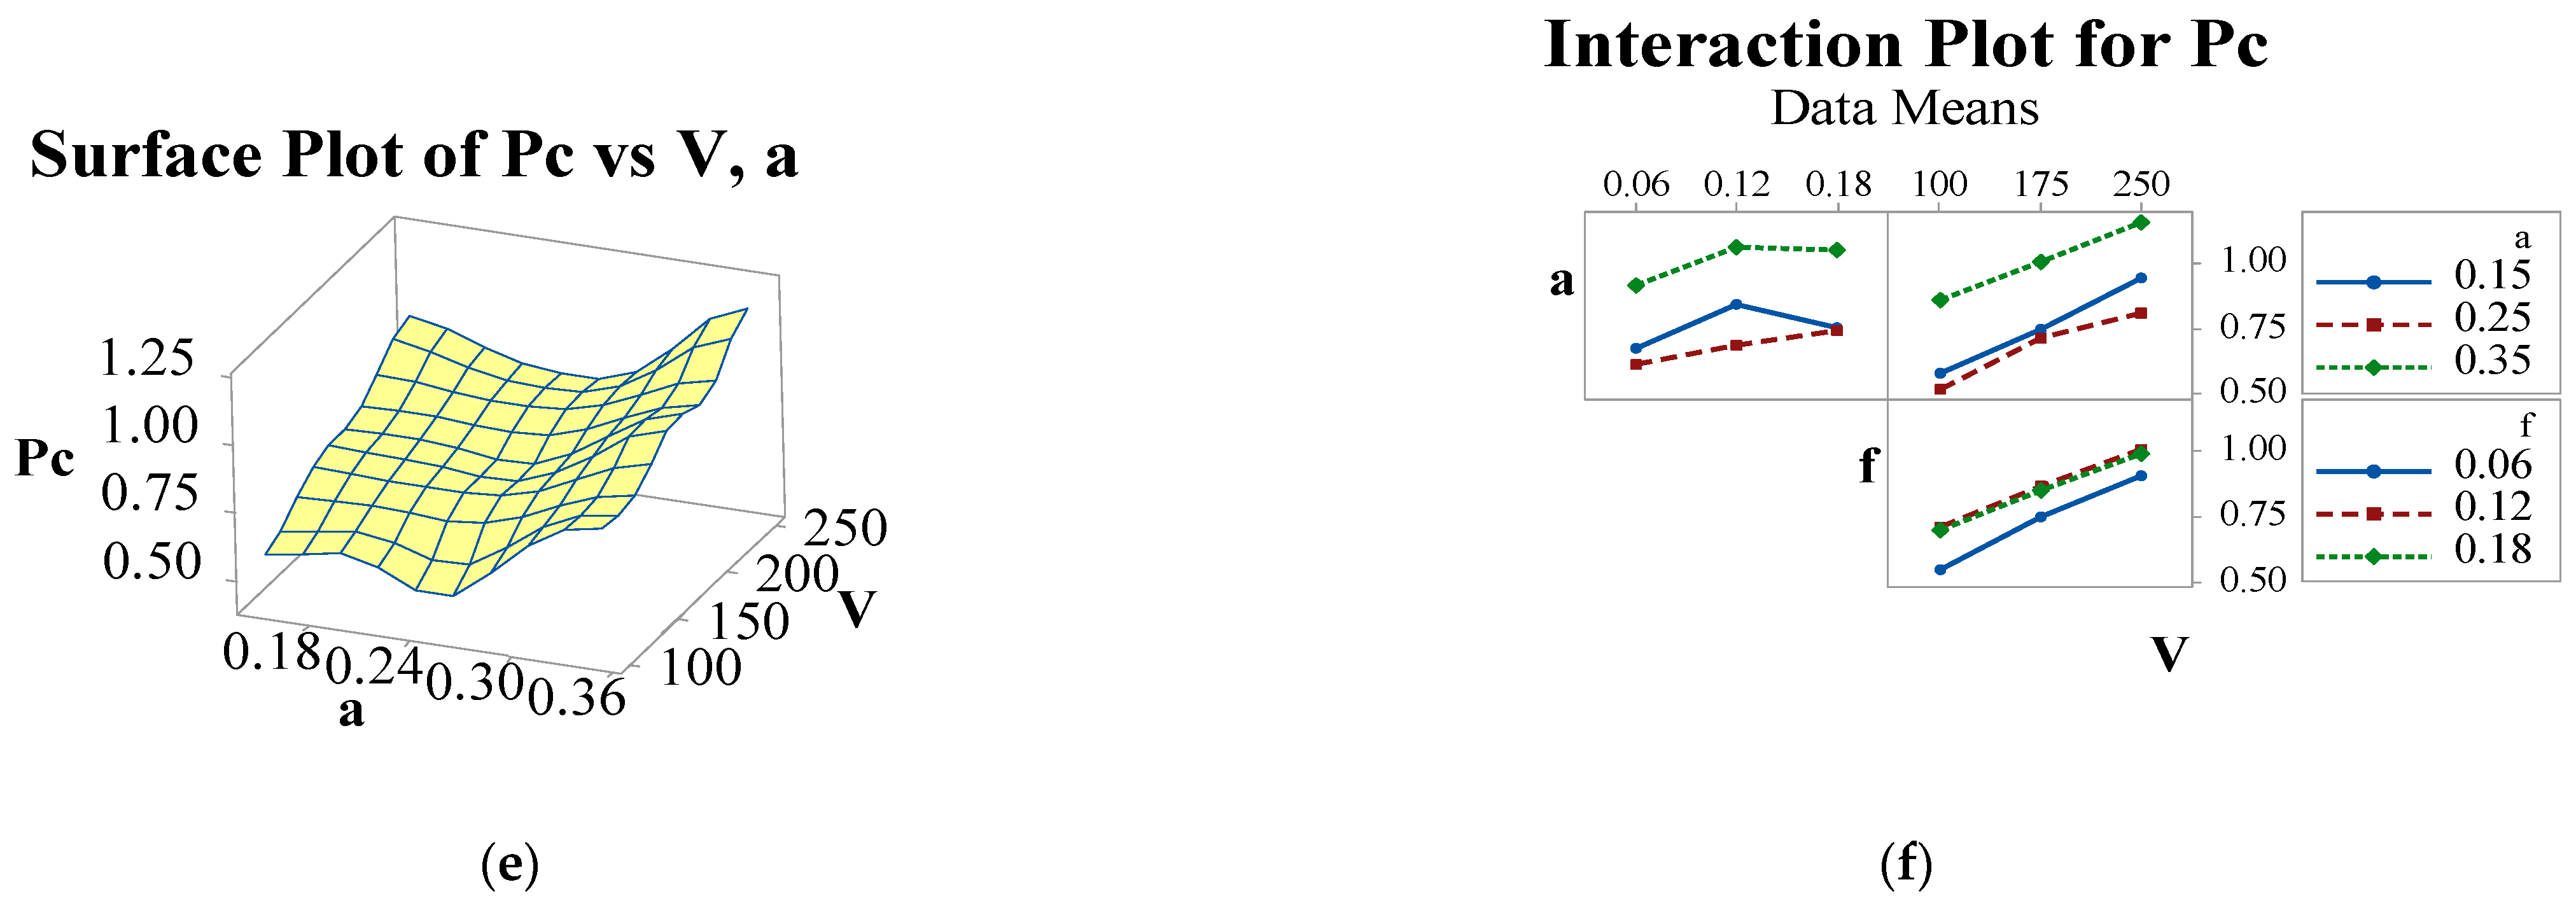
3.4. Assessment of Power Consumption

In machining activity, the consumption of electric current is one of the main factors affecting sustainability. The consumption of electricity is referred to as power consumption in machining on the shop floor and contributes significantly to the overall machining cost. Electric consumption in metal machining industries is increasing day by day. According to the International Energy Agency (IEA), electricity consumption has increased by 1.5% per year from 2007 and is expected to do so till 2030, with the United States alone accounting for 50% of electricity consumption by 2030 [66]. The report also stated that China and India would use the greatest amounts of power by 2030. Therefore, nowadays, there is a noteworthy challenge to manufacturers to minimize the utilization of electricity in various machining activities to overcome global electricity shortages in the future. Taking these factors into account, the current study provided a thorough examination of power consumption in hard turning of AISI D2 tool steel, by varying the levels of cutting parameters under dual nozzle MQL conditions.
The power consumption (Pc) was recorded for each test run (as per Taguchi L27 design) with a fixed turning length of 160 mm, as noted in Table 2. The range of Pc was found to be between 0.424 to 1.214 kW, with an average of 0.8172 kW and a standard deviation of 0.2088, as displayed in the probability graph (Figure 13a). The probability graph confirmed that the recorded Pc data followed a normal distribution curve, as the p-value (0.947) was superior to the significance level (0.05) value. The lowest Pc (0.424 kW) was obtained at the least value of cutting terms (a = 0.15 mm; f = 0.06 mm/rev and V = 100 m/min). Nur et al. [67] also got the least power consumption at the lowest level of cutting speed and feed. The largest Pc (1.214 kW) was obtained when machining was executed at the greatest depth of cut (0.35 mm), moderate feed (0.12 mm/rev), and highest cutting speed (250 m/min). From the main effects plot (Figure 13b), the cutting power was almost proportional to cutting speed, due to the higher energy used to rotate the workpiece at a higher speed [68]. The cutting power was relatively higher at the lowest depth of cut (0.15 mm), in contrast to the 0.25 mm depth of cut. A small depth of cut frequently increases the friction between the tool and workpiece when cutting the hardened layer of a workpiece, Therefore, it is advised to increase the depth of the cut as much as the machine power permits so that chipping and abnormal wear are prevented. In the current study, the chipping and abnormal tool wear at the highest depth of cut conditions were seen in terms of relatively higher power consumption and temperature being found at the highest depth of cut. Additionally, it is probable that when the MQL dual nozzles were used in the cutting zone, the cutting fluid’s lubricating and cooling efficiency increased at moderate depths of cut, which greatly reduced cutting friction and lowered cutting temperature and power. The power consumption was drastically enhanced when the depth of cutting was enhanced from 0.25 to 0.35 mm, which might have occurred due to the higher force required to remove high-depth material from the parent material [68]. The cutting power was relatively higher at the lowest depth of cut (0.15 mm), in contrast to the 0.25 mm depth of cut. This might have been due to the effective lubrication effect of dual nozzle MQL during machining. Similarly, a relevant gain in power consumption was seen when the cutting feed was improved from 0.06 mm/rev to 0.12 mm/rev, while later on the power consumption was marginally bridged with increasing feed (0.18 mm/rev). Valera and Bhavsar. [69] also reported that the power consumption progressively improved when cutting feed was improved in turning EN 31 steel. From the surface plots (Figure 13c), a sharp increment in slope was seen after the middle level of depth of cutting (0.25 mm), which ensured the drastic increment in power consumption due to requiring greater cutting force to remove the higher stock of material. The slope of the curve rose at moderate feed (0.12 mm/rev) with the lowest level of depth of cut (0.15 mm), which ensured higher power consumption due to the development of built-up edge formation at this parametric condition. Similarly, from Figure 13 it can be seen that, with simultaneous increment in cutting speed–feed, the power consumption increased, due to the higher metal removal rate (MRR) at higher cutting speed and feed conditions. Sangwan and Kant [70] reported more power consumption due to increasing MRR, cutting force, and temperature at higher speed and feed conditions. Again, from Figure 13e, the power consumption was increasing with simultaneous increment in cutting speed–depth of cut. Further, the interaction plots (Figure 13f) show the existence of the interaction of terms (a × f and a × V) on Pc as the one line is non-parallel to the others, but the strength of their effect was poor and the same was confirmed by ANOVA (Table 6). Referring to the ANOVA results, all interaction terms (a × f, a × V, and f × V) had less than 0.05 p-values. Therefore, the effect of interaction terms on Pc was considered irrelevant. Additionally, ANOVA was used to estimate the percentage effect of input variables on Pc. The depth of cutting had the largest significant consequence (46.69%) on Pc, followed by cutting speed (40.76%) and feed (9.70%). Considering the 95% confidence level, all the cutting terms had a significant consequence on Pc. Şahinoğlu and Rafighi [71] discovered that depth of cut (64.83%) had the greatest significant effect on Pc, followed by cutting speed (16.81%) and feed (11.80%) in the hard turning process of AISI 4140 using multiple layered coated carbide tool.

3.5. Assessment of Noise Emission

Noise emission (Ne) is a major concern for human health in the metal machining industries. On the machining shop floor, there are usually several sources of noise emissions, and cutting noise emissions is one of them. Cutting noise can be controlled by employing the right cutting variables and cutting fluid strategy. Moreover, cutting noise emissions are an important indicator of sustainability, so they should be as low as possible to achieve sustainable machining. The interaction between the cutting insert and the workpiece in dynamic conditions causes noise emission during the cutting action. Therefore, it can be stated that tool wear and surface quality are closely associated with the intensity of noise produced during machining [71].
In this study, the noise emission in each run was recorded and found to be in the range of 68.54–82.7 dB (Table 2) with an average of 75.94 dB and a standard deviation of 3.885, as disclosed in Figure 14a. All of the obtained noise data followed the normal probability curve with a p value of 0.450 (higher than the significance level of 0.05). The recorded noise emission value included the total noise emitted by the MQL system, CNC lathe, and cutting action. The obtained noise emission results were found to be lower than the human hearing limit (85 dB), which could be attributed to the perfect dynamic interaction of tool and workpiece, as well as the dual nozzle MQL’s effective cooling and lubrication potential during machining. Therefore, from the perspective of human health, all the combinations of input terms in the L27 design were acceptable to provide controlled noise emission during hard turning.
Additionally, parametric impact on noise emission (Ne) during cutting was discussed using main effects plots, surface plots, interaction plots, and ANOVA. Referring to Figure 14b, the noise emission was enhanced by increasing all the input parameters’ values. A great increment in noise emission was seen when the depth of material removal was enhanced from 0.15 to 0.35 mm. This might be because of the increasing interface surface area between the tool-tip and the work surface with the increasing depth of penetration of the tool inside the workpiece. This may also cause excessive cutting force and vibration and, as a result, more noise generation. The noise emissions were also stimulated by cutting speed, which improved linearly with increasing cutting speed due to the generation of a greater amplitude of vibration with the speed. [72,73]. Feed rate also affected noise emission as it increased with tool feed, but depth of cut and cutting speed were more dominating than tool feed in the aspect of noise emission. According to Karaaslan and Şahinoğlu [74], the sound emission in machining increased with rising feed and depth of cut. Surface plots display the effect of pairs of terms on noise emission. The slope of the surface (Figure 14c) gradually increased in a diagonal direction, showing that noise emission rose with increment in the depth of cutting and feed together. The highest noise emission was recorded at the highest level of depth of cut (0.35 mm) and feed (0.18 mm/rev). Similarly, noise emission increased with a simultaneous increment of a-V (Figure 14d) and V-f (Figure 14e). From the interaction plot (Figure 14f), it can be said that the interaction of term a-f on noise emission strongly existed in comparison to other interaction terms, and the same consequence was reported in ANOVA (Table 7), where the interaction term a × f had a significant effect on noise emission with a p-value below the significant limit (0.05). The other interaction terms (a × V and f × V) had greater than 0.05 probability value, and therefore their effects on noise emission were irrelevant. Additionally, referring to the ANOVA (Table 7) result, all the individual input terms (a, f, and V) had a relevant effect on noise emission as their p values were lower than 0.05. The contribution of the depth of cut on noise emission was seen to be the largest (57.57%), followed by cutting speed (34.52%) and feed (3.66%). The interaction term (d-f) had a significant impact on noise emission with a contribution of 2.12%. Şahinoğlu and Rafighi [71] also found the same effect of cutting terms (a, f, and V) and the interaction term (a-f) on noise emission in hard turning of 4140 steel.

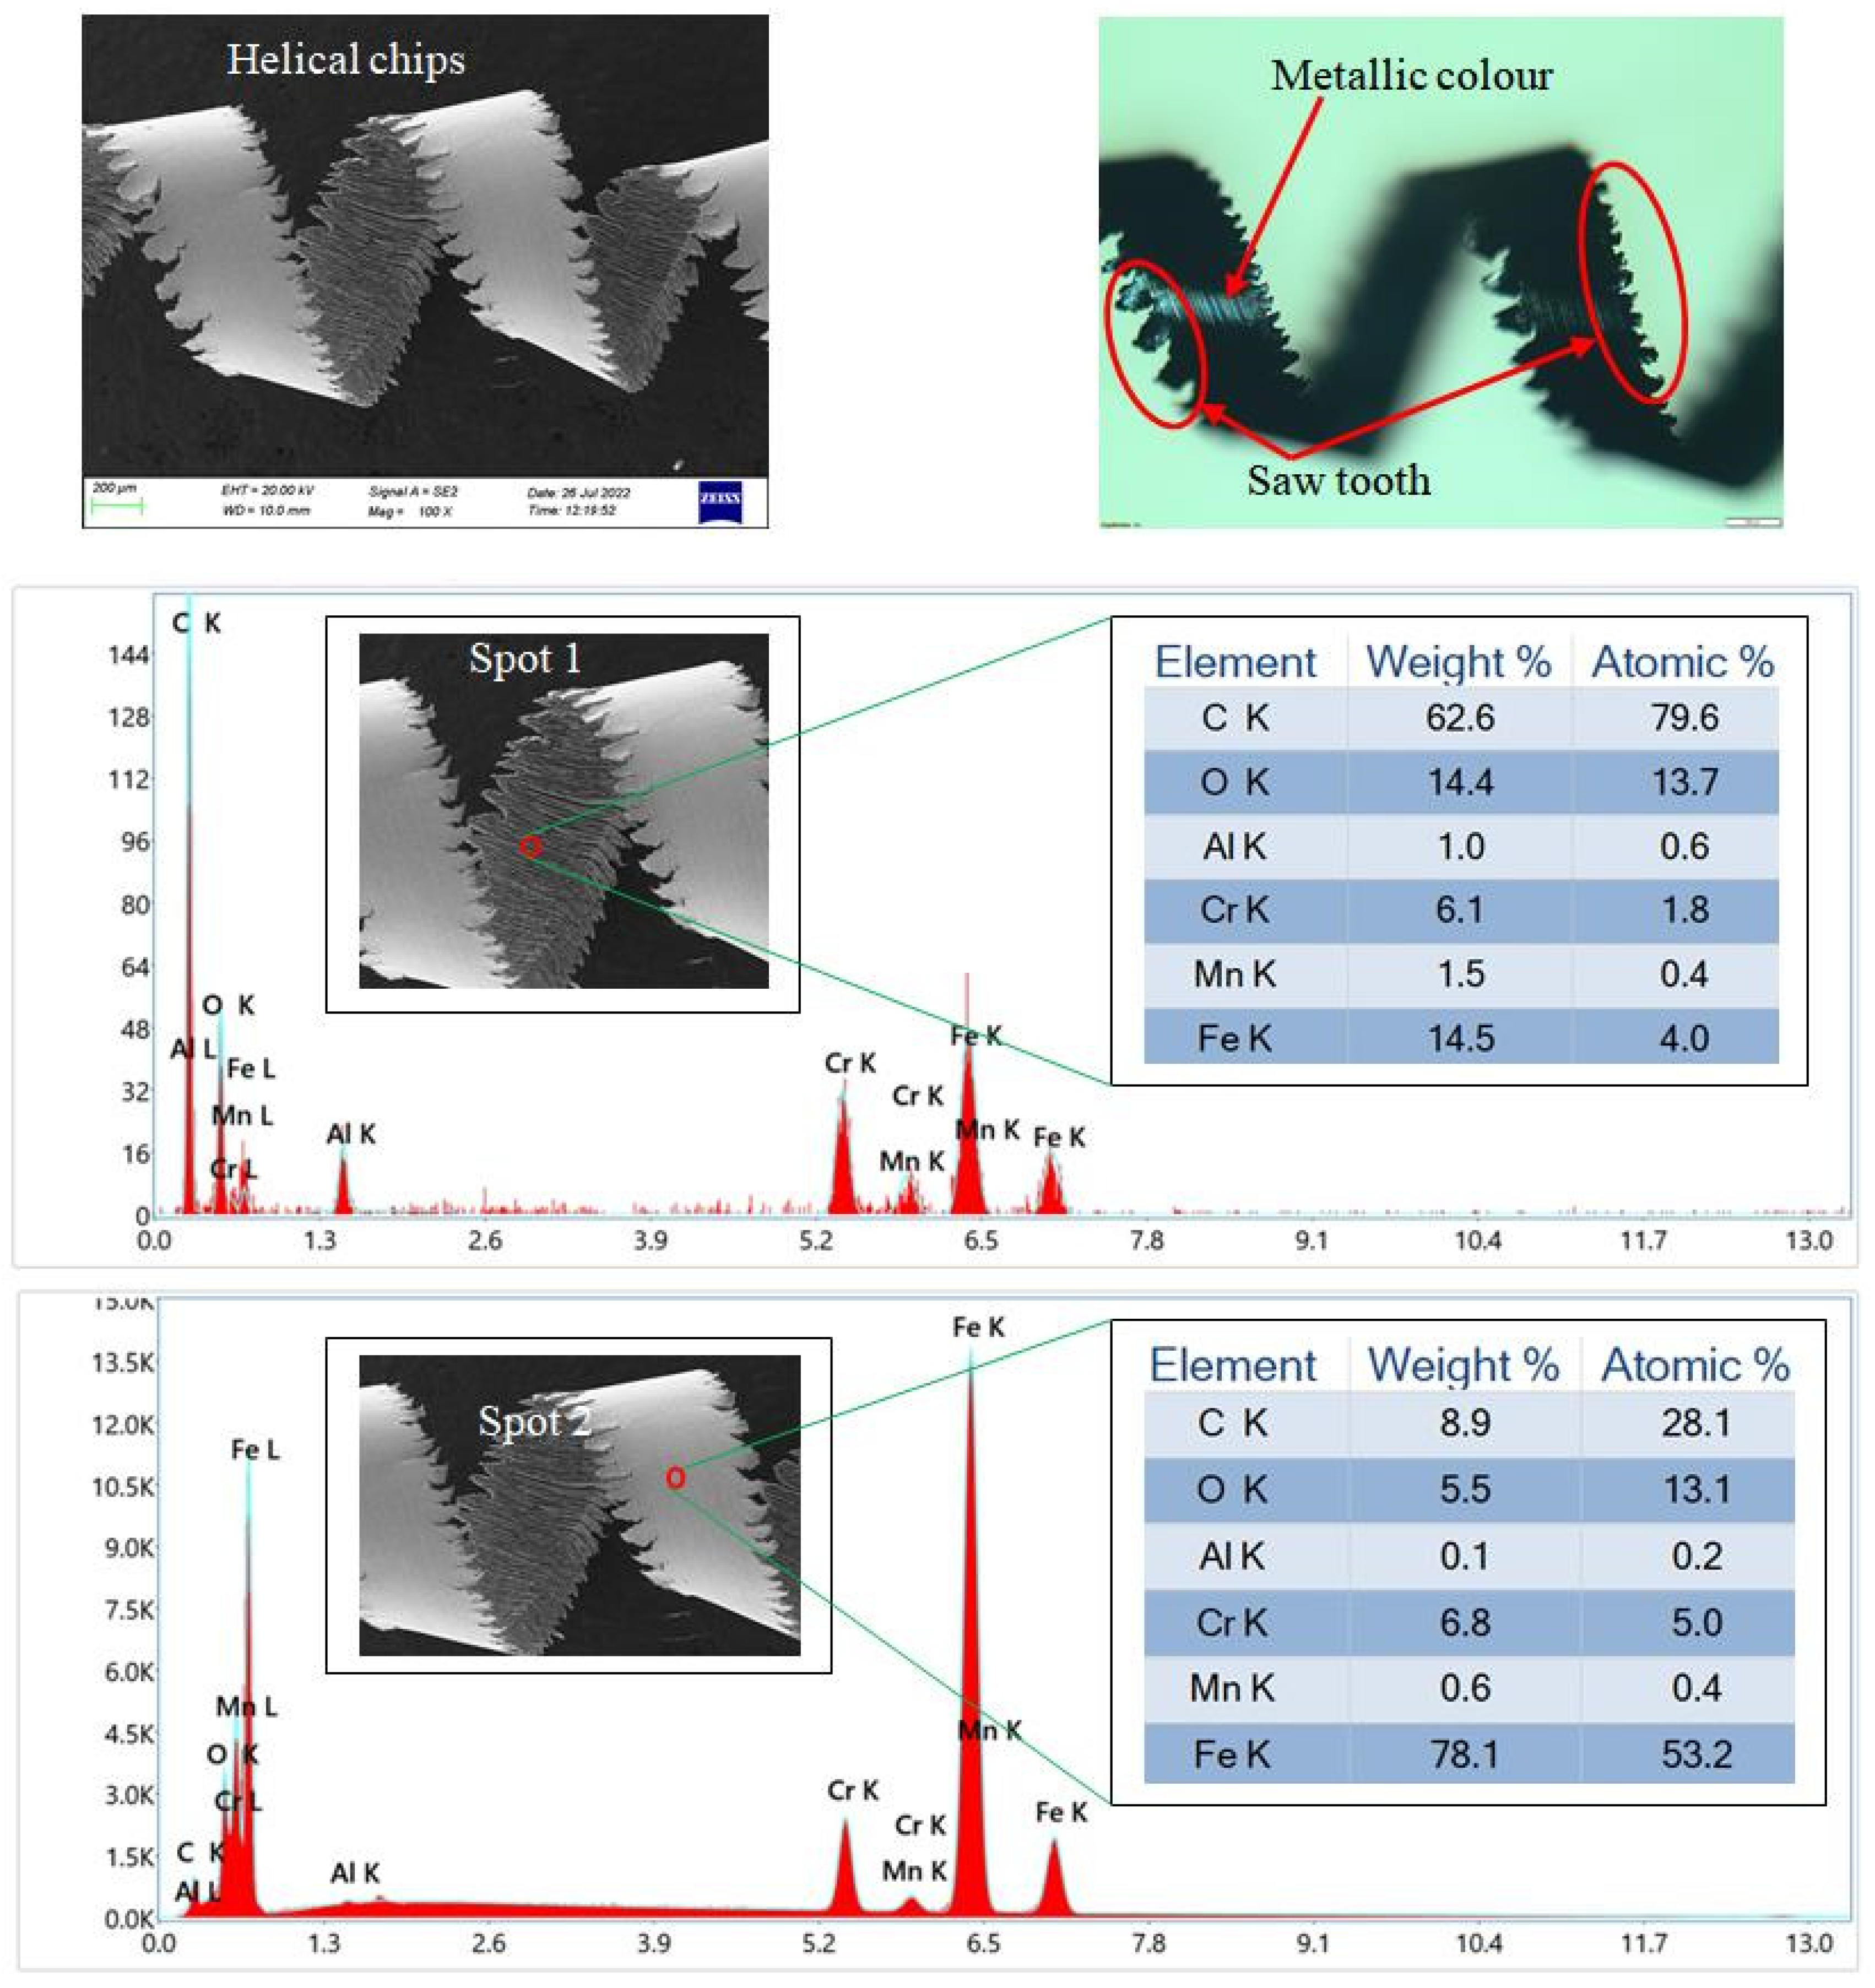
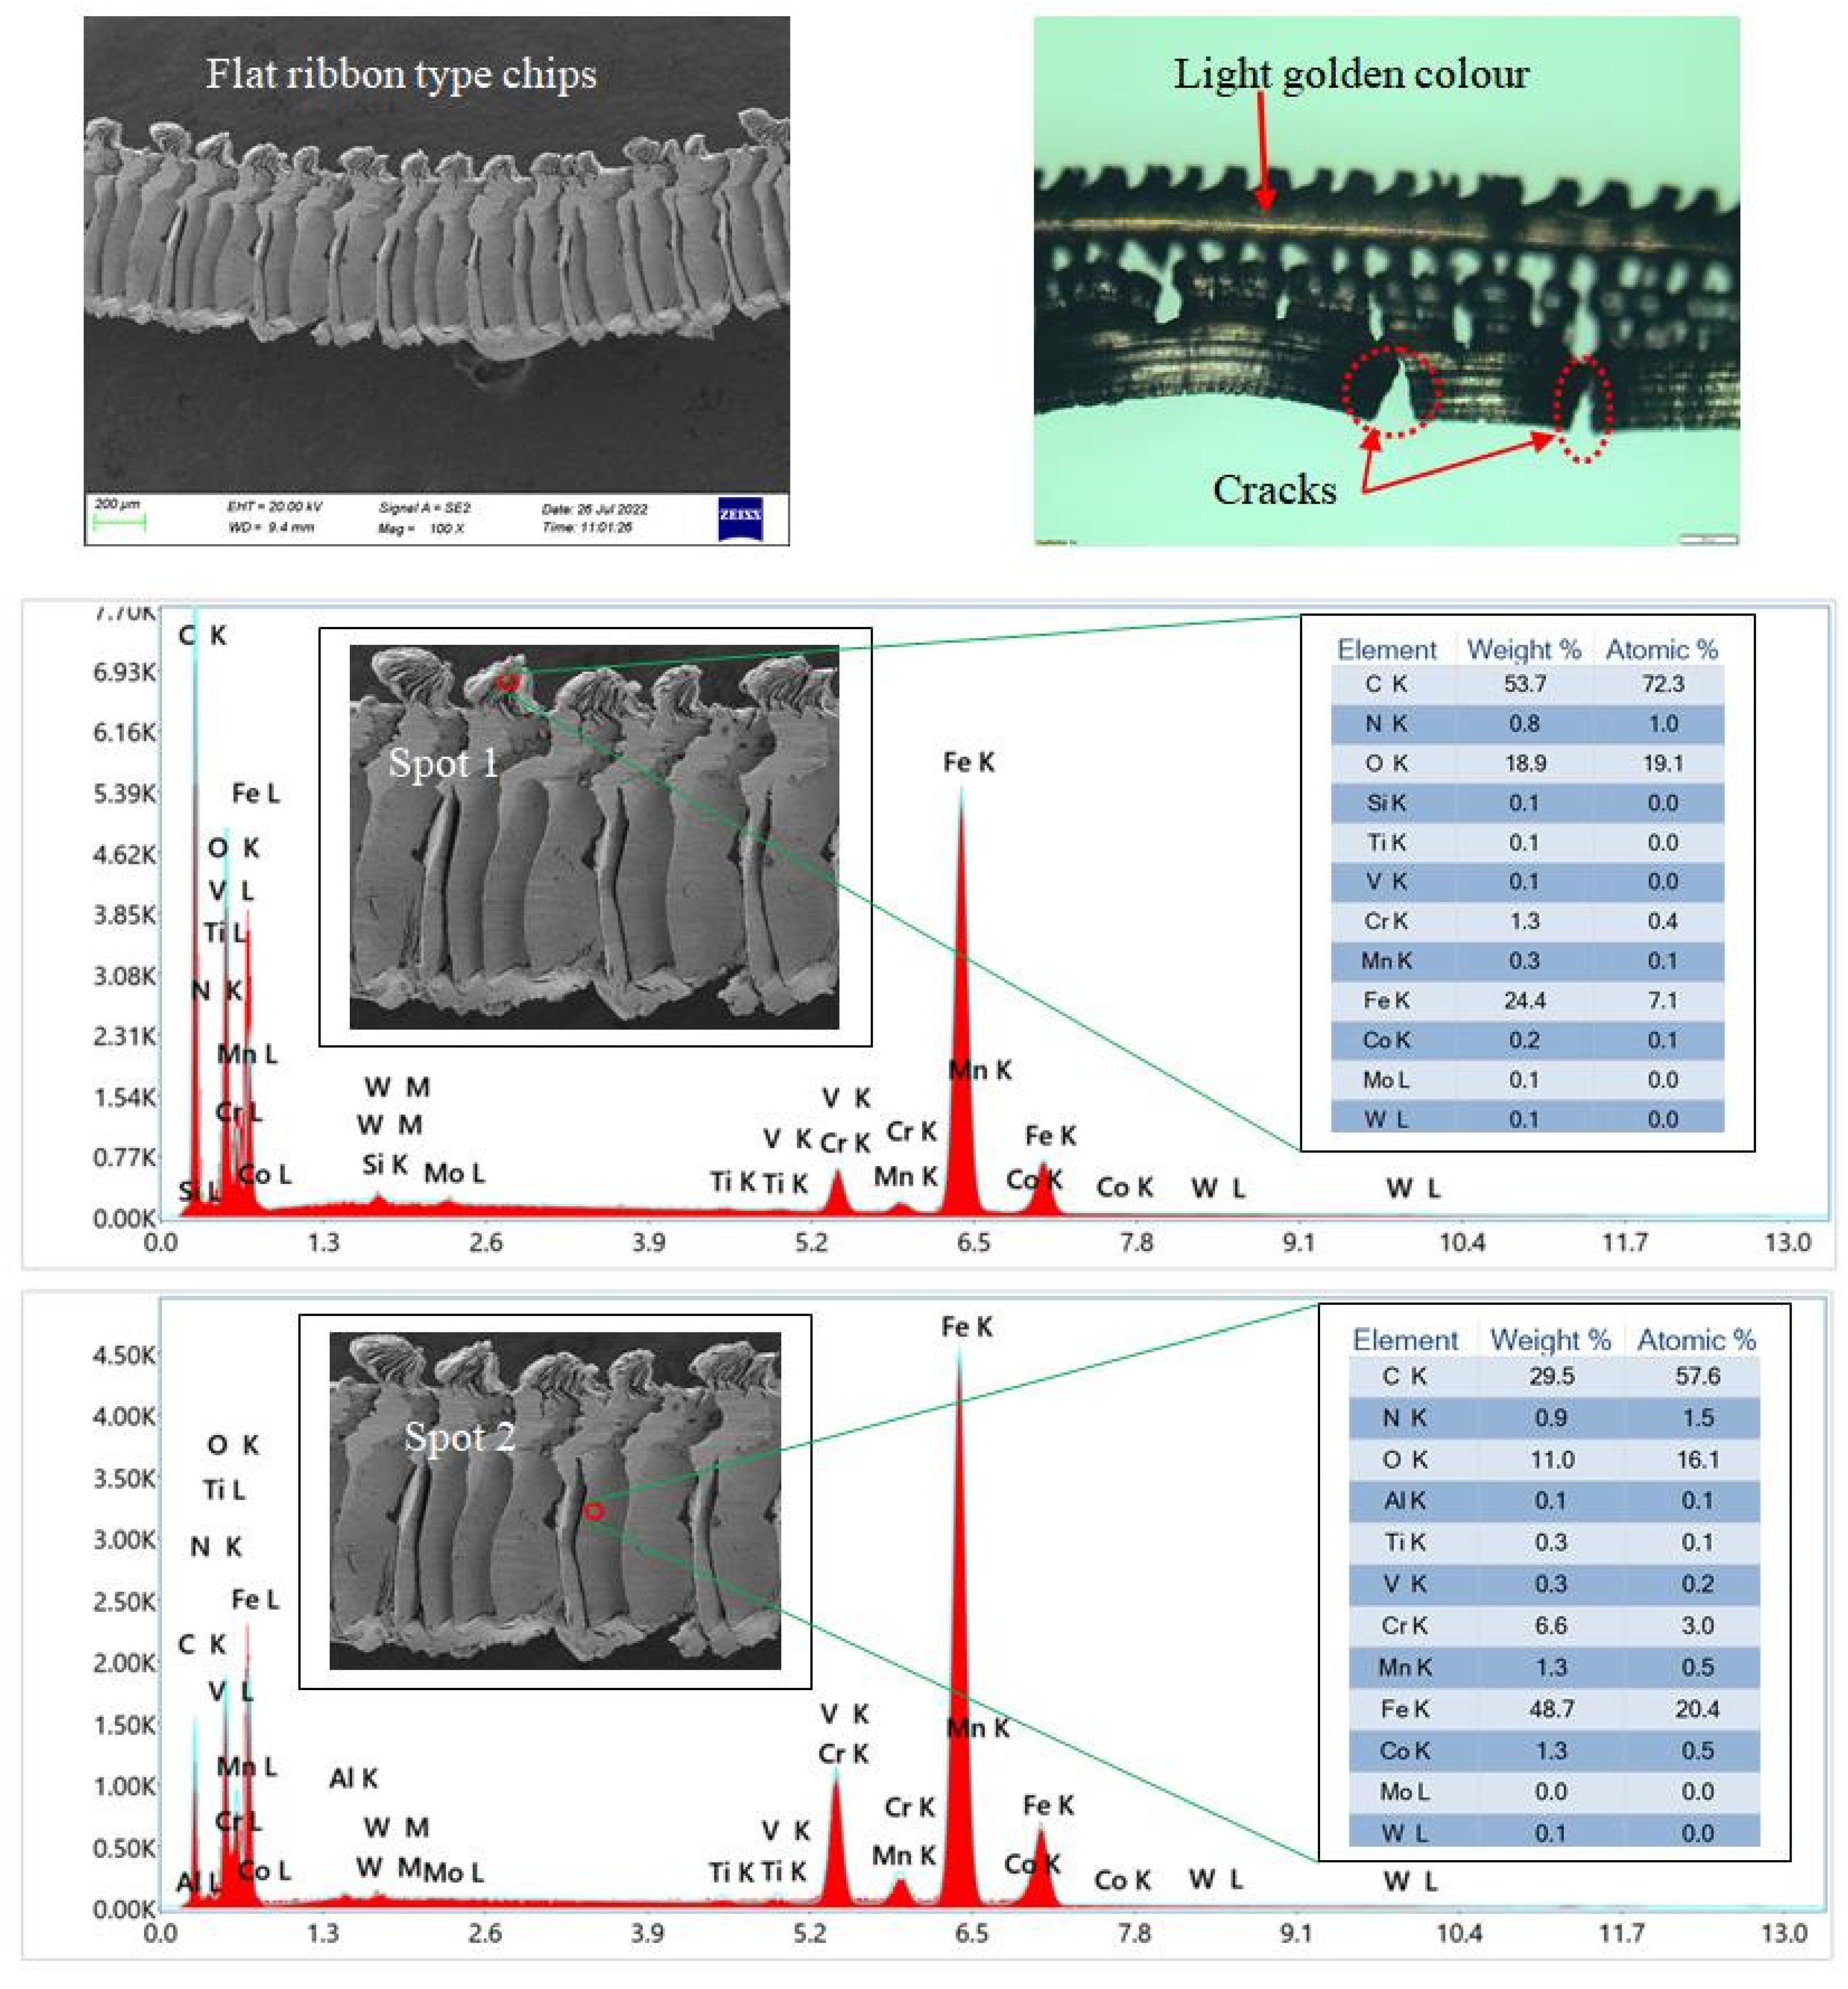
3.6. Assessment of Chip Morphology

Chip morphology is an important parameter that affects the machinability behavior of the test material. It demonstrates the nature of the tool–workpiece interaction in machining and the material’s mechanical behavior, as it correlates with the material output in cutting and its permanence. Saw-tooth chips were observed in each trial of hard-turning tests. In the cutting process, at higher cutting speeds, shear unsteadiness induced thermal softening versus strain hardening, whereas adiabatic behavior was observed at lower speeds, resulting in the formation of shear localized chips [75]. Furthermore, the saw tooth profile on the chip edge was formed due to lower ductility work material, which reduced the required cutting forces, despite the increased strength of hardened steel [76]. The chip’s shape was either continuous helical (with small and large curl radius), discontinuous helical (with small and large curl radius), curly Ribbon, flat ribbon, or broken spiral (c type). Similarly, the obtained chips were either metallic, light blue, deep blue, or lightly golden in color.
The continuous helical with small curl radius chips were obtained at the lowest depth of cut with the lowest feed conditions (Runs 1–2). The color of these chips was metallic, as displayed in Figure 15. At Run 3, as the cutting speed was highest (250 m/min), hence ribbon type deep blue colored chips were produced. Similarly, at moderate feed with the lowest depth of cut (Runs 4–5), short helical chips with a small curl radius were introduced. The color of these chips was metallic. In run 6, spiral c-type chips, deep blue in color were obtained, due to machining at the highest speed and at moderate feed cutting conditions (Figure 16). In Runs 7 and 10, short helical chips with large curl radius and a metallic color were produced. In Runs 8, 11, and 12, the spiral c-type chips, metallic in color, were obtained. In Run 9 and Runs 13–16, the pattern of chips was spiral c-type with blue or dark blue color (at 250 m/min). The spiral c-type with light golden colored chips were obtained in Runs 17–18 and Runs 25–26. In Runs 19–20, long helical chips with high curl radius were obtained. The colour of these chips was metallic. In Runs 21–24, due to the highest depth of cut (0.35 mm), spiral c-type chips with a blue colour were produced. In the last test (Run 27), the shape of the chips was a flat ribbon with light golden colour, as seen in Figure 17. Overall, metallic colored chips were produced at smaller levels of cutting parameters due to the generation of lower temperatures, while blue or deep blue colored chips were generated at higher cutting speeds (250 m/min and 175 m/min), due to the generation of higher cutting temperatures. Chips of a golden colour with a broken spiral c shape were generated due to more feed and higher cutting speed conditions. The continuous helical chips and curly ribbon chips were not recommended, as such types of chips rub the finished surface causing surface roughness [77]. The broken spiral c-type chip was more advantageous, as such types of chips were simply eliminated from the cutting zone and prevented any surface scratching in machining [78].
Additionally, from the EDS test (Figure 15) of the helical type chip, the presence of tool coating materials (C, Al, and O) on the chip (Spot 1 and Spot 2) were evidenced, as shown in Figure. This could be due to diffusion of these tool-coating elements into the chip [79]. The presence of ‘O’ might be possible due to the oxidizing layer formed in machining. The higher weight %s of ‘Fe’ and ‘C’ were due to these being major elements in D2 steel. Similarly, from the EDS test (Figure 16) of a broken spiral c-type chip, the element of tool substrate element ‘W’ and tool coating element ‘O’ were seen on the tool (Spot 1) due to the diffusion of these elements onto the chip. At spot 2 of the same chip, there were many elements of the cutting tool (C, W, N, O, and Ti) seen, possibly due to the diffusion of tool elements with the generation of higher temperatures at the largest cutting speed and highest feed cutting conditions. Similarly, an EDS test was also carried out for the flat-type ribbon chips (Figure 17). The results confirmed the presence of tool materials (C, W, Ti, N, O, and Co) on the chip due to diffusion of these elements as a result of high cutting stress and temperature. As anticipated, ‘C’ and ‘Fe’ held greater % weights in comparison to tool materials.

4. Conclusions

The current research investigated the hard turning performance of heat-treated AISI D2 steel (57 ± 1 HRC) under a novel dual nozzle MQL environment. The performances of the hard turning process were studied by using many important machinability factors, like surface roughness, tool flank wear, cutting temperature, power consumption, noise emission, and chip morphology. The following inferences were made in light of the experimental findings:
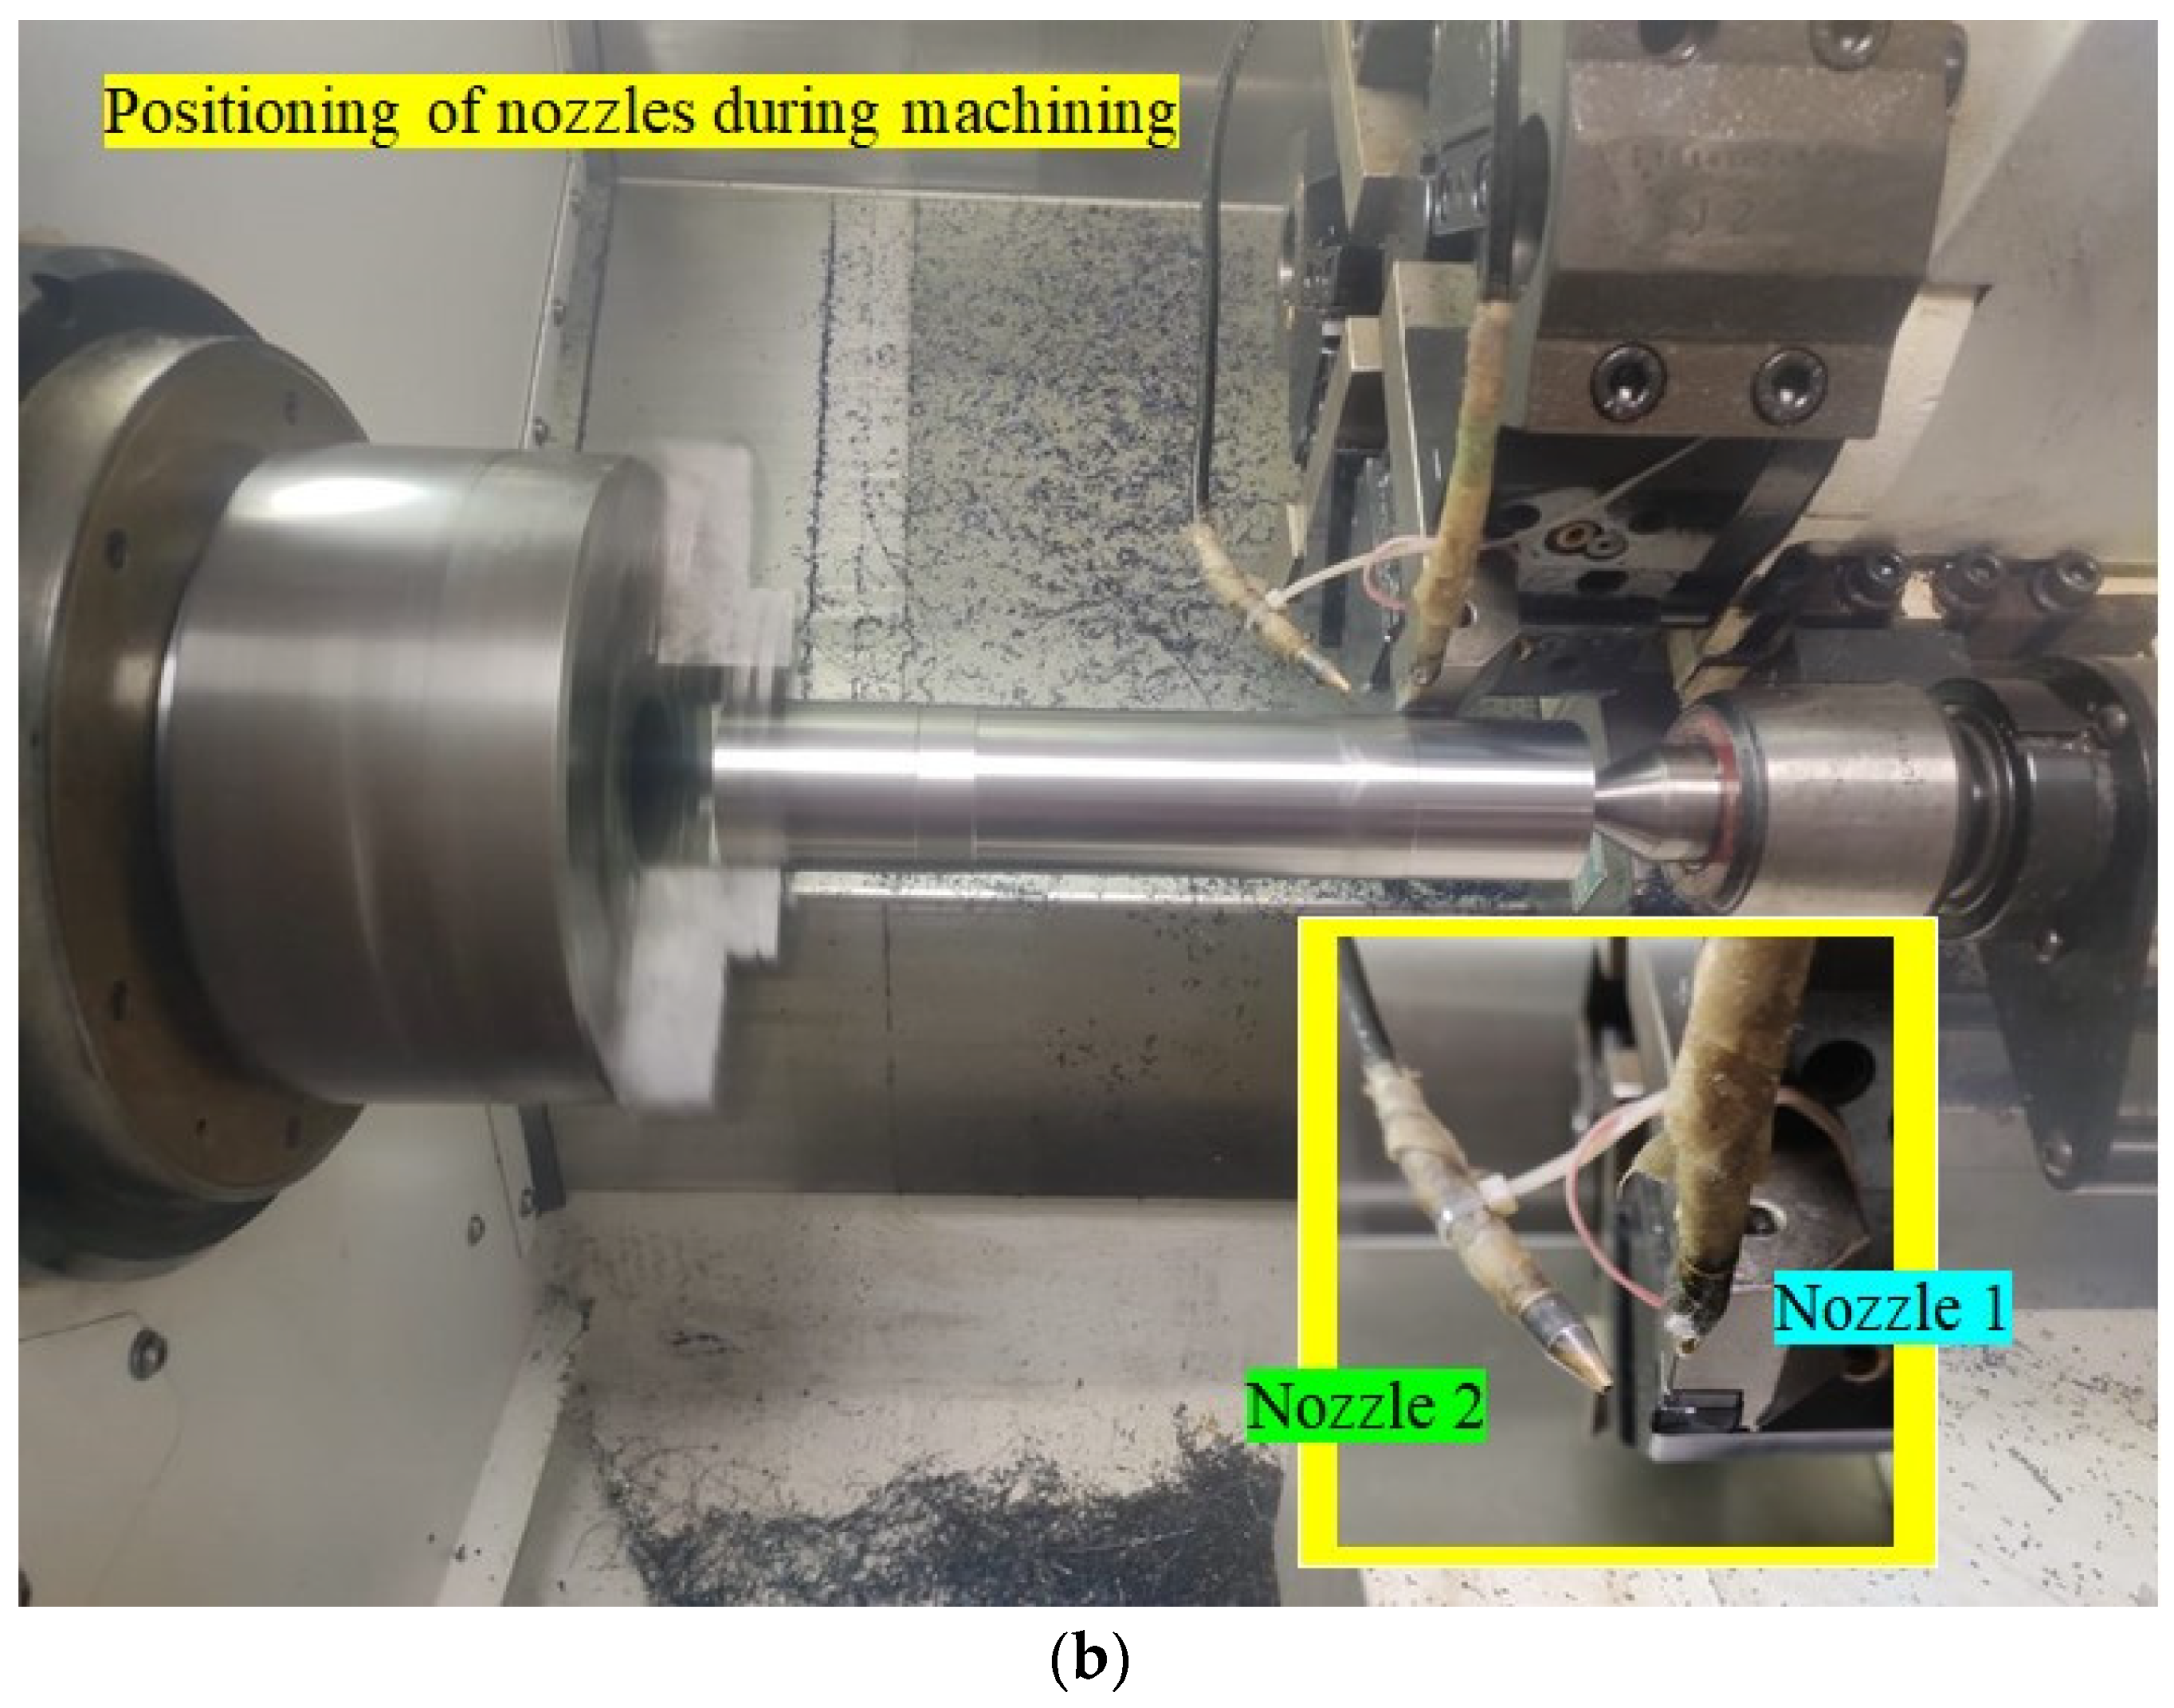
  • The dual nozzle MQL discharged an adequate amount of cutting fluid in the cutting region, thus significantly reducing the friction between the pairs of tool–workpiece and tool–chip interfaces, resulting in reduced cutting temperature, tool wear, and surface roughness.
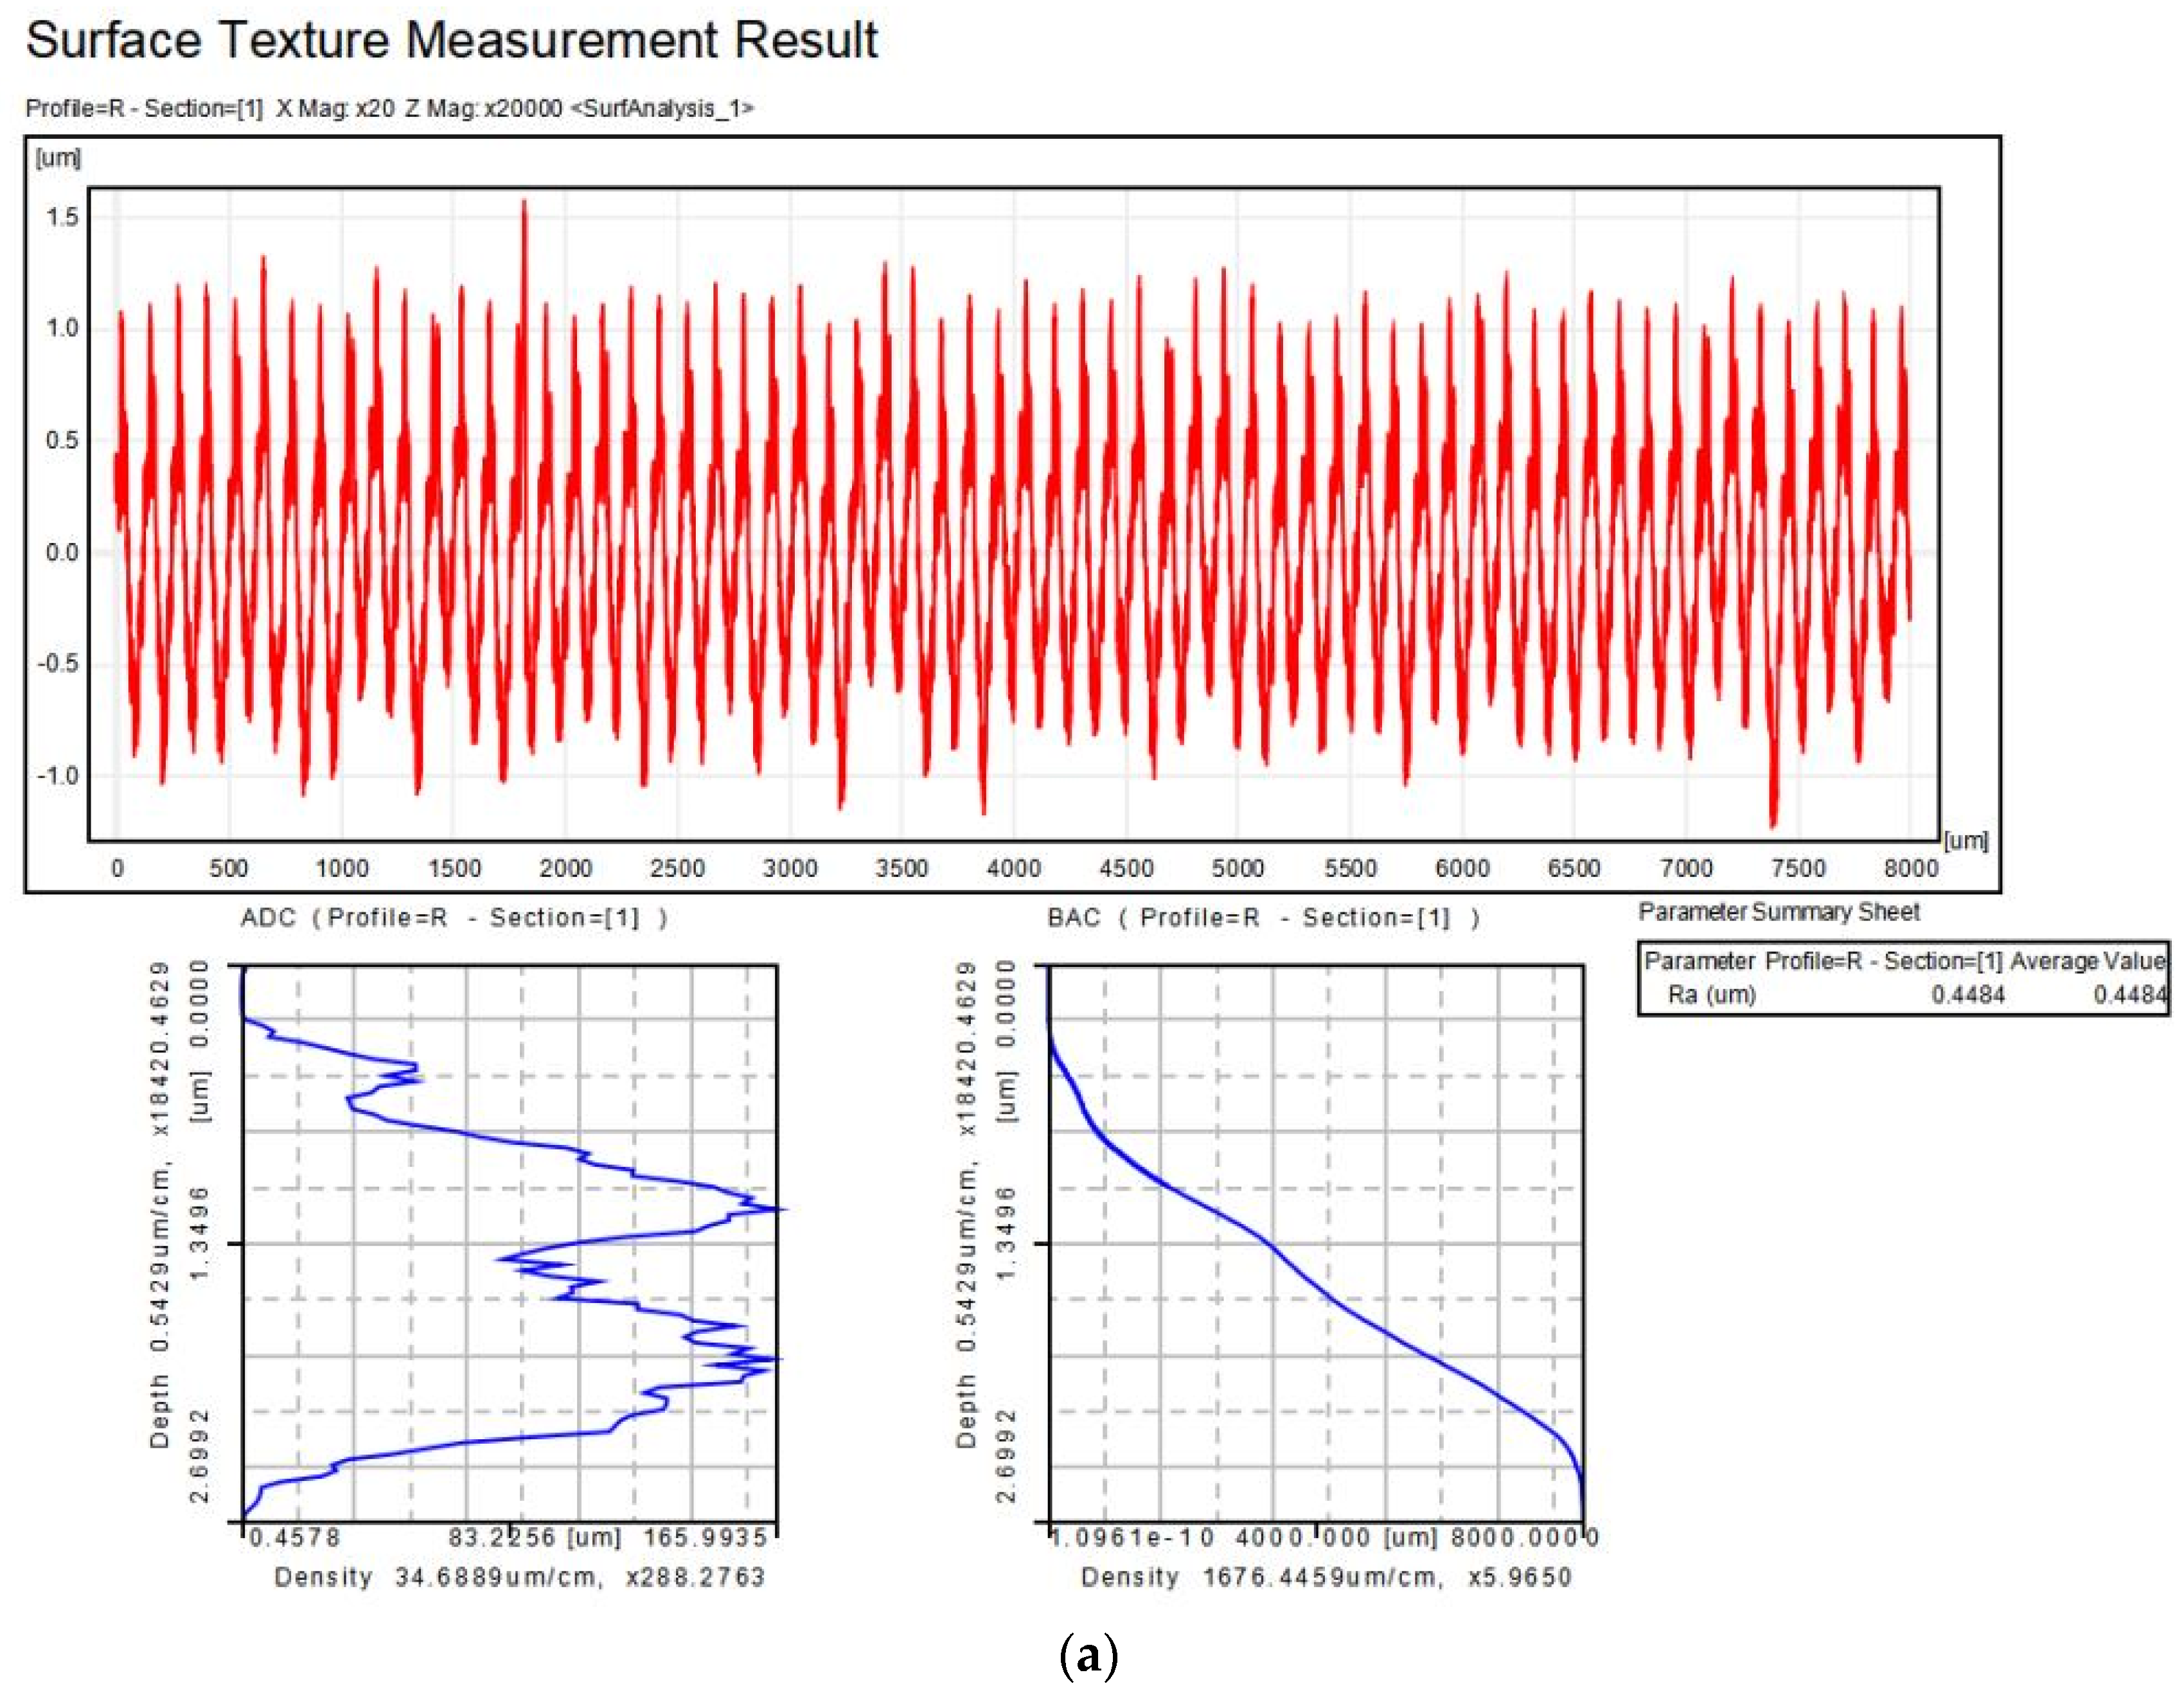
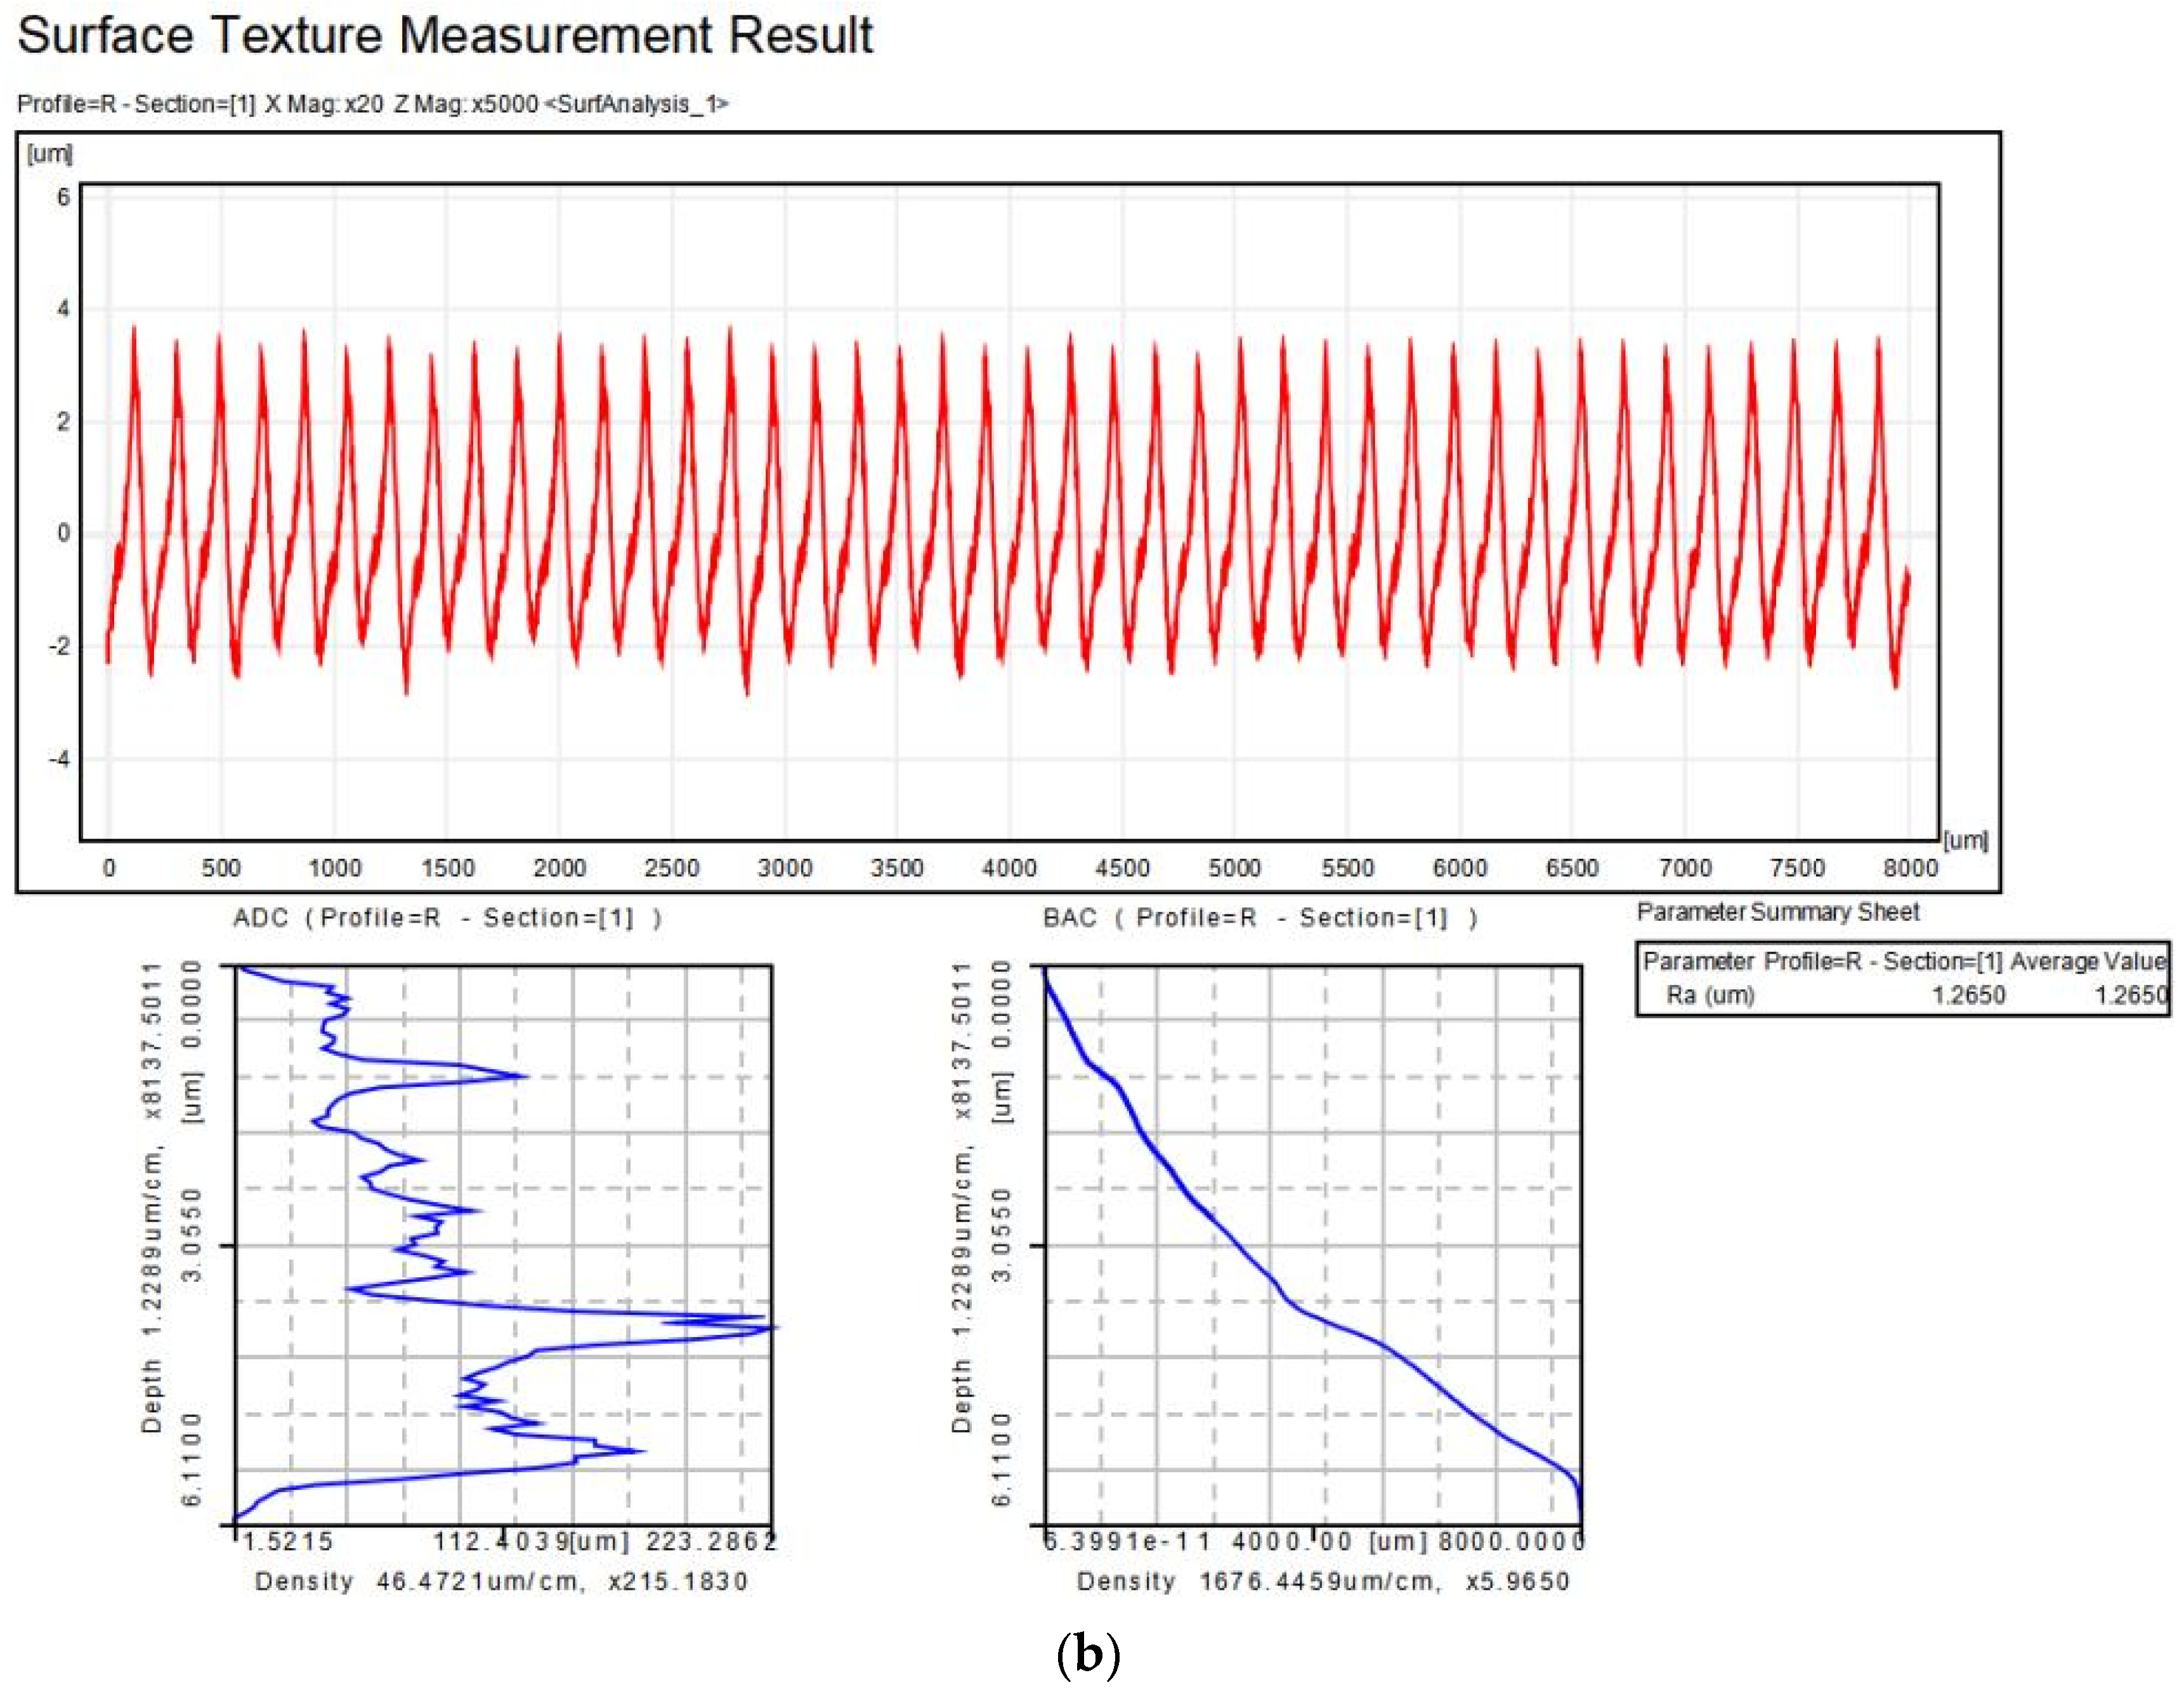
  • The obtained surface roughness in the entire 27 runs ranged from 0.448 to 1.265 µm and was heavily influenced by tool feed (66.70%), followed by the depth of cut (14.30%) and cutting speed (14.18%).
  • The lowest and highest flank wear values were 0.041 mm and 0.112 mm, respectively, which were extremely beneficial for hard turning concerns. Abrasion, adhesion, and chipping were the main wear mechanisms found. The tool edge was broken when machining was executed at the highest depth of cut (0.35 mm) with the largest cutting speed (250 m/min) and feed (0.35 mm/rev), due to a severe load on the tool edge. The greatest influence on tool flank wear was exerted by cutting speed (74.58%), followed by the depth of cut (12.40%) and feed (6.95%).
  • In the MQL cooling process, mist coolant impinged with higher frequency, resulting in an improvement in Nusselt number, and, thus, a significant reduction in cutting temperature (40.6 to 117 °C). The cutting temperature was largely impacted by cutting speed (75.84%), followed by the depth of cut (17.18%), tool feed (3.12%), and the interaction of depth of cut––feed (2.44%).
  • The power consumption was found to be lower in a range of 0.424 to 1.214 kW, due to the easy shearing of metal by delivering the mist lubricant into the shearing zone through a double nozzle. The depth of cut had the largest influence (46.69%) on power consumption, followed by cutting speed (40.76%) and feed (9.70%).
  • The noise emission in machining was found to be in the range of 68.54–82.7 dB, which was lower than the human hearing limit (85 dB). All of the input terms in the L27 design were acceptable for providing controlled noise emission during the hard turning process. The depth of cut had the greatest influence on noise emission (57.57%), followed by cutting speed (34.52%), feed (3.66%), and interaction depth of cut–feed (2.12%).
  • The chip’s shapes were discovered to be either helical (long and short), curly ribbon, flat ribbon, or broken spiral (c type), and their colors to be metallic, light blue, deep blue, or lightly golden.
Overall, the use of dual nozzle MQL was advantageous in improving the machinability of AISI D2 steel in hard turning. Spring oil was also discovered to be an effective lubricant for lessening friction between tool–work and tool–chip interfaces in hard turning. Therefore, it can be recommended for industrial applications involving difficult-to-cut metal machining. In the future, different types of nano-additives can be appended to spring oil and the machinability behavior of AISI D2 steel studied. Cutting force, tool life, tool vibration, and residual stress could all be studied in the future under a dual nozzle MQL environment. Future research could also look into machined surface hardness assessment in hard turning under a dual nozzle MQL environment.

Author Contributions

Introduction, R.M. and A.P.; Materials and Methods, R.M. and R.K.; Results and Discussions, R.K.; Software, A.P.; Writing-review and editing, A.K.S. and R.K.; Supervision, A.K.S. All authors have read and agreed to the published version of the manuscript.

Funding

This research received no external funding. The APC was adjusted with the reviewer’s coupons available to the authors.

Institutional Review Board Statement

Not applicable.

Informed Consent Statement

Not applicable

Data Availability Statement

Not applicable.

Acknowledgments

The authors acknowledge CRF, KIIT Deemed to be University, Bhubaneswar for providing the research facilities to complete this work.

Conflicts of Interest

The authors declare no conflict of interest.

References

  1. Musavi, S.H.; Davoodi, B.; Niknam, S.A. Environmental-friendly turning of A286 superalloy. J. Manuf. Process. 2018, 32, 734–743. [Google Scholar] [CrossRef]
  2. Felho, C.; Varga, G. Theoretical Roughness Modeling of Hard Turned Surfaces Considering Tool Wear. Machines 2022, 10, 188. [Google Scholar] [CrossRef]
  3. Das, A.; Kamal, M.; Das, S.R.; Patel, S.K.; Panda, A.; Rafighi, M.; Biswal, B.B. Comparative Assessment Between Al-TiN and AlTiSiN Coated Carbide Tools Towards Machinability Improvement of AISI D6 Steel in Dry Hard Turning. Proc. Inst. Mech. Eng. Part C 2022, 236, 3174–3197. [Google Scholar] [CrossRef]
  4. Parsi, P.K.; Kotha, R.S.; Routhu, T.; Pandey, S.; Dwivedy, M. Machinability Evaluation of Coated Carbide In-serts in Turning of Super-Duplex Stainless Steel. S. N. Appl. Sci. 2020, 2, 1933. [Google Scholar] [CrossRef]
  5. Ambhore, N.; Kamble, D.; Chinchanikar, S. Machining Performances of TiN+AlCrN Coated WC and Al2O3+TiC Inserts for Turning of AISI 4140 steel Under Dry Condition. J. Manuf. Process. 2020, 50, 412–420. [Google Scholar]
  6. Asiltürk, I.; Akkuş, H. Determining the effect of cutting parameters on surface roughness in hard turning using the Taguchi method. Measurement 2011, 44, 1697–1704. [Google Scholar] [CrossRef]
  7. Zheng, G.; Li, L.; Li, Z.; Gao, J.; Niu, Z. Wear mechanisms of coated tools in high-speed hard turning of high strength steel. Int. J. Adv. Manuf. Technol. 2017, 94, 4553–4563. [Google Scholar] [CrossRef]
  8. Sharma, N.; Gupta, K. Influence of coated and uncoated carbide tools on tool wear and surface quality during dry machining of stainless steel 304. Mater. Res. Express 2019, 6, 086585. [Google Scholar] [CrossRef]
  9. Ullas, H.B. Experimental Determination of Cutting Forces and Surface Roughness when Turning 50CrV4 Steel (SAE 6150) and Modelling with the Artificial Neural Network Approach. Transact. Ind. Inst. Met. 2014, 67, 869–879. [Google Scholar] [CrossRef]
  10. Kaladhar, M. Parametric optimization and modeling for flank wear of TiSiN-TiAlNnanolaminate cutting insert. J. Mech. Eng. 2020, 17, 69–84. [Google Scholar] [CrossRef]
  11. Nitin, A.; Dinesh, K.; Satish, C. Evaluation of cutting tool vibration and surface roughness in hard turning of AISI 52100 steel: An experimental and ANN approach. J. Vibration Eng. Technol. 2020, 8, 455–462. [Google Scholar]
  12. Dash, L.; Padhan, S.; Das, A.; Das, S.R. Machinability investigation and sustainability assessment in hard turning of AISI D3 steel with coated carbide tool under nanofluid minimum quantity lubrication-cooling condition. Proc. Inst. Mech. Eng. Part C J. Mech. Eng. Sci. 2021, 235, 6496–6528. [Google Scholar] [CrossRef]
  13. Abidin, S.; Mohammad, R. Optimization of cutting parameters with respect to roughness for machining of hardened AISI 1040 steel. Mater. Test. 2020, 62, 85–95. [Google Scholar]
  14. Suresh, R.; Basavarajappa, S.; Samuel, G. Some studies on hard turning of AISI 4340 steel using multilayer coated carbide tool. Measurement 2012, 45, 1872–1884. [Google Scholar] [CrossRef]
  15. Basavarajappa, S.; Suresh, R.; Gaitonde, V.; Samuel, G. Analysis of cutting forces and surface roughness in hard turning of AISI 4340 using multilayer coated carbide tool. Int. J. Mach. Mach. Mater. 2014, 16, 169. [Google Scholar] [CrossRef]
  16. Suresh, R.; Basavarajappa, S.; Gaitonde, V.; Samuel, G. Machinability investigations on hardened AISI 4340 steel using coated carbide insert. Int. J. Refract. Met. Hard Mater. 2012, 33, 75–86. [Google Scholar] [CrossRef]
  17. Ginting, A.; Skein, R.; Cuaca, D.; Masyithah, Z. The characteristics of CVD- and PVD-coated carbide tools in hard turning of AISI 4340. Measurement 2018, 129, 548–557. [Google Scholar] [CrossRef]
  18. Szczotkarz, N.; Maruda, R.W.; Dębowski, D.; Leksycki, K.; Wojciechowski, S.; Khanna, N.; Królczyk, G.M. Formation of Surface Topography During Turning of AISI 1045 Steel Considering the Type of Cutting Edge Coat-ing. Adv. Sci. Technol. Res. J. 2021, 15, 253–266. [Google Scholar] [CrossRef]
  19. Thakur, A.; Gangopadhyay, S. Evaluation of micro-features of chips of Inconel 825 during dry turning with un-coated and chemical vapour deposition multilayer coated tools. Proceed. Inst. Mech. Eng. Part B J. Eng. Manuf. 2016, 232, 979–994. [Google Scholar] [CrossRef]
  20. Sahoo, A.K.; Sahoo, B. Performance studies of multilayer hard surface coatings (TiN/TiCN/Al2O3/TiN) of indexable carbide inserts in hard machining: Part-II (RSM, grey relational and techno economical approach). Measurement 2013, 46, 2868–2884. [Google Scholar] [CrossRef]
  21. Tuan, N.M.; Duc, T.M.; Long, T.T.; Hoang, V.L.; Ngoc, T.B. Investigation of Machining Performance of MQL and MQCL Hard Turning Using Nano Cutting Fluids. Fluids 2022, 7, 143. [Google Scholar] [CrossRef]
  22. Craig, M.; Raval, J.; Tai, B.; Patterson, A.; Hung, W. Effect of Channel Roughness on Micro-Droplet Distribution in Internal Minimum Quantity Lubrication. Dynamics 2022, 2, 19. [Google Scholar] [CrossRef]
  23. Paul, I.D.; Bhole, G.P.; Chaudhari, J.R. A Review on Green Manufacturing: It’s Important, Methodology and Its Application. Procedia Mater. Sci. 2014, 6, 1644–1649. [Google Scholar] [CrossRef]
  24. Debnath, S.; Reddy, M.; Yi, Q. Environmental friendly cutting fluids and cooling techniques in machining: A review. J. Clean. Prod. 2014, 83, 33–47. [Google Scholar] [CrossRef]
  25. Leppert, T. Surface layer properties of AISI 316L steel when turning under dry and with minimum quantity lubri-cation conditions. Proc. Inst. Mech. Eng. B. J. Eng. Manuf. 2012, 226, 617–631. [Google Scholar] [CrossRef]
  26. Zhang, S.; Li, J.F.; Wang, Y.W. Tool life and cutting forces in end milling Inconel 718 under dry and minimum quantity cooling lubrication cutting conditions. J. Clean. Prod. 2012, 32, 81–87. [Google Scholar] [CrossRef]
  27. Bhowmick, S.; Alpas, A.T. The role of diamond-like carbon coated drills on minimum quantity lubrication drilling of magnesium alloys. Surf. Coat. Technol. 2011, 205, 5302–5311. [Google Scholar] [CrossRef]
  28. Sanchez, J.A.; Pombo, I.; Alberdi, R.; Izquierdo, B.; Ortega, N.; Plaza, S.; Martinez-Toledano, J. Machining evalua-tion of a hybrid MQL-CO2 grinding technology. J. Clean. Prod. 2010, 18, 1840–1849. [Google Scholar] [CrossRef]
  29. Boswell, B.; Islam, M.; Davies, I.; Ginting, Y.R.; Ong, A.K. A review identifying the effectiveness of minimum quantity lubrication (MQL) during conventional machining. Int. J. Adv. Manuf. Technol. 2017, 92, 321–340. [Google Scholar] [CrossRef] [Green Version]
  30. Arsene, B.; Gheorghe, C.; Sarbu, F.A.; Barbu, M.; Cioca, L.-I.; Calefariu, G. MQL-Assisted Hard Turning of AISI D2 Steel with Corn Oil: Analysis of Surface Roughness, Tool Wear, and Manufacturing Costs. Metals 2021, 11, 2058. [Google Scholar] [CrossRef]
  31. Chavan, A.A.; Sargade, V.G. Statistical and Multi-attribute Analysis in Hardened Steel Turning Under Vegetable Oil-Based MQL. In Techno-Societal 2020; Springer: New York, NY, USA, 2021; pp. 777–789. [Google Scholar] [CrossRef]
  32. Das, A.; Patel, S.; Biswal, B.; Sahoo, N.; Pradhan, A. Performance evaluation of various cutting fluids using MQL technique in hard turning of AISI 4340 alloy steel. Measurement 2020, 150, 107079. [Google Scholar] [CrossRef]
  33. Mawandiya, B.K.; Patel, H.V.; Makhesana, M.A.; Patel, K.M. Machinability investigation of AISI 4340 steel with biodegradable oil-based MQL system. Mater. Today Proc. 2021, 59, 1–6. [Google Scholar] [CrossRef]
  34. Sani, A.S.A.; Abd Rahim, E.; Sharif, S.; Sasahara, H. Machining performance of vegetable oil with phosphoni-um-and ammonium-based ionic liquids via MQL technique. J. Clean. Prod. 2019, 209, 947–964. [Google Scholar] [CrossRef]
  35. Gupta, M.K.; Boy, M.; Korkmaz, M.E.; Yaşar, N.; Günay, M.; Krolczyk, G.M. Measurement and analysis of ma-chining induced tribological characteristics in dual jet minimum quantity lubrication assisted turning of duplex stainless steel. Measurement 2022, 187, 110353. [Google Scholar] [CrossRef]
  36. Singh, G.; Pruncu, C.I.; Gupta, M.K.; Mia, M.; Khan, A.M.; Jamil, M.; Pimenov, D.Y.; Sen, B.; Sharma, V.S. Investi-gations of machining characteristics in the upgraded MQL-assisted turning of pure titanium alloys using evolu-tionary algorithms. Materials 2019, 12, 999. [Google Scholar] [CrossRef] [PubMed] [Green Version]
  37. Mia, M.; Dhar, N.R. Effects of duplex jets high-pressure coolant on machining temperature and machinability of Ti-6Al-4V superalloy. J. Mater. Process. Technol. 2018, 252, 688–696. [Google Scholar] [CrossRef]
  38. Mia, M.; Dhar, N.R. Influence of single and dual cryogenic jets on machinability characteristics in turning of Ti-6Al-4V. Proc. Inst. Mech. Eng. Part B J. Eng. Manuf. 2019, 233, 711–726. [Google Scholar] [CrossRef]
  39. Sohrabpoor, H.; Khanghah, S.P.; Teimouri, R. Investigation of lubricant condition and machining parameters while turning of AISI 4340. Int. J. Adv. Manuf. Technol. 2015, 76, 2099–2116. [Google Scholar] [CrossRef]
  40. Kaynak, Y.; Karaca, H.E.; Noebe, R.D.; Jawahir, I.S. Tool-wear analysis in cryogenic machining of NiTi shape memory alloys: A comparison of tool-wear performance with dry and MQL machining. Wear 2013, 306, 51–63. [Google Scholar] [CrossRef]
  41. Gajrani, K.K. Assessment of cryo-MQL environment for machining of Ti-6Al-4V. J. Manuf. Process. 2020, 60, 494–502. [Google Scholar] [CrossRef]
  42. Zhu, Z.; He, B.; Chen, J. RETRACTED: Evaluation of tool temperature distribution in MQL drilling of aluminum 2024-T351. J. Manuf. Process. 2020, 56, 757–765. [Google Scholar] [CrossRef]
  43. Bonfá, M.M.; Costa, S.; Sales, W.F.; Amorim, F.L.; Maia, L.H.A.; Machado, A.R. Evaluation of tool life and workpiece surface roughness in turning of AISI D6 hardened steel using PCBN tools and minimum quantity of lubricant (MQL) applied at different directions. Int. J. Adv. Manuf. Technol. 2019, 103, 971–984. [Google Scholar] [CrossRef]
  44. Touggui, Y.; Uysal, A.; Emiroglu, U.; Belhadi, S.; Temmar, M. Evaluation of MQL performances using various nanofluids in turning of AISI 304 stainless steel. Int. J. Adv. Manuf. Technol. 2021, 115, 3983–3997. [Google Scholar] [CrossRef]
  45. Özbek, O.; Saruhan, H. The effect of vibration and cutting zone temperature on surface roughness and tool wear in eco-friendly MQL turning of AISI D2. J. Mater. Res. Technol. 2020, 9, 2762–2772. [Google Scholar] [CrossRef]
  46. Özbek, N.A.; Özbek, O.; Kara, F.; Saruhan, H. Effect of Eco-Friendly Minimum Quantity Lubrication in Hard Machining of Vanadis 10: A High Strength Steel. Steel Res. Int. 2022, 93, 2100587. [Google Scholar] [CrossRef]
  47. Gürbüz, H.; Gönülaçar, Y.E. Experimental and statistical investigation of the effects of MQL, dry and wet ma-chining on machinability and sustainability in turning of AISI 4140 steel. Proc. Inst. Mech. Eng. Part E J. Proc. Mech. Eng. 2022, 236, 09544089221076243. [Google Scholar]
  48. Shihab, S.K.; Khan, Z.A.; Mohammad, A.; Siddiquee, A.N. A review of turning of hard steels used in bearing and automotive applications. Prod. Manuf. Res. 2014, 2, 24–49. [Google Scholar] [CrossRef] [Green Version]
  49. Xu, Q.; Liu, J.; Cai, G.; Jiang, D.; Zhou, J. A Fuzzy Evaluation of Tool Materials in the Turning of Marine Steels. Metals 2021, 11, 1710. [Google Scholar] [CrossRef]
  50. Kumar, P.; Chauhan, S.R.; Pruncu, C.I.; Gupta, M.K.; Pimenov, D.Y.; Mia, M.; Gill, H.S. Influence of Different Grades of CBN Inserts on Cutting Force and Surface Roughness of AISI H13 Die Tool Steel during Hard Turning Operation. Materials 2019, 12, 177. [Google Scholar] [CrossRef] [Green Version]
  51. Yan, L.; Yuan, S.; Liu, Q. Influence of minimum quantity lubrication parameters on tool wear and surface roughness in milling of forged steel. Chin. J. Mech. Eng. 2012, 25, 419–429. [Google Scholar] [CrossRef]
  52. Kumar, A.; Singh, G.; Aggarwal, V. Analysis and optimization of nozzle distance during turning of EN 31 steel using minimum quantity lubrication. Mater. Today Proc. 2022, 49, 1360–1366. [Google Scholar] [CrossRef]
  53. Usca, Ü.A.; Uzun, M.; Kuntoğlu, M.; Sap, E.; Gupta, M.K. Investigations on tool wear, surface roughness, cutting temperature, and chip formation in machining of Cu-B-CrC composites. Int. J. Adv. Manuf. Technol. 2021, 116, 3011–3025. [Google Scholar] [CrossRef]
  54. DAS, S.R.; Panda, A.; Dhupal, D. Experimental investigation of surface roughness, flank wear, chip morphology and cost estimation during machining of hardened AISI 4340 steel with coated carbide insert. Mech. Adv. Mater. Mod. Process. 2017, 3, 9. [Google Scholar] [CrossRef]
  55. Rajan, K.M.; Sahoo, A.K.; Routara, B.C.; Kumar, R. Investigation on surface roughness, tool wear and cutting power in MQL turning of bio-medical Ti-6Al-4V ELI alloy with sustainability. Proc. Inst. Mech. Eng. Part E J. Process. Mech. Eng. 2022, 236, 1452–1466. [Google Scholar] [CrossRef]
  56. Kulshreshtha, M. Analysis of the Effect of Machining Parameters on Surface Roughness of EN 36 Nickel Steel. Int. J. Adv. Inf. Sci. Technol. 2013, 16, 1–7. [Google Scholar]
  57. Smith, G.T. Industrial Metrology; Springer: New York, NY, USA, 2002. [Google Scholar]
  58. Zhu, S.; Huang, P. Influence mechanism of morphological parameters on tribological behaviors based on bearing ratio curve. Tribol. Int. 2017, 109, 10–18. [Google Scholar] [CrossRef]
  59. Cîrstoiu, A.C. Surface roughness evaluation in turning based on abbott firestone curve. Roma Rev. Precis. Mech. Opt. Mech. 2010, 20, 163–169. [Google Scholar]
  60. Luo, X.; Cheng, K.; Holt, R.; Liu, X. Modeling flank wear of carbide tool insert in metal cutting. Wear 2005, 259, 1235–1240. [Google Scholar] [CrossRef] [Green Version]
  61. Pandey, K.; Datta, S. Performance of Si-doped TiAlxN supernitride coated carbide tool during dry machining of Inconel 718 superalloy. J. Manuf. Process. 2022, 84, 1258–1273. [Google Scholar] [CrossRef]
  62. Chinchanikar, S.; Choudhury, S.K. Machining of hardened steel—Experimental investigations, performance modeling and cooling techniques: A review. Int. J. Mach. Tool. Manuf. 2015, 89, 95–109. [Google Scholar] [CrossRef]
  63. Zaman, P.B.; Dhar, N.R. Design and evaluation of an embedded double jet nozzle for MQL delivery intending machinability improvement in turning operation. J. Manuf. Process. 2019, 44, 179–196. [Google Scholar] [CrossRef]
  64. Mia, M.; Razi, M.H.; Ahmad, I.; Mostafa, R.; Rahman, S.M.; Ahmed, D.H.; Dhar, N.R. Effect of time-controlled MQL pulsing on surface roughness in hard turning by statistical analysis and artifificial neural network. Int. J. Adv. Manuf. Technol. 2017, 91, 3211–3223. [Google Scholar] [CrossRef]
  65. Yang, K.Z.; Pramanik, A.; Basak, A.K.; Dong, Y.; Prakash, C.; Shankar, S.; Vatin, N.I. Application of coolants during tool-based machining–A review. Ain Shams Eng. J. 2022, 1018, 30. [Google Scholar]
  66. Bilga, P.S.; Singh, S.; Kumar, R. Optimization of energy consumption response parameters for turning operation using Taguchi method. J. Clean. Prod. 2016, 137, 1406–1417. [Google Scholar] [CrossRef]
  67. Nur, R.; Noordin, M.Y.; Izman, S.; Kurniawan, D. The Effect of Cutting Parameters on Power Consumption during Turning Nickel Based Alloy. Adv. Mater. Res. 2013, 845, 799–802. [Google Scholar] [CrossRef]
  68. Abbas, A.T.; Gupta, M.K.; Soliman, M.S.; Mia, M.; Hegab, H.; Luqman, M.; Pimenov, D.Y. Sustainability assessment associated with surface roughness and power consumption characteristics in nanofluid MQL-assisted turning of AISI 1045 steel. Int. J. Adv. Manuf. Technol. 2019, 105, 1311–1327. [Google Scholar] [CrossRef]
  69. Valeraa, H.Y.; Bhavsara, S.N. Experimental Investigation of Surface Roughness and Power Consumption in Turning Operation of EN 31 Alloy Steel. Proced. Technol. 2014, 14, 528–534. [Google Scholar] [CrossRef]
  70. Sangwan, K.S.; Kant, G. Optimization of Machining Parameters for Improving Energy Efficiency using Integrated Response Surface Methodology and Genetic Algorithm Approach. Procedia CIRP 2017, 61, 517–522. [Google Scholar] [CrossRef]
  71. Şahinoğlu, A.; Rafighi, M. Investigation of Tool Wear, Surface Roughness, Sound Intensity and Power Consumption During Hard Turning of AISI 4140 using Multilayer-Coated Carbide Inserts. J. Eng. Res. 2021, 9, 377–395. [Google Scholar] [CrossRef]
  72. Rafighi, M. Effects of shallow cryogenic treatment on surface characteristics and machinability factors in hard turning of AISI 4140 steel. Proc. Inst. Mech. Eng. Part E J. Process. Mech. Eng. 2022, 236, 2118–2130. [Google Scholar] [CrossRef]
  73. Karaaslan, F.; Şahinoğlu, A. Determination of Ideal Cutting Conditions for Maximum Surface Quality and Mini-mum Power Consumption During Hard Turning of AISI 4140 Steel Using TOPSIS Method Based on Fuzzy Distance. Arab. J. Sci. Eng. 2020, 45, 9145–9157. [Google Scholar] [CrossRef]
  74. Şahinoğlu, A.; Ulas, E. An investigation of cutting parameters effect on sound level, surface roughness, and power consumption during machining of hardened AISI 4140. Mech. Ind. 2020, 21, 523. [Google Scholar] [CrossRef]
  75. Su, Y.; Li, Z.; Li, L.; Wang, J.; Gao, H.; Wang, G. Cutting performance of micro-textured polycrystalline diamond tool in dry cutting. J. Manuf. Process. 2017, 27, 1–7. [Google Scholar] [CrossRef]
  76. Dogra, M.; Sharma, V.S.; Sachdeva, A.; Suri, N.M.; Dureja, J.S. Tool wear, chip formation and work piece surface issues in CBN hard turning: A review. Int. J. Precis. Eng. Manuf. 2010, 11, 341–358. [Google Scholar]
  77. Ducobu, F.; Rivière-Lorphèvre, E.; Filippi, E. Materiał constitutive model and chip separation criterion influence on the modeling of Ti6A14V machining with experimental validation, in strictly orthogonal cutting condition. Int. J. Mech. Sci. 2016, 107, 136–149. [Google Scholar] [CrossRef]
  78. Maruda, R.W.; Krolczyk, G.M.; Niesłony, P.; Krolczyk, J.B.; Legutko, S. Chip Formation Zone Analysis During the Turning of Austenitic Stainless Steel 316L under MQCL Cooling Condition. Proc. Eng. 2016, 149, 297–304. [Google Scholar] [CrossRef] [Green Version]
  79. Leadebal, W.V., Jr.; Melo, A.C.A.D.; De Oliveira, A.J.; Castro, N.A. Tool wear and chip analysis after the hard turning of AISI D6 steel assisted by LN2. Mach. Sci. Technol. 2019, 23, 886–905. [Google Scholar] [CrossRef]
Figure 1. (a) Scheme of the experiments and measurements (b) Nozzle positions.
Lubricants 11 00016 g001aLubricants 11 00016 g001b
Figure 2. Assessment of surface roughness (Ra)using (a) Probability plot; (b) Main effects plot; (c–e) Surface plots; (f) Interaction plots.
Lubricants 11 00016 g002
Figure 3. The surface topology of the machined surface is obtained in (a) Run 1 (lowest cutting factors value) (b) Run 27 (highest cutting factors value).
Lubricants 11 00016 g003
Figure 4. Surface texture measurement of the finished surface obtained in (a) Run 1 (lowest cutting factors value) (b) Run 27 (highest cutting factors value).
Lubricants 11 00016 g004aLubricants 11 00016 g004b
Figure 5. Assessment of tool flank wear (VBc) using (a) Probability plot; (b) Main effects plot; (ce) Surface plots; (f) Interaction plots.
Lubricants 11 00016 g005aLubricants 11 00016 g005b
Figure 6. Tool flank wear images for 27 experiments.
Lubricants 11 00016 g006
Figure 7. EDS of the fresh tip of the tool.
Lubricants 11 00016 g007
Figure 8. SEM of tool wear obtained in (a) Run 1 (b) Run 27.
Lubricants 11 00016 g008
Figure 9. EDS test of worn tool (at different spots) obtained in Run1.
Lubricants 11 00016 g009
Figure 10. EDS test of worn tool (at different spots) obtained in Run 27.
Lubricants 11 00016 g010
Figure 11. Obtained thermal images in (a) Run 1 (b) Run 27.
Lubricants 11 00016 g011
Figure 12. Assessment of cutting temperature (T) using (a) Probability plot; (b) Main effects plot; (ce) Surface plots; (f) Interaction plots.
Lubricants 11 00016 g012
Figure 13. Assessment of power consumption (Pc) using (a) Probability plot; (b) Main effects plot; (ce) Surface plots; (f) Interaction plots.
Lubricants 11 00016 g013aLubricants 11 00016 g013b
Figure 14. Assessment of noise emission (Ne) using (a) Probability plot; (b) Main effects plot; (ce) Surface plots; (f) Interaction plots.
Lubricants 11 00016 g014aLubricants 11 00016 g014b
Figure 15. SEM and EDS of chip obtained in Run 1 (lowest value of cutting parameters).
Lubricants 11 00016 g015
Figure 16. SEM and EDS of chip obtained in Run 6.
Lubricants 11 00016 g016
Figure 17. SEM and EDS of chip obtained in Run 27 (Highest value of cutting parameters).
Lubricants 11 00016 g017
Table 1. Details of items required for hard turning tests.
ItemsDetails
Machine toolCNC lathe(DX 2004A)
Work sampleAISI D2 steel
Work specimen hardness57 ± 1 HRC
Work dimension45 mm diameter, length 200 mm
Machining length160 mm
Cutting toolCVD coated carbide(TiCN-Al2O3), KENNAMETAL
ISO geometry- CNMG120408FN, Grade- KCK05
Tool holderPCLNR2525M12
Design of Experiment (DOE)Taguchi L27 orthogonal array
Cutting speed (V), m/min100, 175, 250
Depth of cut(a), mm0.15, 0.25, 0.35
Feed(f), mm/rev0.06, 0.12, 0.18
Cutting environmentDual Nozzle MQL
Air Pressure—6 bar (Fixed)
Flow rate of each nozzle—50 mL/h (Fixed)
MQL lubricant Spring Oil (LRM 30)
Table 2. Experimental results.
RunTurning Parameters (Inputs)Performance Indexes (Outputs)
a
(mm)
f
(mm/rev)
V
(m/min)
Ra
(µm)
VBc
(mm)
T
(°C)
Pc
(kW)
Ne
(dB)
10.150.061000.5330.04162.40.42468.54
20.150.061750.5030.04979.50.64371.28
30.150.062500.4480.068100.60.95674.33
40.150.121000.5840.04552.40.68370.12
50.150.121750.5860.05371.00.86872.56
60.150.122500.5010.07597.00.98575.82
70.150.181001.0240.04756.80.62869.24
80.150.181750.9740.05570.40.74571.30
90.150.182500.8550.07895.50.89975.42
100.250.061000.6140.04348.80.46472.32
110.250.061750.5660.05467.40.66776.61
120.250.062500.5130.07393.60.71279.3
130.250.121000.7830.04740.60.52473.84
140.250.121750.6840.05958.40.71276.52
150.250.122500.5610.07883.70.83279.97
160.250.181001.0480.051500.56775.4
170.250.181750.9260.06261.10.76877.37
180.250.182500.8050.08179.10.89679.51
190.350.061000.8450.04665.80.75574.6
200.350.061750.7430.06179.50.93677.6
210.350.062500.6120.083107.11.06980.2
220.350.121000.8740.05158.50.93275.5
230.350.121750.7420.06673.41.03779.64
240.350.122500.6340.08998.21.21481.2
250.350.181001.2650.05773.40.90179.52
260.350.181751.0760.07183.51.05280.14
270.350.182500.9100.1121171.19682.7
Table 3. ANOVA for response surface roughness.
TermsDFAdj-SSAdJ-MSFP% ContributionSignificant
a20.168540.084272205.540.00014.30Yes
f20.786210.393103958.770.00066.71Yes
V20.167140.083570203.820.00014.18Yes
a × f40.021680.00542013.220.0011.84Yes
a × V40.021330.00533213.000.0011.81Yes
f × V40.010400.002600 6.340.0130.88Yes
Inaccuracy80.003280.000410
Aggregate261.17858
Summary: R2 = 99.72%; R2 (adjacent) = 99.10%; R2 (prediction) = 96.83%.
Table 4. ANOVA for response tool flank wear.
TermsDFAdj-SSAdJ-MSFP% ContributionSignificant
a20.0009160.00045841.860.00012.40Yes
f20.0005130.00025623.420.0006.95Yes
V20.0055090.002754251.660.00074.58Yes
a × f40.0001030.0000262.360.1411.39No
a × V40.0001950.0000494.460.0352.64Yes
f × V40.0000630.0000161.450.3040.85No
Inaccuracy80.0000880.000011
Aggregate260.007387
Summary: R2 = 98.81%; R2 (adjacent) = 96.15%; R2 (prediction) = 86.50%.
Table 5. ANOVA for cutting temperature.
TermsDFAdj-SSAdJ-MSFP% ContributionSignificant
a21695.29847.6487.800.00017.18Yes
f2307.62153.8115.930.0023.12Yes
V27481.623740.81387.460.00075.84Yes
a × f4241.1160.286.240.0142.44Yes
a × V427.586.890.710.6050.28No
f × V434.288.570.890.5130.35No
Inaccuracy877.249.65
Aggregate269864.73
Summary: R2 = 99.22%; R2 (adjacent) = 97.46%; R2 (prediction) = 91.08%.
Table 6. ANOVA for power consumption.
TermsDFAdj-SSAdJ-MSFP% ContributionSignificant
a20.529230.26461795.820.00047.53Yes
f20.089590.04479316.220.0028.04Yes
V20.462010.23100483.640.00041.5Yes
a × f40.016420.0041041.490.2931.47No
a × V40.009550.0023880.860.5250.86No
f × V40.004610.0011520.420.7920.41No
Inaccuracy80.00209 0.002762
Aggregate261.11350
Summary: R2 = 98.05%; R2 (adjacent) = 93.67%; R2 (prediction) = 77.80%
Table 7. ANOVA for Noise emission.
TermsDFAdj-SSAdJ-MSFP% ContributionSignificant
a2225.883112.941271.580.00057.57Yes
f214.3607.18017.260.0013.66Yes
V2135.45267.726162.850.00034.52Yes
a × f48.3332.0835.010.0262.12Yes
a × V41.6020.4010.960.4770.41No
f × V43.4250.8572.060.1780.87No
Inaccuracy83.3270.416
Aggregate26392.383
Summary: R2 = 99.15%; R2 (prediction) = 97.24%; R2 (adjacent) = 90.34%.
Disclaimer/Publisher’s Note: The statements, opinions and data contained in all publications are solely those of the individual author(s) and contributor(s) and not of MDPI and/or the editor(s). MDPI and/or the editor(s) disclaim responsibility for any injury to people or property resulting from any ideas, methods, instructions or products referred to in the content.

