Article

In Vitro Wear Behavior of Knee Implants at Different Load Levels: The Impact of the Test Fluid

1
Laboratory of Biomechanics and Implant Research, Department of Orthopaedics, Heidelberg University Hospital, Schlierbacher Landstraße 200a, 69118 Heidelberg, Germany
2
Department of Orthopaedics, Heidelberg University Hospital, Schlierbacher Landstraße 200a, 69118 Heidelberg, Germany
3
Department of Mechanical Engineering, Machine Elements and Computer-Aided Product Development, Helmut-Schmidt-University, 22043 Hamburg, Germany
*
Author to whom correspondence should be addressed.
Lubricants 2023, 11(11), 474; https://doi.org/10.3390/lubricants11110474
Submission received: 28 July 2023 / Revised: 26 September 2023 / Accepted: 2 November 2023 / Published: 4 November 2023
(This article belongs to the Special Issue Tribology of Polymer-Based Composites)

Abstract

:
Calf serum is defined as a test fluid for in vitro knee wear simulation studies in the ISO standard. However, protein degradation typically occurs during in vitro wear simulation. The current study should indicate whether increased loads change the rheological properties of the test fluid and may, therefore, lead to favorable tribological behavior and reduced wear. Three different load levels were simulated in a displacement-controlled knee wear simulation study. The gravimetric wear rates were determined, pressure measurements were performed, and the dynamic viscosity of the test fluids were analyzed after the simulation of 0.5 × 10⁶ cycles. The lowest load level led to the lowest wear rate, and the lowest contact pressure and contact area, compared to the medium and high-load level. Although, the high-load level led to the highest contact pressure and contact area, the wear rates were comparable to the medium-load level. The rheological measurements revealed the highest dynamic viscosity for the high-load level and no differences could be found between the medium and low loading condition. To perform realistic wear simulation studies, the reproduction of the in vivo interrelationships between the shear forces and wear are necessary.

1. Introduction

In vitro simulation studies are well suited to evaluate the wear behavior of artificial knee implants. Using this method, the impact of different implant designs, implant materials, or implant alignments, on the wear behavior can be evaluated using a standardized approach [1,2,3]. Patient-specific factors do not influence the results, making wear simulation a very accurate procedure with low deviations. The boundary conditions for the in vitro wear simulation of artificial knee joints are summarized in ISO 14243 [4,5,6]. Herein, calf serum is defined as a test fluid and acts as a replacement fluid to human synovia. In vitro wear simulation using calf serum as a test fluid leads to more similar polymeric wear rates, wear traces, and particles as detected in vivo, than non-protein containing fluids [7]. However, in vivo conditions cannot be completely replicated using calf serum due to differences between the calf serum and synovia regarding the protein constituent fraction, the chemical composition, and especially the rheological properties [8,9]. In addition, there is no continuous exchange of the test fluid using the in vitro wear simulation, as for synovia in the patient. Instead, the test fluid remains in the test chamber and will be replaced every 0.5 × 10⁶ gait cycles. A recent knee wear simulation study already showed that the rheologic properties of the calf serum changes during a test interval of 0.5 × 10⁶ cycles [10]. Thereby, the unstressed test fluid (0 cycles) shows a shear-thinning behavior and a lower dynamic viscosity for high shear rates than the stressed test fluid after 0.5 × 10⁶ cycles, which shows a near Newtonian behavior. Another knee wear simulation study showed that the wear behavior is strongly influenced by the replacement intervals, whereby shorter replacement intervals led to higher wear rates [11]. Reinders et al. found out that lower volumes of test fluid in the sealed test chambers led to lower wear rates, than higher volumes [12]. This phenomenon could be attributed to the degradation of the proteins in the calf serum under loading conditions. The lower the volume of the test serum, the faster the degradation of the proteins in the test fluid. The degradation of the proteins may then increase the viscosity of the test fluid, leading to reduced friction and low wear rates. Brandt et al. found a polypeptide degradation of 30.53 ± 3.96% after one test interval (0.5 × 10⁶ cycles) during knee wear simulation [13]. Wang et al. analyzed different parameters of the bovine calf serum and its impact on the wear behavior of polymeric acetabular cups [14]. They found out that an increased protein concentration and an increased albumin/globulin ratio leads to reduced polyethylene wear. In addition, insoluble protein precipitates were visible in the test chambers, reducing the wear rate [14]. Depending on the implant size, implant design, or simulated weight of the patient, different contact pressures between the femoral condyles and the insert will occur. Thereby, the question may arise as to whether the increased contact pressure between the femoral condyle and the polyethylene insert would also lead to the accelerated degradation of the proteins influencing the wear behavior. In fact, the pressure dependency of polyethylene is a highly controversial issue. In a pin-on-plate study using bovine serum as the test fluid, reduced polyethylene wear was detected by increasing the contact pressure [15]. Saikko found out that the wear rate increases up to a contact pressure of 3.5 MPa and, for higher contact pressures, a reciprocal relationship was detected [16]. Contrary to this, O’Brien et al. found an increased wear rate for the polyethylene inserts by increasing the compression force by a factor of 1.7, using a knee wear simulator [17]. However, no rheological measurements of the test fluids were made in these studies.
Therefore, the goal of this study was to investigate the wear behavior of knee implants and the dynamic viscosity of the calf serum used after the application of different load levels.

2. Materials and Methods

To investigate the research question, wear simulations at different load levels were performed, followed by a contact pressure analysis between the femoral condyles and the tibia inserts. Subsequently, the dynamic viscosities of the test fluids after the application of different load levels were determined using rheological measurements. The tested groups and the applied methods are explained in the following sections.

2.1. Test Groups

Three different load levels were determined to simulate different patient weights. The first load level (medium) corresponds to a force curve according to ISO 14243-3, having a maximum force of 2600 N [6]. The second load level (low) had the same force curve, which received a compression of 50%, resulting in a maximum force of 1300 N. The third load level (high) had the same force curve as for the medium-load level, receiving a stretching of the curve by 150%, which resulted in a maximum force of 3900 N. The minimum forces and the courses of the curves were equal for the three load levels (see Figure 1).

2.2. Implant System

For each load level, three Attune (DePuy Orthopaedics, Inc., Warsaw, IN, USA) cruciate-retaining femoral components (size 5), three fixed-bearing titanium tibial trays (size 5), and three crosslinked polyethylene inserts (size 5 and a thickness of 5 mm) blended with antioxidants, were used. One additional implant system was used as a loaded soak control. The wear simulations were carried out consecutively, without changing the implant components or inserts. This allowed identical implant positioning, relative to the knee wear simulator, between the three groups.

2.3. Wear Simulation

Before testing, the polyethylene inserts were soaked until saturation in newborn calf serum, with a protein content of 20 ± 1 g/L and 1.85 g/L sodium azide, as well as 5.85 g/L ethylenediaminetetraacetate as additives. According to the supplier (PAN-Biotech GmbH, Aidenbach, Germany), the initial newborn calf serum has a total protein content of 78.95 g/L. The total protein content can be divided into 36.63 g/L albumin, 17.68 g/L α-globuline, 8.13 g/L β-globuline, and 16.50 g/L γ-globuline. This corresponds to an albumin/globulin ratio of 0.87. The serum was diluted by adding deionized water to obtain a total protein concentration of 20 ± 1 g/L. The same fluid was used for testing. An adapted displacement-controlled knee wear simulation was performed using an AMTI knee simulator (KS2-6-1000, Advanced Mechanical Technology Inc., Watertown, MA, USA), to generate higher wear rates compared to ISO 14243-3 [6]. The flexion–extension, internal–external rotation, and anterior–posterior translation are summarized in Figure 2.
With this approach, equal kinematics were applied for the low, medium, as well as the high-load level, and sufficiently high wear rates were generated to be able to detect possible differences between the three groups. The total test duration for each loading condition was 2.5 × 10⁶ cycles, and gravimetric measurements and an exchange of the test fluid was performed every 0.5 × 10⁶ cycles.

2.4. Analysis Methods

The analysis methods were separated into gravimetric wear measurements, pressure measurements, and rheological measurements, which are specified in the following sections.

2.4.1. Gravimetric Wear Measurement

Gravimetric wear measurements were performed after each interval of 0.5 × 10⁶ cycles. Therefore, the test fluid was extracted, the test chambers were dissembled, and the inserts were cleaned according to ISO 14243-2 [5]. Thereby, the three test specimens and the control specimen were repeatedly cleaned in an ultrasonic bath with, and in an ultrasonic bath without, cleaning detergent and, subsequently, dried in a desiccator. The specimens were rinsed with nitrogen, in order to avoid electrostatic charging of the polyethylene inserts. Then, the test specimens and control specimen were soaked in propan-2-ol for 5 min ± 15 s and again rinsed with nitrogen. Afterwards, the specimens were dried in the desiccator for 30 min before they were weighed using a high precision balance, with a measuring accuracy of 15 µg (Sartorius Genius ME235S-OCE, Sartorius AG, Göttingen, Germany). The measurements were performed in a temperature-controlled measuring room (21 ± 1 °C). Every specimen was weighed five times in rotation with the other specimens, within a maximum time period of 90 min. Two calibrated control weights (Zwiebel, Saverne Cedex, France) were used to identify possible deviations in the measuring system. The gravimetric measurements were repeated five times for statistical purposes. The weight gain of the reference insert was added to the weight loss of the test inserts to account for mass increase due to the soaking processes.

2.4.2. Pressure Measurements

For each load level, the contact pressure and the contact area between the femoral condyles and the polyethylene insert were determined using a quasi-static approach, using the I-Scan measurement system with the corresponding sensors (Model 4000, Tekscan, Inc., Norwood, MA, USA). The sensors were designed for pressure measurements of knee joints and separated into a medial and lateral sensor matrix. Each sensor matrix has a height of 33 mm, a width of 27.9 mm, and consists of 572 single measurement units. The implant system on the first station of the knee simulator was used for the pressure measurements after the wear simulation. Subsequently, the sensors were placed on the medial and lateral side of the polyethylene insert and fixed with an adhesive bond. The sensors were preconditioned at 4000 N for five minutes. Afterwards, a sensor calibration was performed during an increase and reduction of the force to account for the hysteresis effects. The stand phase was separated equally into four measuring points. The measuring point with the highest compression force (1300 N for the low, 2600 N for the medium, and 3900 N for the high loading condition) was included. Consequently, the kinematics after 13%, 26%, 39%, and 52% were adjusted, and the low, medium, and high-load levels were applied successively, which correspond to the four percentages of the gait cycle. The kinematics and compression forces are shown in Table 1.
For the pressure measurement, the first axial force (low) was applied between the polyethylene insert and the femoral condyles, and maintained for approximately 10 s. The contact pressures of each activated pressure measurement unit for the two sensors’ matrices were saved in a text file. Then, the pressure sensors were completely unloaded. Afterwards, the next force level was applied (medium), followed by the high-load level. Then, the next positions for the femoral and tibial components were adjusted and the corresponding low, medium, and high-load levels were applied. The measurements were performed six times for statistical purposes. A self-written Matlab program was used to determine the pressure measurement unit with the highest maximum contact pressure and contact areas, by multiplying the activated pressure measurement units with the size of the pressure measurement unit.

2.4.3. Rheological Measurements

For the rheological measurements, the test fluids for the low, medium, and high-load levels in the interval between 0.5 and 1.0 × 10⁶ cycles were used. In addition, the test fluid at zero cycles was analyzed as well, which counted as a reference. All the rheological investigations were carried out at 37 ± 0.04 °C, using a Physica MCR 702 rheometer (Anton Paar GmbH, Graz, Austria) and a double-gap measuring system. Similar to previous studies, the dynamic viscosity η was determined, as a function of the shear rate in the interval between 101 s−1 and 103 s−1 ramping up in logarithmic steps [10,18]. Each test fluid was swished gently, before pouring it into the measuring cup. The test was started after the temperature was maintained with a deviation of ±0.04 °C for 60 s. Previously, the fluid was rotated for 30 s at a shear rate of 50 s−1 and then stopped for 10 s. Using this technique, sedimentation of the proteins was prevented until the target temperature was reached. The measuring tools were cleaned with water and isopropyl alcohol before each measurement. The laminar flow could be ensured, because the Reynolds number of an identical newborn calf serum with a protein content of 20 g/L was determined in a previous study [10]. The Reynolds number was between 237 and 261, which is far below the critical Reynolds number of 1000 and above, where turbulent flows are expected. The measurements for each group were performed five times with fresh samples.

2.5. Statistics

Regression analyses were performed to determine the wear rates for each loading condition. The statistical evaluation of the maximum contact pressure and contact area were carried out descriptively (arithmetic mean and standard deviation). The rheological properties of the three test fluids after 0.5 × 10⁶ cycles, as well as the reference fluid after zero cycles, were statistically evaluated at a low shear rate of 101 s−1, a medium shear rate of 102 s−1, and a high shear rate of 103 s−1. To compare the wear rates for the three groups and the rheological behavior of the four groups, ANOVAs for the independent samples and, if applicable, Bonferroni post hoc analyses were performed.Statistical significance was based on a two-sided p value < 0.05. All statistical analyses were carried out using SPSS 22 (IBM, Armonk, NY, USA).

3. Results

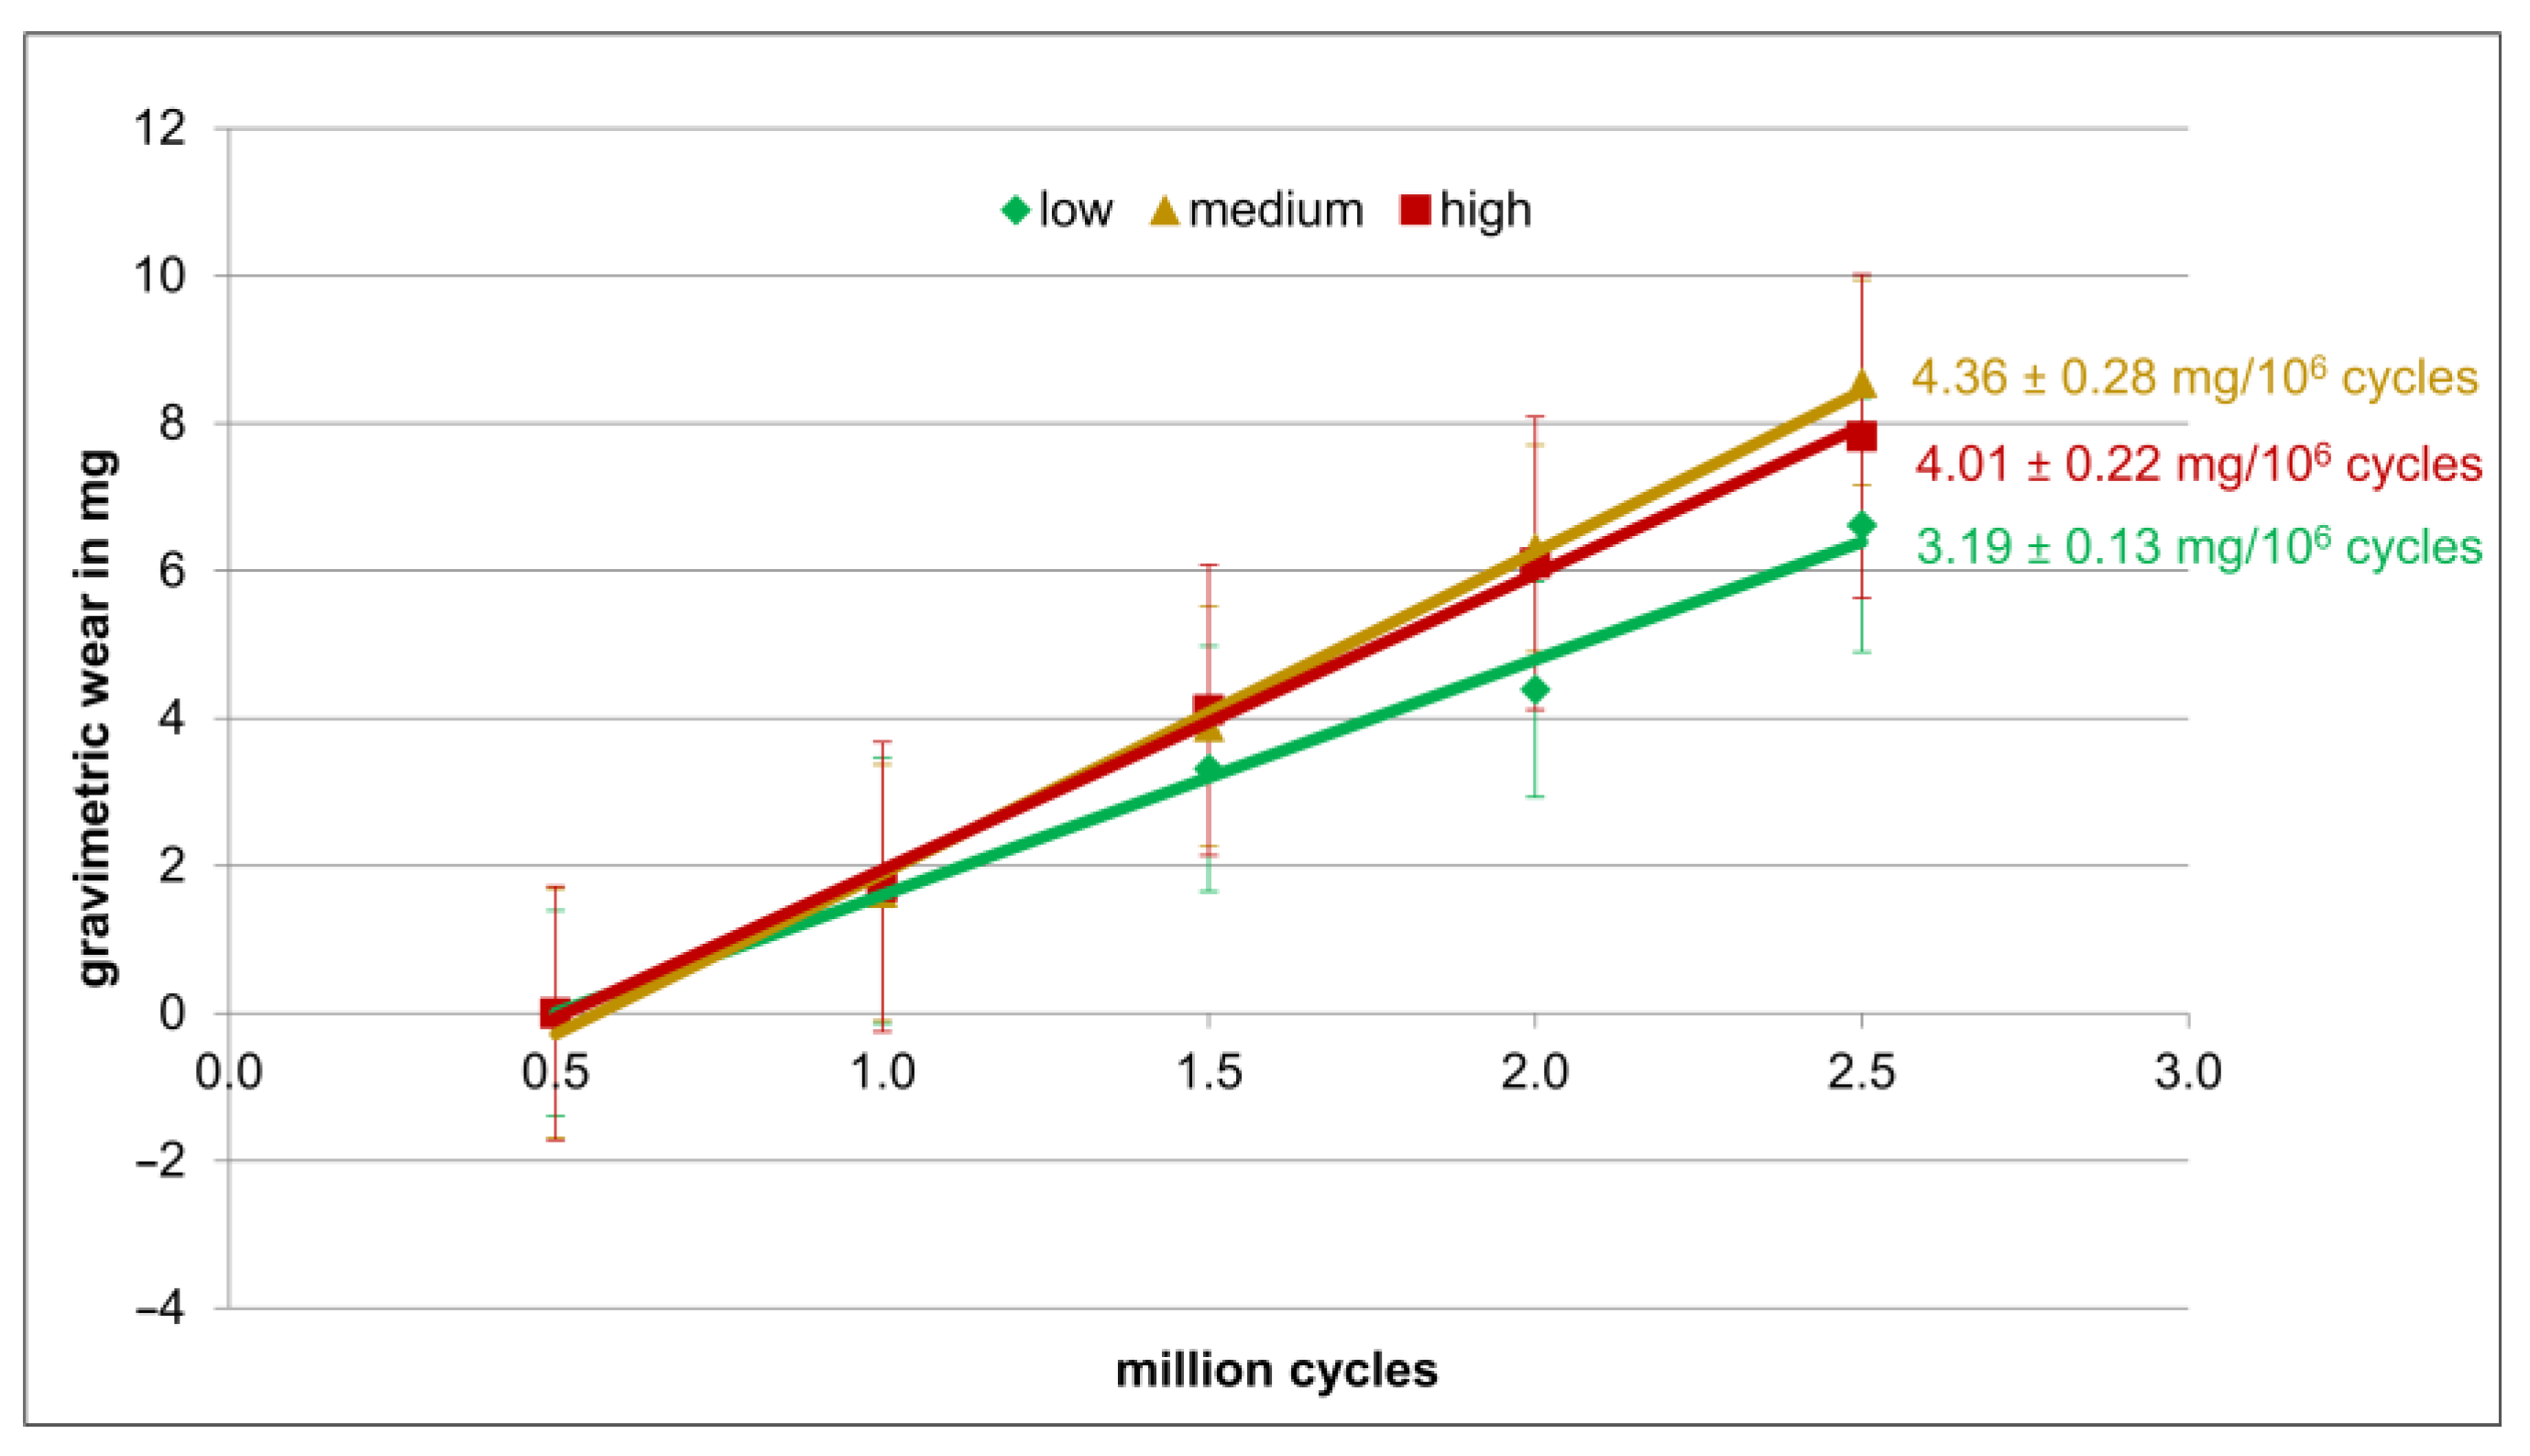
3.1. Gravimetric Wear Rates

The gravimetric results for the low, medium, and high-load levels are shown in Figure 3.
The low loading condition led to a significantly lower wear rate (3.19 ± 0.13 mg/Mio. cycles), compared to the medium (4.36 ± 0.28 mg/Mio. cycles) and high (4.01 ± 0.22 mg/Mio. cycles) loading conditions (p ≤ 0.03). The medium loading condition showed a slightly higher wear rate than the high loading condition without any significant differences (p = 0.48).

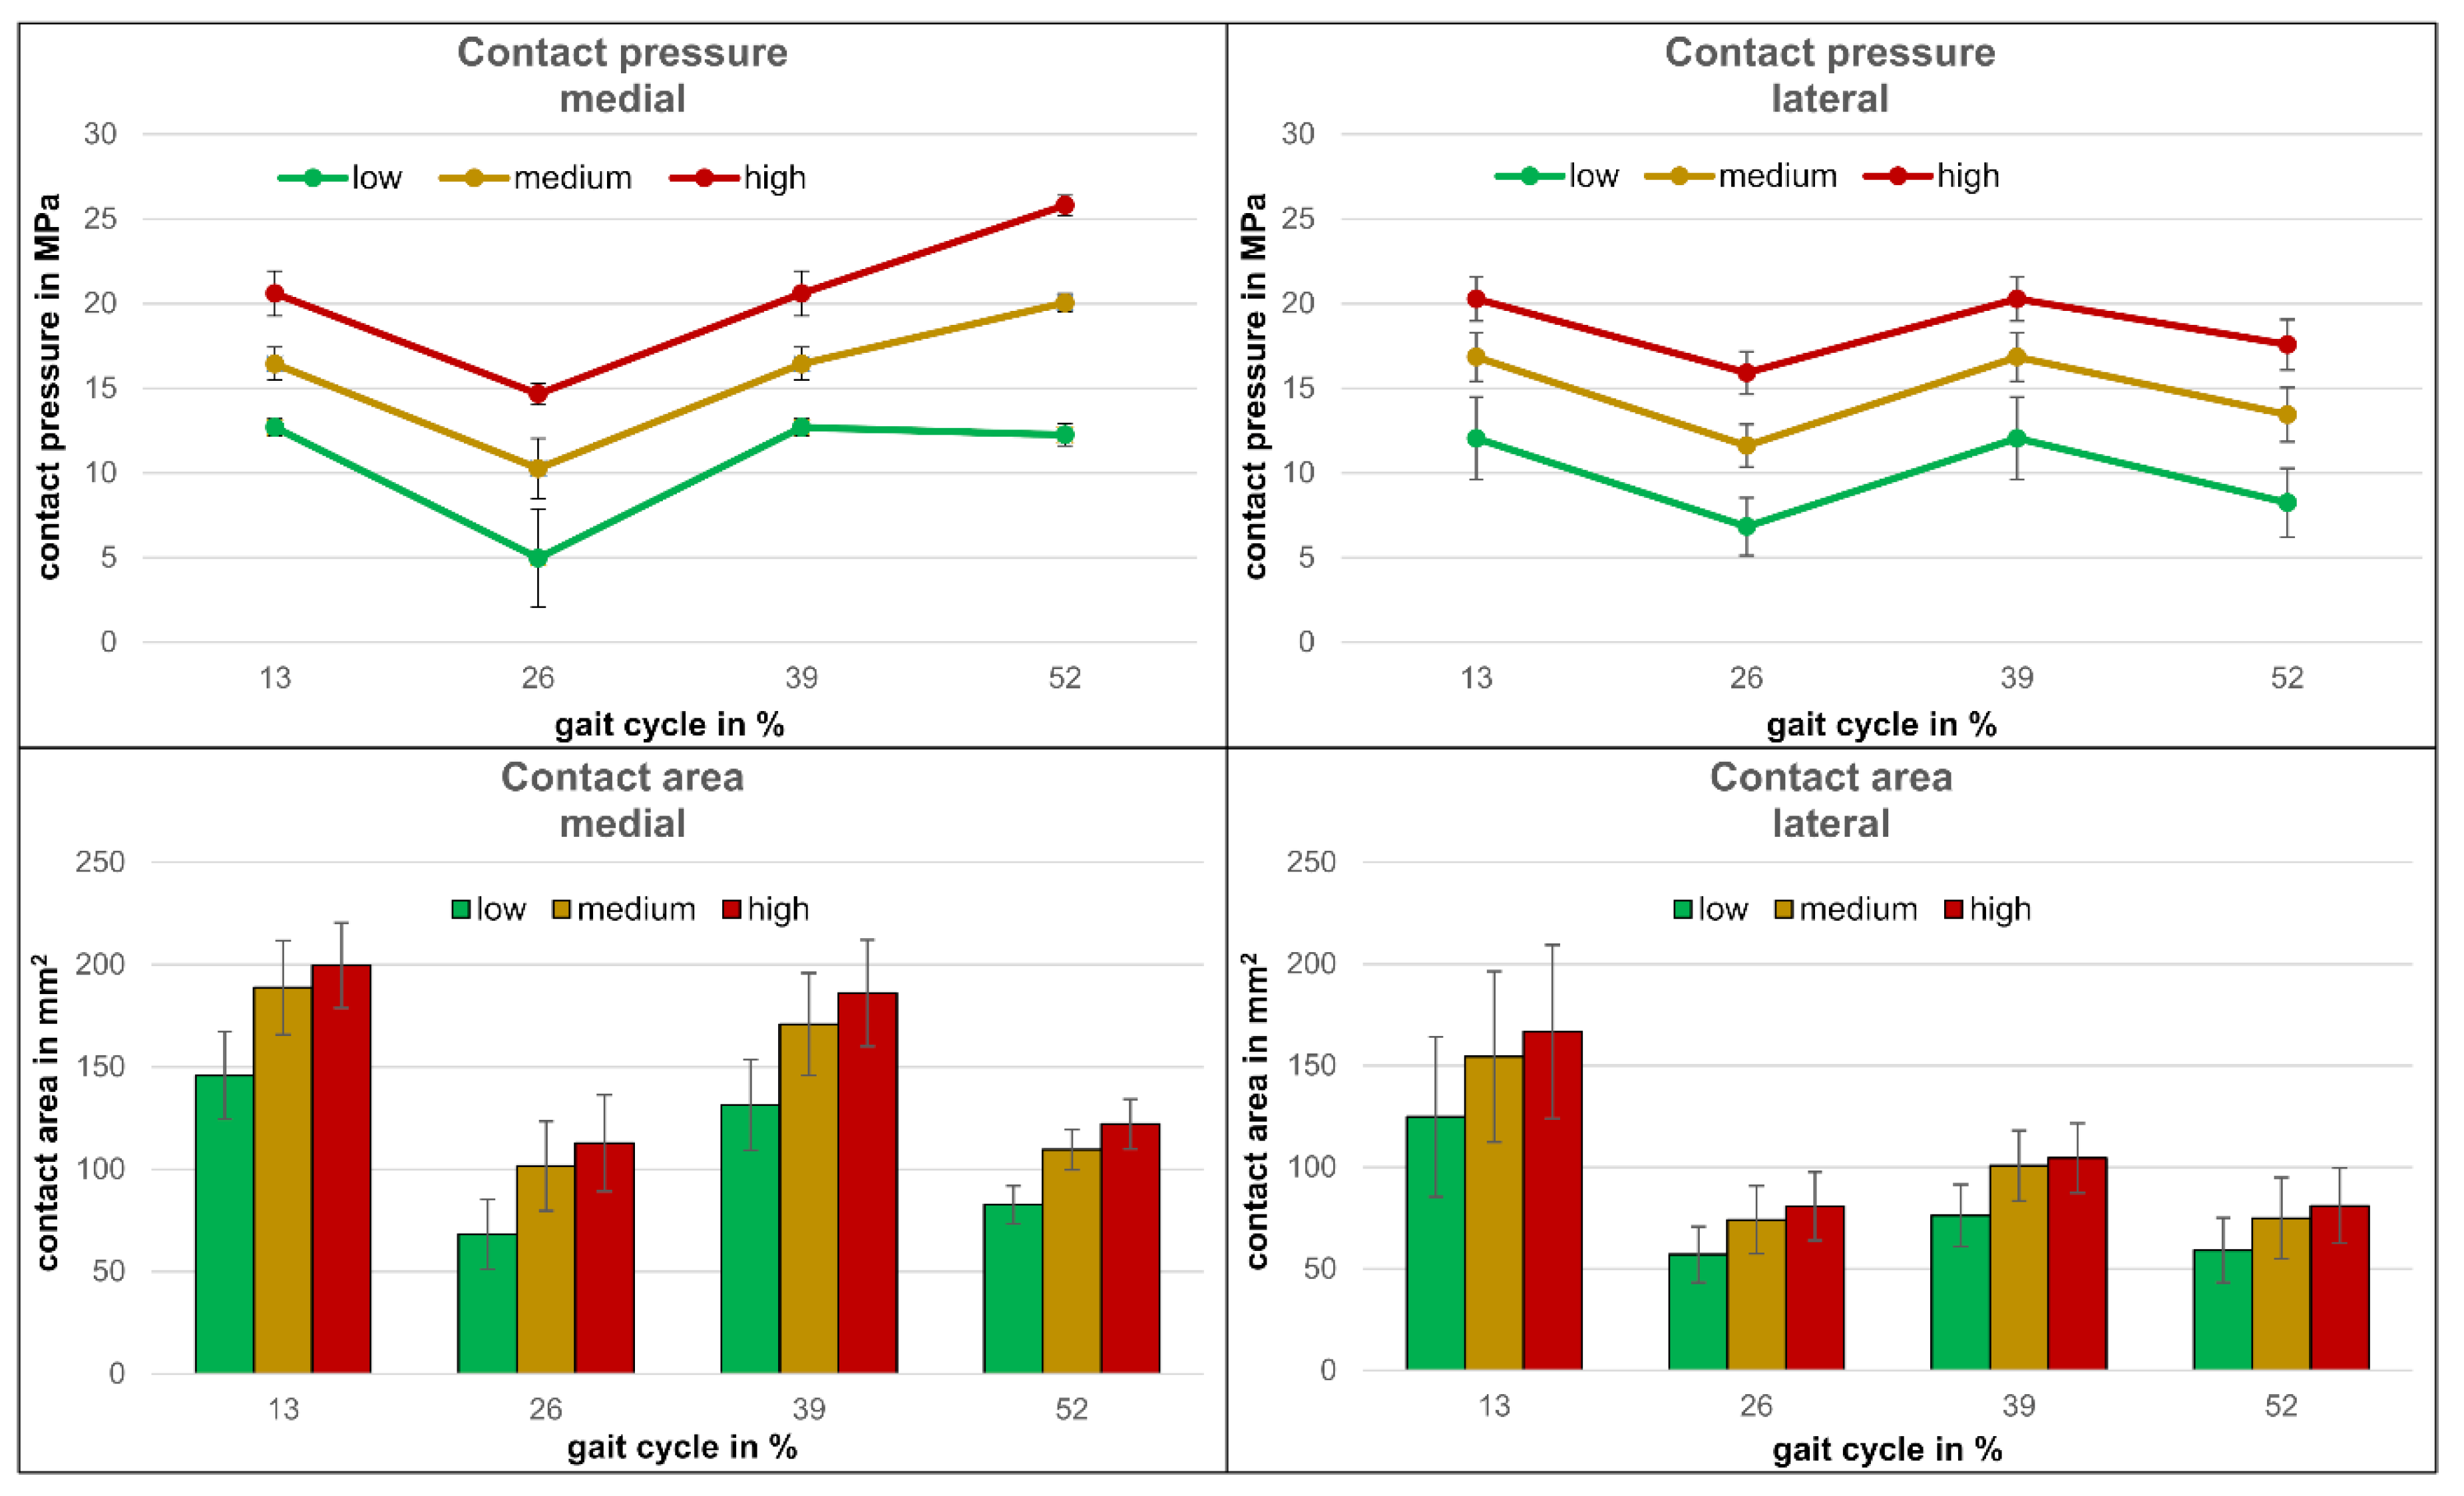
3.2. Comparison of the Pressure Measurements

The contact pressure, as well as the contact area, between the medial and lateral condyle and the polyethylene insert are shown in Figure 4 for the three loading conditions.
As expected, the contact pressure and the contact area were the highest for the high loading condition, followed by the medium loading condition, and the lowest for the low loading condition, for all four measuring points during the gait cycle. In general, the contact pressure between the medial and lateral side was comparable, except for the last measuring point (52% of the gait cycle), where the medial side showed higher contact pressures for all three loading conditions. The contact area however, was bigger for the medial side compared to the lateral side of the implant. The total values (mean and standard deviation) for the contact pressure and contact area of all groups can be found in the Supplementary Materials S1.

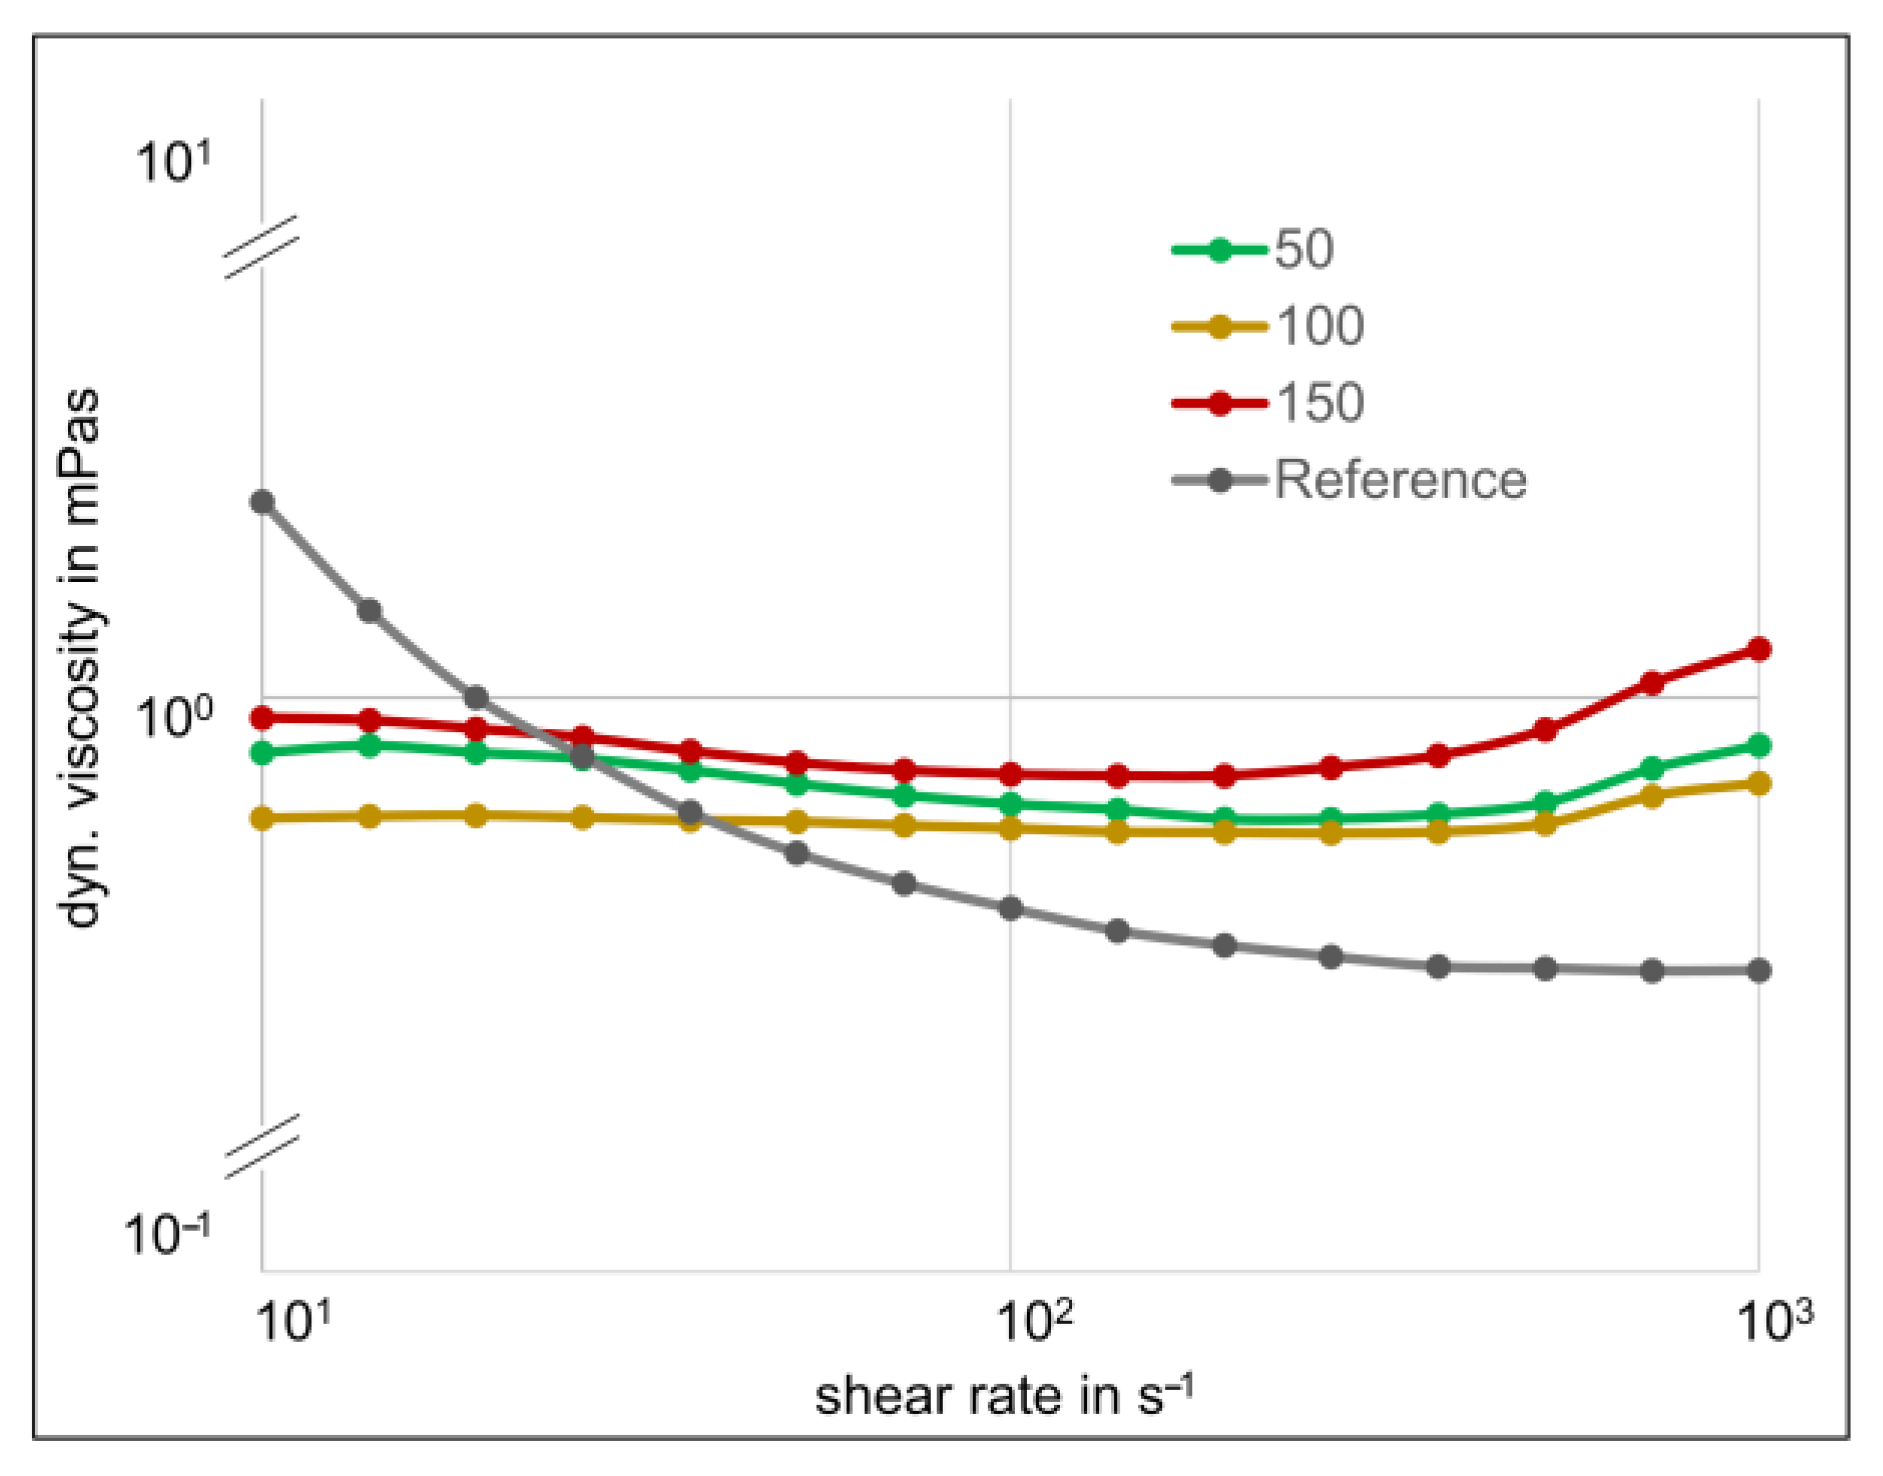
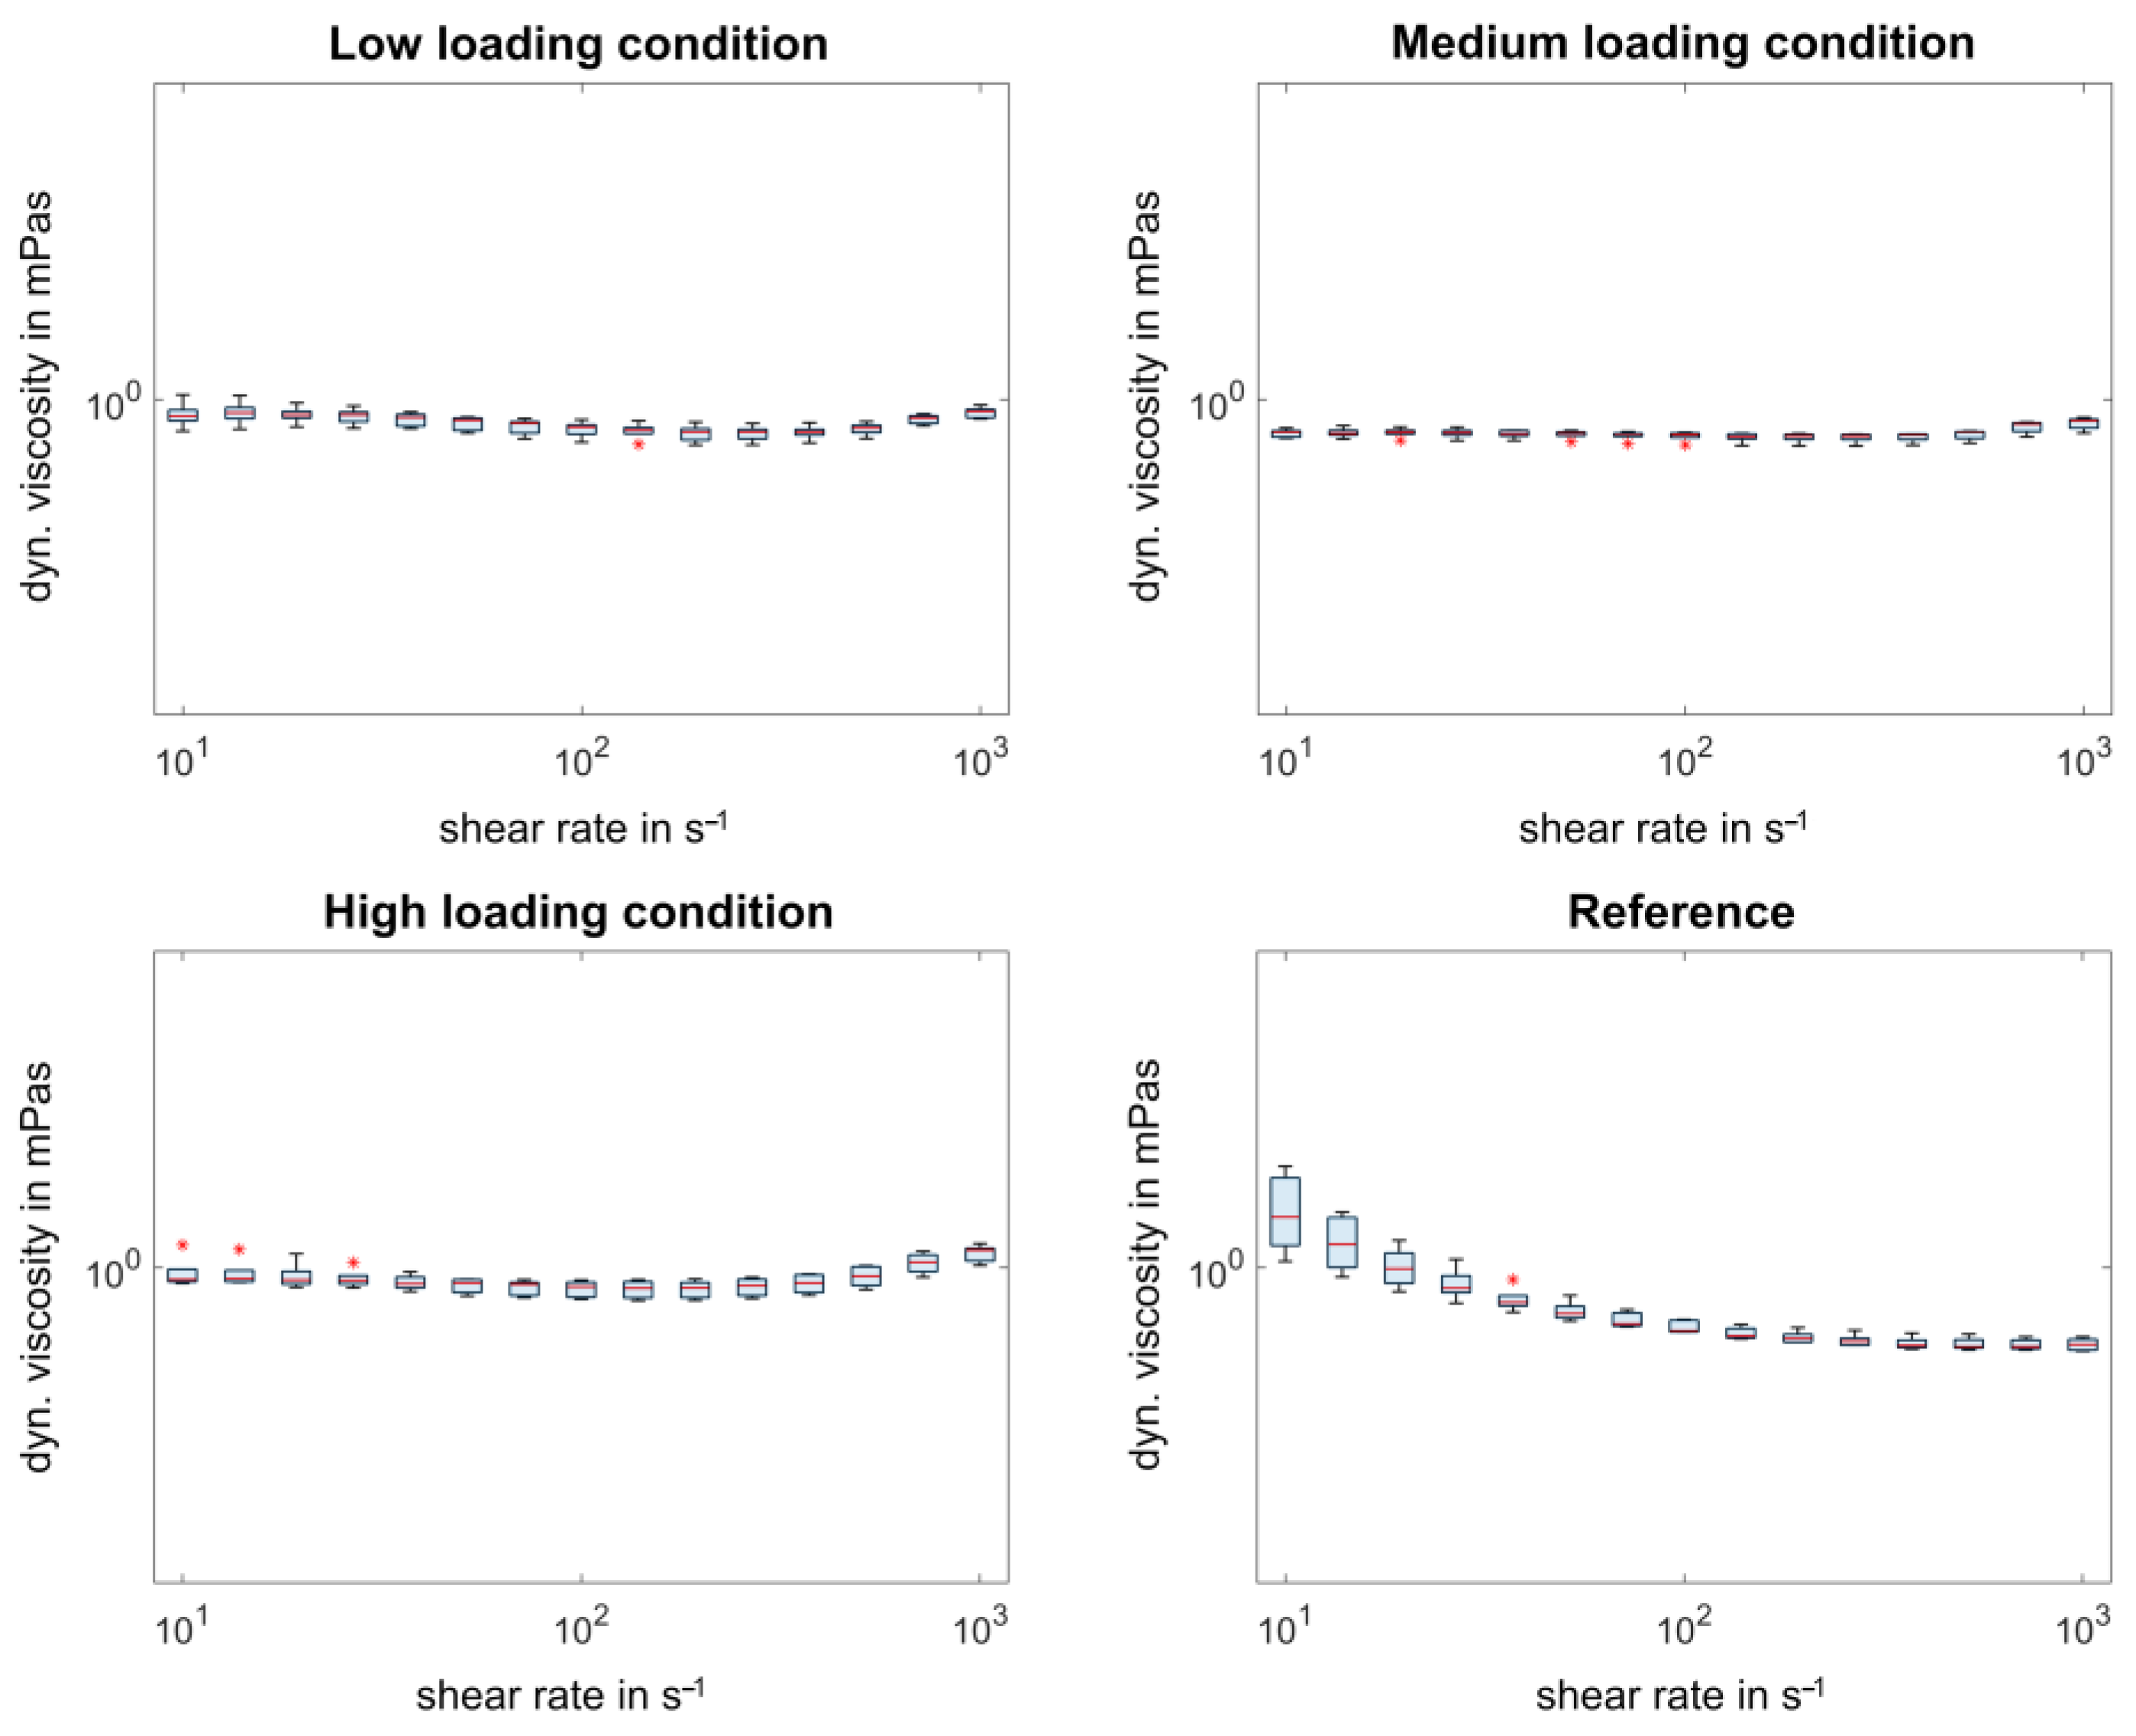
3.3. Comparison of the Rheological Measurements

In Figure 5, the mean dynamic viscosity curves relative to the shear rates are shown for the test fluids for the low, medium, and high loading condition. In addition, a mean reference curve for the unloaded test fluid was added.
It can be seen that the highest loading condition led to the highest dynamic viscosity throughout the analyzed shear rate interval. Especially for high shear rates (>102 s−1), the gap between the high loading condition and the other two loading conditions increases. The medium loading condition showed a slightly lower dynamic viscosity than the low loading condition. However, the gap between the medium and low loading condition decreases at higher shear rates. Only the reference test fluid, which was not used for wear simulation, showed a shear-thinning behavior. Thereby, a higher dynamic viscosity can be found for the reference fluid compared to the other three test fluids at low shear rates. At a shear rate of approximately 50 s−1, the dynamic viscosity of the reference fluid is lower than the dynamic viscosity of the three other groups. At high shear rates of approximately 200 s−1, the reference test fluid showed a near Newtonian behavior. In Figure 6, the dynamic viscosity of the four groups are shown as boxplots.
As seen in Figure 6, the reference fluid shows a higher standard deviation for low shear rates (<30 s−1), compared to the three test fluids, after 0.5 × 10⁶ cycles. The statistical evaluation was performed for the three shear rates (101 s−1, 102 s−1 and 103 s−1) to compare the four groups at low, medium, and high shear rates. The absolute mean and standard deviation are shown in Table 2.
For the shear rate 101 s−1, the reference showed a significantly higher dynamic viscosity compared to the other three test fluids (p ≤ 0.01). No significant differences were found between the dynamic viscosity of the low condition and the medium loading condition (p > 0.99), between the low and high loading condition (p > 0.99), and between the medium and high loading condition (p = 0.61) at this shear rate. Contrary to the low shear rate, the medium shear rate of 102 s−1 revealed a significantly lower dynamic viscosity for the reference compared to the other three test fluids (p ≤ 0.01). In addition, a significantly lower dynamic viscosity was found for the medium loading condition compared to the high loading condition (p = 0.02). No significant differences were found between the low and the medium loading condition (p = 0.93), as well as between the low and the high loading condition (p = 0.47). For the shear rate 103 s−1, the reference fluid showed again a significantly lower dynamic viscosity compared to the other three test fluids (p < 0.01), and the high loading condition showed a significantly higher dynamic viscosity compared to the medium and low loading conditions (p < 0.01). No significant differences could be found between the low and the medium loading conditions (p = 0.14).

4. Discussion

In the current study, the relationship between the wear behavior, contact pressure, and rheological properties of the test fluid used for knee wear simulation studies was investigated. It was shown that the wear rate increased from a low (50%) loading condition to a medium (100%) loading condition. However, no significant differences could be found between the wear rate for the medium and high (150%) loading condition, and the high loading condition even tended to a slightly lower wear rate than the medium loading condition. As expected, the pressure measurements showed the highest contact pressures and the highest contact areas for the high loading condition, followed by the medium loading condition, and then followed by the low loading condition. The rheological measurements revealed the highest dynamic viscosity for the high loading condition compared to the medium and low loading conditions. Between the medium and low loading conditions, a slightly higher dynamic viscosity was found for the low loading condition without any significant differences. The reference fluid showed a clear shear-thinning behavior for low shear rates, with a higher dynamic viscosity than the three test fluids, changing to a Newtonian behavior at high shear rates with a lower dynamic viscosity than the three test fluids. These results show that high shear forces between the femoral condyles and the polyethylene insert can change the viscosity of the test fluid during the wear simulation study. The thickening of the test fluid at high shear forces may, thereby, distort the wear behavior of polyethylene inserts. A thickening of the test fluid during the test duration has already been observed by Uhler et al. [10]. Wang et al. also found protein precipitates in the test chambers when performing in vitro wear simulation on hip implants [14]. In a multidirectional pin-on-plate test at different contact pressures (1 MPa, 4 MPa, and 11 MPa), the wear rate decreased when increasing the contact pressure [15]. Another pin-on-plate study showed increasing wear when increasing the contact pressure until 3.5 MPa [16]. At higher contact pressures, the wear rate decreases. However, pin-on-plate tests cannot replicate the complex loads and kinematics found during in vitro knee wear simulation tests. Brockett et al. compared the wear behavior of a lipped and a flat polyethylene insert, using a displacement-controlled knee wear simulation test [19]. The flat insert led to a reduced wear rate, although the contact pressure should be higher compared to lipped inserts. However, the contact area of the flat insert is much smaller, which is beneficial for the wear behavior. Schwiesau et al. performed in vitro knee tests comparing the wear rate of the ISO standard to the wear rate of highly demanding activities [20]. The wear simulation of the highly demanding activities led to higher wear rates compared to the ISO standard. However, the wear rate of polyethylene strongly depends on the kinematics, so the impact of the loading condition cannot be interpreted [21]. Only O’Brien et al. performed a comparable test, as in this study, comparing the wear rate of knee implants simulating ISO 14243-3 with a corresponding load curve to the wear rate of an increased load curve (170%) [17]. The kinematics remained constant and an increased wear rate was found for the high loading condition. One difference to the current study was the amount of test fluid. In the current study, 250 mL of serum was used for each implant chamber. O’Brien et al. used a reservoir with a total volume of 500 mL for each implant chamber. A previous study by Reinders et al. already showed that a reduced fluid volume leads to reduced wear behavior, which may be due to the accelerated degradation of the proteins [12]. In the study by Wang et al. the volume turnover rate had the highest impact on the wear behavior, which is the volume of the lubricant divided by the test duration [14]. The authors recommended a minimum volume turnover rate of 2.0 mL/h. In the current study, the volume turnover rate was 1.8 compared to a volume turnover rate of 3.6 by O’Brien et al. [17]. However, this recommendation was made for hip implants with one implant design. The acceptable volume turnover rate for knee wear simulation may be different and depends on the contact pressure, as shown in this study. Unfortunately, in the study by O’Brien et al., no rheological analyses were performed to compare the test fluid between the study by O’Brien et al. and the current study. The postulated coherence between the wear, contact pressure, and rheological properties of the test fluid may lead to the question, whether calf serum should still be used as a synovia replacement for wear simulation studies. The study by Galandáková et al. already showed huge differences between human synovia fluid and bovine calf serum [9]. Bortel et al. published a guide to produce a synovia replacement [22]. However, bovine serum albumin was added to the serum, which will probably be subjected to degradation as well. In addition to different protein containing fluids, Scholes and Joyce also tried oils as replacement fluids for synovia [23]. However, the different oils typically led to an unrealistic high surface roughness of the polyethylene compared to bovine serum. Egg white solutions led to a similar wear behavior as bovine calf serum, but a rapid protein degradation was obtained for this fluid as well [23]. If protein-containing test fluids are used, the fluid volume should be standardized. Thereby, fluid volumes might be specified for different types of implants and the occurring shear forces to obtain similar results as those obtained in vivo.

Limitations

In the current study, some limitations should be mentioned, which are described in the following section. For the wear simulation, the same four implant systems including the polyethylene inserts were used for all three loading conditions. The idea was to avoid component changes as far as possible, so that the differences in the wear rate could only be attributed to the load level. Different polyethylene inserts may also have little geometrical and gravimetrical differences due to the production process. To avoid wear differences in the run-in phase, 2 × 10⁶ cycles were applied at the load level of 100%, before applying the 2.5 × 10⁶ cycles for each subsequent load level (100%, 50%, and at least 150%). Due to the linear wear behavior of polyethylene, this approach might have led to the most realistic results for the comparison of the three load levels. Another limitation is the reduced sample size (three test implant systems and one reference implant system) for the wear simulation for each group. However, this is the standard for knee wear simulation studies. The wear rates were determined using a linear regression from 0.5 to 2.5 × 10⁶ cycles for each load level. This means that the statistical evaluations of the wear rates were performed using only three test stations, but at five measurement points, which increases the robustness of the analyses.

5. Conclusions

It was shown that newborn calf serum changes its rheological properties during knee wear simulation if high shear forces occur. The increase in dynamic viscosity may be responsible for the reduction in the wear rate. This thickening of the test fluid during in vitro wear simulation might lead to different results in vitro compared to in vivo. To perform realistic wear simulation studies, the reproduction of the in vivo interrelationships between the shear forces and wear are necessary. A replacement fluid would be desirable with rheological properties that do not change during the test duration or when applying different loads. For bovine calf serum, a high-volume turnover rate, specified and standardized for each type of implant, might lead to more realistic wear results. Furthermore, the in vivo behavior of the synovia after knee replacement needs to be fully understood, to evaluate the applicability of the replacement fluid.

Supplementary Materials

The following supporting information can be downloaded at: https://www.mdpi.com/article/10.3390/lubricants11110474/s1, Table S1: Pressure_Measurements_Data.xlsx.

Author Contributions

Conceptualization, S.S., M.U., M.S. and J.P.K.; Formal analysis, S.S., M.U., T.W. and J.N.; Investigation, S.S., M.U., M.S., T.W. and J.N.; Methodology, M.U., T.A.N. and S.S.; Project administration, S.S. and J.P.K.; Resources, F.M., J.P.K. and S.S.; Supervision, F.M. and J.P.K.; Validation, M.U. and S.S.; Visualization, S.S., M.U. and M.S.; Writing—original draft, S.S.; Writing—review & editing, M.S., T.A.N., T.W., J.N., F.M., J.P.K. and M.U. All authors have read and agreed to the published version of the manuscript.

Funding

This research received no external funding.

Data Availability Statement

The data on the pressure measurements are available in the supplementary materials. The remaining data that supports the findings from this study are available from the corresponding author upon reasonable request.

Conflicts of Interest

T.W., F.M. and J.P.K. report a relationship with DFG, Deutsche Forschungsgemeinschaft, that includes: funding grants. J.P.K. reports a relationship with CeramTec GmbH that includes: consulting or advisory. J.P.K. reports a relationship with DePuy Synthes that includes: speaking and lecture fees. J.P.K. reports a relationship with Mathys AG Bettlach that includes: speaking and lecture fees. J.P.K. reports a relationship with DePuy Synthes that includes: funding grants. J.P.K. reports a relationship with Aesculap AG that includes: funding grants. J.P.K. reports a relationship with DOT that includes: funding grants. J.P.K. reports a relationship with Falcon Healthcare Agency that includes: funding grants. J.P.K. reports a relationship with Peter Brehm GmbH that includes: funding grants. J.P.K. reports a relationship with Straumann Holding AG that includes: funding grants. J.P.K. reports a relationship with CeramTec GmbH that includes: funding grants. J.P.K. reports a relationship with Implantcast GmbH that includes: funding grants. J.P.K. reports a relationship with Mathys AG Bettlach that includes: funding grants. J.P.K. reports a relationship with Permedica SpA that includes: funding grants. J.P.K. reports a relationship with Questmed that includes: funding grants. J.P.K. reports a relationship with SpineServ GmbH and Co. KG that includes: funding grants. J.P.K. has a patent issued to DE 10 2018 125 190 B4. All other authors (M.U., M.S., T.A.N., J.N., S.S.) declare no conflict of interest.

References

  1. Grupp, T.M.; Kaddick, C.; Schwiesau, J.; Maas, A.; Stulberg, S.D. Fixed and mobile bearing total knee arthroplasty--influence on wear generation, corresponding wear areas, knee kinematics and particle composition. Clin. Biomech. 2009, 24, 210–217. [Google Scholar] [CrossRef] [PubMed]
  2. Utzschneider, S.; Harrasser, N.; Schroeder, C.; Mazoochian, F.; Jansson, V. Wear of contemporary total knee replacements—A knee simulator study of six current designs. Clin. Biomech. 2009, 24, 583–588. [Google Scholar] [CrossRef] [PubMed]
  3. Maag, C.; Cracaoanu, I.; Langhorn, J.; Heldreth, M. Total knee replacement wear during simulated gait with mechanical and anatomic alignments. Proceedings of the Institution of Mechanical Engineers, Part H: Journal of Engineering in Medicine 2021, 235, 515–522. [Google Scholar] [CrossRef] [PubMed]
  4. ISO 14243-1:2009; Implants for Surgery—Wear of Total Knee-Joint Prostheses—Part 1: Loading and Displacement Parameters for Wear-Testing Machines with Load Control and Corresponding Environmental Conditions for Test. International Organization for Standardization: Geneva, Switzerland, 2009.
  5. ISO 14243-2:2009; Implants for Surgery—Wear of Total Knee-Joint Prostheses—Part 2: Methods of Measurement. International Organization for Standardization: Geneva, Switzerland, 2009.
  6. ISO 14243-3:2020; Implants for Surgery—Wear of Total Knee-Joint Prostheses — Part 3: Loading and Displacement Parameters for Wear-Testing Machines with Displacement Control and Corresponding Environmental Conditions for Test. International Organization for Standardization: Geneva, Switzerland, 2020.
  7. Harsha, A.P.; Joyce, T.J. Challenges associated with using bovine serum in wear testing orthopaedic biopolymers. Proc. Inst. Mech. Eng. Part H J. Eng. Med. 2011, 225, 948–958. [Google Scholar] [CrossRef] [PubMed]
  8. Brandt, J.M.; Briere, L.K.; Marr, J.; MacDonald, S.J.; Bourne, R.B.; Medley, J.B. Biochemical comparisons of osteoarthritic human synovial fluid with calf sera used in knee simulator wear testing. J. Biomed. Mater. Res. Part A 2010, 94, 961–971. [Google Scholar] [CrossRef] [PubMed]
  9. Galandáková, A.; Ulrichová, J.; Langová, K.; Hanáková, A.; Vrbka, M.; Hartl, M.; Gallo, J. Characteristics of synovial fluid required for optimization of lubrication fluid for biotribological experiments. J. Biomed. Mater. Res. Part B Appl. Biomater. 2017, 105, 1422–1431. [Google Scholar] [CrossRef] [PubMed]
  10. Uhler, M.; Schonhoff, M.; Nees, T.A.; Wonerow, T.; Nuppnau, J.; Mantwill, F.; Kretzer, J.P.; Schroeder, S. Rheological Behavior of Different Calf Sera before, during and after Biomechanical Testing. Lubricants 2022, 10, 224. [Google Scholar] [CrossRef]
  11. Reinders, J.; Sonntag, R.; Kretzer, J.P. How do gait frequency and serum-replacement interval affect polyethylene wear in knee-wear simulator tests? Journal of materials science. Mater. Med. 2014, 25, 2463–2469. [Google Scholar] [CrossRef] [PubMed]
  12. Reinders, J.; Sonntag, R.; Kretzer, J.P. Synovial fluid replication in knee wear testing: An investigation of the fluid volume. J. Orthop. Res. Off. Publ. Orthop. Res. Soc. 2015, 33, 92–97. [Google Scholar] [CrossRef] [PubMed]
  13. Brandt, J.M.; Charron, K.D.; Zhao, L.; MacDonald, S.J.; Medley, J.B. Commissioning of a displacement-controlled knee wear simulator and exploration of some issues related to the lubricant. Proc. Inst. Mech. Eng. Part H J. Eng. Med. 2011, 225, 736–752. [Google Scholar] [CrossRef] [PubMed]
  14. Wang, A.; Essner, A.; Schmidig, G. The effects of lubricant composition on in vitro wear testing of polymeric acetabular components. J. Biomed. Mater. Res. Part B Appl. Biomater. 2004, 68, 45–52. [Google Scholar] [CrossRef] [PubMed]
  15. Abdelgaied, A.; Brockett, C.L.; Liu, F.; Jennings, L.M.; Fisher, J.; Jin, Z. Quantification of the effect of cross-shear and applied nominal contact pressure on the wear of moderately cross-linked polyethylene. Proc. Inst. Mech. Eng. Part H J. Eng. Med. 2013, 227, 18–26. [Google Scholar] [CrossRef] [PubMed]
  16. Saikko, V. Effect of contact pressure on wear and friction of ultra-high molecular weight polyethylene in multidirectional sliding. Proc. Inst. Mech. Eng. Part H J. Eng. Med. 2006, 220, 723–731. [Google Scholar] [CrossRef] [PubMed]
  17. O’Brien, S.T.; Luo, Y.; Brandt, J.-M. In-vitro and in-silico investigations on the influence of contact pressure on cross-linked polyethylene wear in total knee replacements. Wear 2015, 332–333, 687–693. [Google Scholar] [CrossRef]
  18. Wonerow, T.; Uhler, M.; Nuppnau, J.; Kretzer, J.P.; Mantwill, F. Rheologic Behavior of Bovine Calf Serum. Materials 2021, 14, 2538. [Google Scholar] [CrossRef] [PubMed]
  19. Brockett, C.L.; Carbone, S.; Fisher, J.; Jennings, L.M. Influence of conformity on the wear of total knee replacement: An experimental study. Proc. Inst. Mech. Eng. Part H J. Eng. Med. 2018, 232, 127–134. [Google Scholar] [CrossRef] [PubMed]
  20. Schwiesau, J.; Schilling, C.; Utzschneider, S.; Jansson, V.; Fritz, B.; Blomer, W.; Grupp, T.M. Knee wear simulation under conditions of highly demanding daily activities--influence on an unicompartmental fixed bearing knee design. Med. Eng. Phys. 2013, 35, 1204–1211. [Google Scholar] [CrossRef] [PubMed]
  21. McEwen, H.M.; Barnett, P.I.; Bell, C.J.; Farrar, R.; Auger, D.D.; Stone, M.H.; Fisher, J. The influence of design, materials and kinematics on the in vitro wear of total knee replacements. J. Biomech. 2005, 38, 357–365. [Google Scholar] [CrossRef] [PubMed]
  22. Bortel, E.; Charbonnier, B.; Heuberger, R. Development of a Synthetic Synovial Fluid for Tribological Testing. Lubricants 2015, 3, 664–686. [Google Scholar] [CrossRef]
  23. Scholes, S.C.; Joyce, T.J. In vitro tests of substitute lubricants for wear testing orthopaedic biomaterials. Proc. Inst. Mech. Eng. Part H J. Eng. Med. 2013, 227, 693–703. [Google Scholar] [CrossRef] [PubMed]
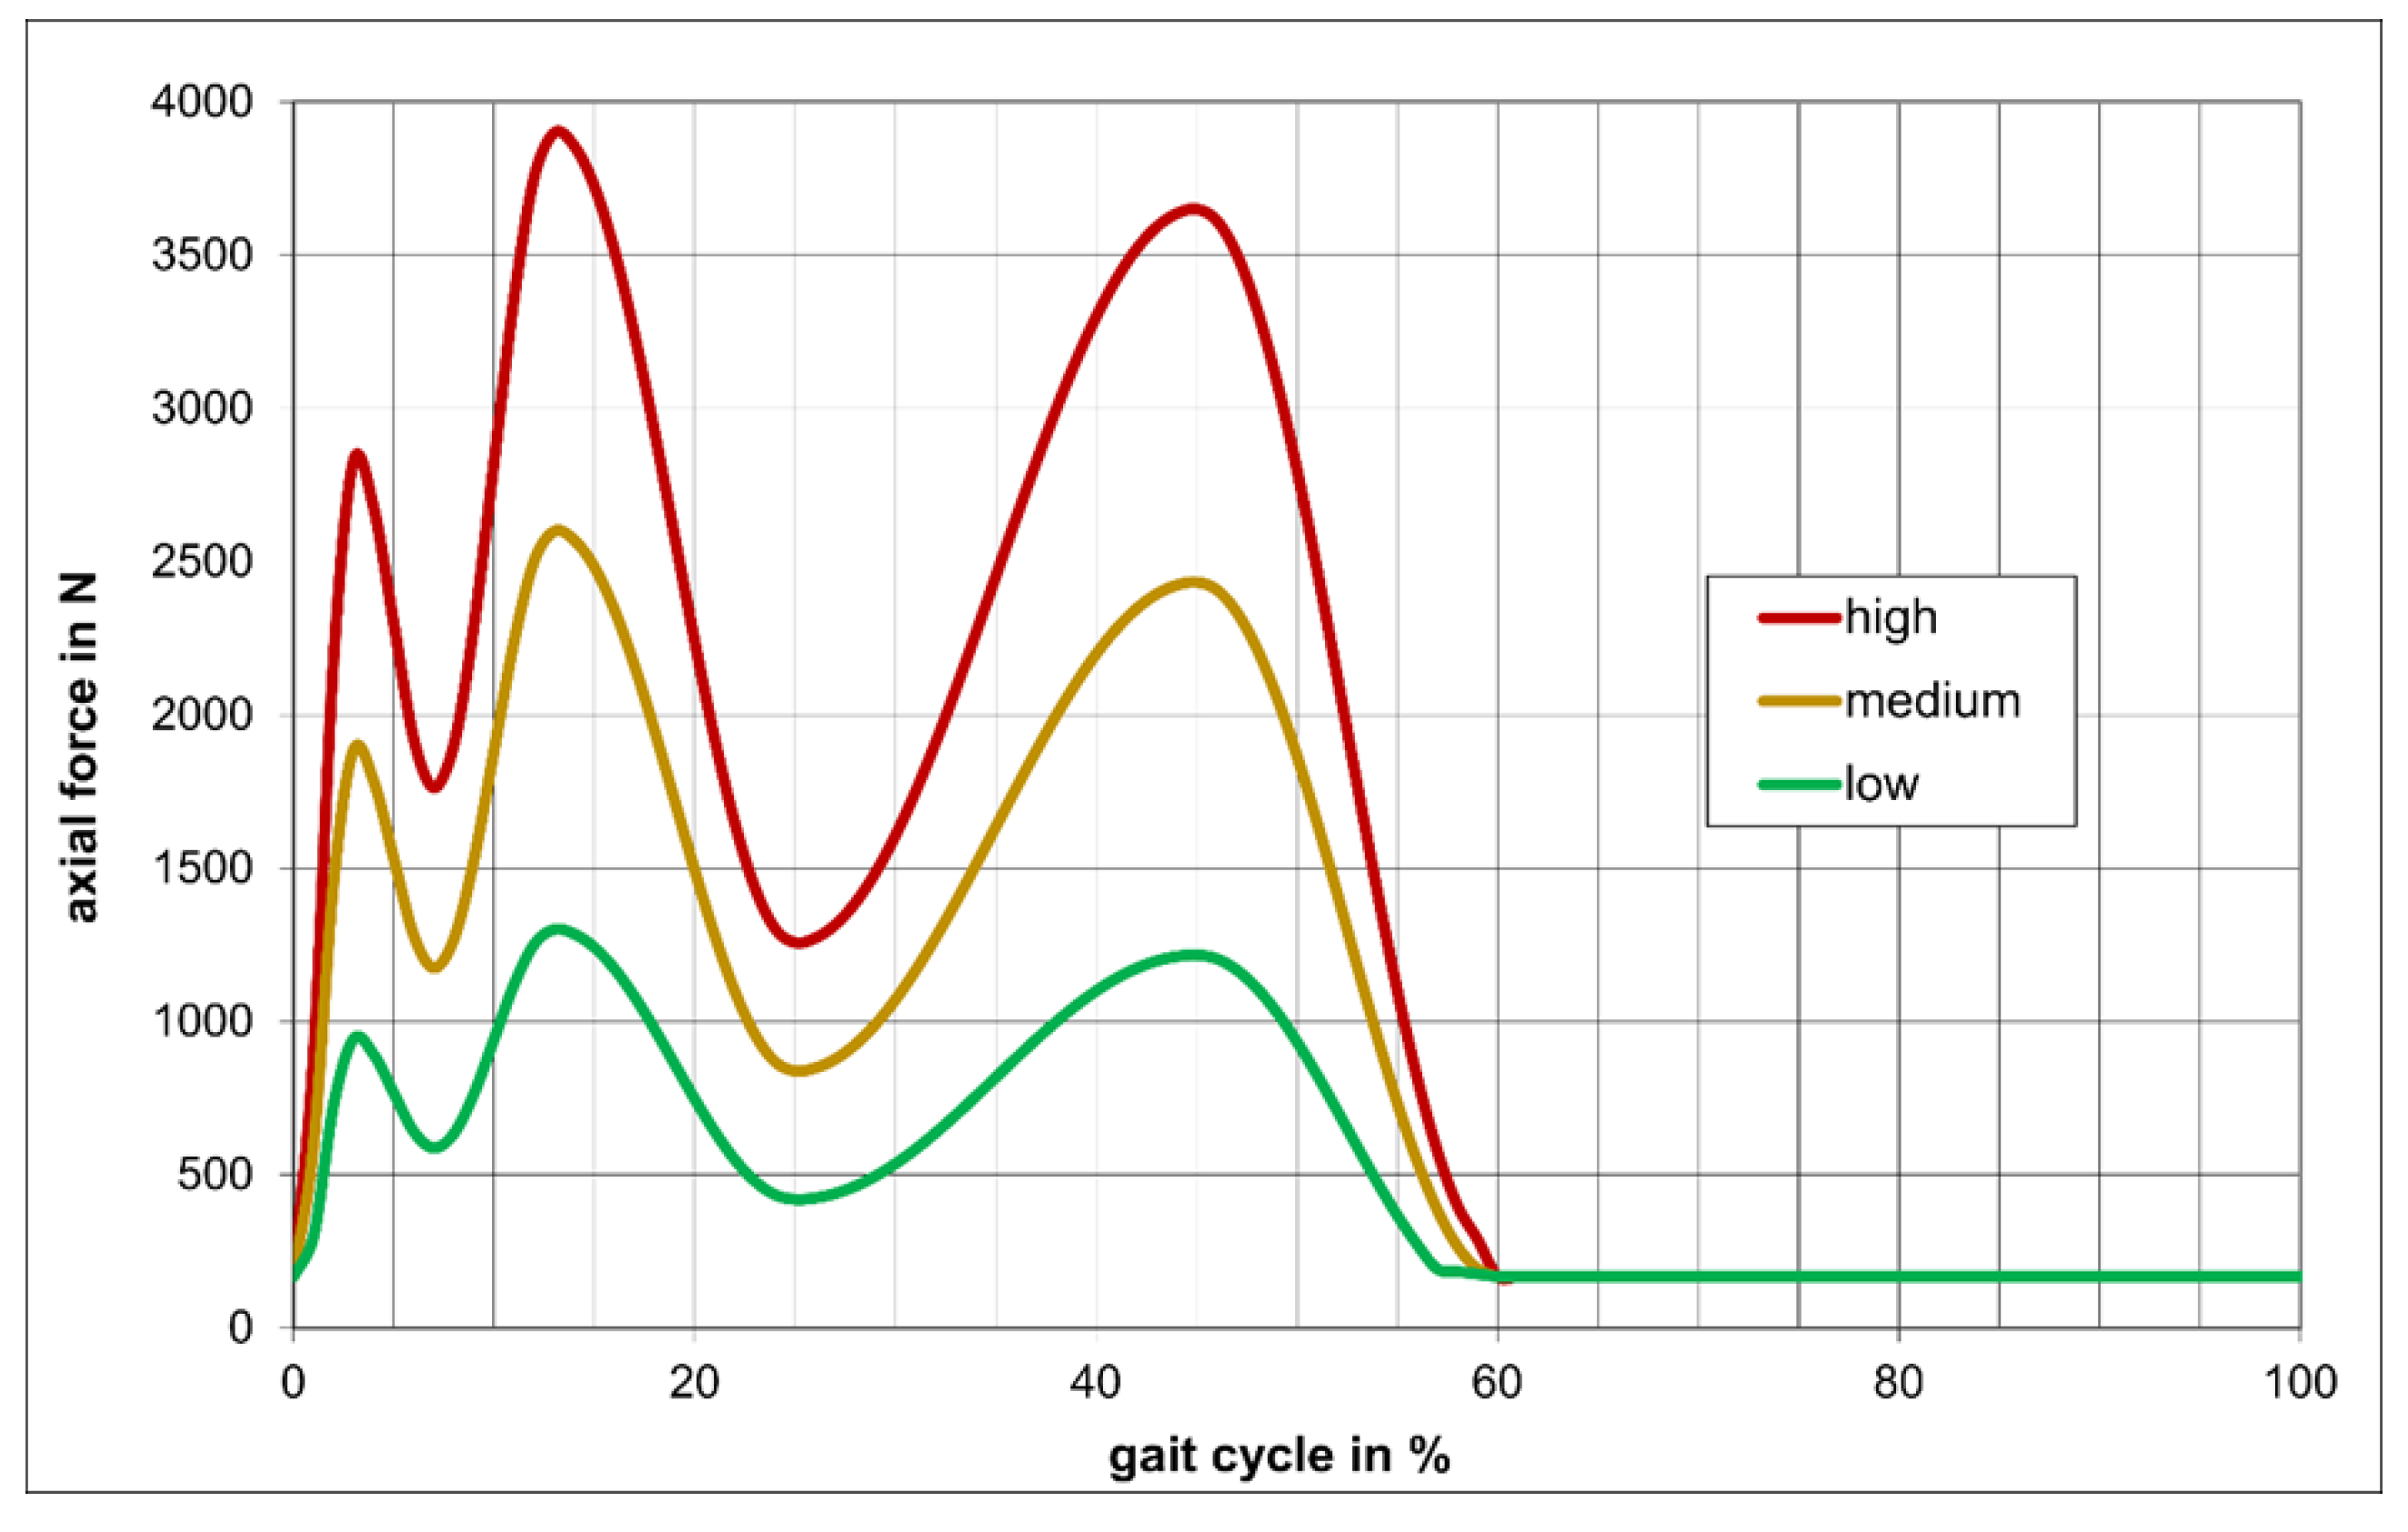
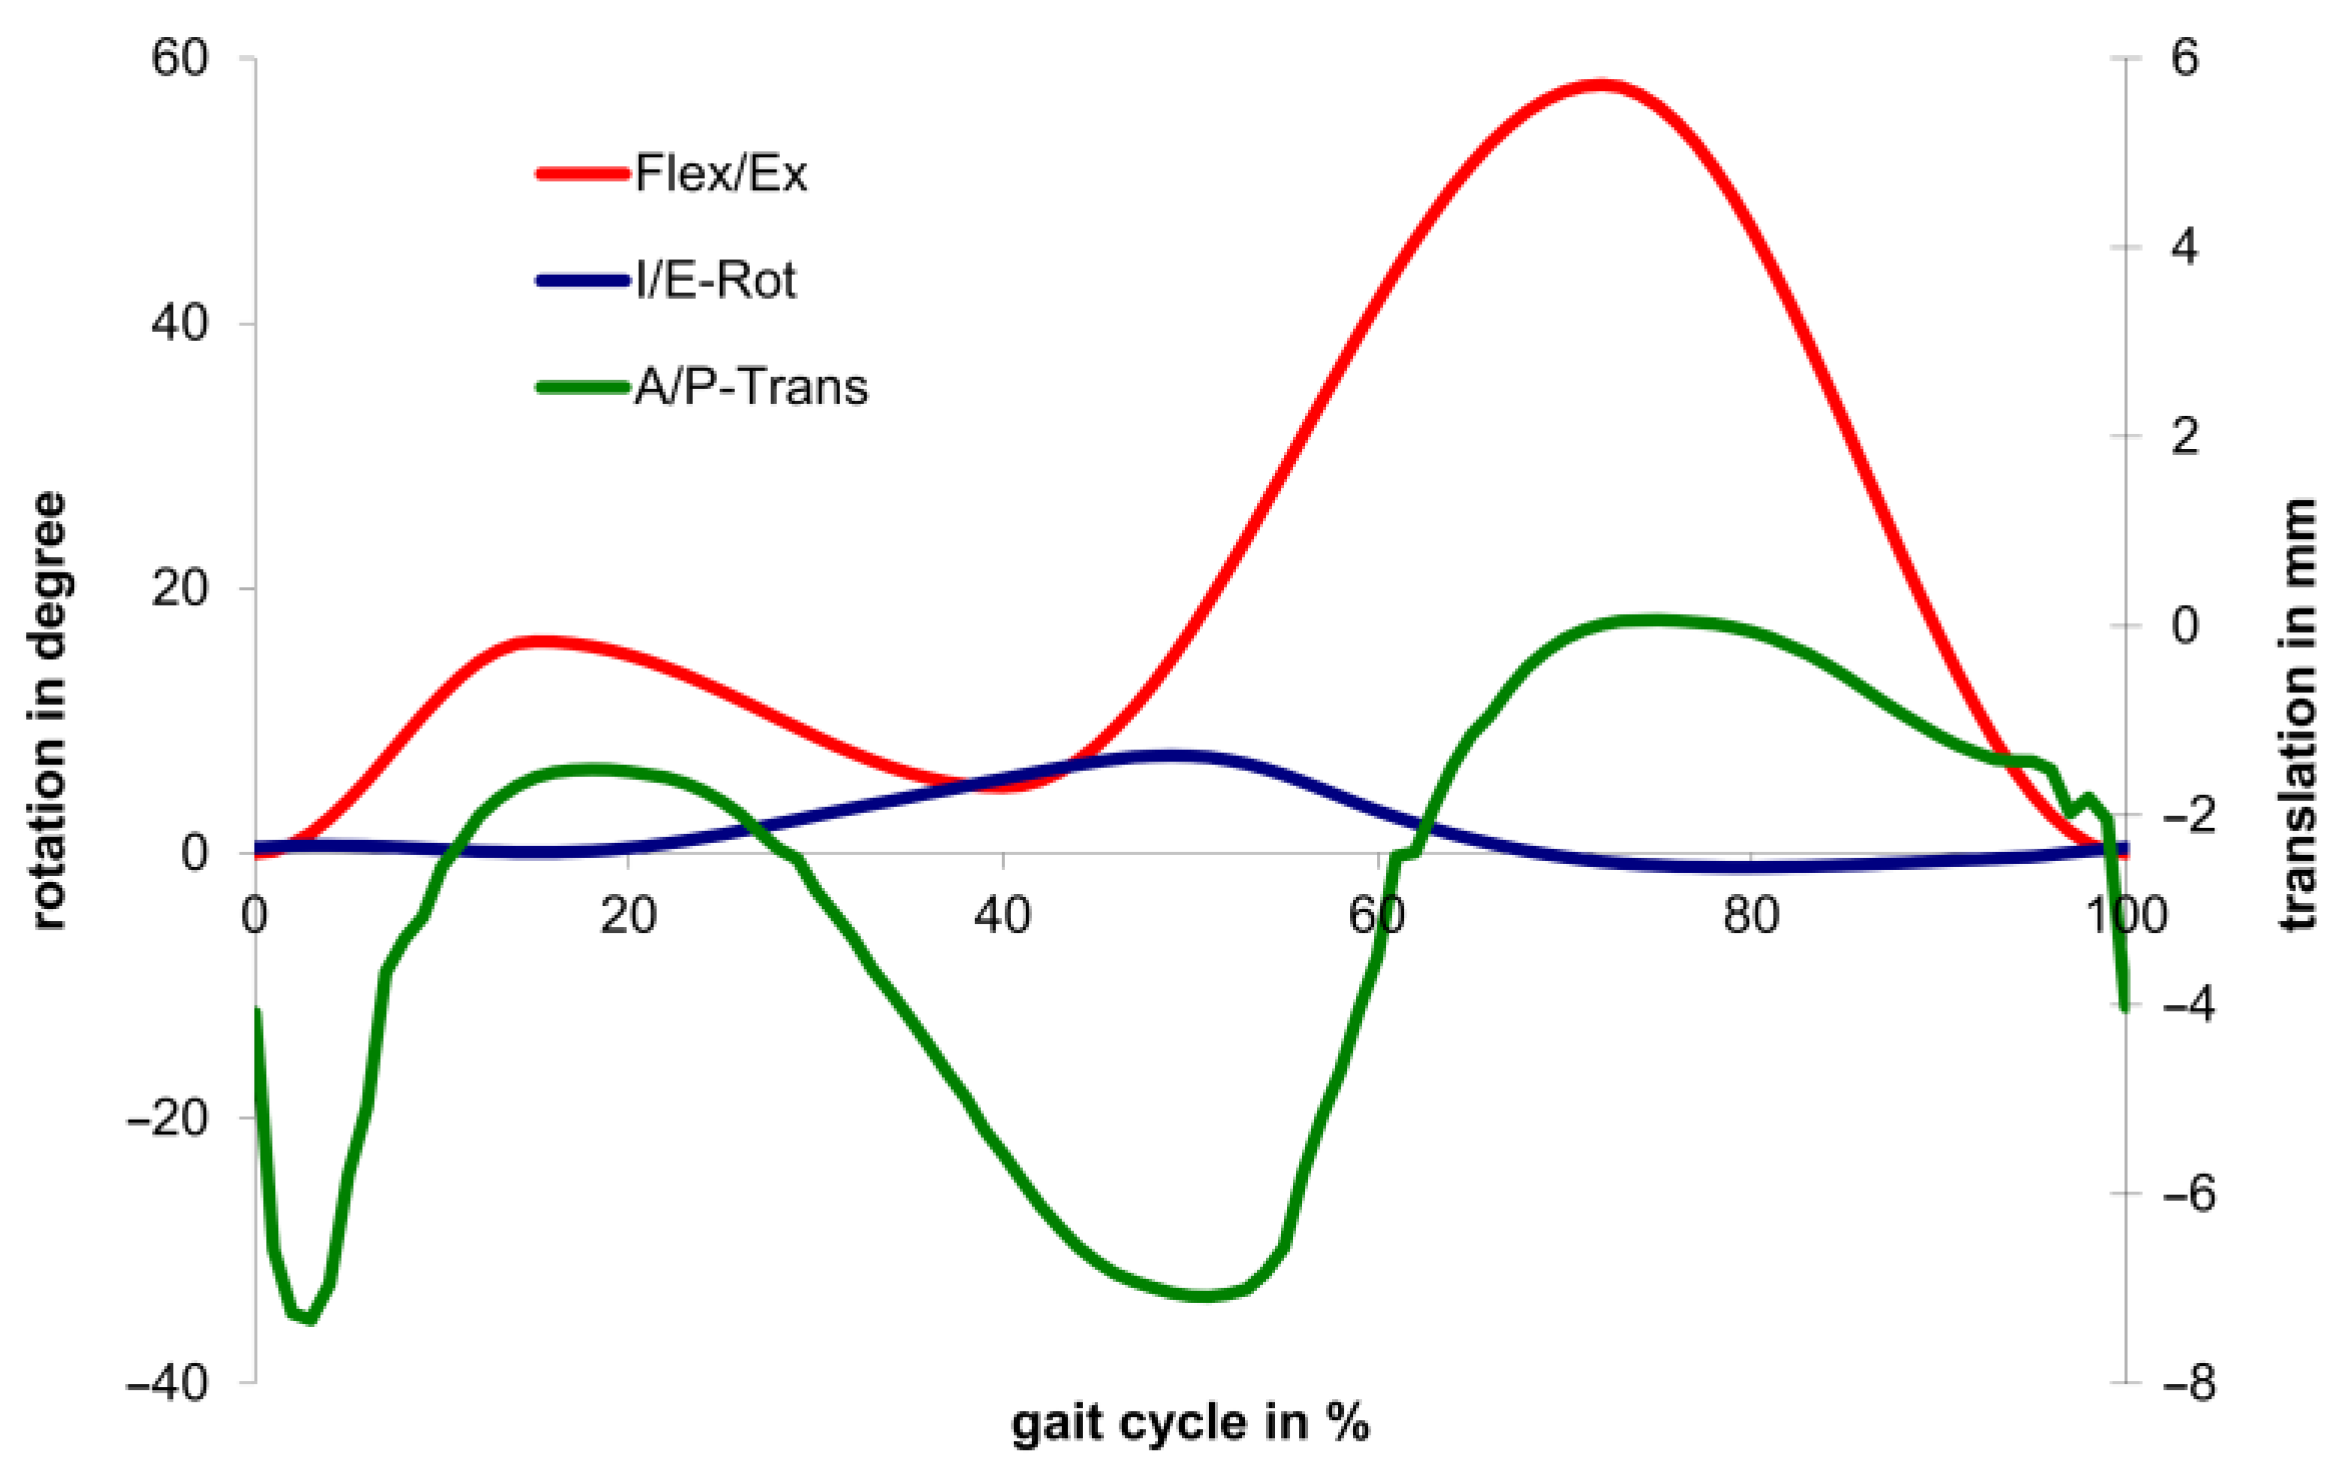
Figure 1. Applied load curves for the low, medium, and high loading condition.
Lubricants 11 00474 g001
Figure 2. Applied kinematics, separated in flexion and extension (Flex/Ex), internal and external rotation (I/E-Rot), as well as translation in the anterior–posterior direction (A/P-Trans).
Lubricants 11 00474 g002
Figure 3. Wear rates for the low, medium, and high-load levels.
Lubricants 11 00474 g003
Figure 4. Contact pressure and contact area for the low, medium, and high loading condition between the medial, as well as lateral, condyle and the polyethylene insert.
Lubricants 11 00474 g004
Figure 5. Dynamic viscosity as a function of the shear rate for the low, medium, and high loading condition, as well as the reference fluid.
Lubricants 11 00474 g005
Figure 6. Boxplot graphs for the dynamic viscosity as a function of the shear rate for the low, medium, and high loading condition, as well as the reference fluid. Outliers are shown by a red star and they are defined by values that are more than 1.5 times of the interquartile range away from the top or bottom of a box.
Lubricants 11 00474 g006
Table 1. Kinematics and compression forces for the low, medium, and high loading condition, used to investigate the contact pressures and contact areas between the femoral condyles and the polyethylene insert.
Gait Cycle
in %
Flex/Ex
in °
I/E-Rot
in °
A/P-Trans
in mm
Axial Force
in N (Low)
Axial Force
in N (Medium)
Axial Force
in N (High)
1315.30.1−1.81300.02600.03900.0
2611.51.7−2.0424.0848.01272.0
395.005.4−5.31052.42104.73157.2
5221.47.0−7.1709.51419.02128.5
Table 2. Dynamic viscosities (mean ± standard deviation) for the low, medium, and high loading conditions, as well as the reference fluid, at the shear rates 101 s−1, 102 s−1, and 103 s−1.
Shear Rate in s−1LowMediumHighReference
1010.97 ± 0.030.93 ± 0.010.99 ± 0.041.12 ± 0.10
1020.94 ± 0.020.92 ± 0.010.95 ± 0.020.87 ± 0.01
1030.97 ± 0.010.95 ± 0.011.03 ± 0.020.84 ± 0.01
Disclaimer/Publisher’s Note: The statements, opinions and data contained in all publications are solely those of the individual author(s) and contributor(s) and not of MDPI and/or the editor(s). MDPI and/or the editor(s) disclaim responsibility for any injury to people or property resulting from any ideas, methods, instructions or products referred to in the content.

