Article

Static Performance Measurements and Model Predictions of Gas Foil Thrust Bearing with Curved Incline Geometry

School of Mechanical Engineering, Kookmin University, Seoul 02707, Republic of Korea
*
Author to whom correspondence should be addressed.
Lubricants 2023, 11(11), 480; https://doi.org/10.3390/lubricants11110480
Submission received: 20 August 2023 / Revised: 25 October 2023 / Accepted: 1 November 2023 / Published: 7 November 2023
(This article belongs to the Special Issue Selected Papers from the K-TRIB2023)

Abstract

:
Gas foil thrust bearings (GFTBs) have been successfully used to support the axial load of oil-free microturbomachinery with low drag friction due to the low viscosity of gas or air used as a bearing lubricant. However, the widespread use of GFTBs in various high-power turbomachinery still needs reliable test data and an accurate predictive model. This research measures the height profile of a test GFTB to determine its actual incline geometry and estimate the drag torque of the GFTB. The measured GFTB height profile demonstrates that the incline geometry is closer to a quadratic curve than a line, which has been conventionally used to model GFTBs mathematically. The newly developed GFTB test rig is used to measure the lift-off speed, drag torque, and maximum load capacity of the test GFTB. A series of rotor speed-up tests estimate that the lift-off speeds of the GFTB increase with the increase in preloads. The maximum load capacity is determined by increasing the static load on the GFTB until a sudden sharp peak in the drag torque appears. The new GFTB model using quadratic incline geometry is in suitable agreement with the measured height profile of the GFTB incline and measured drag torque during the load capacity test. In addition, a comparison of the predicted GFTB performances reveals that the quadratic incline geometry model predicts a higher load capacity than the linear model.

1. Introduction

Gas foil bearings (GFBs) are hydrodynamic bearings that use air or gas as a lubricant to support radial or axial loads. GFBs (gas foil journal bearings, GFJBs, and gas foil thrust bearings, GFTBs) have low friction and long life due to their non-contact operation, unlike the rolling element bearings used in high-speed rotating machinery. GFBs also facilitate the design of a rotating system with less weight, fewer parts, no oil contamination, and better environmental friendliness than those supported on oil-lubricated bearings, which is achieved by removing the equipment for oil supply systems. Due to their advantages over conventional bearings, GFBs have applications such as aircraft air cycle machines, micro-gas turbines, turbocompressors, and supercritical carbon dioxide (SCO2) power system turbomachinery [1,2,3]. However, the demand for using GFTBs in highly efficient turbomachinery with high axial loads is increasing. Therefore, various predictive and experimental studies have been conducted over the decades to improve the load capacity and friction performance of GFTBs. Those studies focused on the effects of the compliant structure design on the bearing performance.
Heshmat et al. [4] first presented the mathematical model of GFTBs and analyzed the effect of the structural and geometric parameters on the load capacity of GFTBs. Iordanoff [5] proposed models of the compliance coefficient for bumps with free–free ends and bumps with free–fixed ends. The stiffness coefficient for bumps with free–free ends is similar to that proposed in [4], whereas the bumps with free–fixed ends exhibited a higher stiffness coefficient. Dellacorte and Balco [6] suggested a rule of thumb (ROT) model to predict the load capacity of GFJBs. The presented model revealed a linear relationship between rotating speed and load capacity over the range of rotating speeds of interest. The authors suggested that the extension of the concept of the ROT to GFTBs was not possible due to the lack of sufficient experimental data. Dickman [7] conducted experiments on the static load and drag torque performances of the GFTB. The test results showed that the drag torque increases linearly with increasing speed until the top foil distorts and thermal runaway occurs due to thermal effects. In addition, the drag torque increases with increasing static load at the same speed. Dykas et al. [8,9,10] presented the necessity for the thermal management of GFTBs to prevent performance degradation. They also investigated the effect of cooling flow on the bearing performance. The test results showed that the load capacity of the GFTB increases with increasing cooling flow, particularly at high rotor speeds. In addition, a small amount of axial thermal conduction through the runner thickness was found to cause significant distortion of the runner surface, and the heat transfer design of the runner was important for maintaining a constant film thickness. Park et al. [11] conducted a theoretical study on the effect of thrust runner tilting angle on the static performance of GFTBs. The predicted results showed that as the tilting angle of the runner increased, the local-area film thickness decreased, and the load-bearing capacity and drag torque of the bearing increased. Lee et al. [12] performed static performance tests on GFTBs with outer radii of 45, 50, and 55 mm at rotor speeds between 10,000 and 25,000 rpm. The bearing load capacity increases with increasing the rotor speed and bearing outer diameter. Balducchi et al. [13] conducted an experimental study on the effects of static load and rotor speed on the start-up, driving, and touch-down torques of the GFTB. The test results showed that the start-up and touch-down torques increase linearly with increasing static load. The measured lift-off speed increases nonlinearly with increasing static load, and the measured driving torque in the hydrodynamic lubricant region increases linearly with increasing static load and rotor speed. Lee and Kim [14] introduced a hybrid GFTB that can be externally pressurized through an orifice to improve the load-bearing capacity of the GFTB. The authors revealed through an analytical study that the hybrid GFTB can not only improve the load capacity of the GFTB but also reduce the wear occurring at start-up and touch-down. San Andres et al. [15] predicted the static and dynamic performance of GFTBs applied to oil-free turbochargers. The numerical model integrated a finite element model of the top foil and bump strip layers with that of the gas film flow field. The predicted drag torque for increasing rotor speed and static load were compared with published test data in Ref. [7] for model validation. The paper also presented the predicted pressure fields, minimum film thickness, and stiffness and damping coefficients for increasing speed and load. Feng et al. [16] predicted the static and dynamic characteristics of GFTBs using the link-spring model. The analytical model was validated through comparisons with the published experimental results in Ref. [7]. The authors analyzed the effects of rotor speed, minimum film thickness, and the ratio of the inlet to outlet film thickness on the bearing performance. The model predictions revealed that the static load and drag torque of the GFTB increase with increasing rotor speed and decreasing minimum film thickness. Similarly, the stiffness and damping decrease with increasing speed and film thickness. Gad and Kaneko [17] introduced new bump foil designs based on second-generation GFTBs and predicted the static and dynamic performance characteristics of the bearings. The authors mainly analyzed the effect of bum foil stiffness with different designs in bump pitch, number of bumps and bump foils, and bump foil location on the bearing load capacity. The model predictions suggested that incorporating bump stiffeners results in the highest bump stiffness, thus revealing the highest load capacity for GFTBs. Kim et al. [18] conducted a parametric study on the optimal design of a GFTB to maximize its load capacity using the Reynolds equation with isothermal, isoviscous, and ideal gas assumptions and the simple elastic foundation model for the foil structure. The authors also conducted experiments to measure the load capacity of the bearing, which were in suitable agreement with the model prediction. The study found that there exists an optimum incline (ramp) height of the foil structure to achieve the maximum load capacity. Lehn et al. [19,20] presented a thermo-elasto-hydrodynamic model for GFTBs. They used shell theory to model the structures of the top and bump foils and calculated the hydrodynamic pressure and temperature by solving the Reynolds equation and the three-dimensional (3D) energy equation, respectively. The model also considered the deformation of the rotor disk due to the thermal runaway. The model predictions revealed that the load capacity of the GFTB increases with rotor speed only up to a certain limit. It starts decreasing above that limit. The authors attributed this unique phenomenon to uneven pressure distribution due to the unfavorable gap function caused by disk bending under the influence of heat. Kim and Park [21] developed a vertical test rig for GFTBs with a maximum rotating speed of 30 krpm and conducted bearing torque and load capacity performance tests. The measured start-up torque of GFTBs in the developed vertical test rig was smaller than that in Ref. [9] data and similar to that in Ref. [14] data. However, it was approximately twice or higher in the case of driving torque. The authors estimate the high torque of the vertical test rig that the contact maintained even after lift-off resulted in the friction torque being higher than that in the horizontal test rig. Fu et al. [22] studied the effect of the GFTB pad configuration on the static performance of the bearing using a 3D computational fluid dynamics (CFD) model. The predicted bearing load capacity and drag torque were compared to the results in Ref. [17] for model validation. The authors used the design of experiments (DOE) tool in CFD to optimize the foil geometry with the objective of maximizing the load capacity and minimizing the maximal temperature. LaTray and Kim [23,24,25] developed a test rig and conducted experiments on the GFTB up to a maximum rotating speed of 155 krpm at a load capacity of 75 N. The authors also presented a theoretical model with the top foil structure modeled as a 2D thin plate. In general, the measured and predicted power loss were in suitable agreement, except at speeds higher than 130 krpm. Guenat and Schiffmann [26] studied the bearing combined with a spiral groove shape that helps form a hydrodynamic wedge effect on the top foil to improve the load capacity and reduce the friction loss of the GFTB. The authors developed a prediction model using narrow groove theory based on Heshmat’s prediction model [4]. The predicted results revealed that the optimal groove design can improve the load capacity by up to 70% at the same rotor speed and film thickness and reduce the drag torque by up to 40% at the same static load. Samanta and Khonsari [27] studied on the theoretical maximum load-carrying capacity of gas foil thrust bearings. In the Reynolds equation for calculating the load capacity of the bearing, the rotor speed was assumed to be infinite, and then the maximum load capacity of the bearing was then calculated using a simple calculation method. Ricken et al. [28] analyzed the effect of three GFTB top foil materials (Inconel, Duracon, CuNi1Si) with different heat conductivity coefficients on bearing performance. Reynolds equation was used to determine the hydrodynamic behavior of film thickness, and foil deformation was considered using Reissner–Mindlin-type shell theory. According to the prediction results, at the same rotor speed, the maximum temperature of Inconel foil was 250 K, Duracon foil was about 206 K, and CuNi1Si foil was 182 K.
Thus far, theoretical and experimental studies have been conducted to determine the load-carrying capacity of GFTBs, and increase their maximum value. However, in most studies to date, the mathematical model for the incline of GFTBs has been assumed to be a linear shape without considering the actual geometry. The present study aims to add findings on the load capacity of a GFTB with a curved taper–flat land geometry. The measurement estimates the height distribution of the test GFTB, and a newly developed test rig identifies the load capacity and drag torque of the bearing. A mathematical model benchmarks the measured incline geometry (curved taper–flat land) and the static performance measurements.

2. Materials and Methods

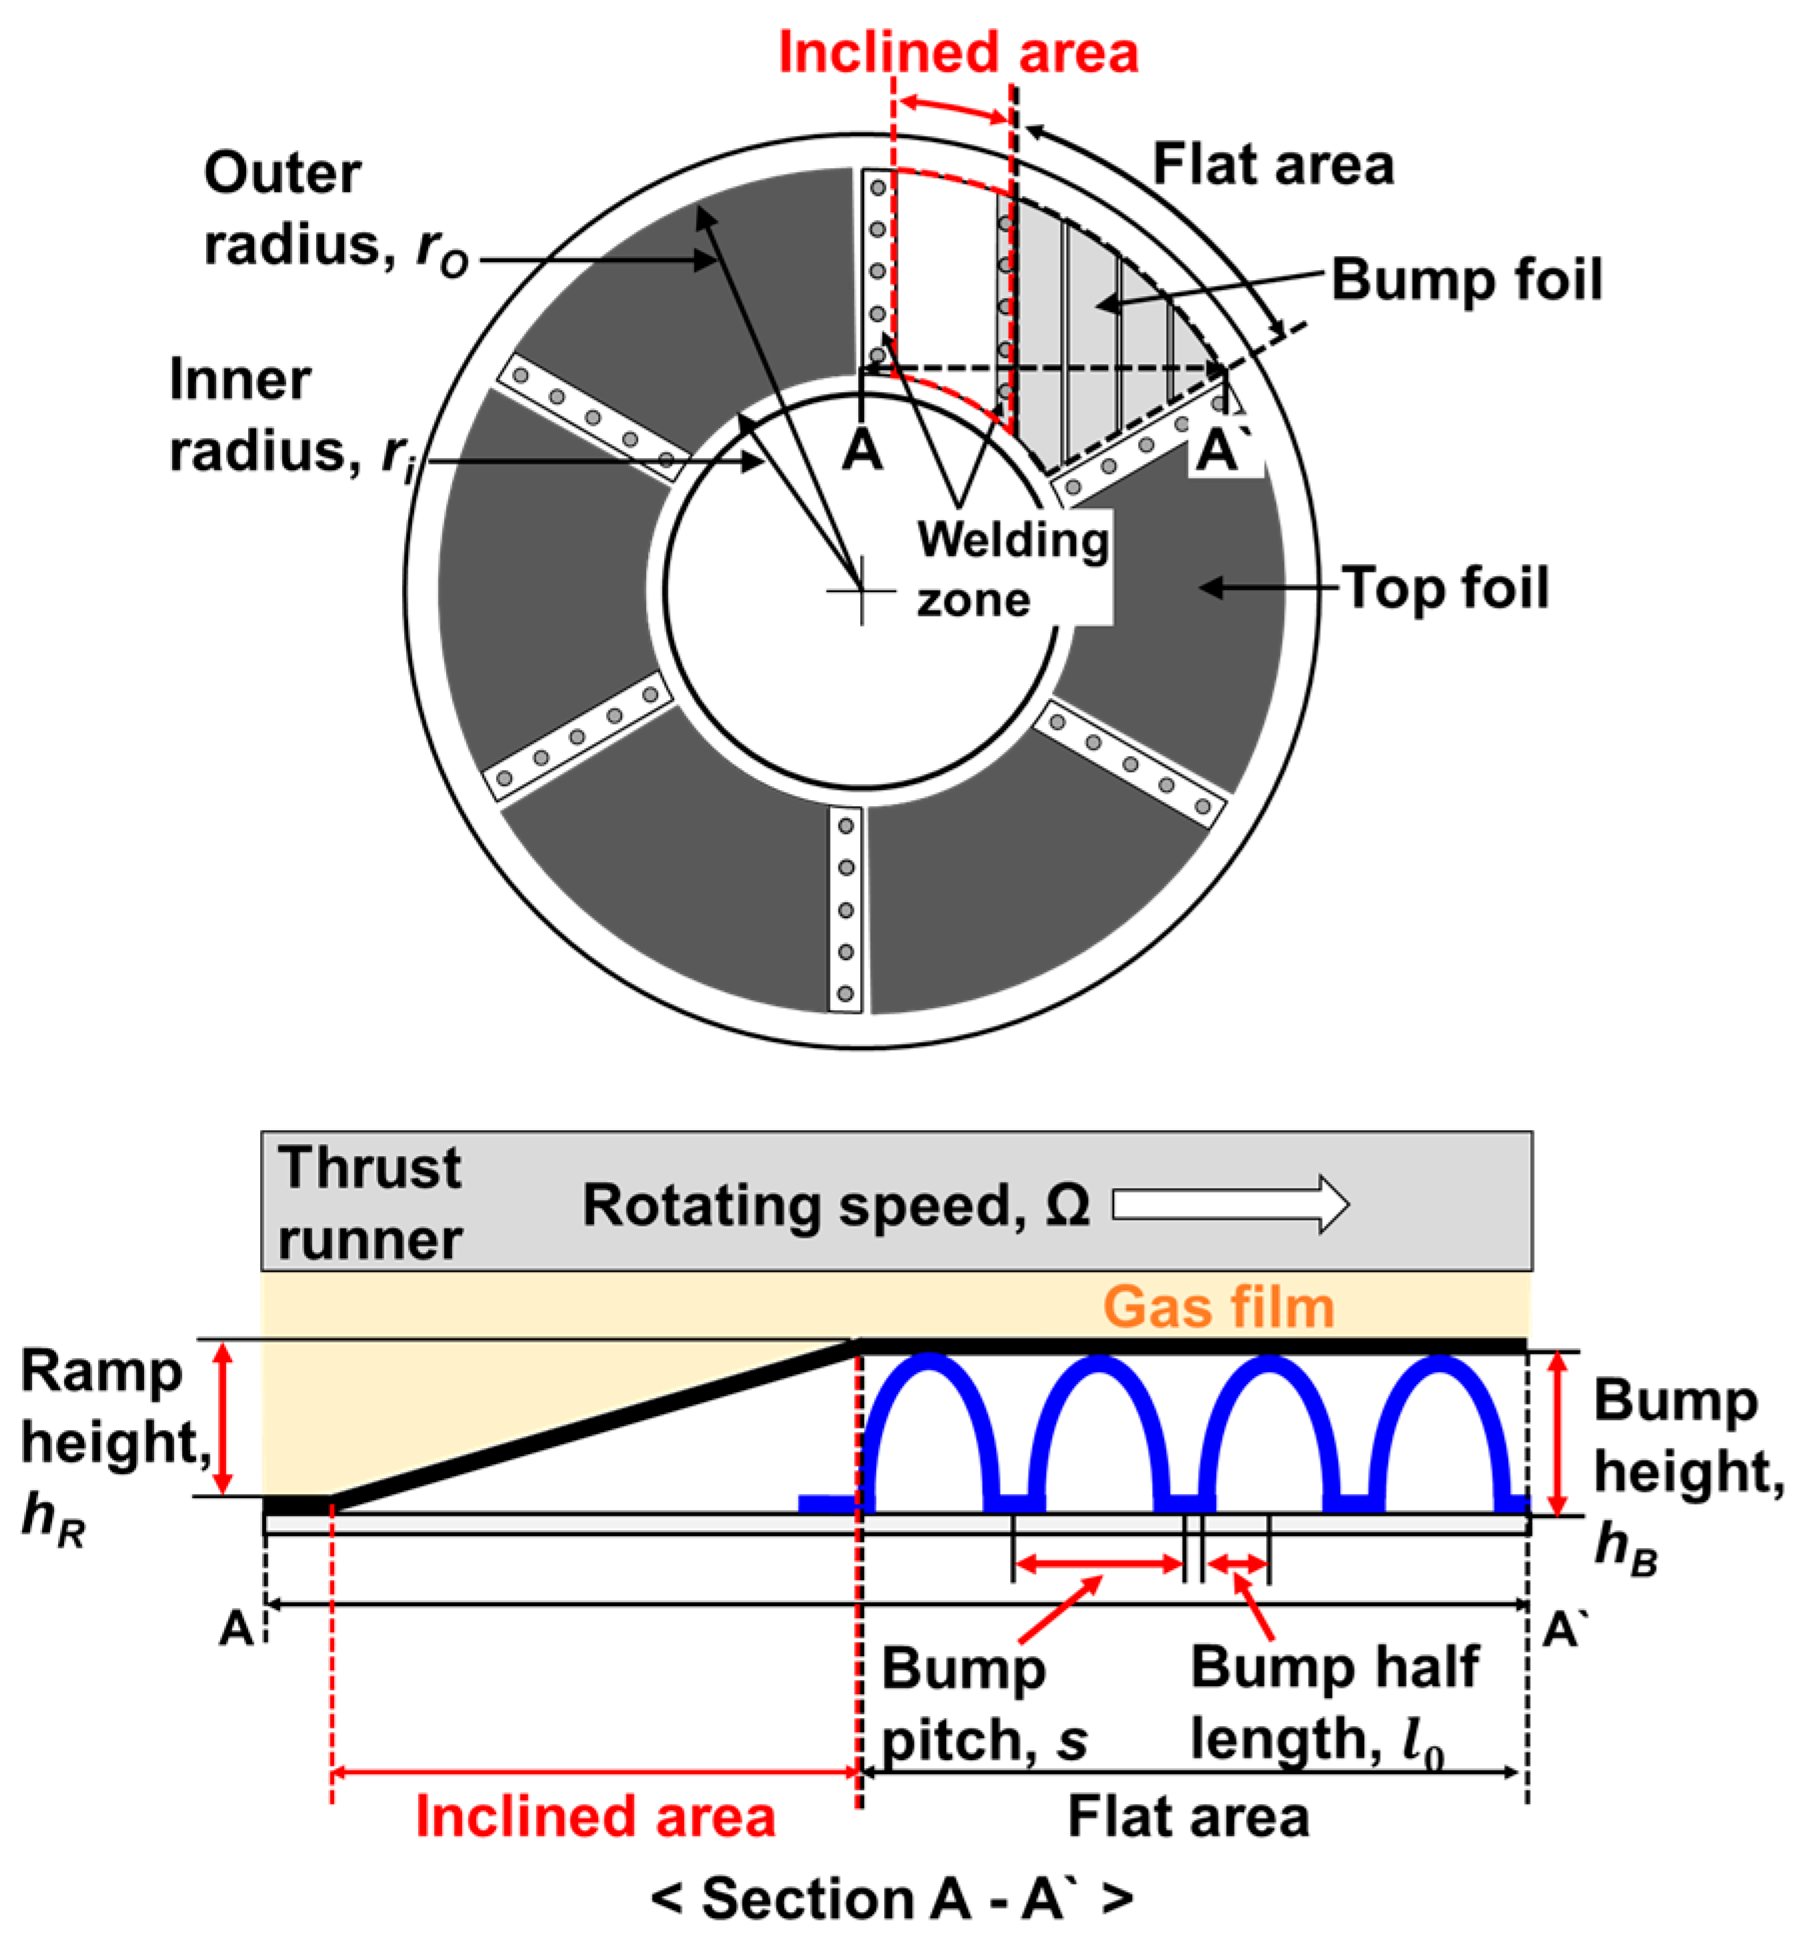
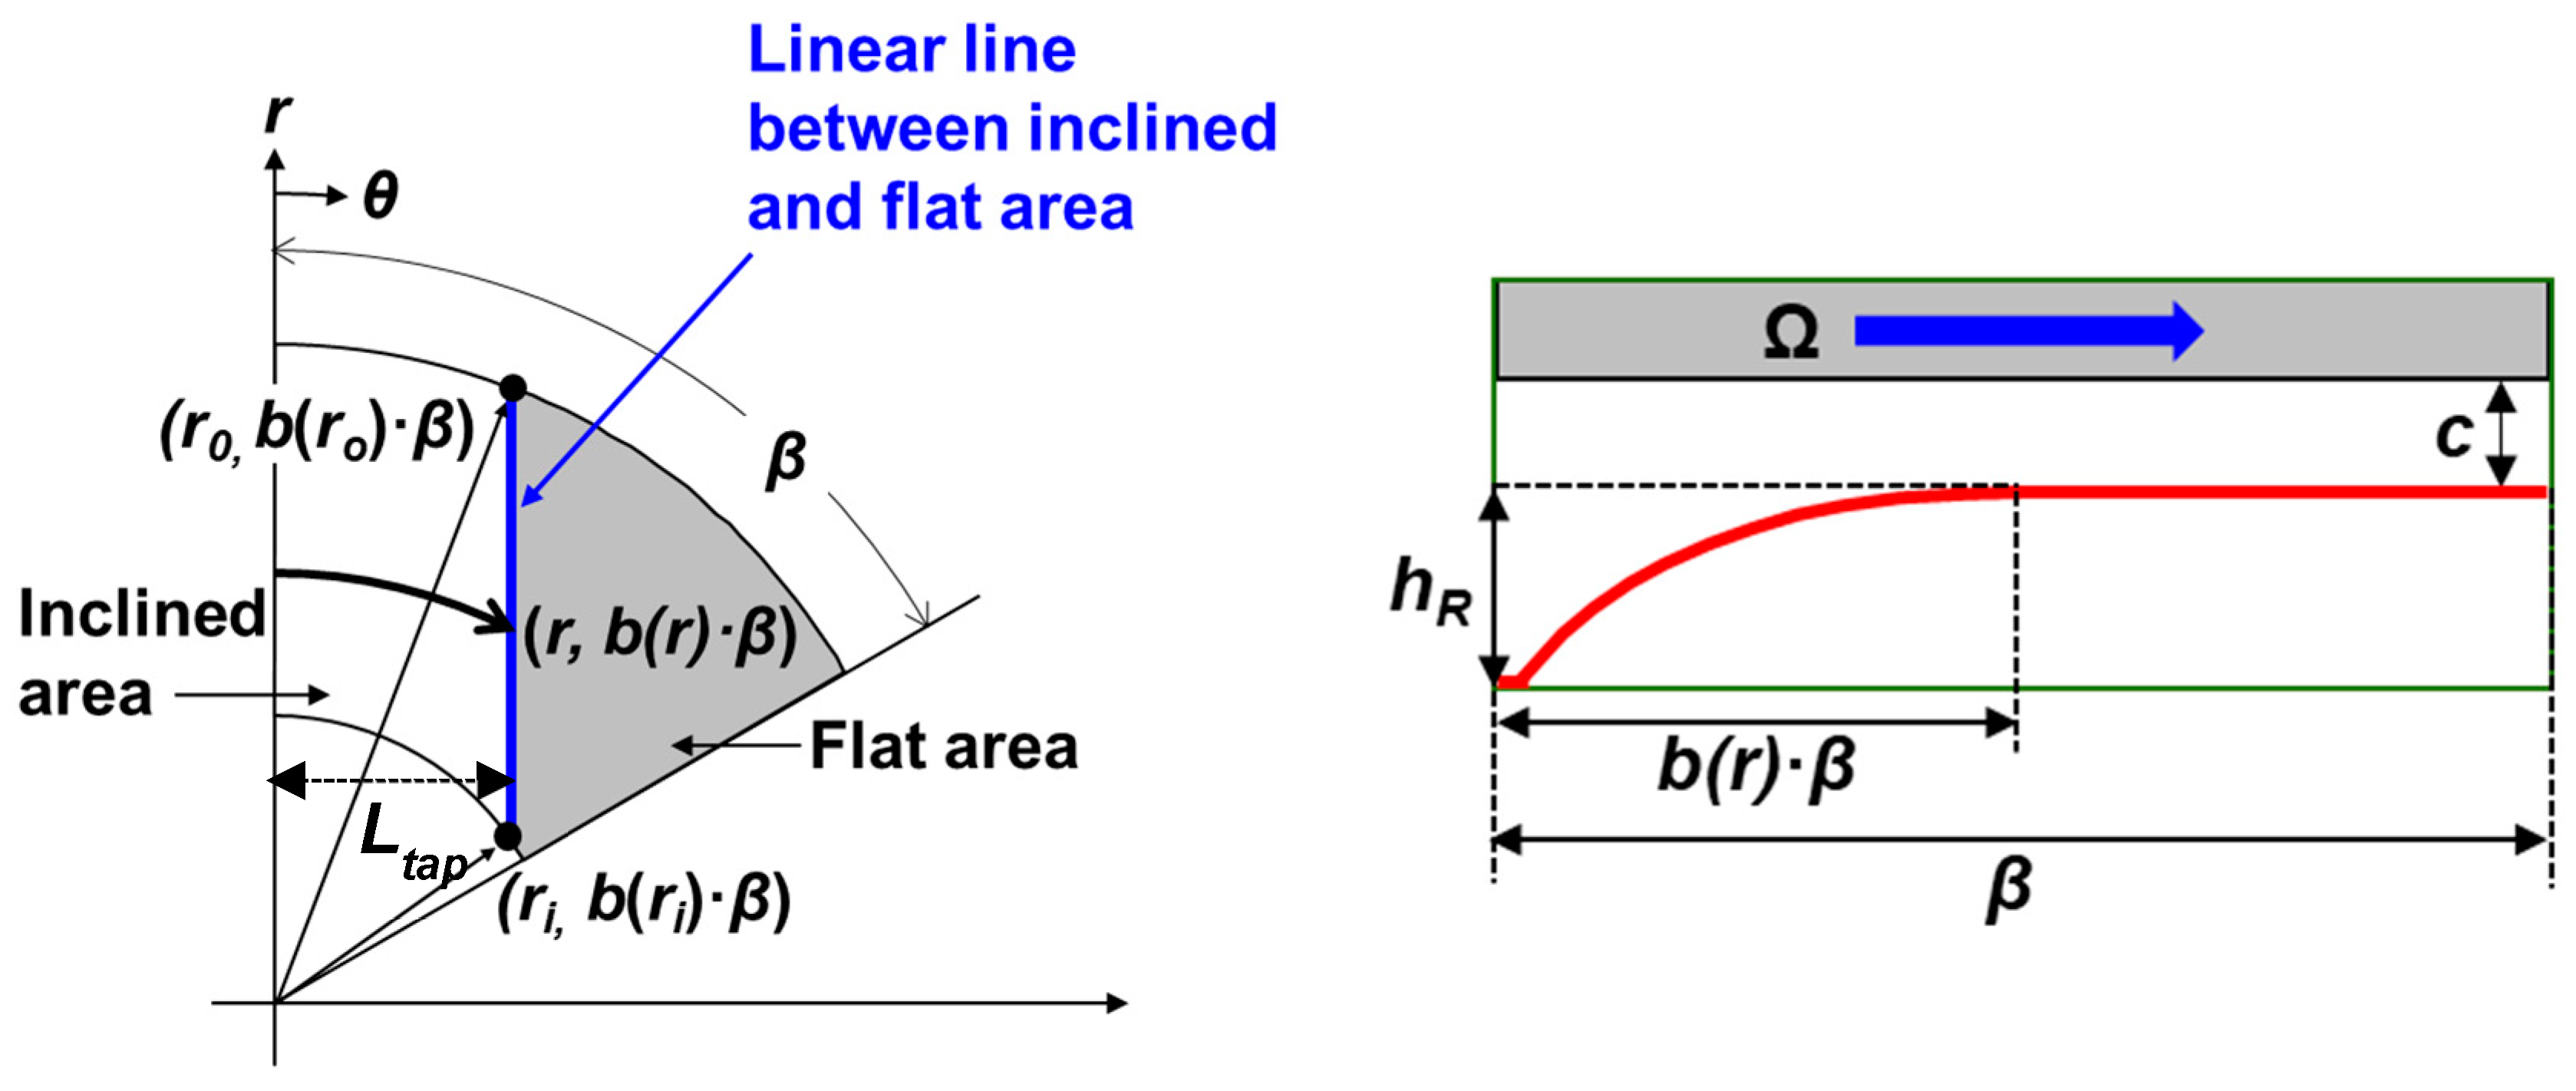
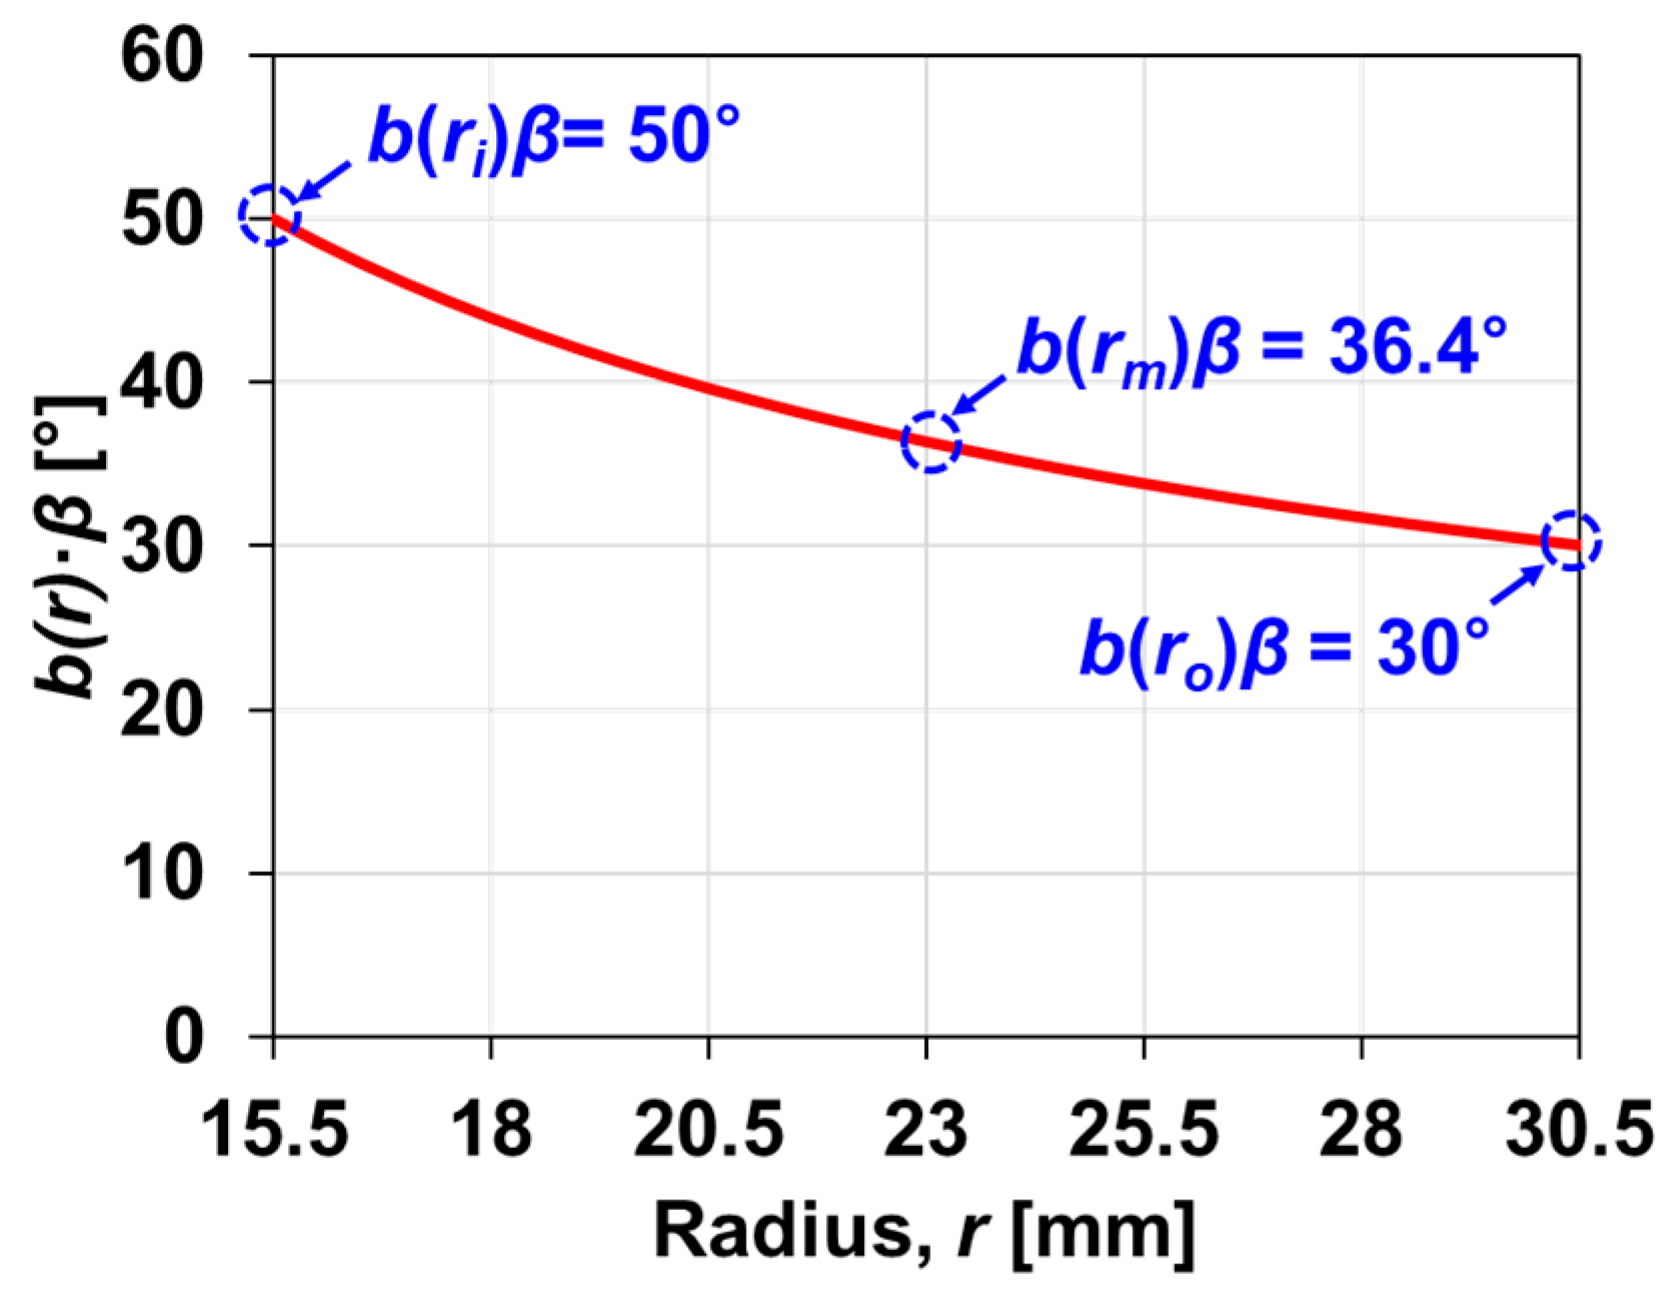
2.1. Gas Foil Thrust Bearing

Figure 1 shows a schematic of the test GFTB with six pads consisting of the bump foil and top foil as elastic structures and the section (A-A`) view of a single pad. The bump foil and top foil were welded at the leading edge only. The top foil consists of two distinct regions: an inclined area without a bump foil and a flat area with a bump foil. The combination of the inclined and flat regions creates a hydrodynamic wedge effect in GFTBs when the thrust runner rotates. Table 1 presents the structural design parameters and material properties of the test GFTB. The outer and inner radii of the top foil are 30.5 mm and 15.5 mm, respectively. The bearing has six pads, each with an angular extent of 55°. The bump height and incline (ramp) height are 500 μm. The pitch, half-length, and thickness of the bump foil are 3.2 mm, 1.4 mm, and 90 μm, respectively. The thickness of the top foil is 200 μm, which is thicker than that of the bump foil.

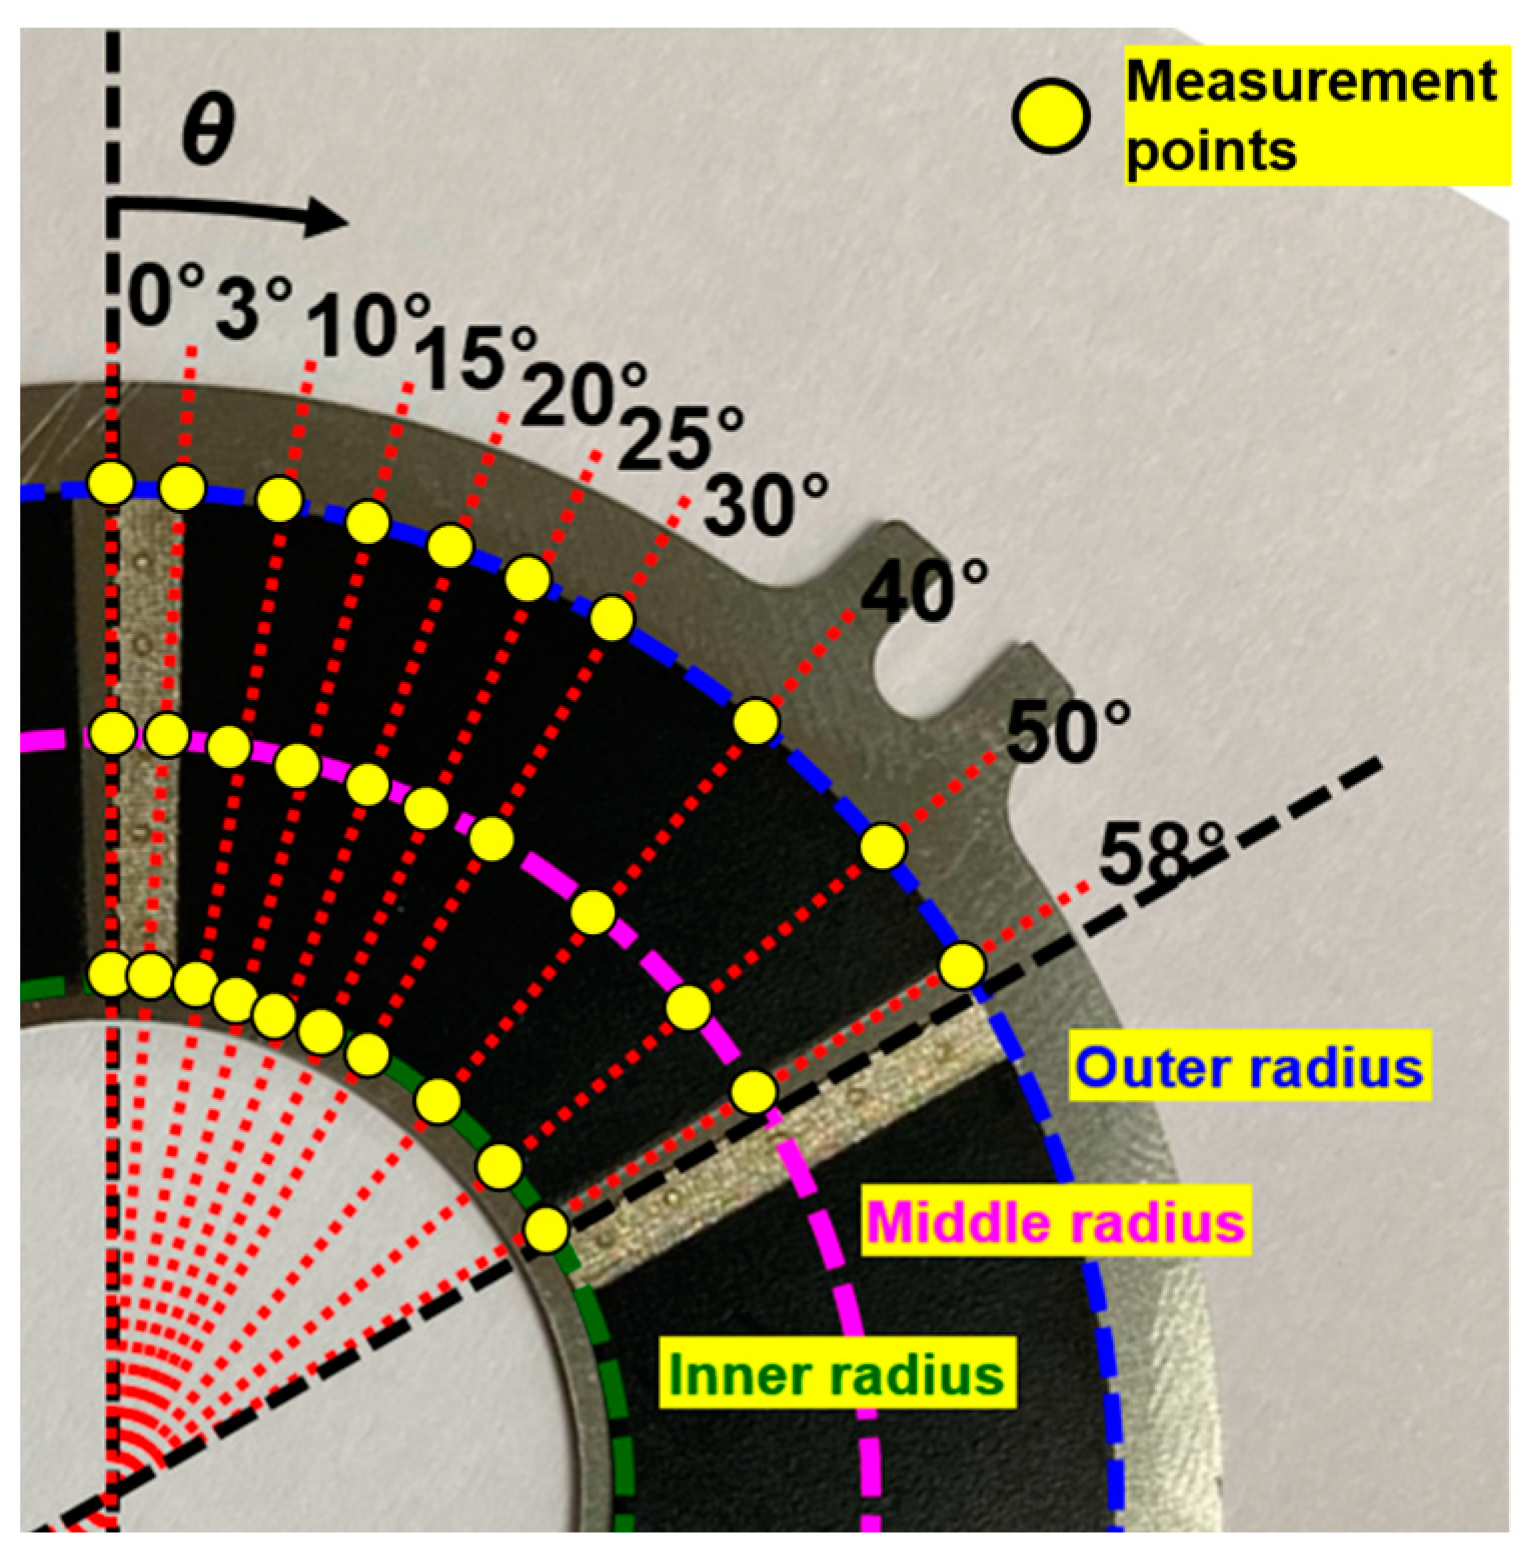
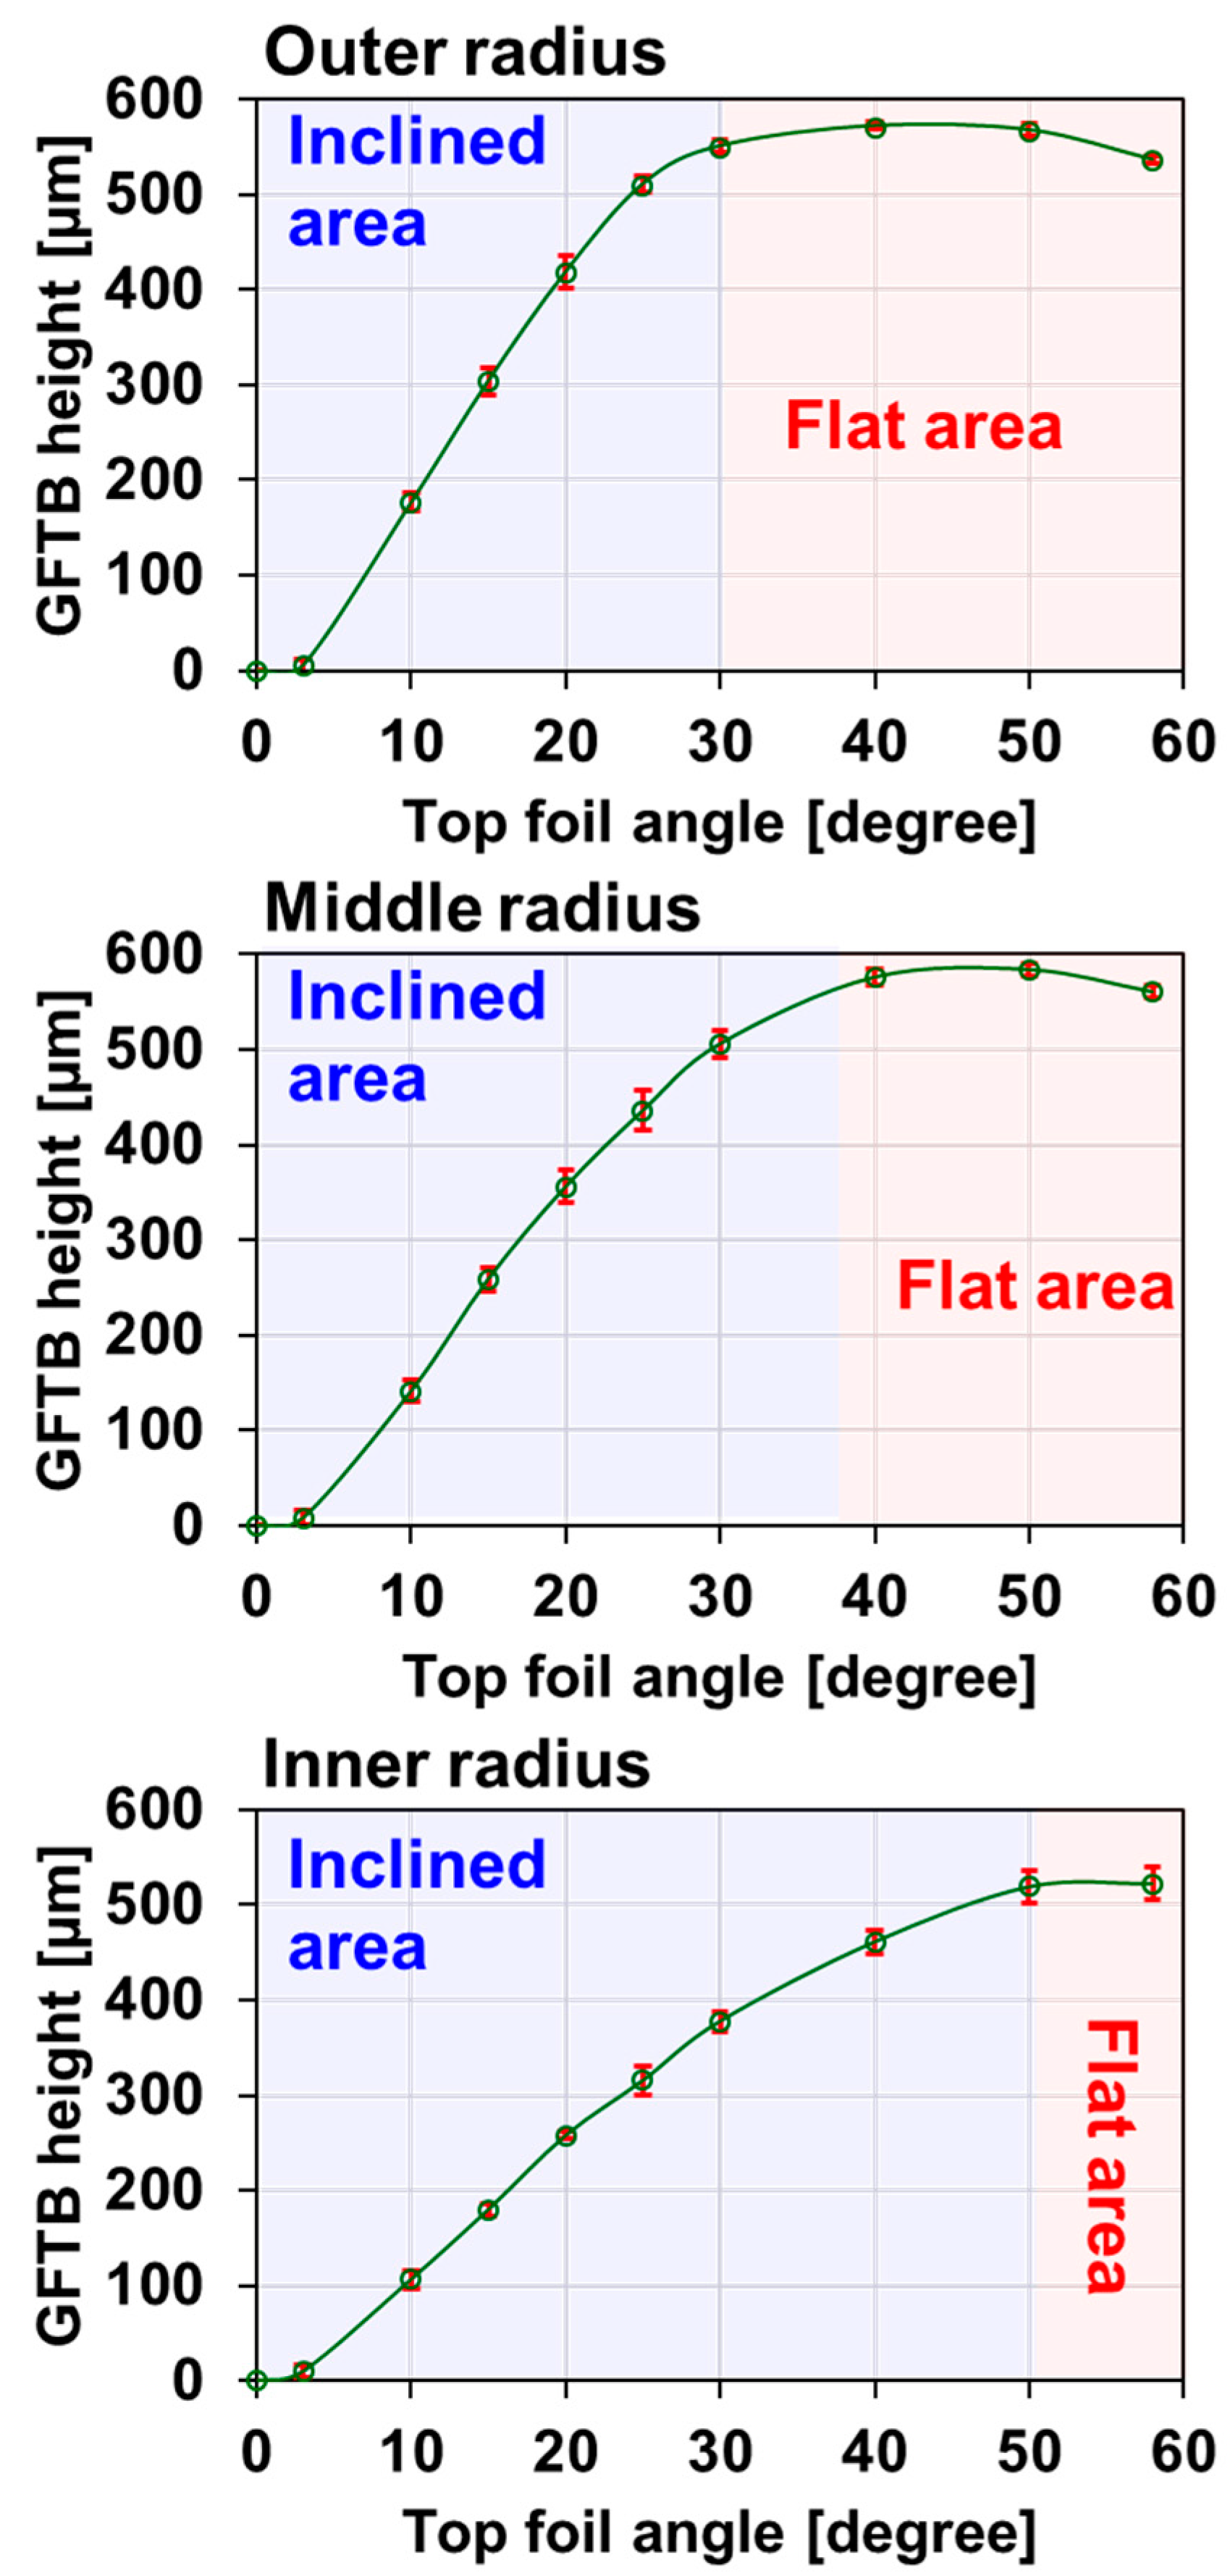
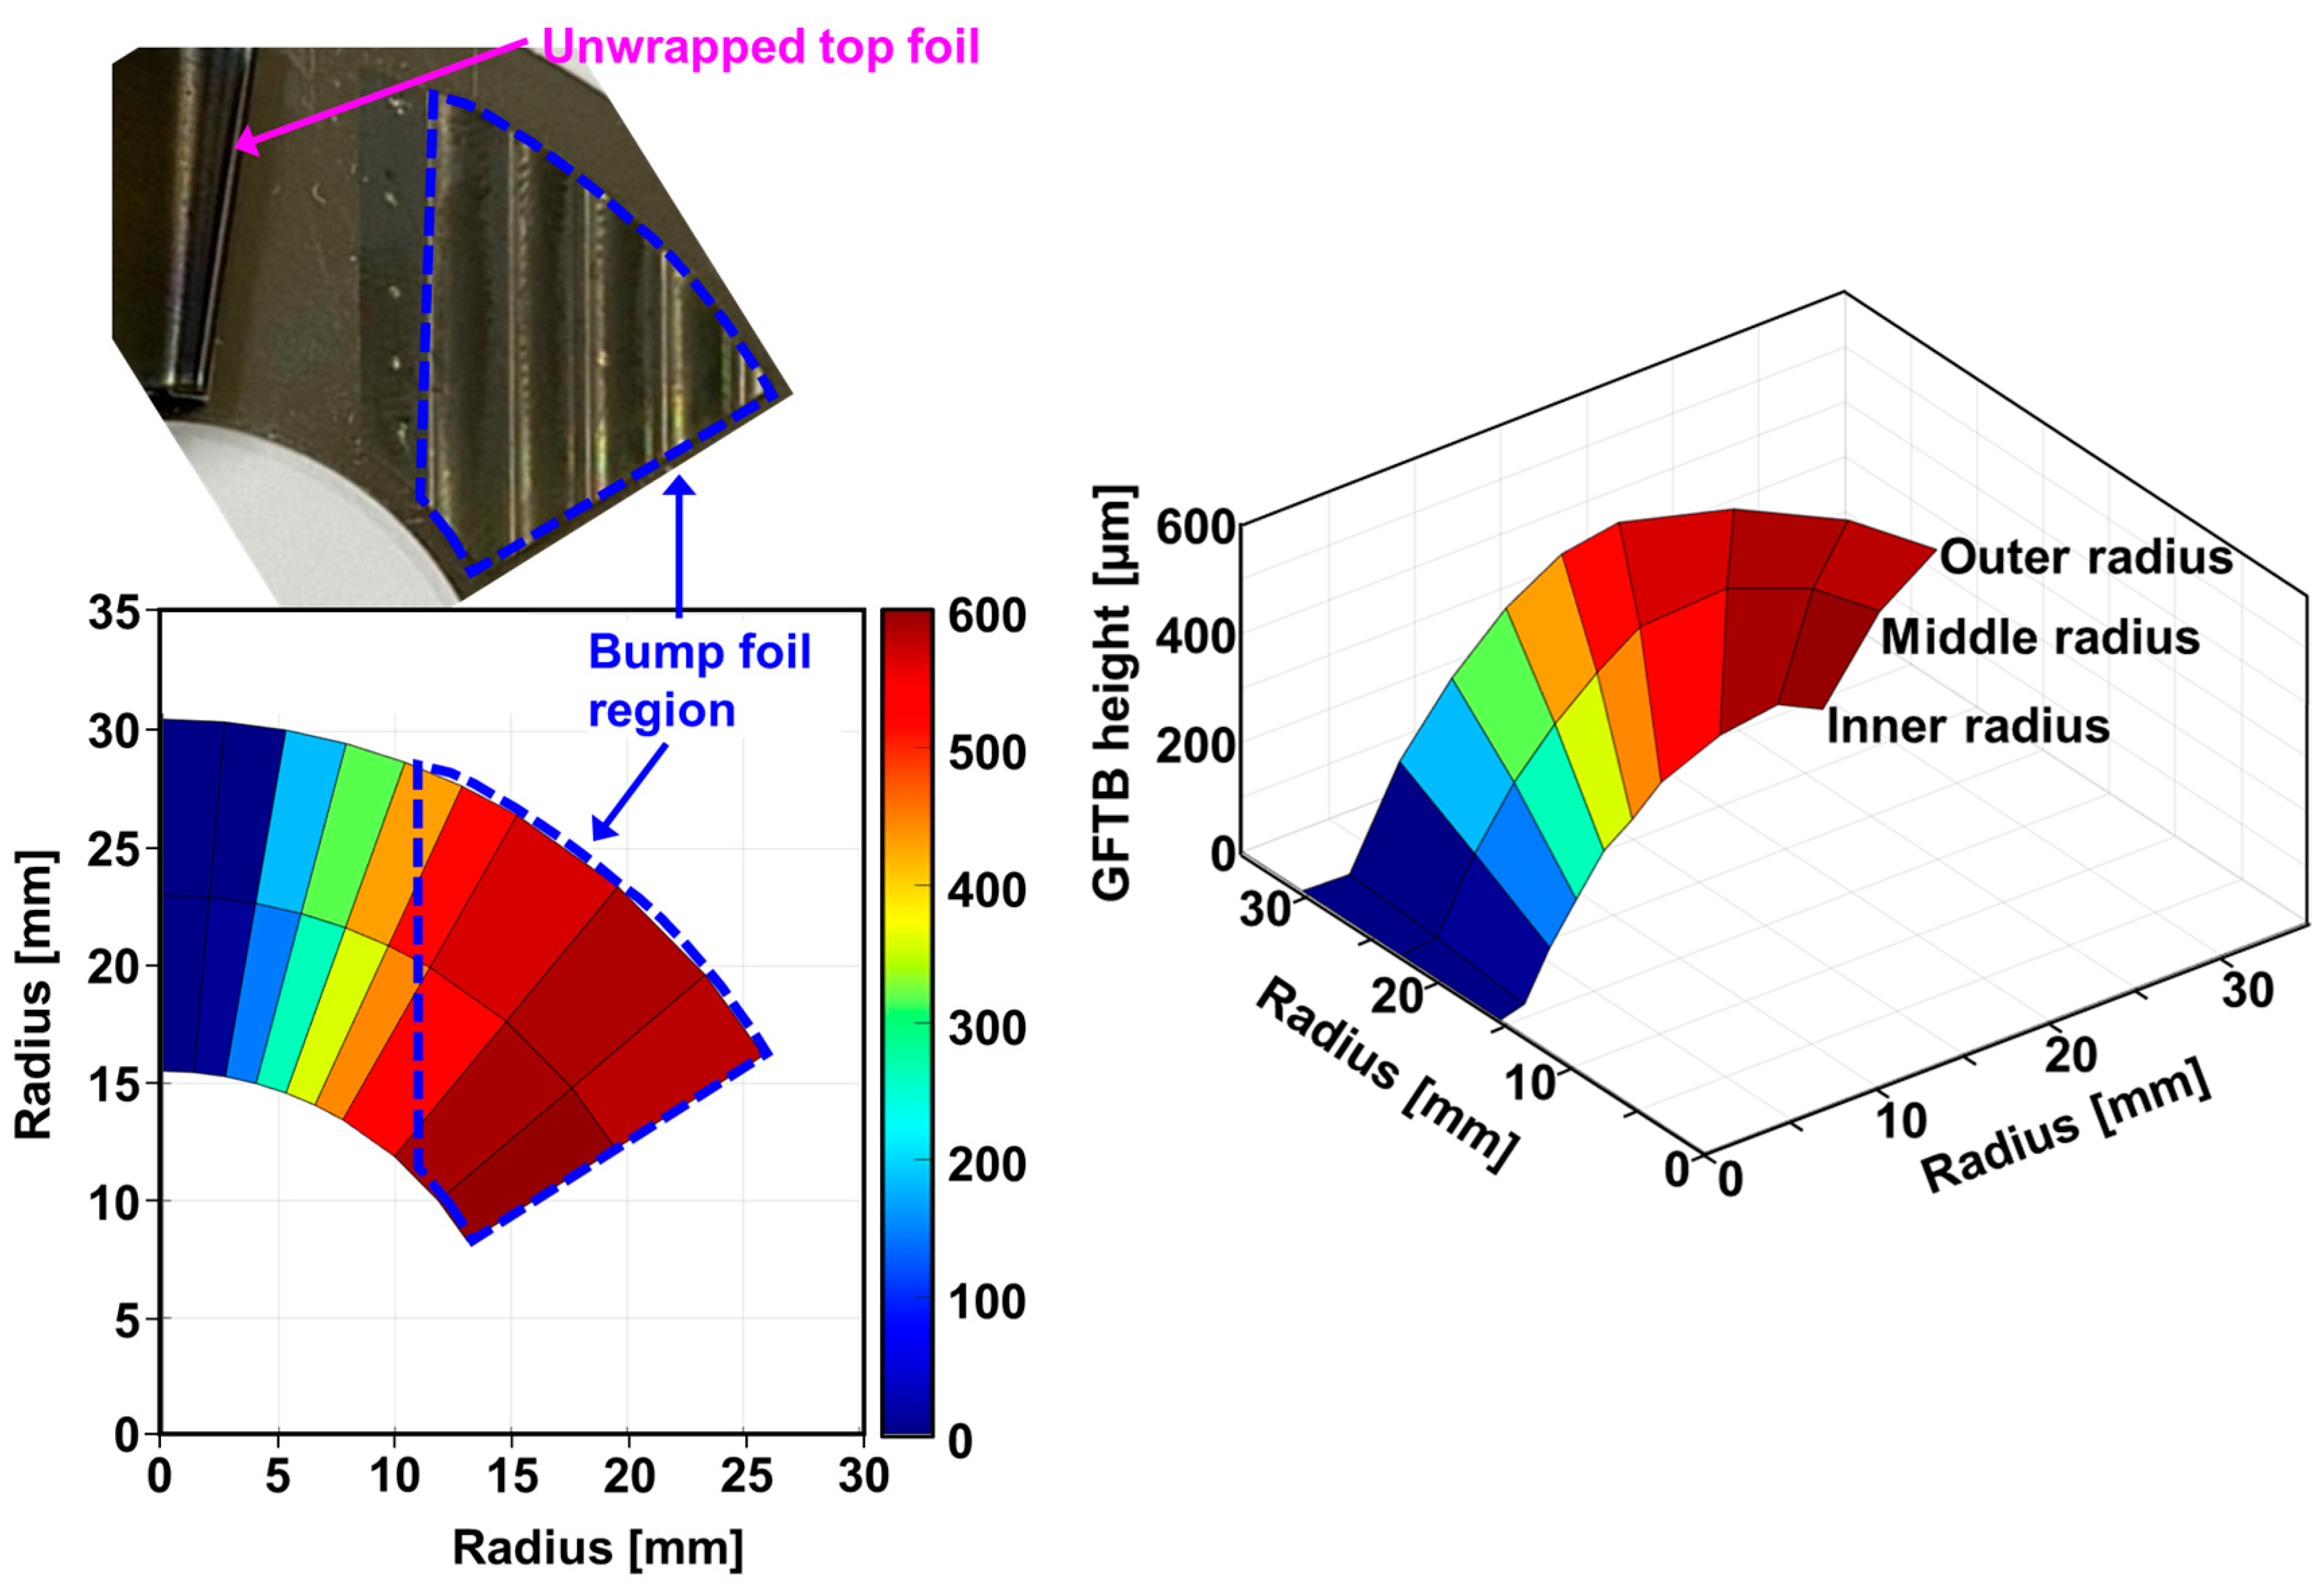
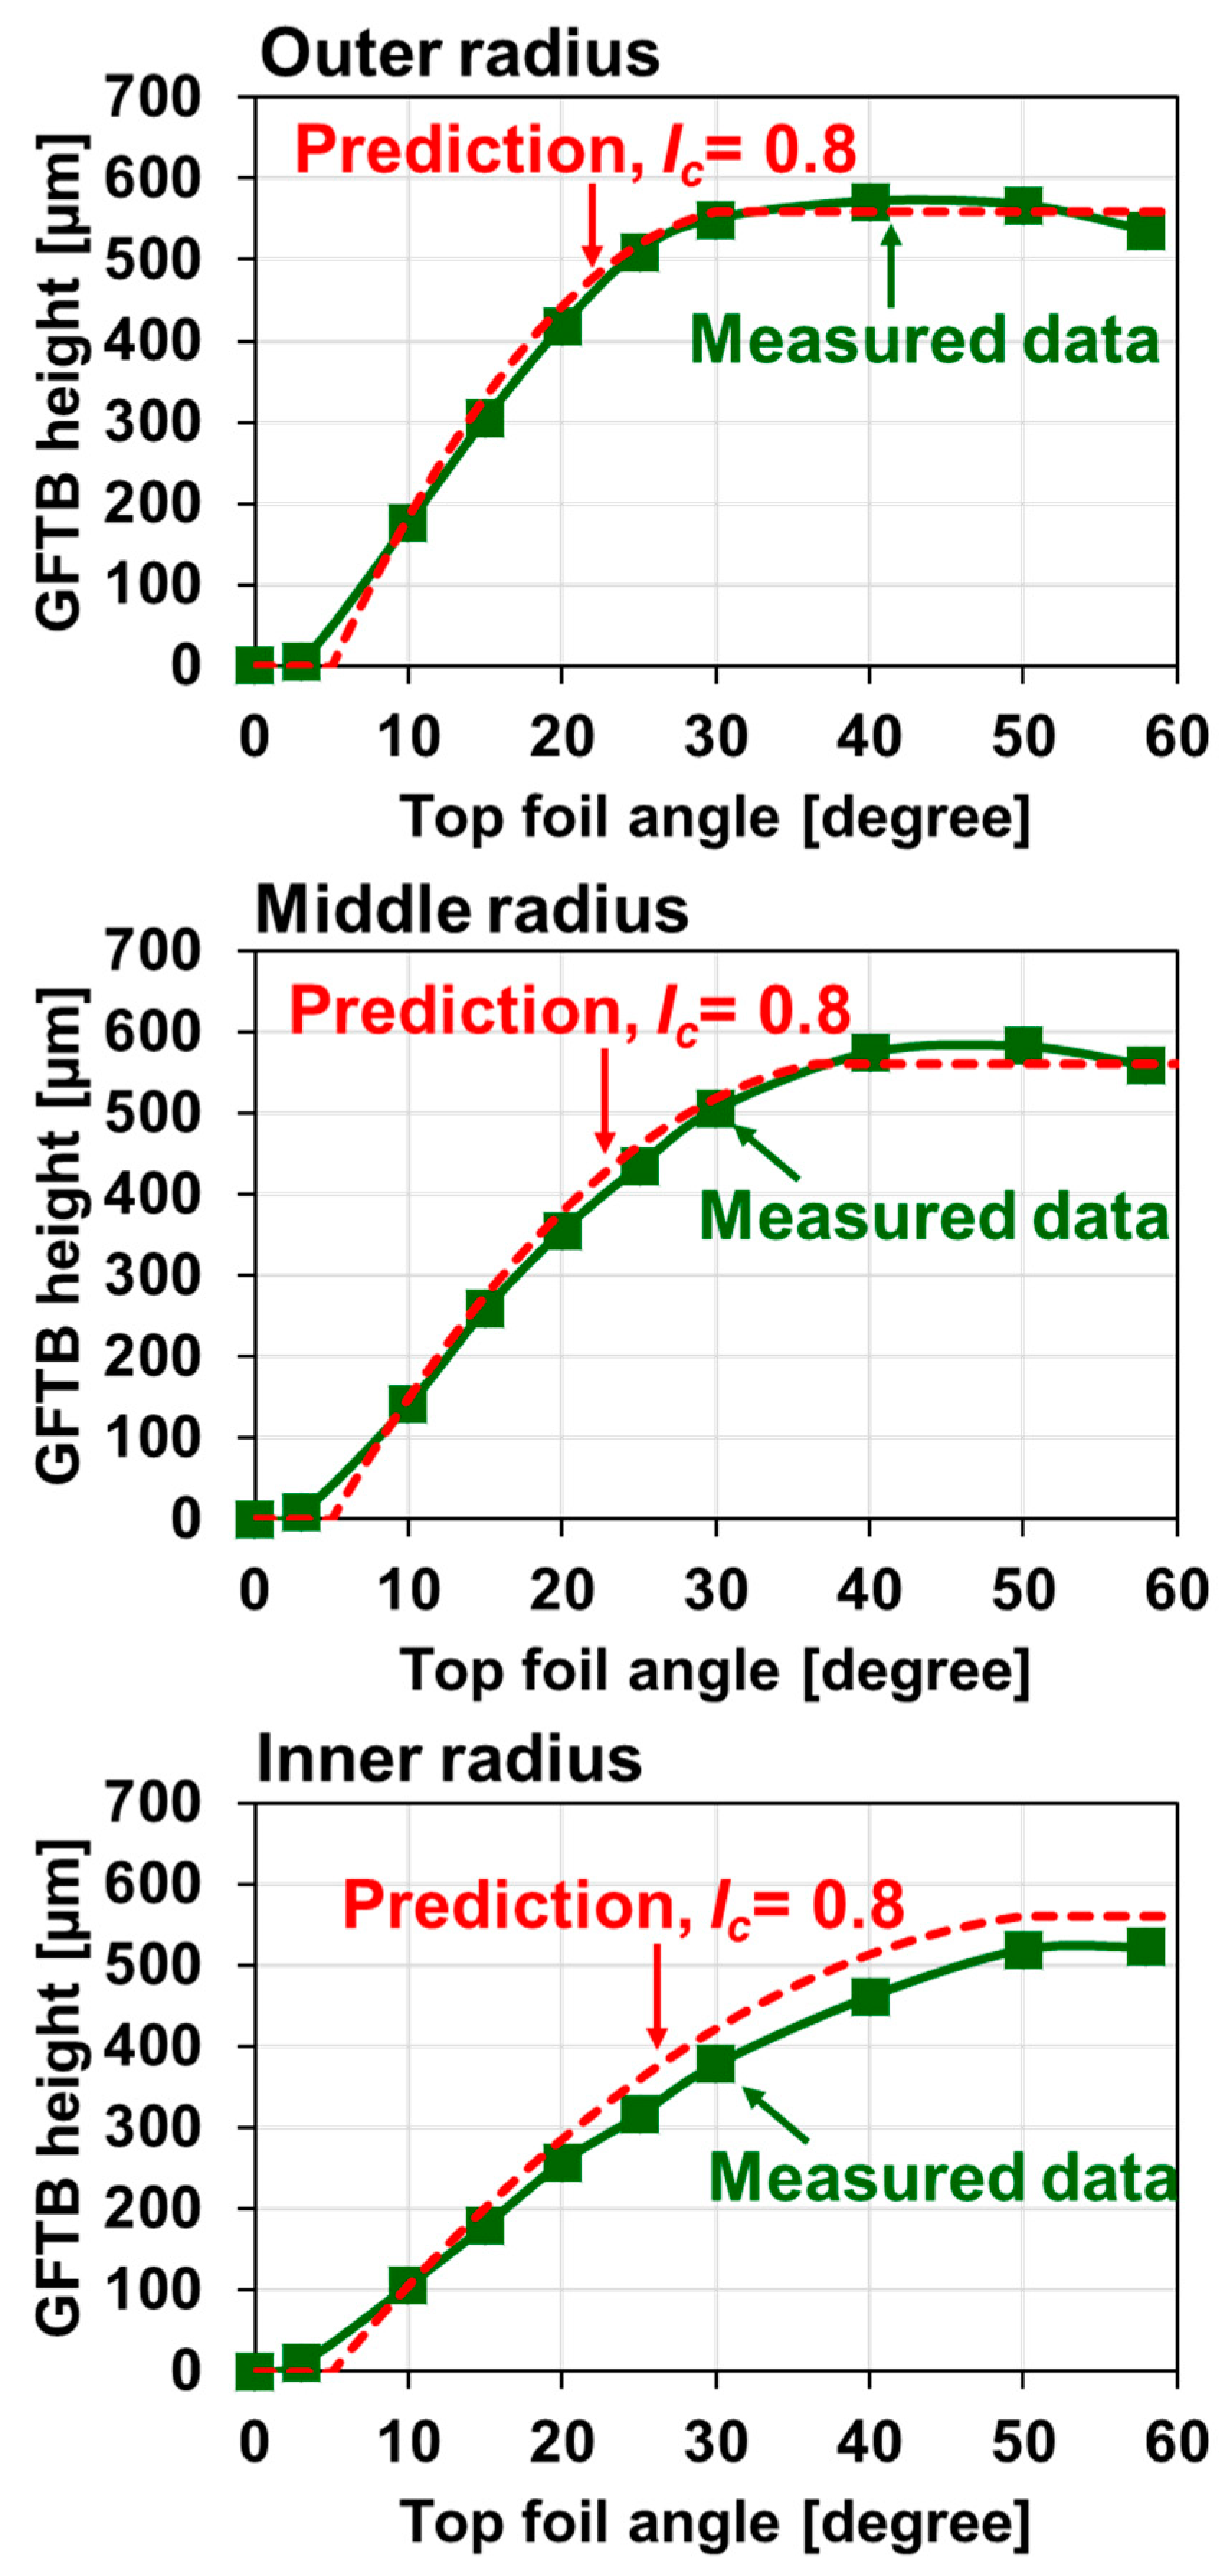
2.2. Measurement of Gas Foil Thrust Bearing Height

The actual incline height of the test GFTB varies along the angular and radial coordinates. Therefore, we used a height gauge with an uncertainty of ±10 µm to measure the height of the top foil at 10 angular locations along the inner, middle, and outer radii. Figure 2 shows the locations of the incline height measurement. We conducted the measurements thrice at measurement locations in three top foils, each fabricated 120° apart. Therefore, a total of nine measurements were averaged at each angular and radial location.
Figure 3 illustrates the averaged height of the GFTB versus the top foil angle measured at the inner, middle, and outer radii. The error bars show that the standard deviation is largest at 20°, 25°, and 58° for the outer, middle, and inner radii, respectively. The largest standard deviation of ~21.1 µm occurred at 25° along the middle radius. The height increases steeply with increasing pad angle in the inclined area region, reaches its maximum value at the boundary between the inclined and flat area regions, and then decreases slightly in the flat area region. In general, the maximum measured incline height was slightly higher than the design height of 500 µm, being the largest for the middle radius and smallest for the inner radius. This discrepancy may be attributed to assembling and manufacturing errors [10,13]. It is found that the flat area starts approximately at 30°, 36.5°, and 50° for the inner, middle, and outer radii, based on the measurements.
Figure 4 depicts a photograph of the bump foil with an unwrapped top foil (upper left), surface contour plot (lower left), and 3D plot of measured height. The height measurement results show that areas with a height of more than 500 µm correspond to the bump foil area. Figure 3 and Figure 4 reveal that the actual height of the incline is not constant along the radial direction and needs to be considered for accurate model predictions.

2.3. Measurement of Static Performances

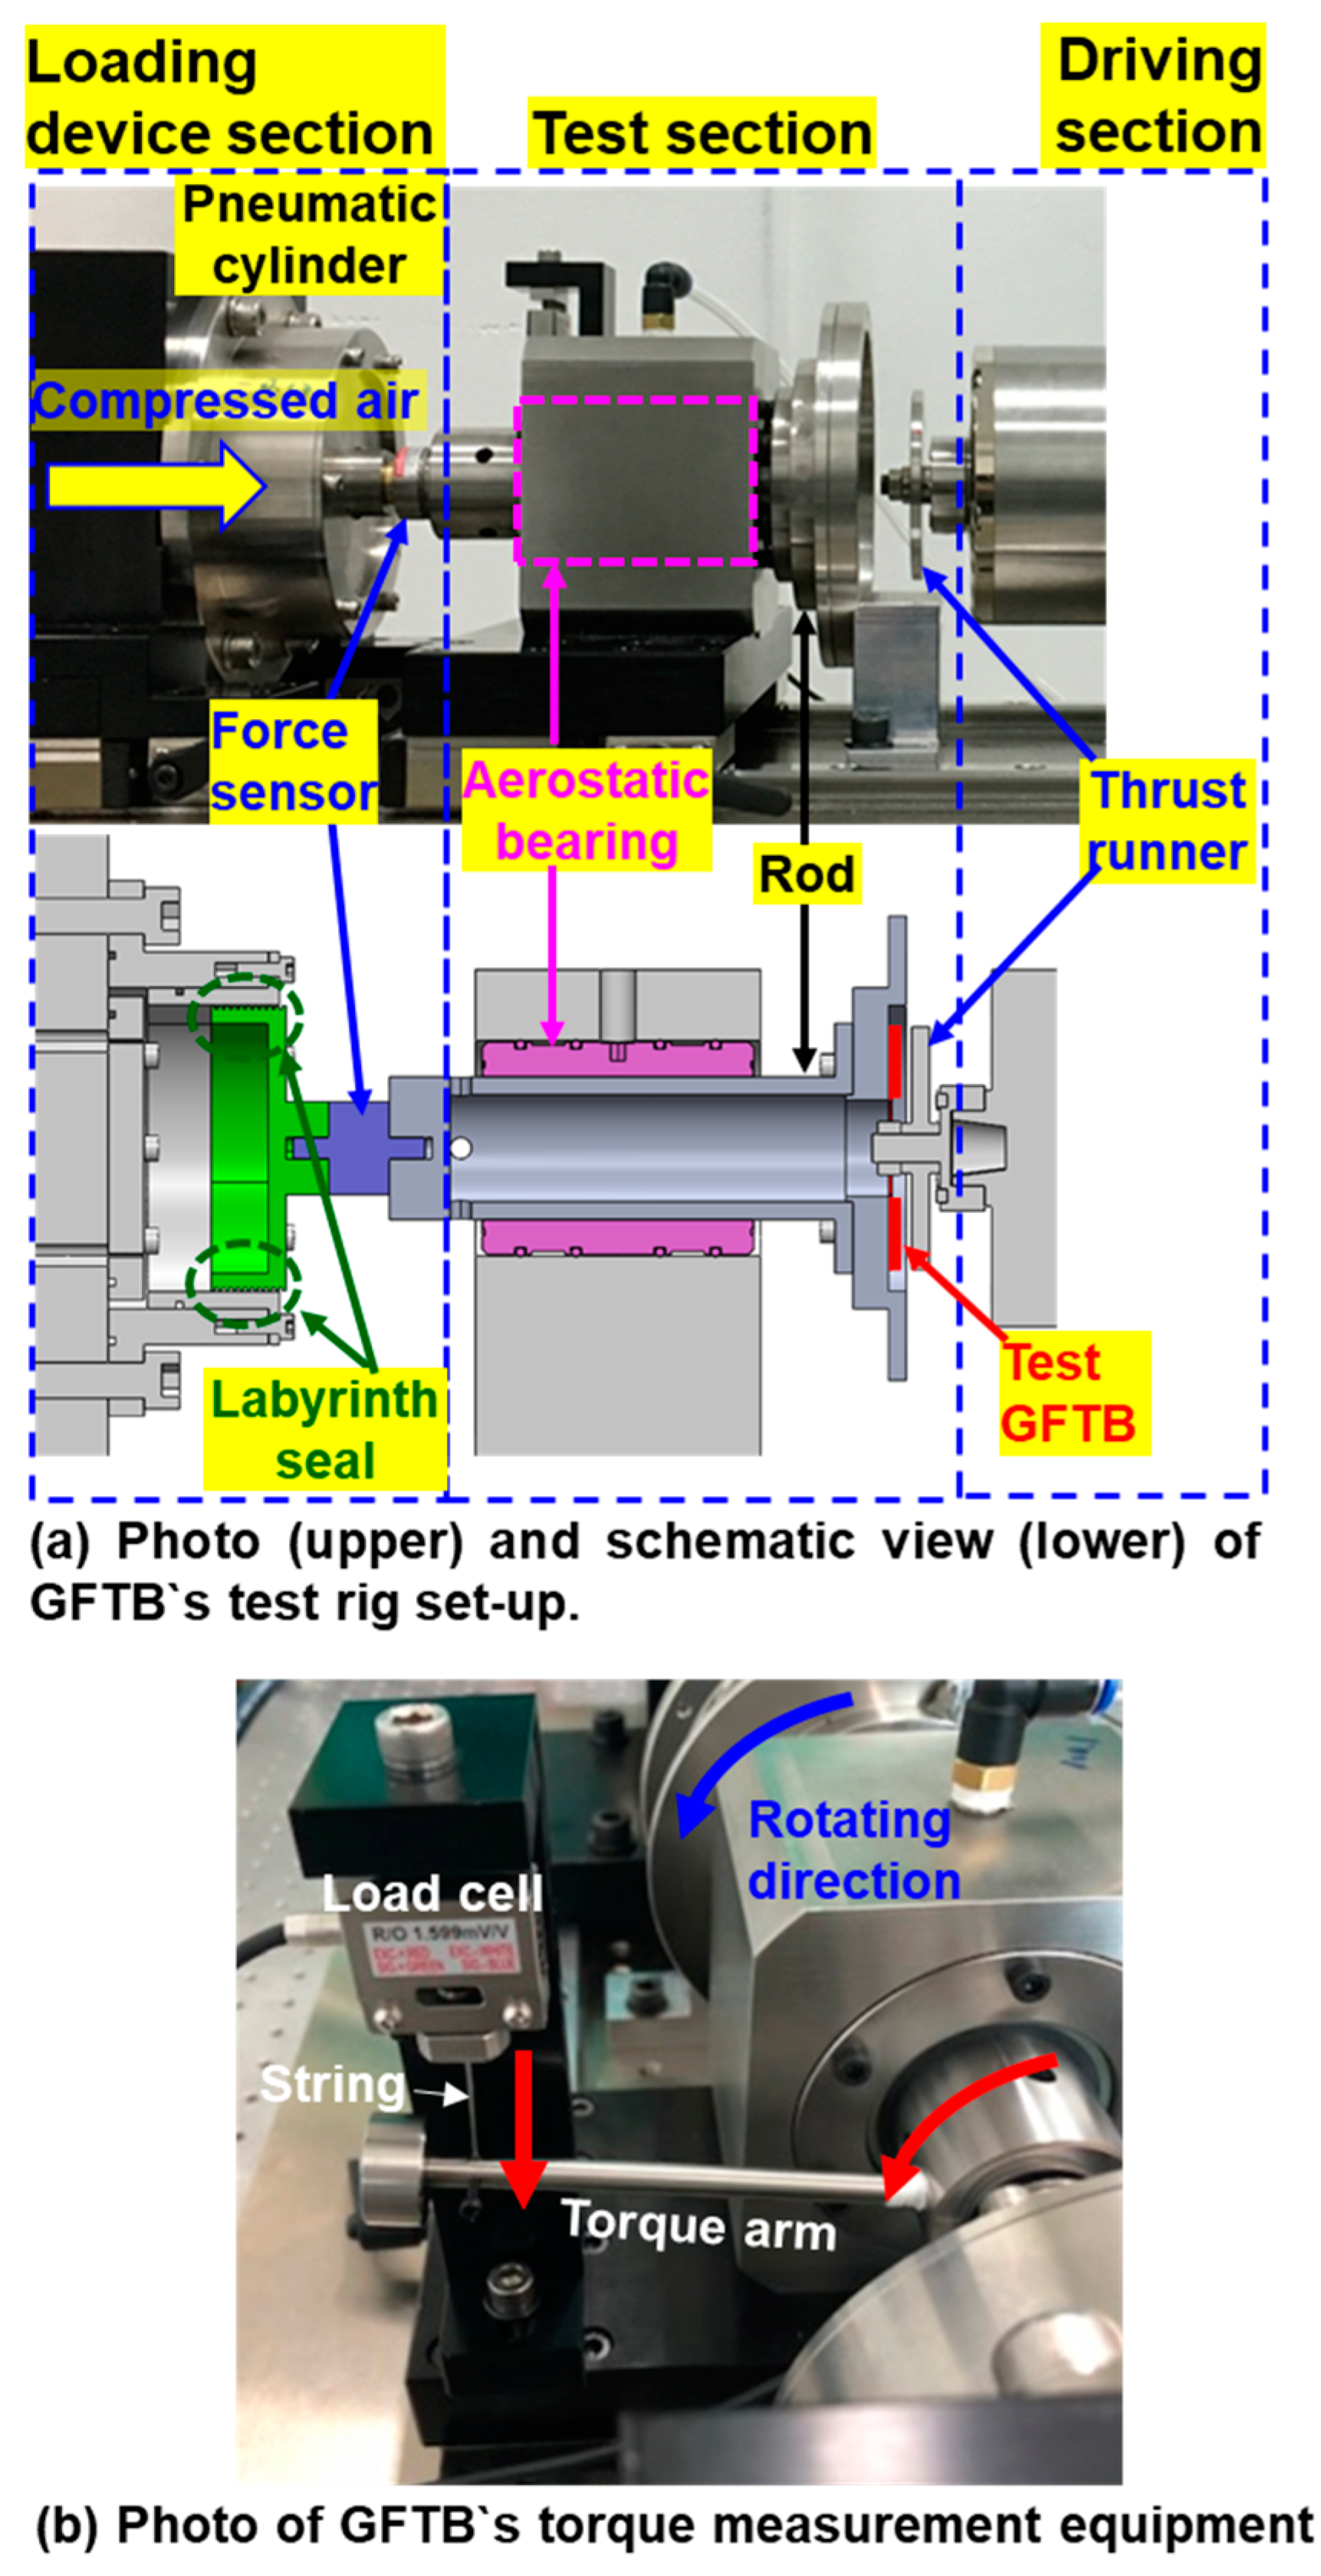
2.3.1. Description of the Test Rig

Figure 5 presents (a) a photograph and schematic view and (b) the photograph of the test rig developed for measuring the lift-off speed, drag torque, and load capacity of the GFTB. The test rig is largely composed of three sections: the loading device section (left), the test section (middle), and the driving section (right). In the loading device section, static load is applied to the test GFTB by injecting compressed air into the outer pneumatic cylinder. The applied static load is measured using a load cell. A labyrinth seal, a non-contact seal, is used on the outside of the inner pneumatic cylinder to prevent compressed air leakage and eliminate the friction that occurs when the rod moves in the axial direction. The hollow rod of the test section is supported by an aerostatic bearing to minimize the friction generated due to axial movement and rotation. A bearing housing for mounting the test GFTB is installed on the right side of the rod. The driving section has a thrust runner with an outer diameter of 64 mm installed parallel to the test bearing. The drag torque generated in the bearing due to the rotation of the runner and the axial load can be measured using a torque arm connected to the load cell and the string, as shown in Figure 5b. Notably, the driving motor can be driven up to 80 krpm.

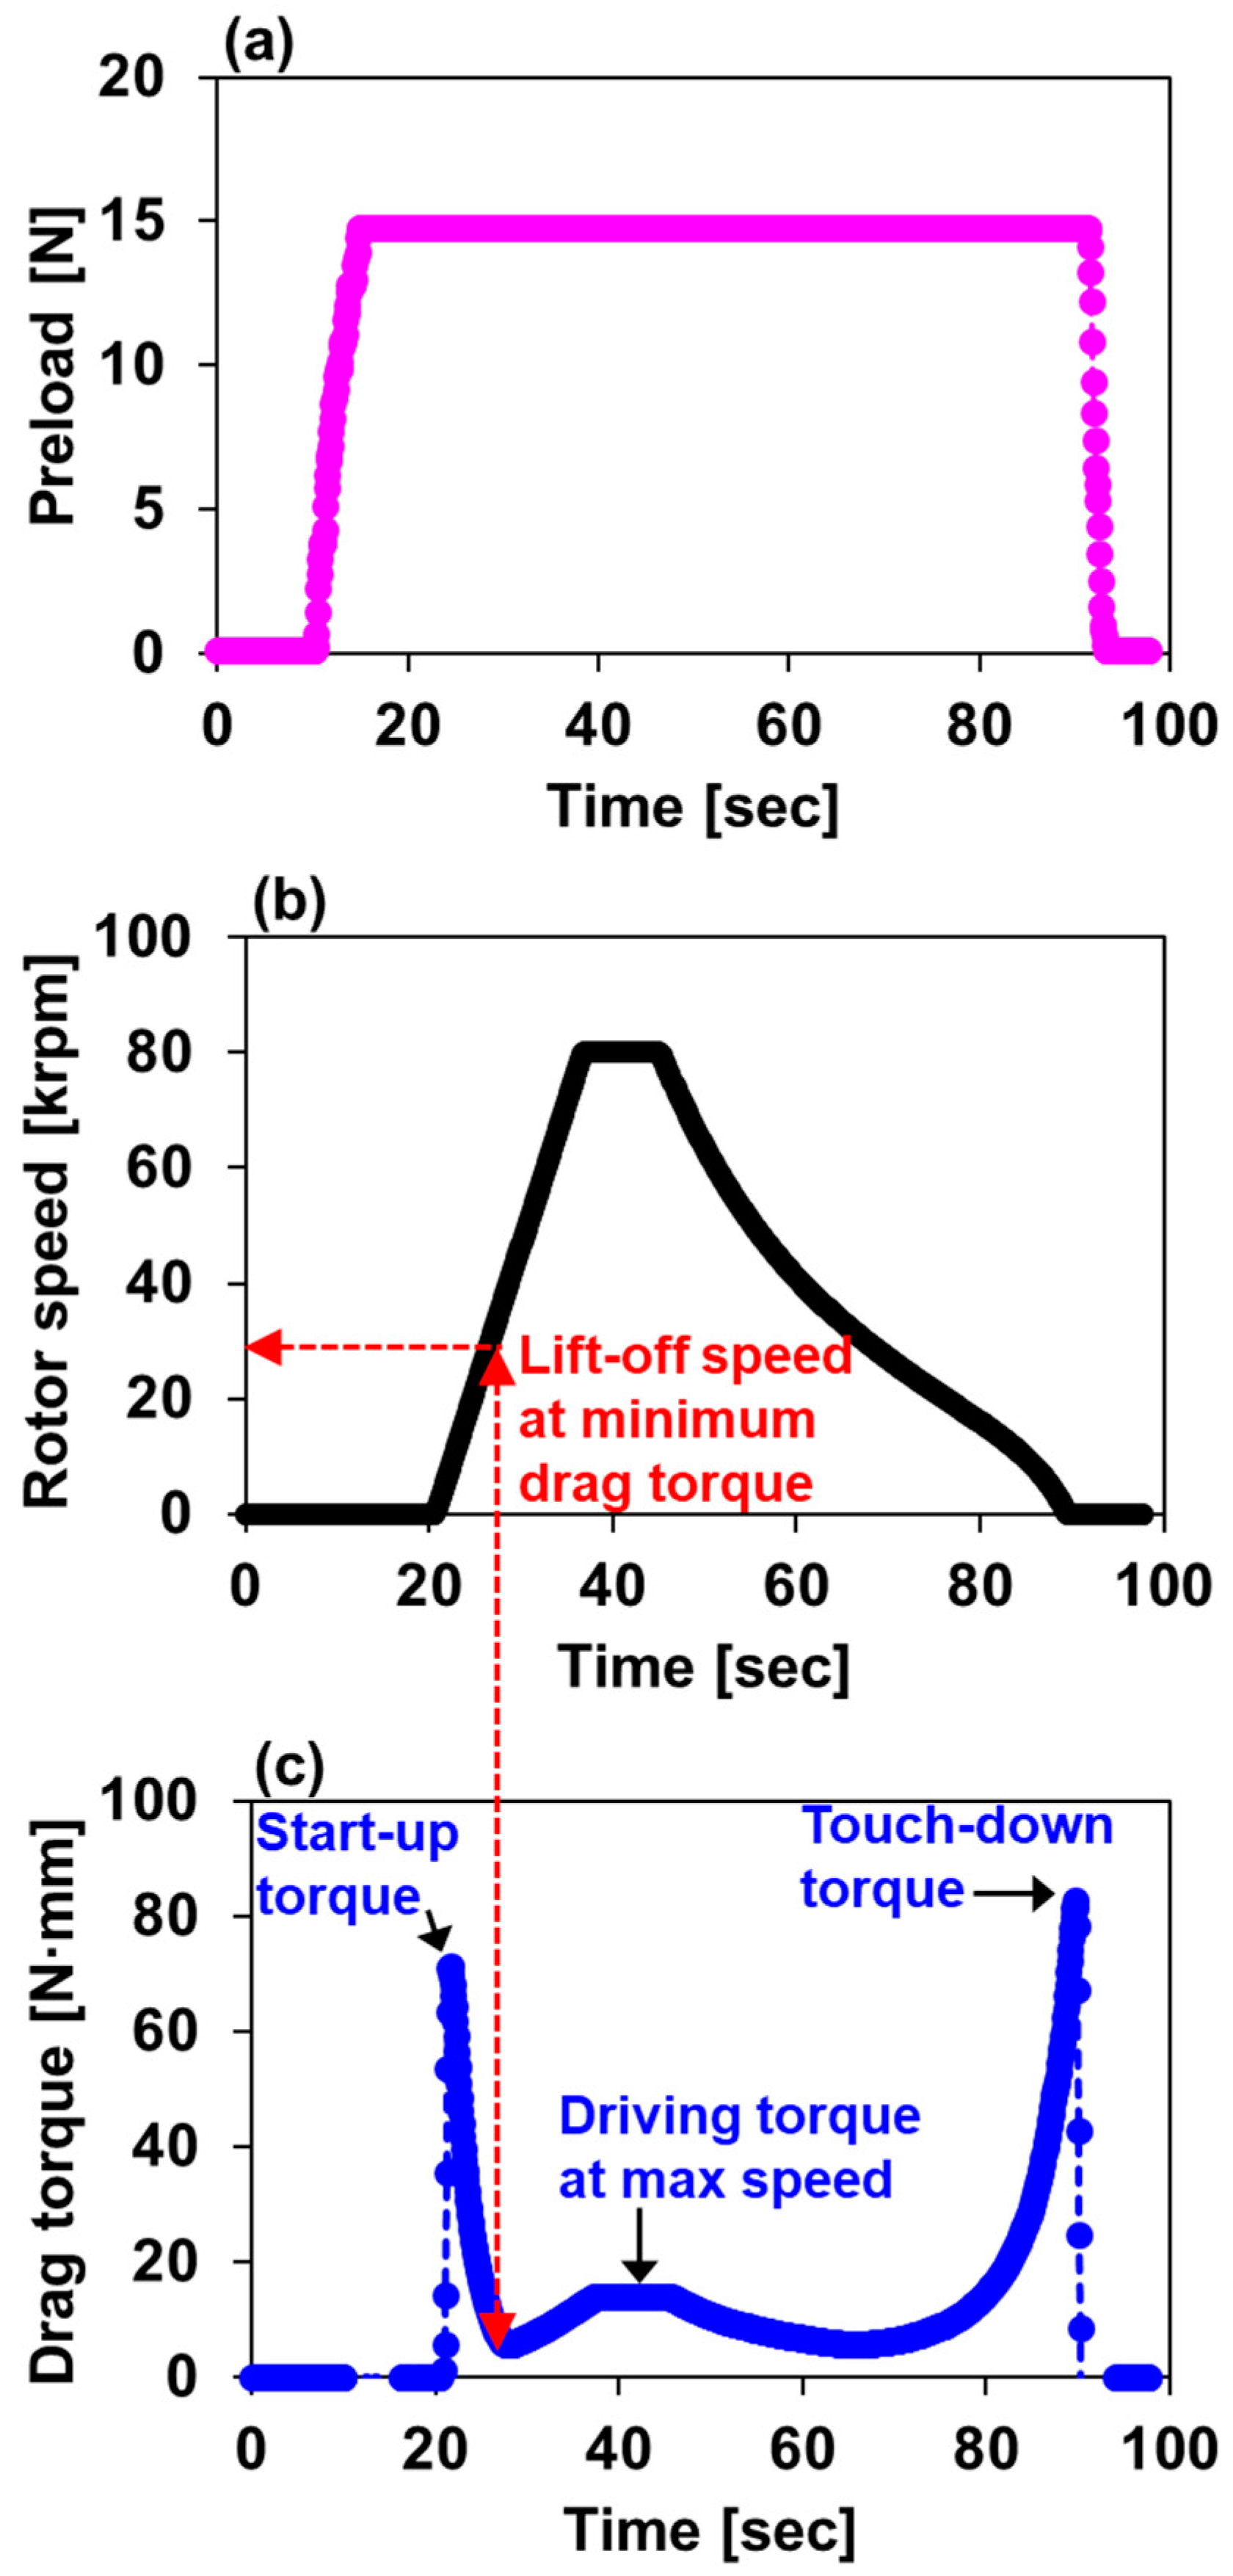
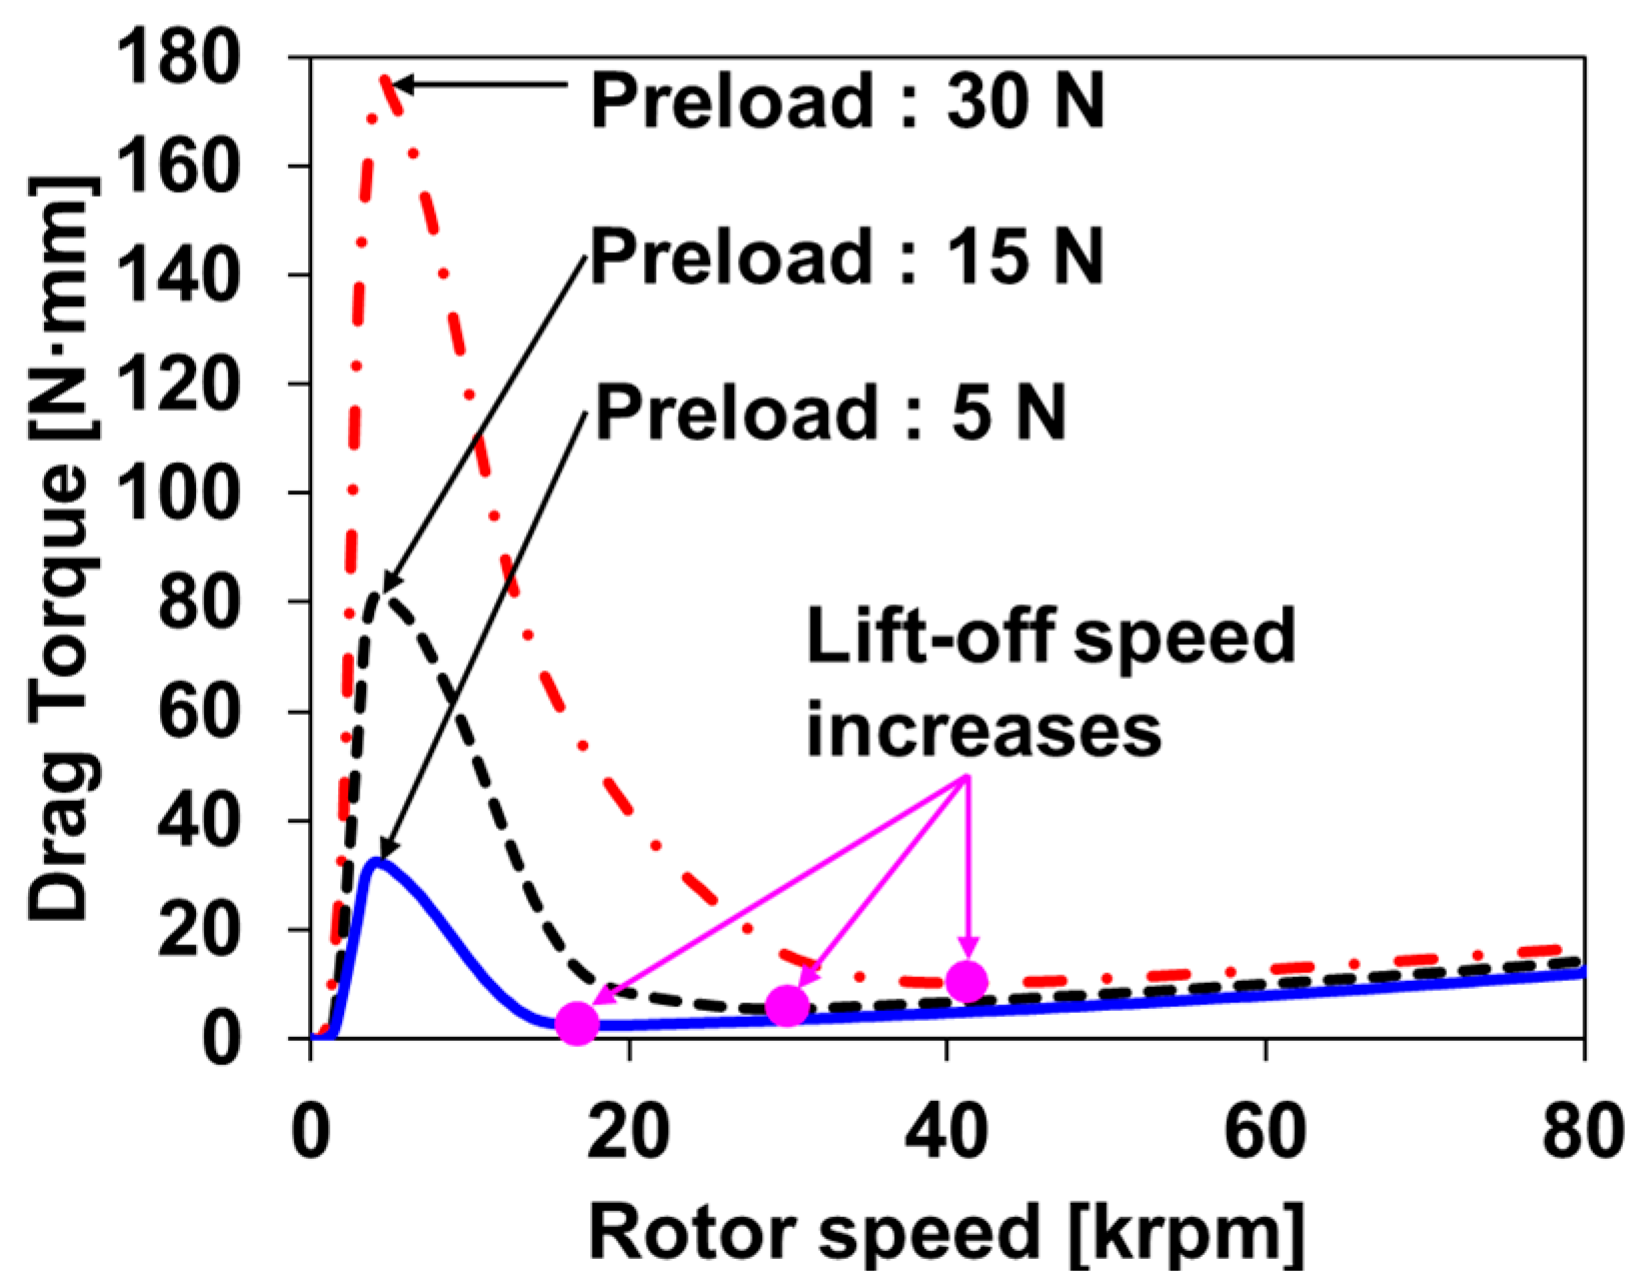
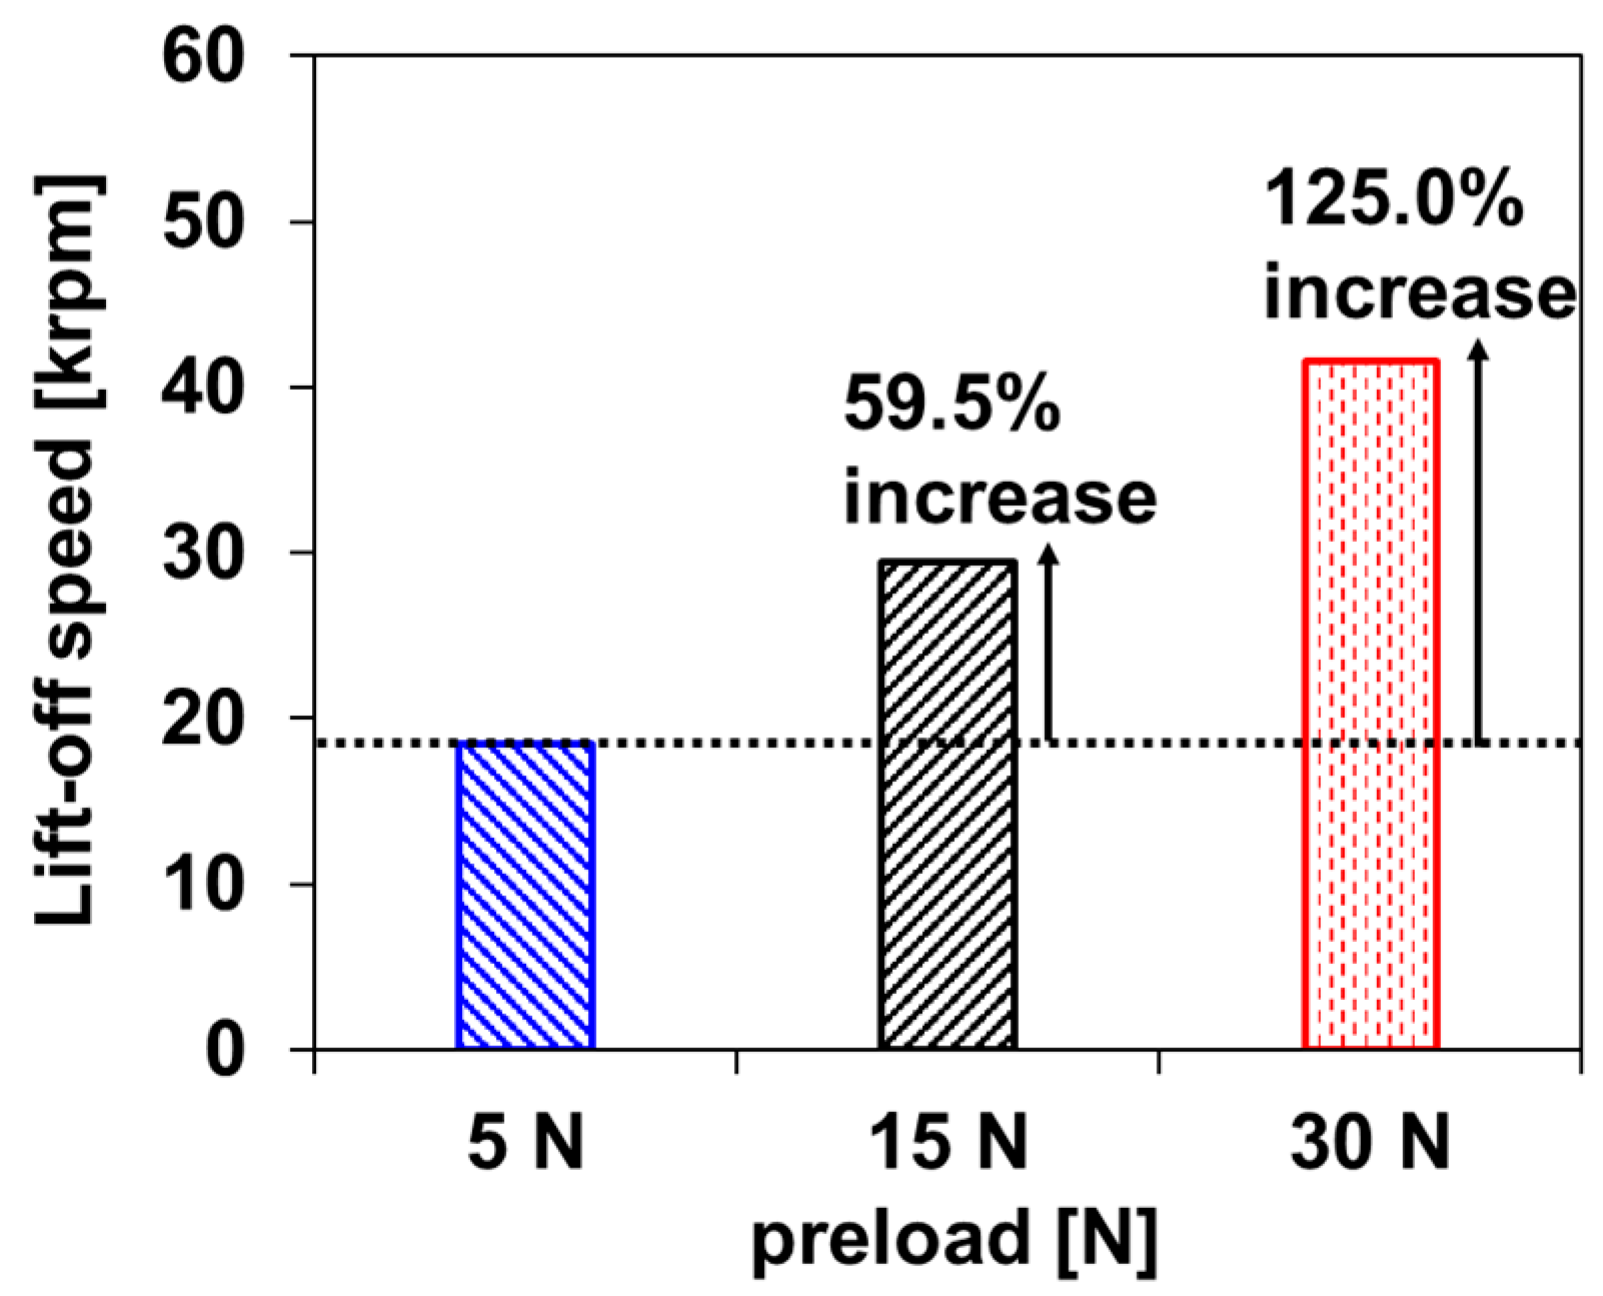
2.3.2. Lift-Off Speed Measurements

The GFTB is in contact with the trust runner during non-rotation, and lift-off occurs when sufficient hydrodynamic pressure is generated at a certain rotor speed, that is, the lift-off speed. The bearing has the highest drag torque before lift-off due to contact with the thrust runner. Therefore, the lift-off speed and drag torque are important performance indicators that determine the life of the GFTB in rotating machinery that frequently starts and stops. This study conducted the lift-off speed test at various preloads to evaluate the lift-off performance of the GFTB. Figure 6 shows the (a) preload, (b) rotor speed, and (c) drag torque versus time as an example of the GFTB lift-off speed test. Before the motor started, a preload of 15 N was applied, and the rotor speed was increased to 80 krpm. The rotor speed was kept constant at the maximum level for approximately 10 s, and the power to the motor was then shut off to allow the rig to stop by coasting down. Initially, the drag torque increased rapidly as a result of the static friction force caused by the contact between the thrust runner and the bearing, indicating the boundary lubrication region. As the speed increases, hydrodynamic pressure begins to develop and enter the mixed lubrication region, resulting in the separation of the two surfaces and causing the drag torque to drop to its lowest value, which indicates rotor lift-off. The measured lift-off speed was 35 krpm. Once the rotor lifts off, the drag torque starts increasing linearly with the rotor speed due to the increased shearing phenomena in the lubricant film, indicating the fully developed hydrodynamic lubrication regime. When the motor is stopped by coasting down, the change in drag torque takes longer than the start of the motor because the rotor speed reduces nonlinearly; however, the trend of the drag torque follows that of the rotor speed.
Figure 7 illustrates the drag torque versus rotor speed for axial preloads of 5, 15, and 30 N. The start-up torque, which is the maximum drag torque, increased with increasing preload. Similarly, the lift-off speed, at which the drag torque reaches its minimum value, increased with increasing preload. In the fully developed hydrodynamic lubrication region, the drag torque increased linearly with the rotor speed. In addition, the drag torque increased significantly in the boundary and mixed lubrication zones and slightly in the hydrodynamic zone as the preload increased.
Figure 8 compares measured lift-off speeds for the preloads of 5, 15, and 30 N. The lift-off speed increases by 59.5% and 125% for the preloads of 15 and 30 N, respectively, relative to the lift-off speed at 5 N.

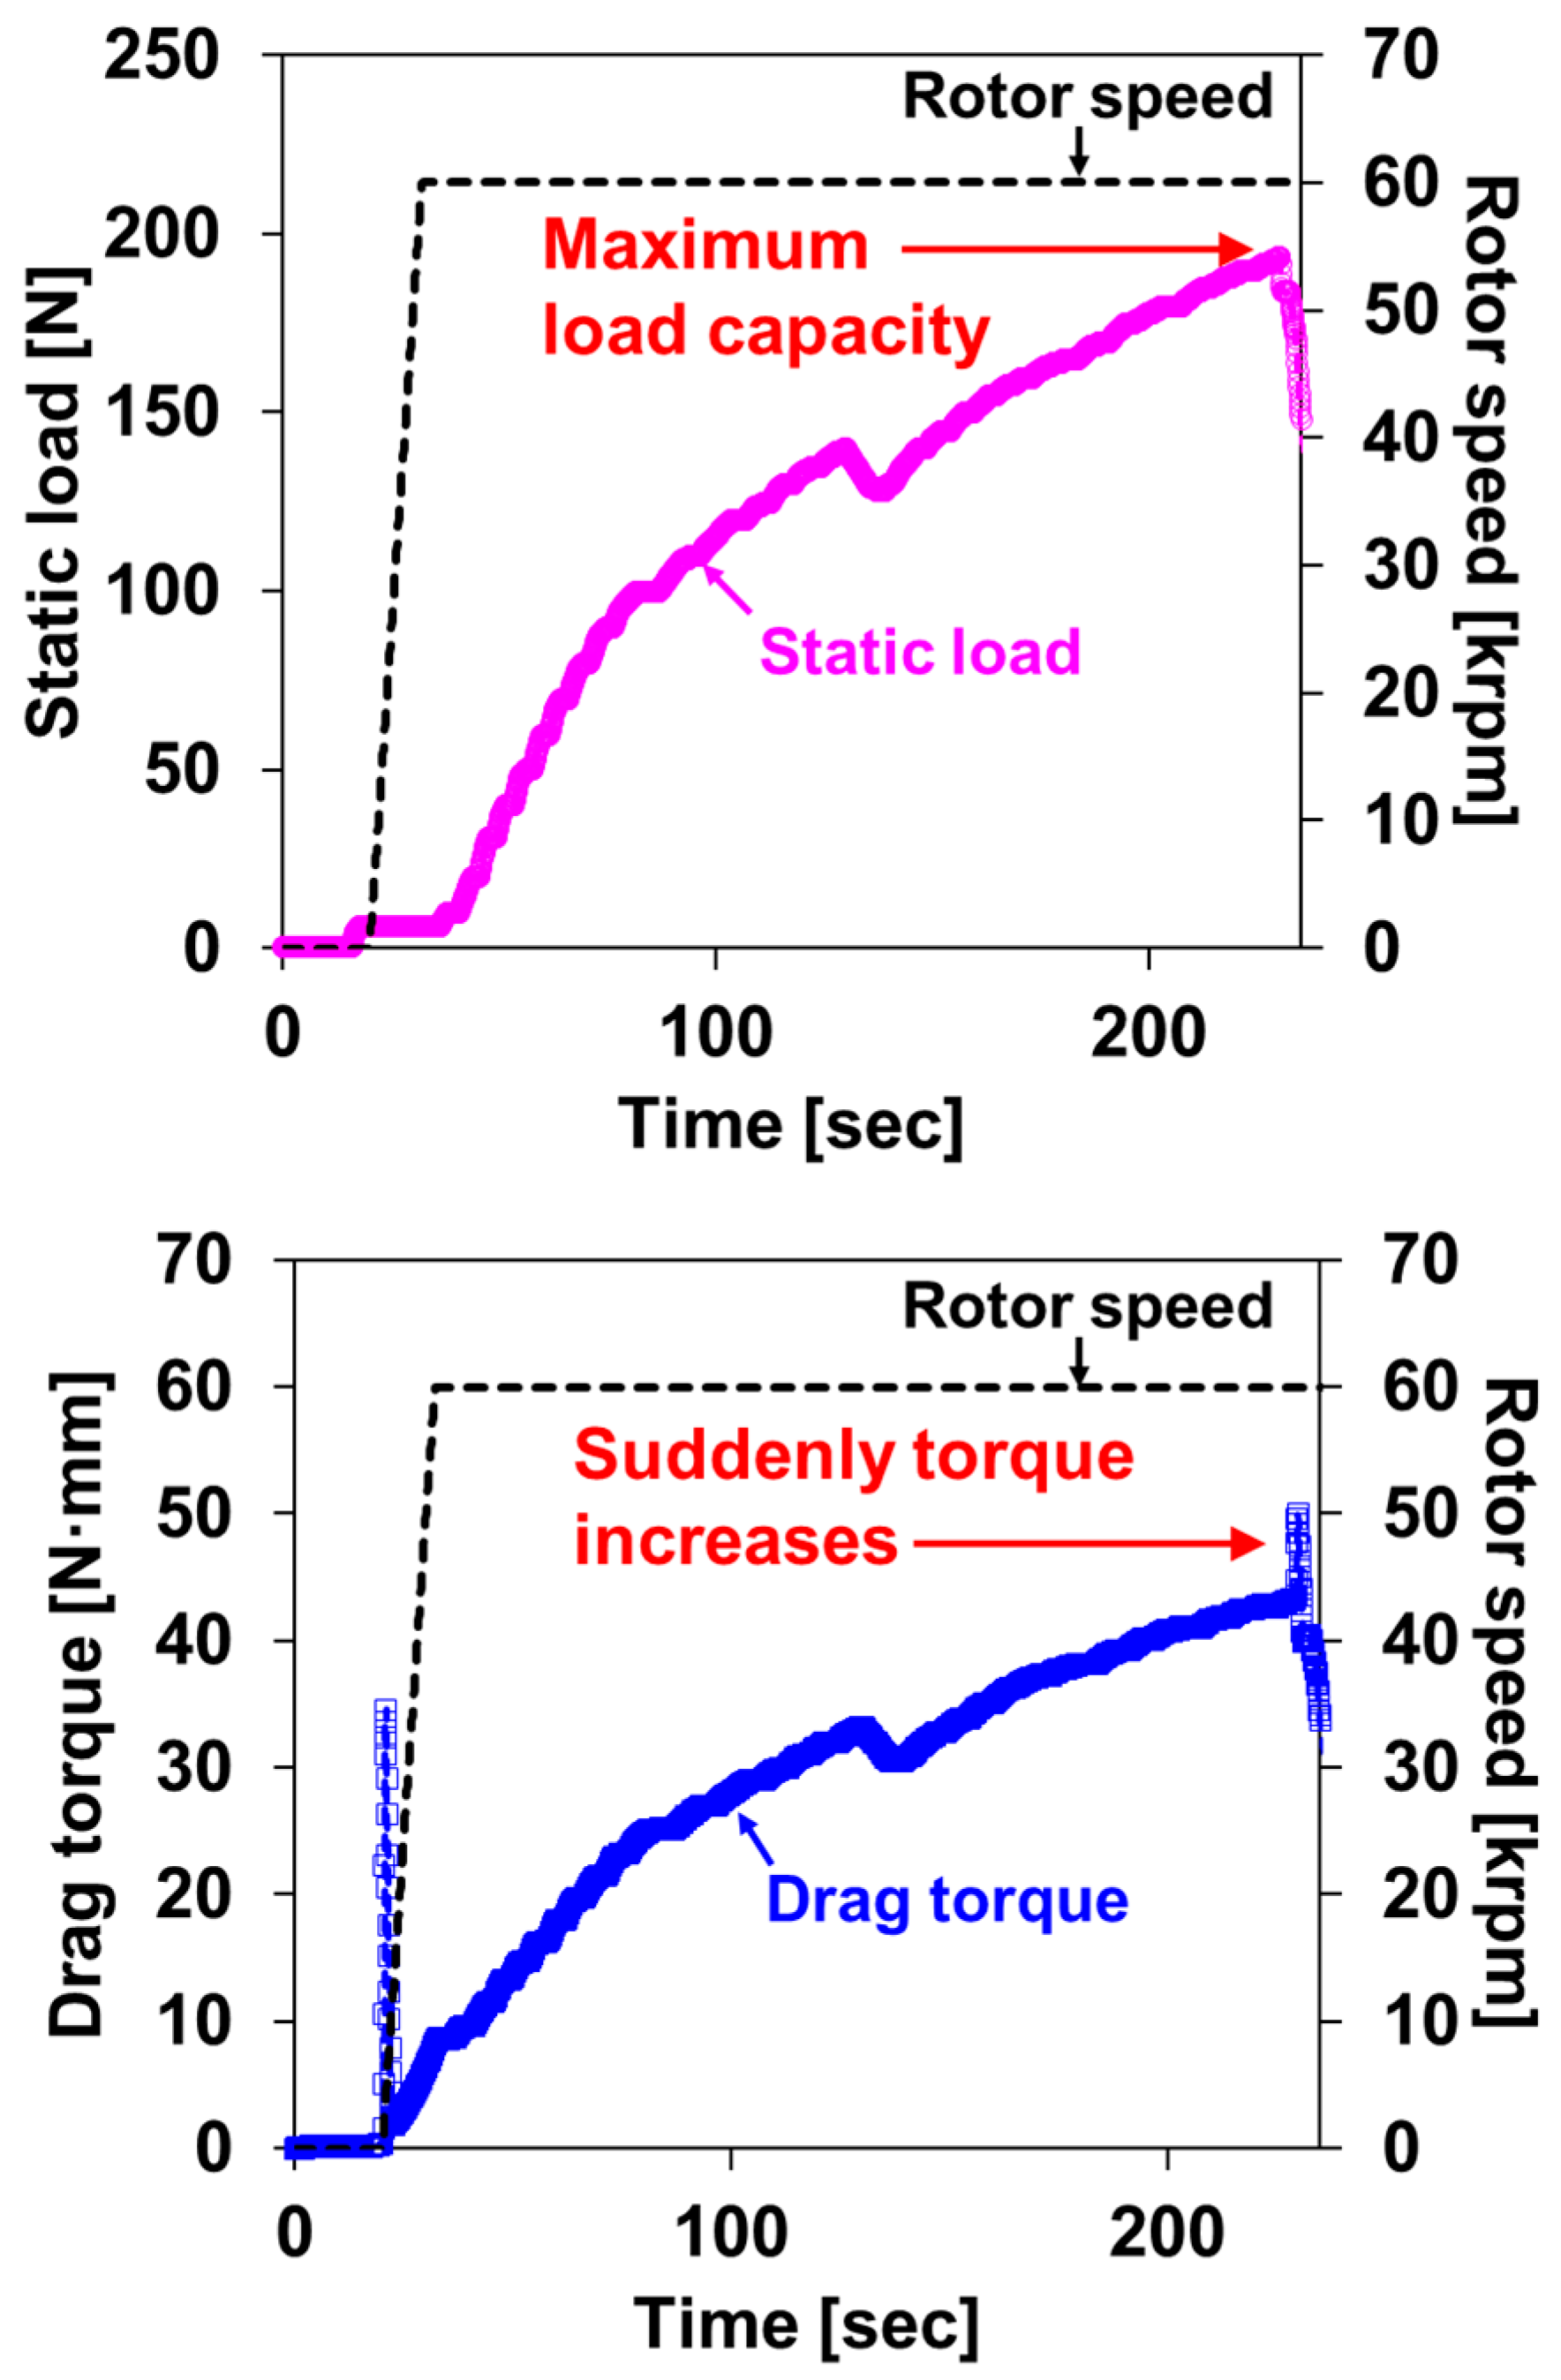
2.3.3. Load Capacity Measurement

The load capacity is one of the most important performance indicators of GFTBs. In addition, most of the friction loss in the bearings occurs in the thrust bearing due to its contact area being larger than that of the journal bearing. Figure 9 depicts the procedure for measuring the maximum static load capacity (upper) and the drag torque of the GFTB (lower). Before starting the motor, a preload of 5 N was applied, and the rotor speed was then increased to 60 krpm with the thrust runner and test GFTB attached. Thereafter, keeping the rotor speed at 60 krpm, the static load was gradually increased while monitoring the drag torque value in real time. The drag torque increases with static load, exhibiting a similar trend, except for a sharp spike at approximately 230 s. The sharp spike in the drag torque is due to the contact between the thrust runner and the bearing as the film thickness gradually decreases with static load, which then ruptures [18]. The measured maximum load capacity for the tested GFTB is 192 N.

2.4. Numerical Model

The Reynolds equation for an isothermal, isoviscous, and ideal gas governs the pressure distribution in the film region of the GFTB.
1 r ¯ [ r ¯ ( r ¯ P ¯ h ¯ 3 P ¯ r ¯ ) + 1 r ¯ 2 ( P ¯ h ¯ 3 P ¯ θ ) ] = Λ ( P ¯ h ¯ ) θ
Variables in Equation (1) are normalized as follows:
h ¯ = h c ,   r ¯ = r r o ,   and   P ¯ = P P a
where h, c, r, ro, P, Pa, μ, Ω, and θ are the film thickness, bearing clearance, radial coordinate, outer radius, pressure, ambient pressure, viscosity, rotor speed, and angular coordinate, respectively. In Equation (1), Λ = 6 μ Ω P a ( r o c ) 2 is the bearing compressibility number.
As demonstrated in Section 2.1, the actual height of the incline varies in both the angular and radial directions; therefore, the film thickness equation is given as follows:
h = c e + g ( r , θ ) + δ
where c and e are the bearing clearance and thrust runner eccentricity, respectively.
δ is the deflection of the compliant structure due to the pressure force acting on the top foil:
δ = 1 K f ( P a v g P a )
where Kf is the structural stiffness of the bump foil per unit area and Pavg is the average pressure averaged across the top foil radial width [18]. Noteably, the current study assumes the top foil to be attached to the bump foil and follows its deflection; that is, it is a simple foundation model [4,20,29,30].
The incline height function g(r, θ) represents the shape of the incline (ramp) height. Figure 10 shows the schematic view of a single pad with the incline angle, b(rβ, between the inclined and flat area varying along the radial direction and a quadratic–linear curved incline geometry in the angular direction to benchmark the best measurements in Section 2.2. β is the top foil angle, and b(r) is the ratio of the incline angle (ramp extent) to the top foil angle. The remaining angle, that is, βb(rβ, represents the flat area. Ltap represents the taper length. (Note that conventional models use a constant value for the incline angle, b(rβ, and take a piecewise linear approximation for the incline height (taper–land) function, g(r, θ), for GFTBs [4,5,15,18].)
The incline height function g(r, θ) is given as follows.
g ( r , θ ) = h R f ( r , θ )
f ( r , θ ) = { I c ( θ b ( r ) β ) 2 ( I c + 1 ) ( θ b ( r ) β ) + 1 ,   at   0 θ b ( r ) β 0 ,   at   b ( r ) β θ β
where
b ( r ) β = sin 1 ( α r ) + γ ,   where   γ = tan 1 [ r o sin ( b ( r o ) β ) r i sin ( b ( r i ) β ) r o cos ( b ( r o ) β ) r i cos ( b ( r i ) β ) ] ,   and   α = r i sin ( b ( r i ) β γ )
The dimensionless incline height function f(r, θ) represents quadratic equations for the angular coordinate of θ within the inclined area. Θ is a null value for the flat area. Ic is the incline coefficient, which controls the convex nature of the quadratic curve. Note that Equation (4) becomes linear if Ic is equal to zero. The inclined angle, b(rβ, which varies with radius, is determined once the incline angles (b(ri)β, b(ro)β) at the inner (ri) and outer (ro) radii are given. Figure 11 shows the calculated inclined angle b(rβ, when its upper value at ri and lower value at ro are 50° and 30°, respectively, as estimated in the measurement shown in Figure 3. The calculated incline angle at the middle radius is 36.4°, and the calculated taper length, Ltap, has a constant value of ~13.65 mm.
The numerical scheme follows that presented in the early research of Ref. [18]. The finite difference method solves the Reynolds equation for the pressure distribution with ambient pressure conditions at all the edges of the top foil. The calculated pressure distribution is integrated to determine the bearing load capacity and drag torque. The normalized form of the equations for the load capacity and drag torque are expressed as follows:
W ¯ = N f 0 β r i / r o 1 ( p ¯ 1 ) r ¯ d r ¯ d θ
T ¯ = N f 0 β r i / r o 1 [ h 2 p θ r ¯ + Λ 6 r ¯ 3 h ( r o c ) 2 ] d r ¯ d θ
where W ¯ = W p a r o 2 , T ¯ = T p a c r o 2 , and Nf is the number of pads.

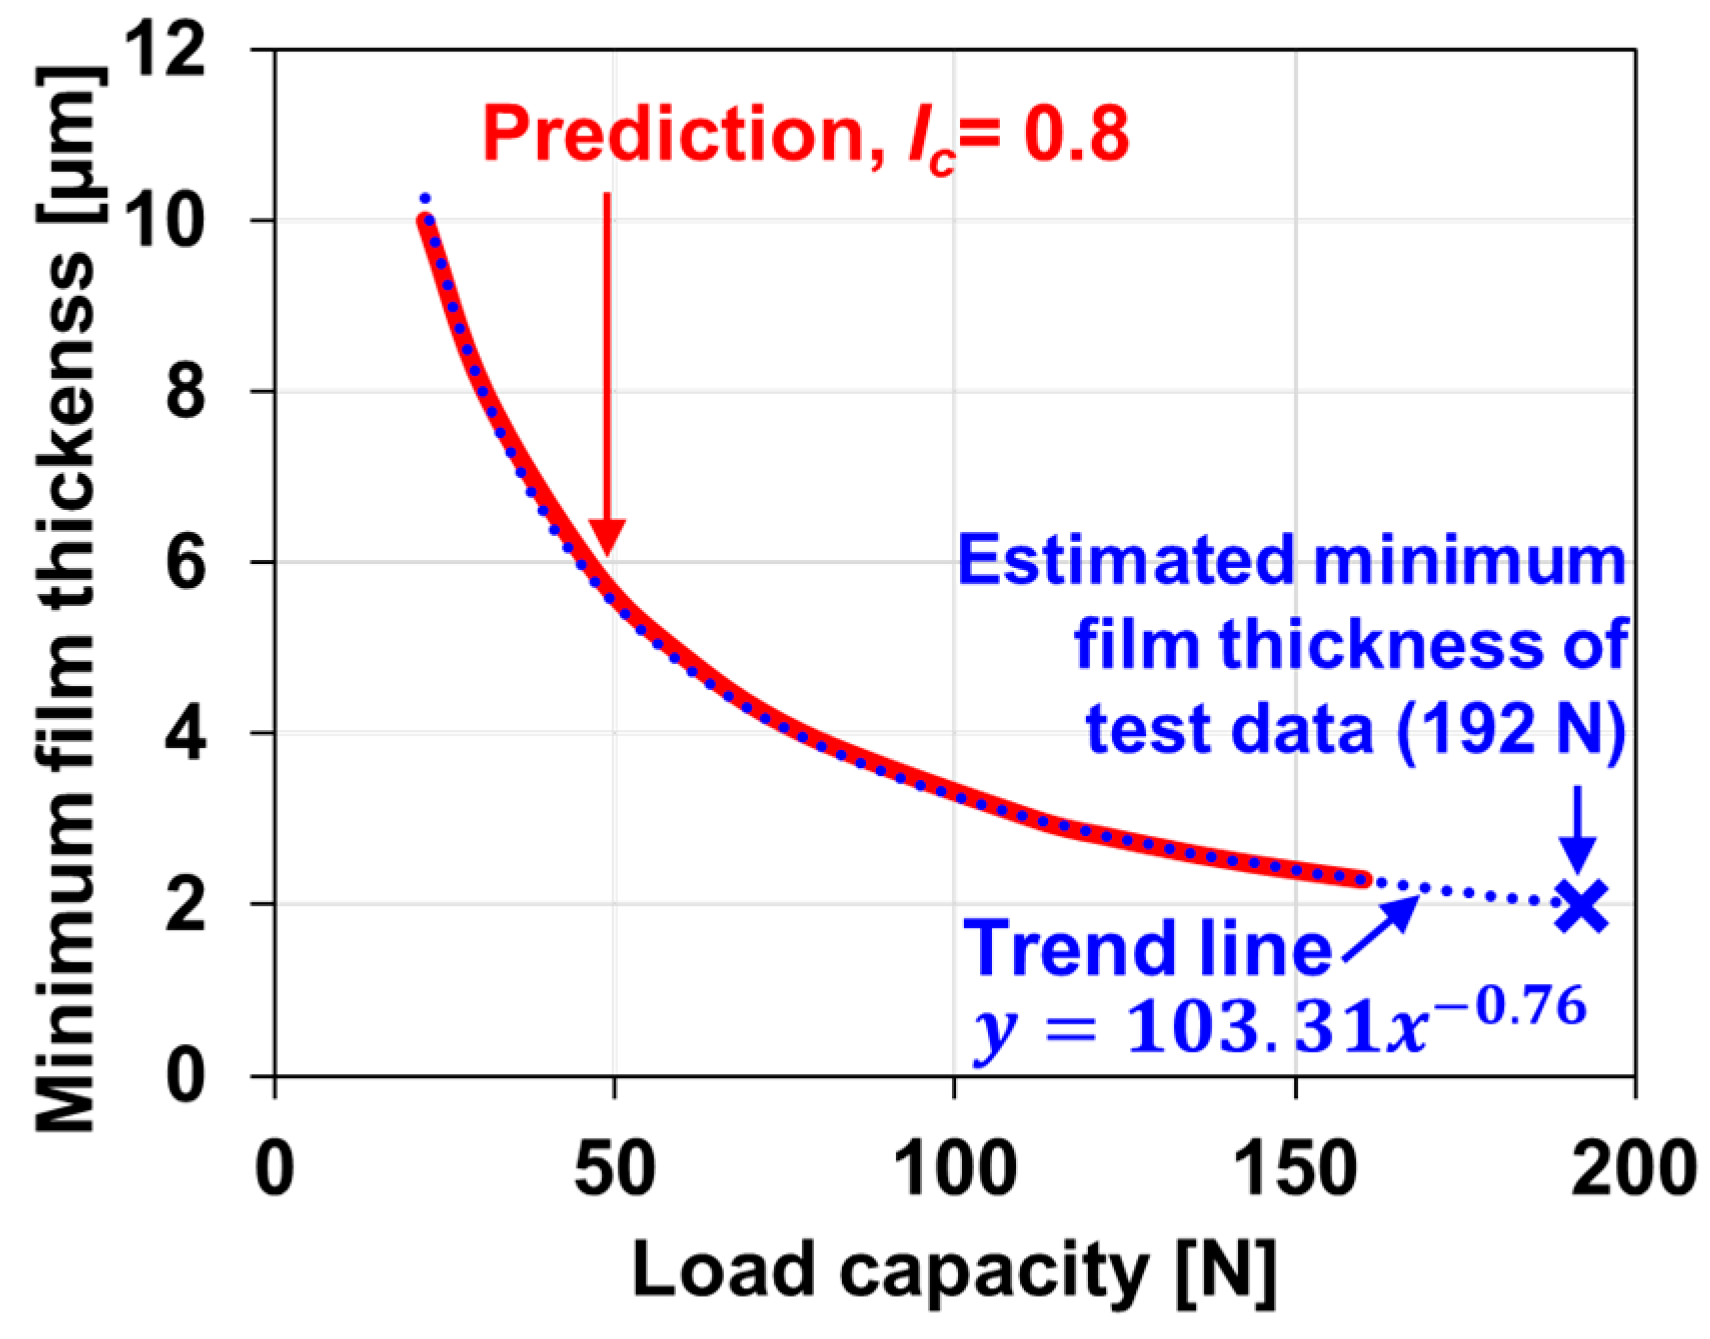
2.5. Model Validations

This section compares the predicted results to the test data to validate the developed model. Figure 12 shows the predicted height of the test GFTB versus the foil angle at the outer, middle, and inner radii compared with the measurement in Figure 3. An incline coefficient (Ic) of 0.8 is used for the predictions. In general, the predictions are in suitable agreement with the measurements. Presumably, the slight discrepancy at the inner radius is attributed to the height of the manufactured bumps at the inner radius being lower than that at the middle and outer radii. The maximum errors of the prediction results based on the measurement results in the incline areas of the inner, middle, and outer radii are 8.9% (top foil angle of 15 degrees), 6.7% (top foil angle of 20 degrees), and 9.5% (top foil angle of 25 degrees), respectively.
Figure 13 shows the predicted drag torque versus static load in the range between 20 N and 160 N at a rotor speed of 60 krpm. The prediction is compared to the measured test data obtained during the maximum load capacity test in Figure 9. Both the prediction and test data show that the drag torque increases linearly with static load, with both having excellent correlation. The maximum error in the prediction results based on the measurement results is about 27% at around 20 N, which is a low static load.
Figure 14 shows the predicted minimum film thickness versus static load at a rotor speed of 60 krpm. As the static load increases up to 160 N, the minimum film thickness decreases nonlinearly until its value reaches ~2.3 µm, which is the smallest value that the developed computational tool can predict. The trend line up to the measured maximum load capacity of 192 N implies that the minimum film thickness for the test GFTB is as small as 2.0 µm.

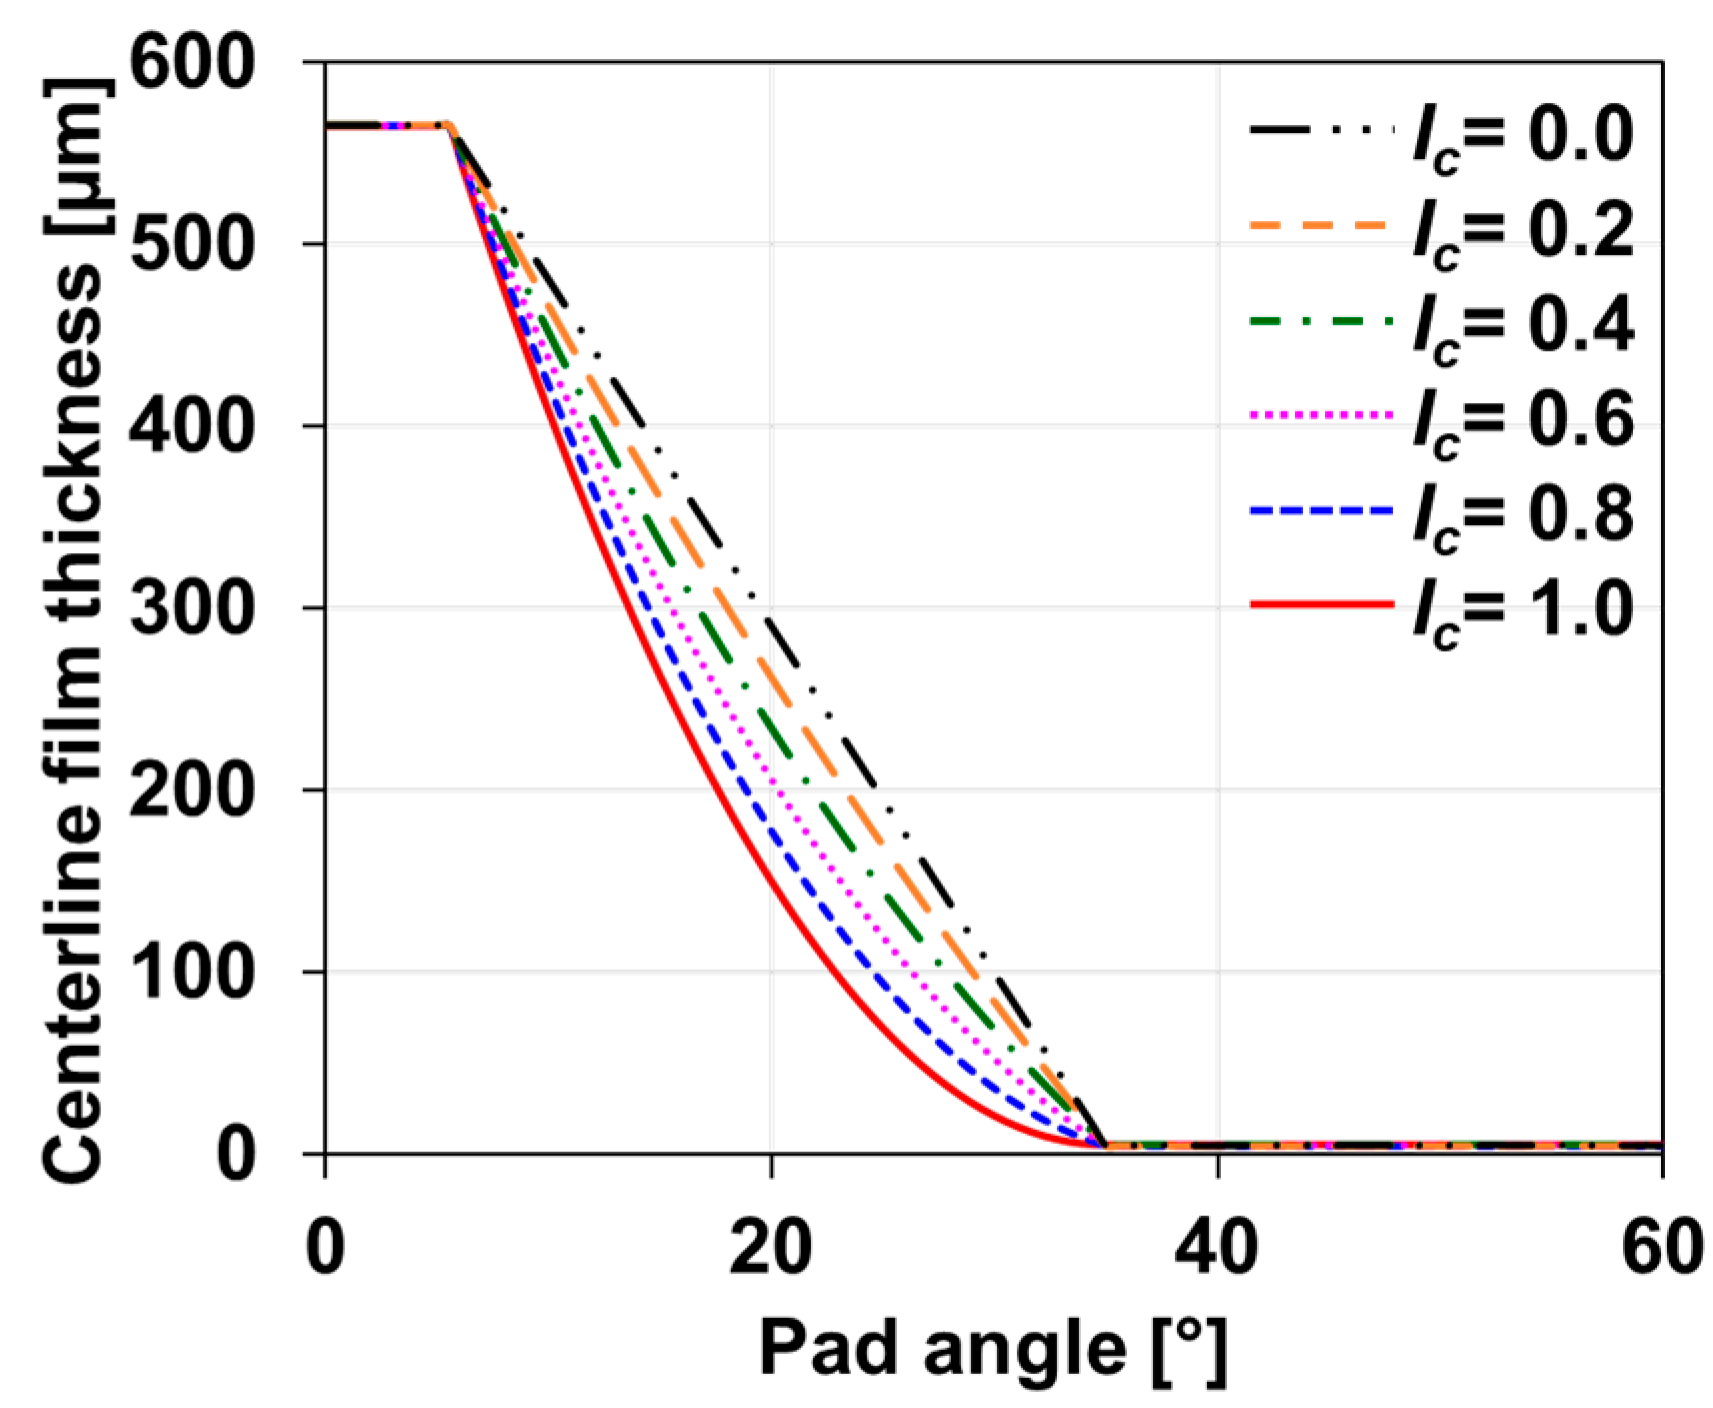
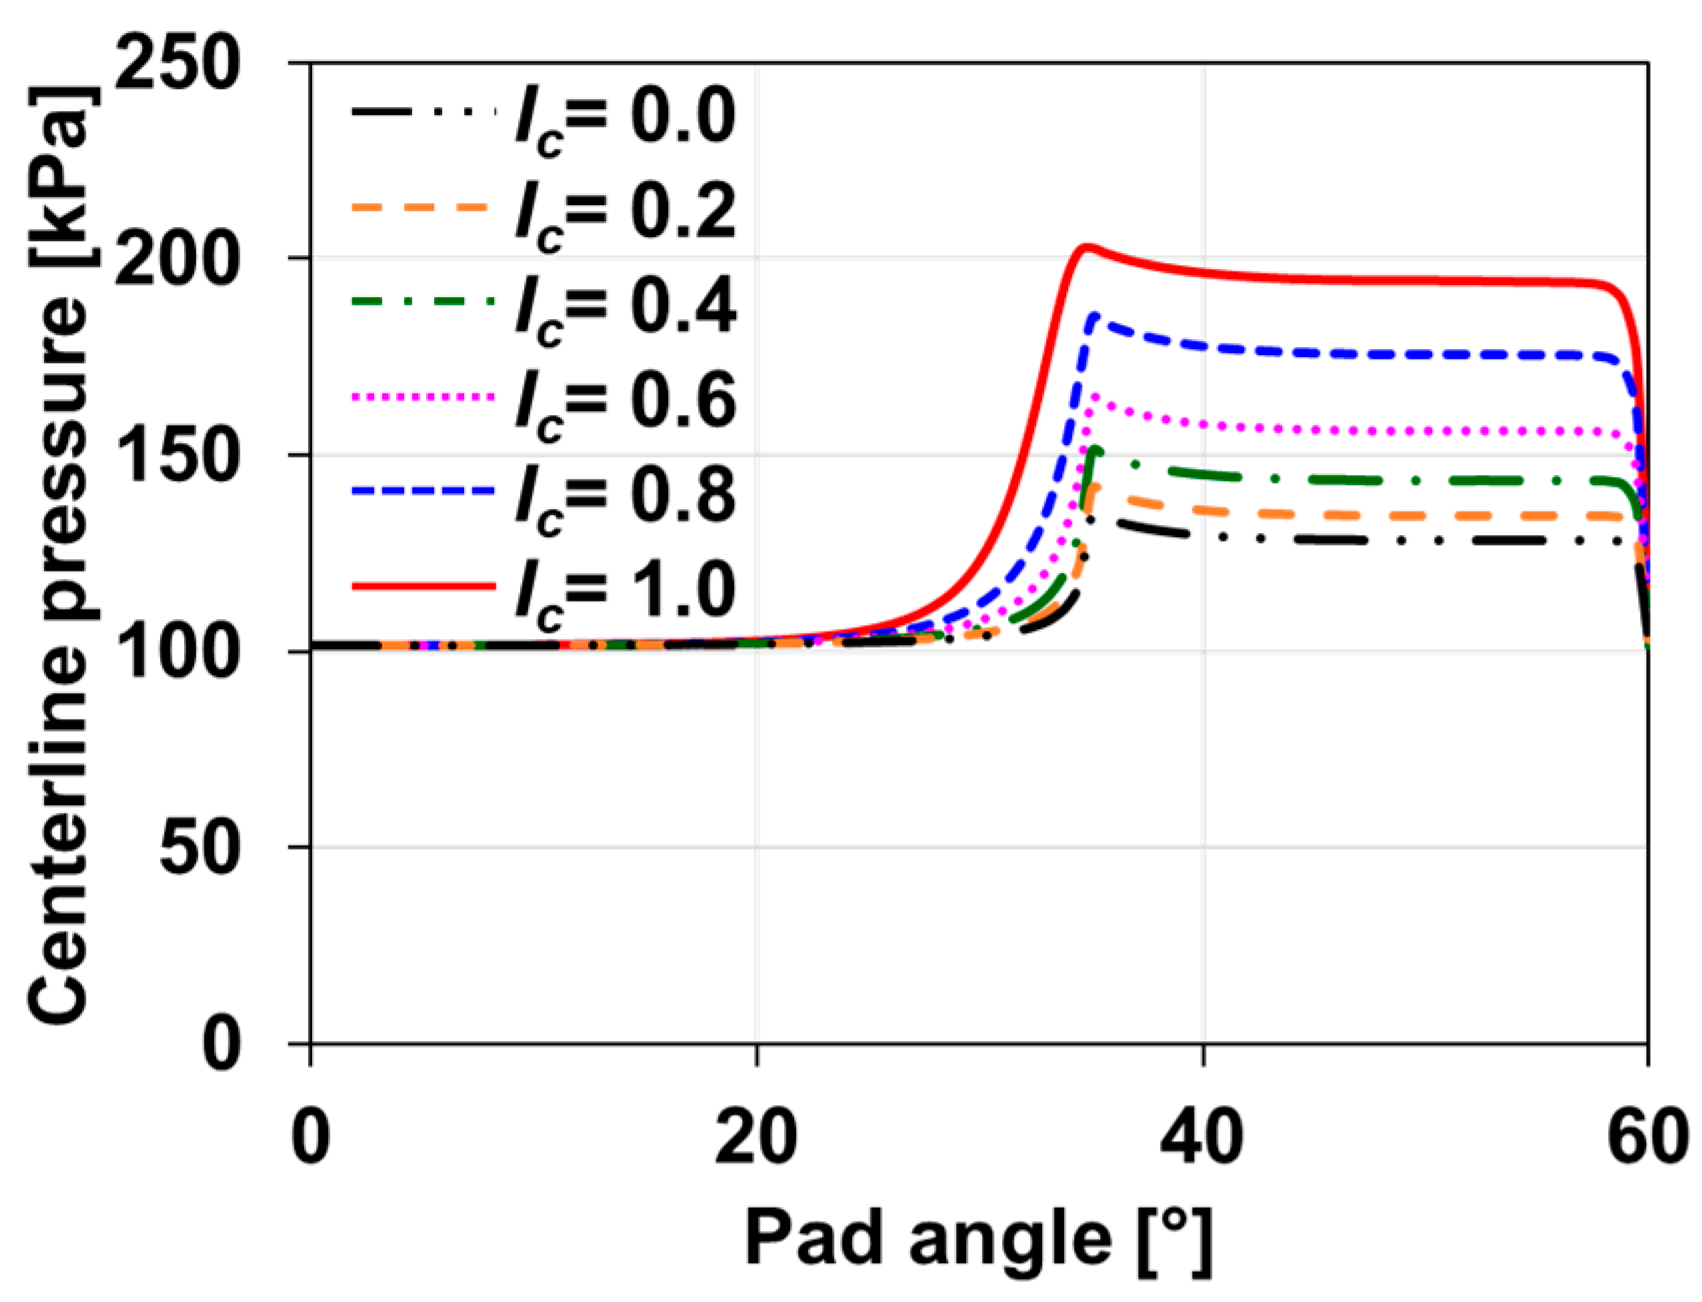
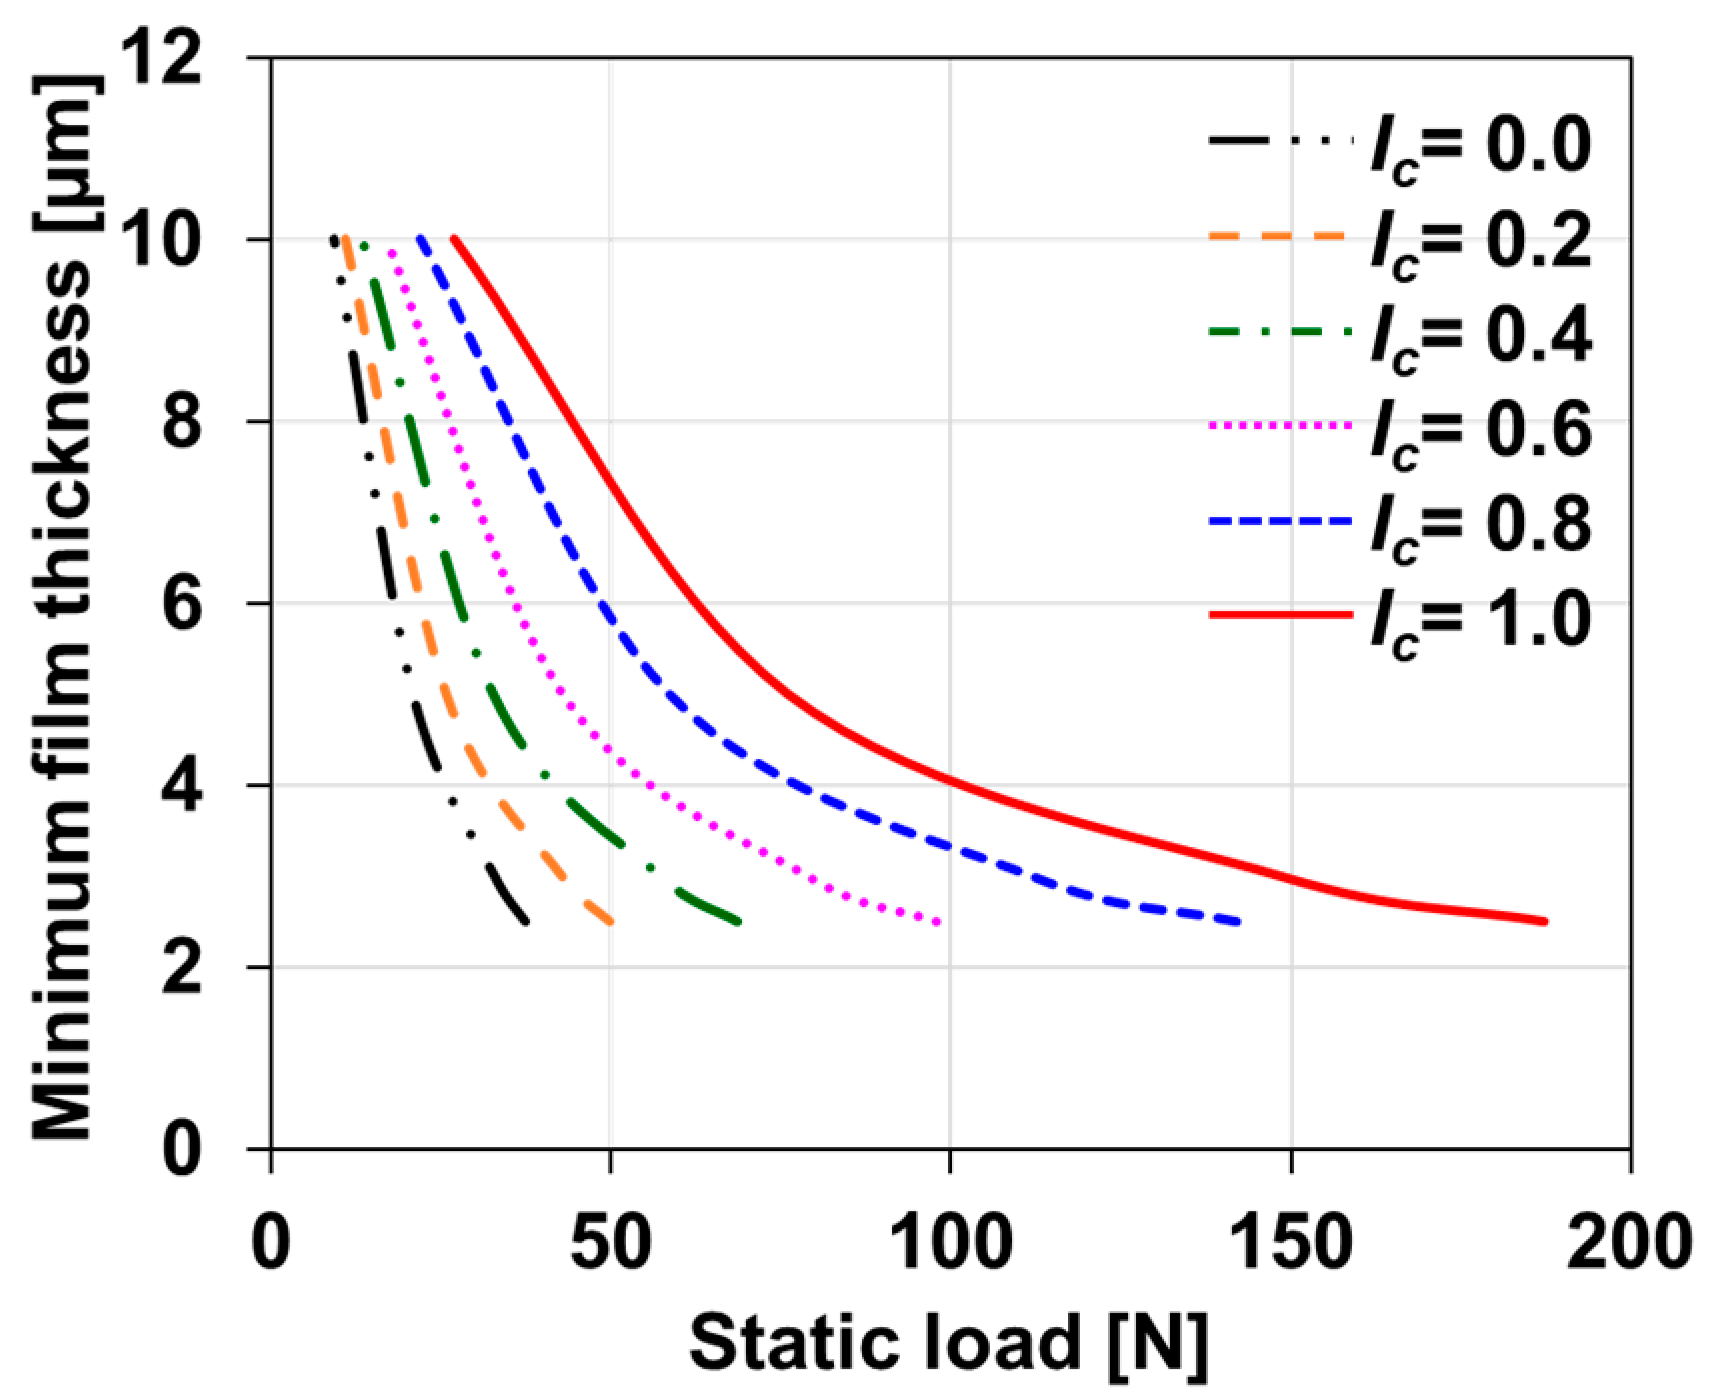
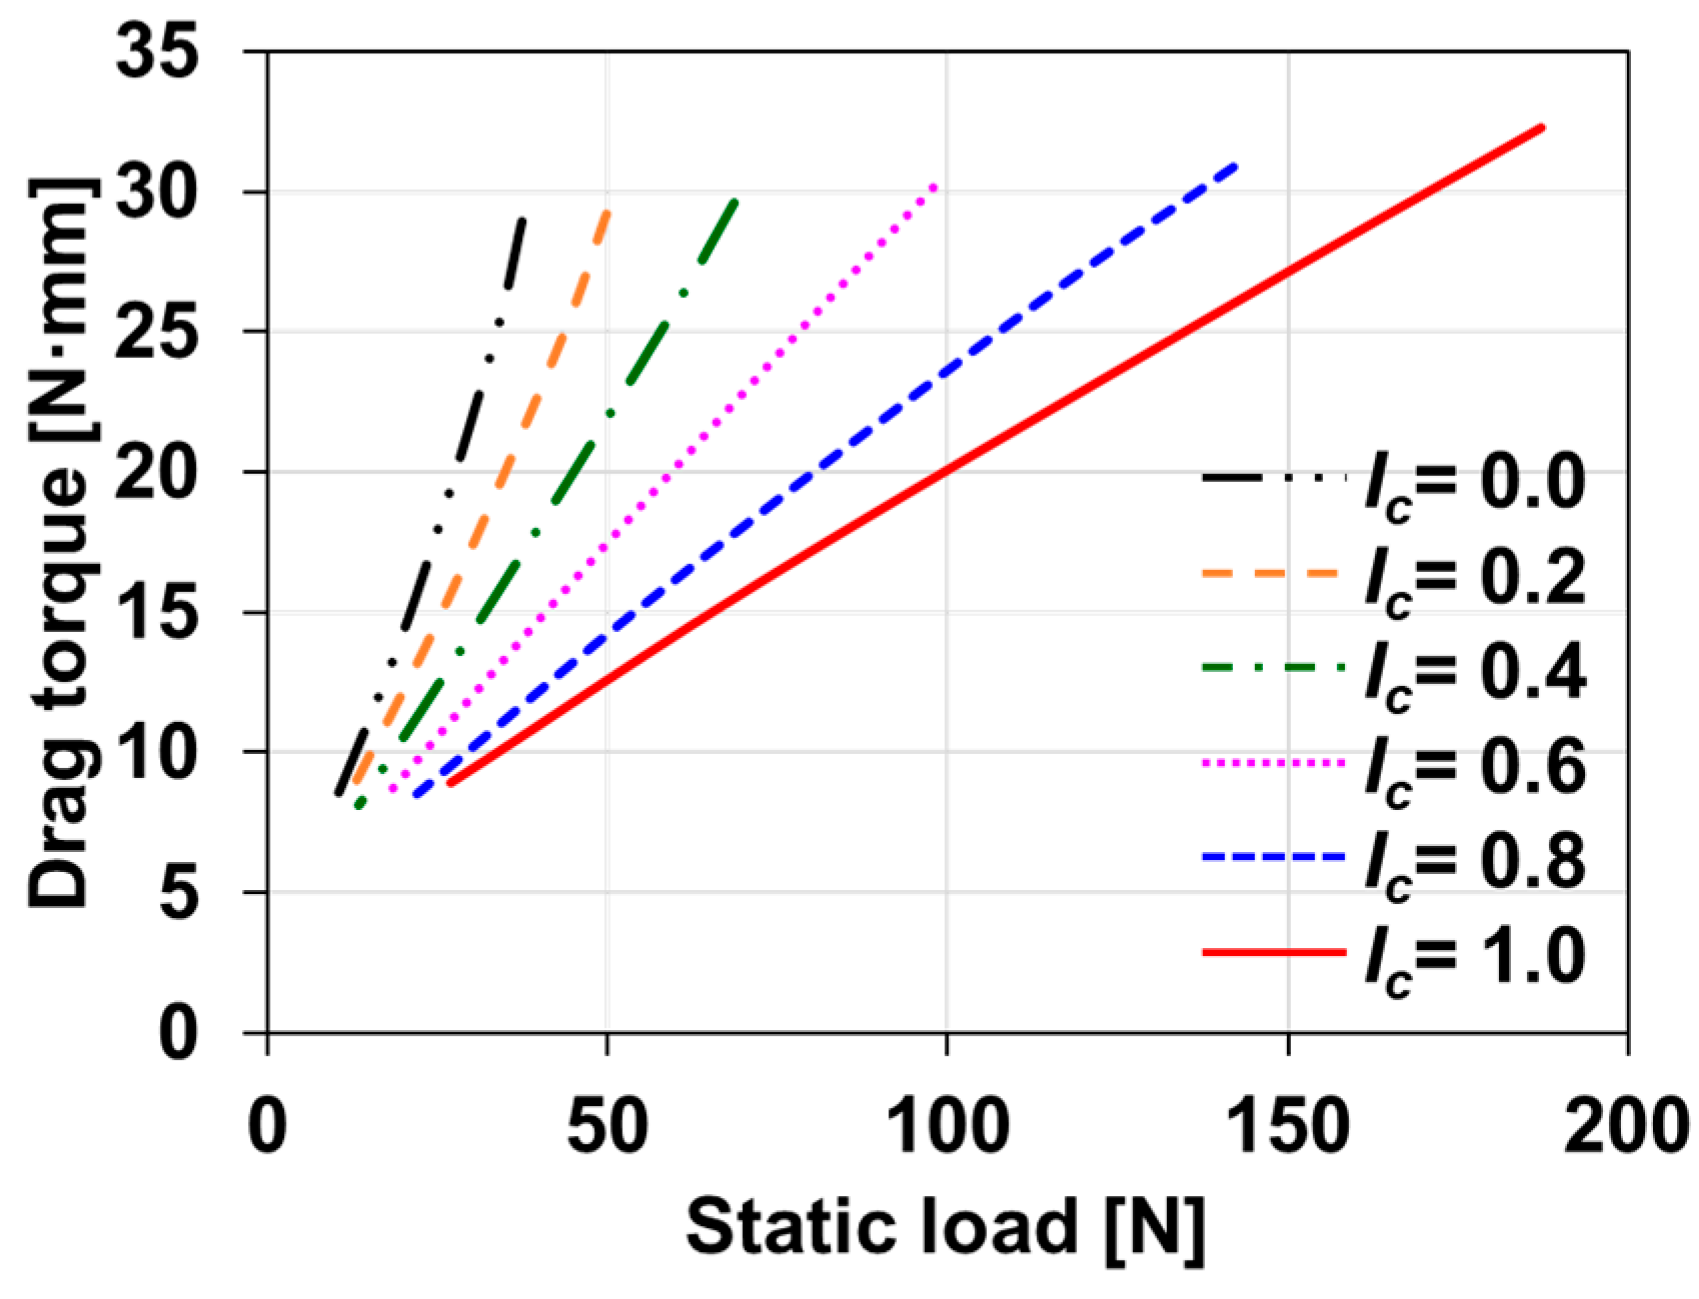
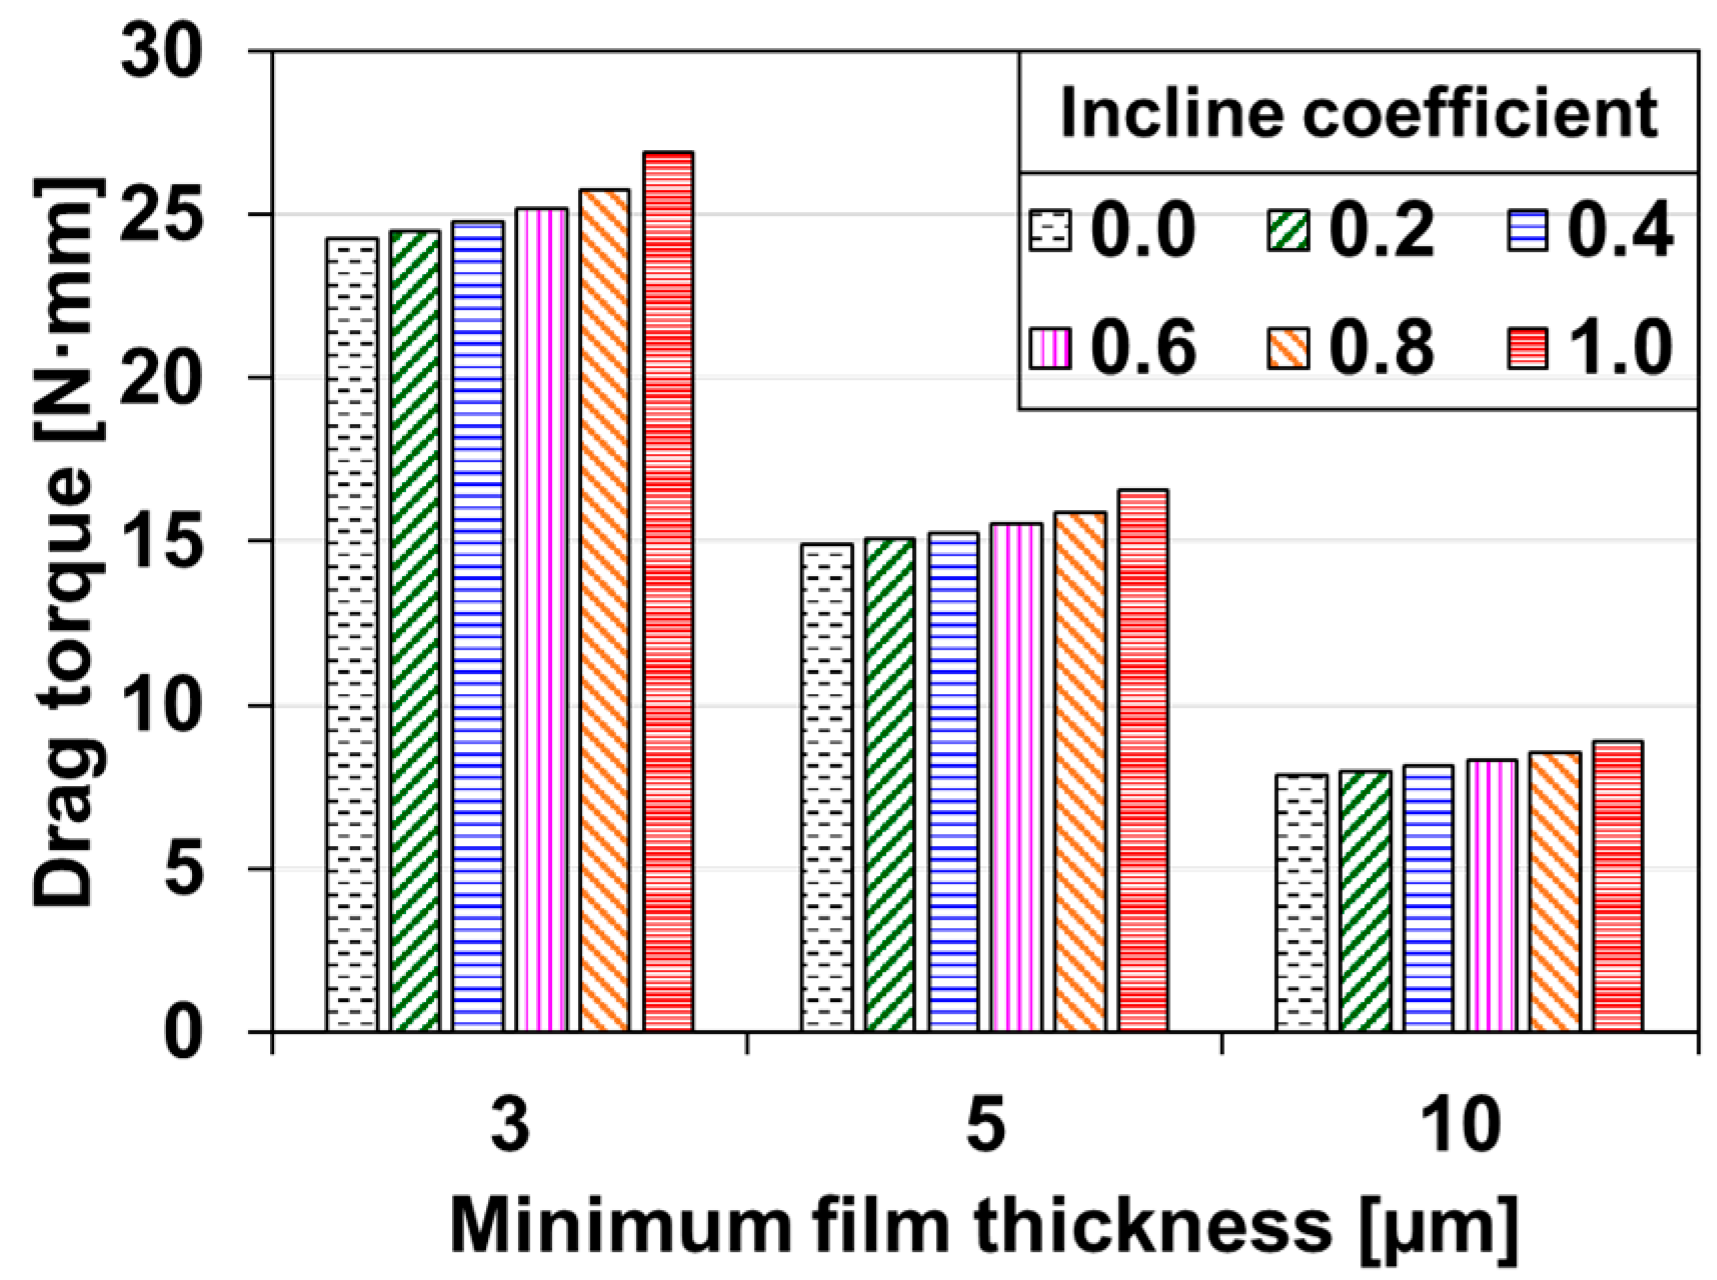
2.6. Effect of the Curved Shape for the Incline Geometry on the Performance of GFTBs

This section conducts a parametric study to analyze the effect of the incline coefficient, Ic, on the static performance of the GFTB. Figure 15 and Figure 16 show the predicted centerline film thickness versus angle and pressure versus angle, respectively, for increasing incline coefficients at a minimum film thickness of 10 µm and rotor speed of 60 krpm. The centerline film thickness decreases drastically in the incline area due to the large incline height. The incline shape is linear for the incline coefficient, Ic = 0.0. As the incline coefficient increases up to 1.0, the incline shape becomes more convex. In Figure 16, the hydrodynamic pressure is smallest for Ic = 0.0 and increases with the increasing Ic.
Figure 17 shows the predicted minimum film thickness versus static load for increasing incline coefficients at a rotor speed of 60 krpm. As the bearing static load increases, the minimum film thickness decreases nonlinearly. Most importantly, the predicted static load increases drastically with the increasing incline coefficients at an identical minimum film thickness, implying that the incline coefficient significantly affects the maximum load capacity of the GFTB.
Figure 18 shows the predicted drag torque versus static load for increasing incline coefficients at a rotor speed of 60 krpm. The drag torque increases linearly with static load and decreases with increasing incline coefficient. The largest predicted drag torque for Ic = 0.0 is attributed to the smallest minimum film thickness, as shown in Figure 19. The results imply that the curved incline can reduce the drag torque when compared to the linear incline for an identical static load.
Figure 19 summarizes the predicted load capacity and drag torque for increasing incline coefficients for minimum film thicknesses of 3, 5, and 10 µm at a rotor speed of 60 krpm. The load capacity of GFTBs increases with the incline coefficient for the same minimum film thickness. The increase in the load capacity becomes the most prominent for the smallest value of the minimum film thickness of 3 µm. The increase in the drag torque with increasing incline coefficient is relatively less significant compared to that in the load capacity.

3. Conclusions

The paper presents the performance measurements and predictions of GFTBs with curved incline geometry. The estimated inclined height reveals that the test GFTB has a curved taper–flat land geometry with a constant taper length along the bearing radius. A series of lift-off tests reveals that the stall torque at start-up and lift-off speed increase with the preload. A load capacity test demonstrates that the increase in the static load results in an increase in bearing drag torque. An incline height equation for the test GFTB is developed using the quadratic–linear curve model. The predicted heights benchmark well with the measurements of the test GFTB. The Reynolds equation for the compressible flow and the simple elastic foundation model predict the static load and drag torque of the GFTB. The predicted drag torque increases linearly with the static load and agrees well with the test data. The minimum film thickness at the maximum load capacity of the test GFTB is inferred from the model prediction to be as small as 2.0 µm. In addition, a parametric study using the predictive model shows that an increase in the incline coefficient greatly enhances the hydrodynamic pressure generation, thus significantly increasing the load capacity of the GFTB.

Author Contributions

Conceptualization, S.H.H. and T.H.K.; methodology, S.H.H. and T.H.K.; formal analysis, S.H.H. and S.M.M.; investigation, S.H.H. and S.M.M.; writing—original draft preparation, S.H.H.; writing—review and editing, S.H.H., S.M.M. and T.H.K.; supervision, T.H.K.; project administration, T.H.K. All authors have read and agreed to the published version of the manuscript.

Funding

The authors acknowledge the support of the Korea Energy Technology Evaluation and Planning (KETEP) grant funded by the Korea Ministry of Trade, Industry and Energy (MOTIE) (grant no. 2021202080026D).

Data Availability Statement

The data presented in this study are available on request from the corresponding author.

Conflicts of Interest

The authors declare no conflict of interest.

References

  1. Agrawal, G.L. Foil Air/Gas Bearing Technology—An Overview. Turbo Expo Power Land Sea Air 1997, 78682, V001T04A006. [Google Scholar]
  2. Agrawal, G.L. Foil Air Bearings Cleared to Land. Mech. Eng. 1998, 120, 78–80. [Google Scholar] [CrossRef]
  3. DellaCorte, C. Oil-Free Shaft Support System Rotordynamics: Past, Present and Future Challenges and Opportunities. Mech. Syst. Signal Process. 2012, 29, 67–76. [Google Scholar] [CrossRef]
  4. Heshmat, H.; Walowit, J.A.; Pinkus, O. Analysis of Gas Lubricated Compliant Thrust Bearings. J. Lubr. Technol. 1983, 105, 638–646. [Google Scholar] [CrossRef]
  5. Iordanoff, I. Analysis of an Aerodynamic Compliant Foil Thrust Bearing: Method for a Rapid Design. J. Tribol. 1999, 121, 816–822. [Google Scholar] [CrossRef]
  6. Dellacorte, C.; Valco, M. Load Capacity Estimation of Foil Air Journal Bearings for Oil-Free Turbomachinery Applications. STLE Tribol. Trans. 2000, 43, 795–801. [Google Scholar] [CrossRef]
  7. Dickman, J.R. An Investigation of Gas Foil Thrust Bearing Performance and Its Influencing Factors. Master’s Thesis, Case Western Reserve University, Cleveland, OH, USA, 2010. [Google Scholar]
  8. Dykas, B.D.; Tellier, D.W. A Foil Thrust Bearing Test Rig for Evaluation of High Temperature Performance and Durability; Report No. ARL-MR-0692; Army Research Laboratory: Adelphi, MD, USA, 2008. [Google Scholar]
  9. Dykas, B.D.; Prahl, J.; DellaCorte, C.; Bruckner, R. Thermal Management Phenomena in Foil Gas Thrust Bearings. Turbo Expo. Power Land Sea Air 2006, 42401, 1417–1423. [Google Scholar]
  10. Dykas, B.D. Factors Influencing the Performance of Foil Gas Thrust Bearings for Oil-Free Turbomachinery Applications. Ph.D. Thesis, Case Western Reserve University, Cleveland, OH, USA, 2006. [Google Scholar]
  11. Park, D.J.; Kim, C.H.; Jang, G.H.; Lee, Y.B. Theoretical Considerations of Static and Dynamic Characteristics of Air Foil Thrust Bearing with Tilt and Slip Flow. Tribol. Int. 2008, 41, 282–295. [Google Scholar] [CrossRef]
  12. Lee, Y.-B.; Kim, T.Y.; Kim, C.H. Thrust Bump Air Foil Bearings with Variable Axial Load: Theoretical Predictions and Experiments. Tribol. Trans. 2011, 54, 902–910. [Google Scholar] [CrossRef]
  13. Balducchi, F.; Arghir, M.; Gauthier, R.; Renard, E. Experimental Analysis of The Start-Up Torque of a Mildly Loaded Foil Tthrust Bearing. ASME J. Tribol. 2013, 135, 031702-1. [Google Scholar] [CrossRef]
  14. Lee, D.; Kim, D. Design and Performance Prediction of Hybrid Air Foil Thrust Bearings. J. Eng. Gas Turbines Power 2010, 133, 042501. [Google Scholar] [CrossRef]
  15. San Andrés, L.; Ryu, K.; Diemer, P. Prediction of Gas Thrust Foil Bearing Performance for Oil-Free Automotive Turbochargers. J. Eng. Gas Turbines Power 2014, 137, 032502. [Google Scholar] [CrossRef]
  16. Feng, K.; Liu, L.-J.; Guo, Z.-Y.; Zhao, X.-Y. Parametric study on static and dynamic characteristics of bump-type gas foil thrust bearing for oil-free turbomachinery. Proc. Inst. Mech. Eng. Part J J. Eng. Tribol. 2015, 229, 1247–1263. [Google Scholar] [CrossRef]
  17. Gad, A.M.; Kaneko, S. Tailoring of the bearing stiffness to enhance the performance of gas-lubricated bump-type foil thrust bearing. Proc. Inst. Mech. Eng. Part J J. Eng. Tribol. 2016, 230, 541–560. [Google Scholar] [CrossRef]
  18. Kim, T.H.; Park, M.; Lee, T.W. Design Optimization of Gas Foil Thrust Bearings for Maximum Load Capacity. ASME J. Tribol. 2017, 139, 031705. [Google Scholar] [CrossRef]
  19. Lehn, A.; Mahner, M.; Schweizer, B. Characterization of Static Air Foil Thrust Bearing Performance: An Elasto-Gasdynamic Analysis for Aligned, Distorted and Misaligned Operating Conditions. Arch. Appl. Mech. 2018, 88, 705–728. [Google Scholar] [CrossRef]
  20. Lehn, A.; Mahner, M.; Schweizer, B. A thermo-elasto-hydrodynamic model for air foil thrust bearings including self-induced convective cooling of the rotor disk and thermal runaway. Tribol. Int. 2018, 119, 281–298. [Google Scholar] [CrossRef]
  21. Kim, C.H.; Park, J.S. Testing of Load Capacity of a Foil Thrust Bearing. Tribol. Lubr. 2018, 34, 300–306. [Google Scholar]
  22. Fu, G.; Untaroiu, A.; Swanson, E.E. Effect of Foil Geometry on the Static Performance of Thrust Foil Bearings. J. Eng. Gas Turbines Power 2018, 140, V02CT47A016. [Google Scholar] [CrossRef]
  23. LaTray, N.T. Foil Thrust Bearing with Pocket Grooves and Tailored Bump Stiffness Distribution for Improved Static Performance. Ph.D. Thesis, The University of Texas at Arlington, Arlington, TX, USA, 2018. [Google Scholar]
  24. LaTray, N.; Kim, D. Design of Novel Gas Foil Thrust Bearings and Test Validation in a High-Speed Test Rig. J. Tribol. 2020, 142, 071803. [Google Scholar] [CrossRef]
  25. LaTray, N.; Kim, D. Novel Thrust Foil Bearing with Pocket Grooves for Enhanced Static Performance. J. Tribol. 2021, 143, 1–20. [Google Scholar] [CrossRef]
  26. Guenat, E.; Schiffmann, J. Performance potential of gas foil thrust bearings enhanced with spiral grooves. Tribol. Int. 2018, 131, 438–445. [Google Scholar] [CrossRef]
  27. Samanta, P.; Khonsari, M. The limiting load-carrying capacity of foil thrust bearings. Proc. Inst. Mech. Eng. Part J J. Eng. Tribol. 2017, 232, 1046–1052. [Google Scholar] [CrossRef]
  28. Rieken, M.; Mahner, M.; Schweizer, B. Thermal Optimization of Air Foil Thrust Bearings Using Different Foil Materials. Turbo Expo Power Land Sea Air 2019, 58691, V07BT34A031. [Google Scholar]
  29. Kim, T.H.; Andrés, L.S. Heavily Loaded Gas Foil Bearings: A Model Anchored to Test Data. J. Eng. Gas Turbines Power 2008, 130, 012504. [Google Scholar] [CrossRef]
  30. Eickhoff, M.; Theile, A.; Mayer, M.; Schweizer, B. Analysis of Air Foil Thrust Bearings with annular top foil including wear prediction, Part I: Modeling and simulation. Tribol. Int. 2023, 181, 108174. [Google Scholar] [CrossRef]
Figure 1. Schematic view of typical GFTB structure with six pads.
Lubricants 11 00480 g001
Figure 2. Measurement locations of GFTB height.
Lubricants 11 00480 g002
Figure 3. Averaged height of GFTB versus top foil angle at outer, middle, and inner radii.
Lubricants 11 00480 g003
Figure 4. Photo of bump foil with unwrapped top foil (upper left), surface contour plot (lower left), and three-dimensional (3D) plot (right) of measured GFTB height.
Lubricants 11 00480 g004
Figure 5. GFTB test rig setup: (a) photo (upper) and schematic view (lower) of the test rig; (b) photo of the torque measurement setup.
Lubricants 11 00480 g005
Figure 6. Example of lift-off speed test procedure for GFTB: (a) preload versus time, (b) rotor speed versus time, and (c) drag torque versus time.
Lubricants 11 00480 g006
Figure 7. Measured drag torque versus rotor speed for preloads of 5, 15, and 30 N.
Lubricants 11 00480 g007
Figure 8. Comparison of lift-off speeds for preloads of 5, 15, and 30 N.
Lubricants 11 00480 g008
Figure 9. Procedure of load capacity test for GFTB at a rotor speed of 60 krpm: static load versus time (upper) and drag torque versus time (lower).
Lubricants 11 00480 g009
Figure 10. Schematic of a single pad with varying boundary between the inclined and flat area along the radial direction (left), and schematic view of a quadratic–linear incline geometry in the angular direction (right).
Lubricants 11 00480 g010
Figure 11. Calculated boundary b(rβ between inclined and flat areas of the pad versus radius.
Lubricants 11 00480 g011
Figure 12. Predicted GFTB height versus top foil angle for incline coefficient of 0.8 at outer, middle, and inner radii compared with measured data.
Lubricants 11 00480 g012
Figure 13. Predicted drag torque versus static load for quadratic curved incline model (Ic = 0.8) at a rotor speed of 60 krpm compared with test data.
Lubricants 11 00480 g013
Figure 14. Predicted minimum film thickness versus load capacity for quadratic curved incline model (Ic = 0.8) and estimated minimum film thickness of test data based on prediction results.
Lubricants 11 00480 g014
Figure 15. Predicted centerline film thickness versus top foil angle for increasing incline coefficients at a minimum film thickness of 10 µm and rotor speed of 60 krpm.
Lubricants 11 00480 g015
Figure 16. Predicted centerline pressure versus top foil angle for increasing incline coefficients at a minimum film thickness of 10 µm and rotor speed of 60 krpm.
Lubricants 11 00480 g016
Figure 17. Predicted minimum film thickness versus static load for increasing incline coefficients at a rotor speed of 60 krpm.
Lubricants 11 00480 g017
Figure 18. Predicted drag torque versus static load for increasing incline coefficients at a rotor speed of 60 krpm.
Lubricants 11 00480 g018
Figure 19. Predicted load capacity (upper) and drag torque (lower) for increasing incline coefficients for minimum film thicknesses of 3, 5, and 10 µm at a rotor speed of 60 krpm.
Lubricants 11 00480 g019aLubricants 11 00480 g019b
Table 1. GFTB design parameters and material properties.
ParametersValues
Number of top foils6
Top foil outer radius (r0)30.5 mm
Top foil inner radius (ri)15.5 mm
Pad arc angle (β)60°
Top Foil thickness (tT)200 μm
Bump Foil thickness (tB)90 μm
Incline(ramp) height (hR)500 μm
Bump height (hB)500 μm
Bump pitch (s)3.2 mm
Bump half-length (l0)1.4 mm
Foil modulus of elasticity (E)200 GPa
Foil Poisson’s ratio (ν)0.29
Disclaimer/Publisher’s Note: The statements, opinions and data contained in all publications are solely those of the individual author(s) and contributor(s) and not of MDPI and/or the editor(s). MDPI and/or the editor(s) disclaim responsibility for any injury to people or property resulting from any ideas, methods, instructions or products referred to in the content.

