Effect of Sliding on the Relation of Tribofilm Thickness and Wear

Abstract
:
1. Introduction
2. Materials and Methods
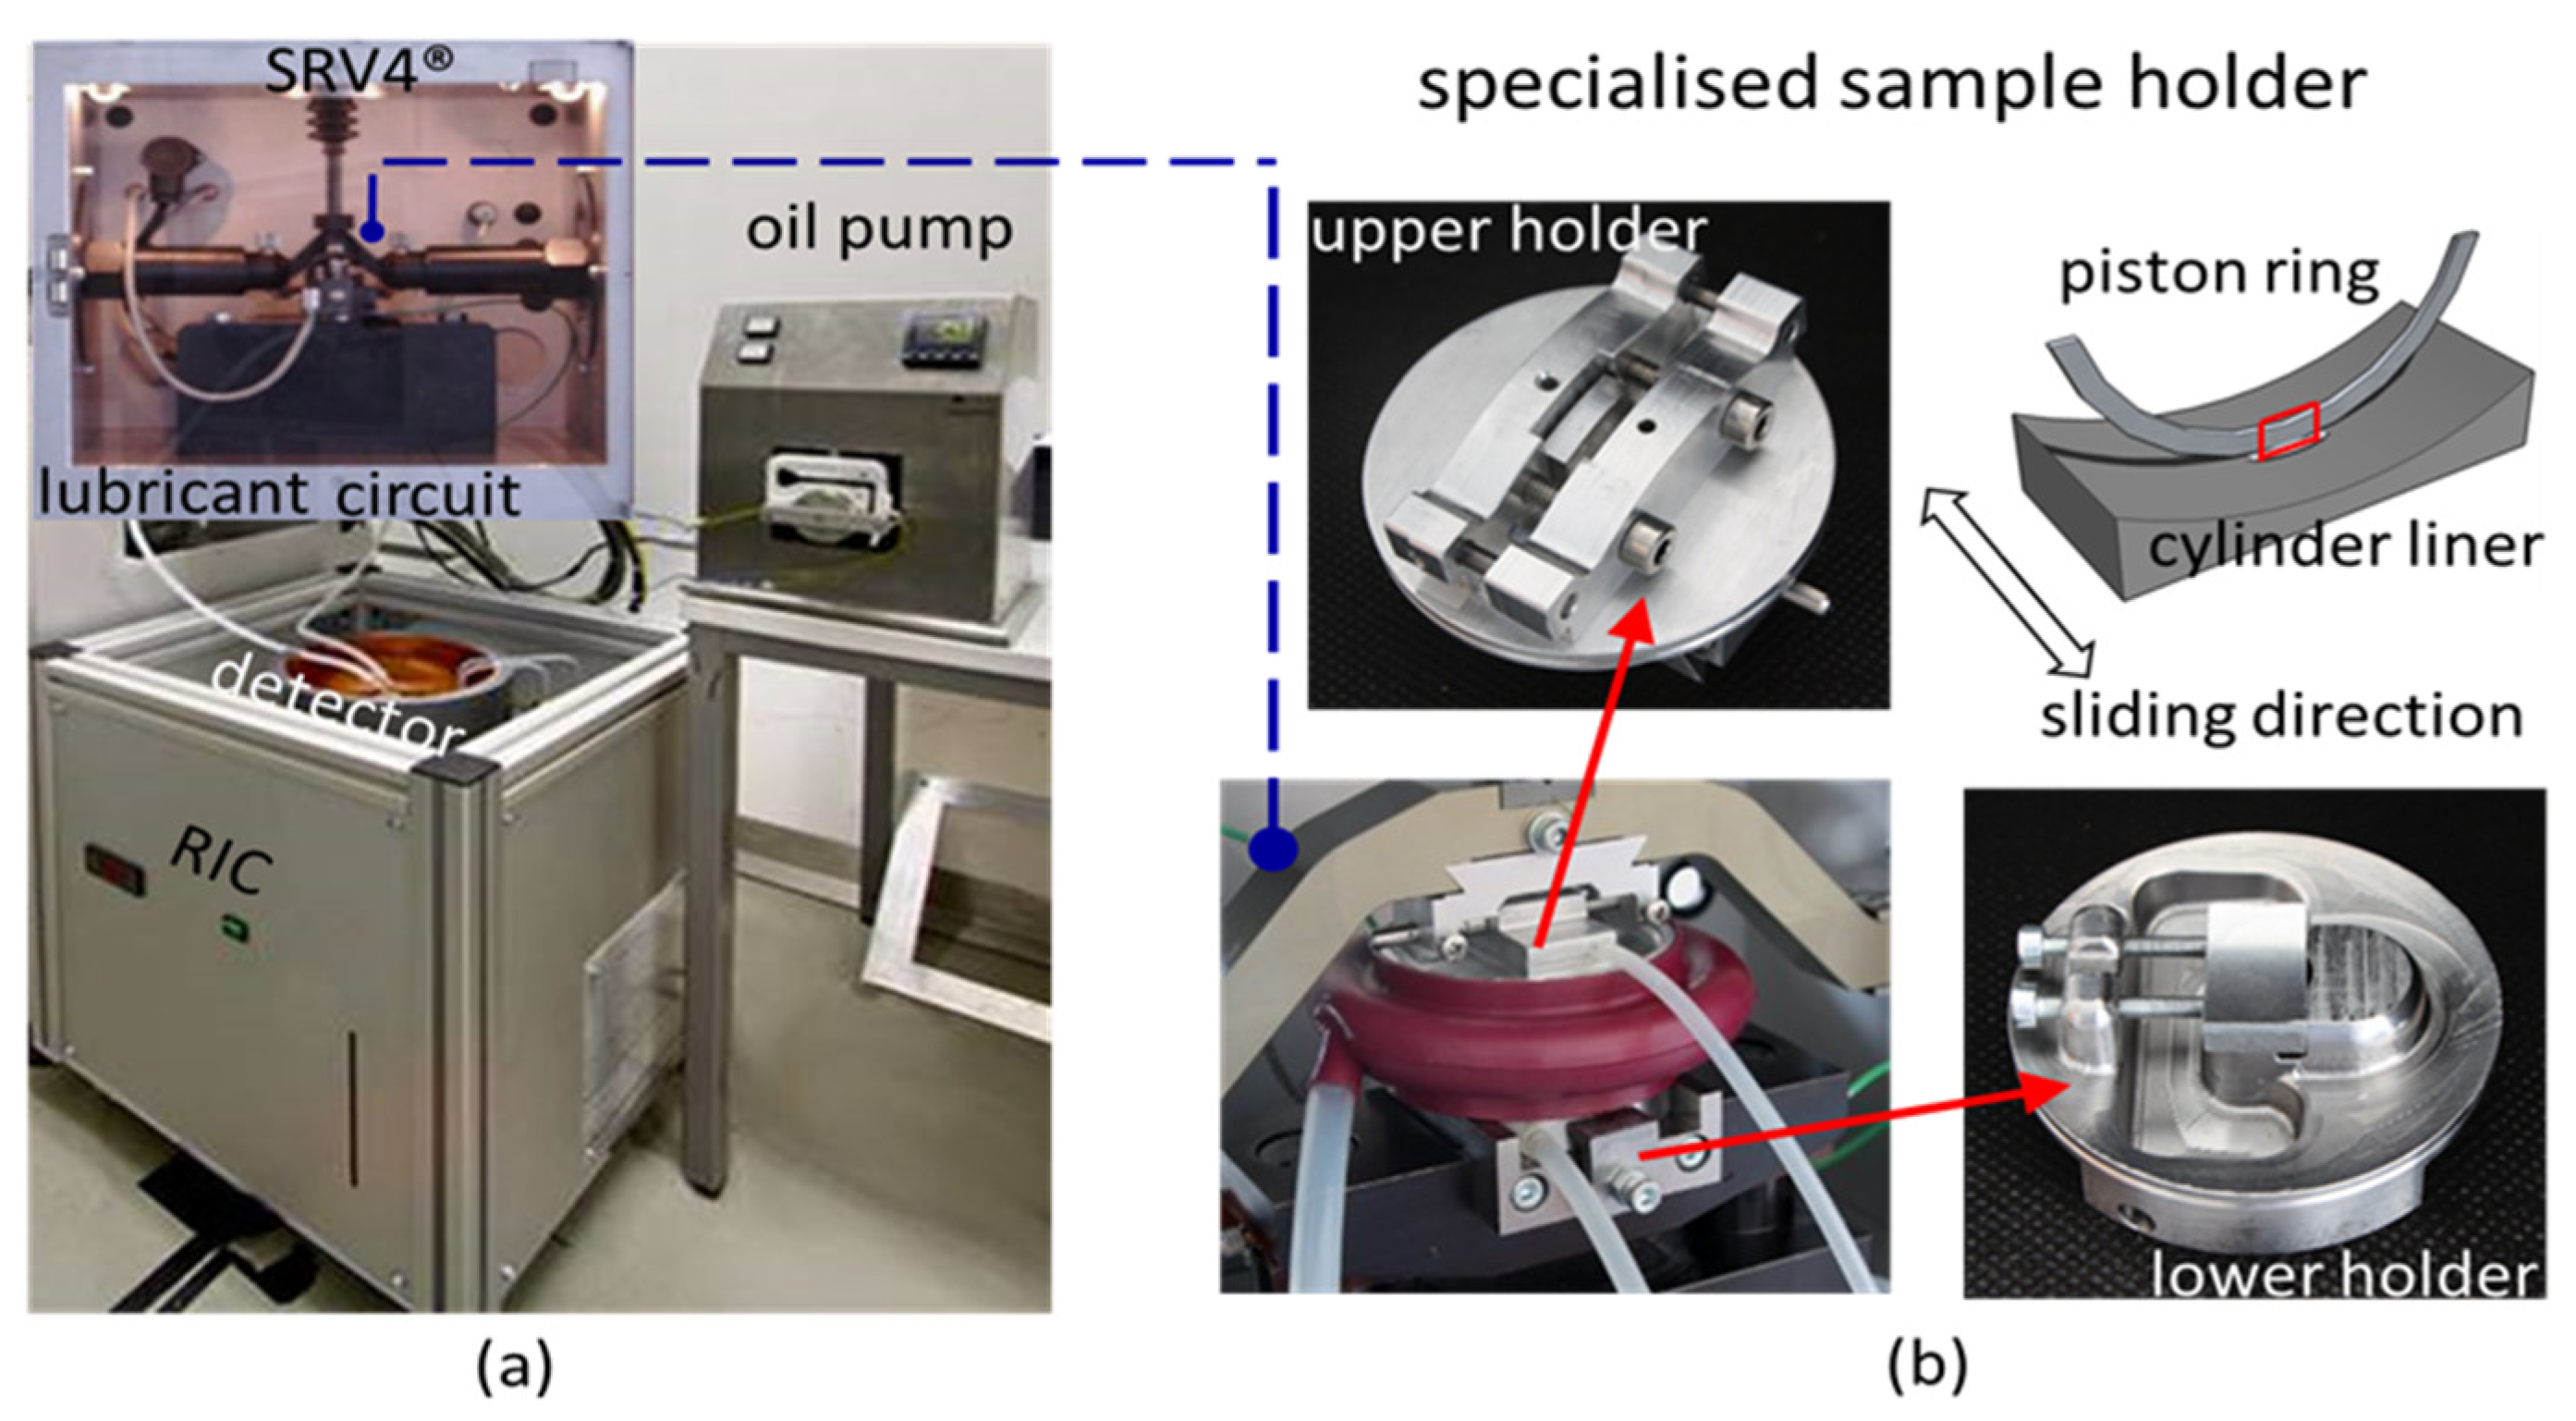
2.1. Tribological Testing
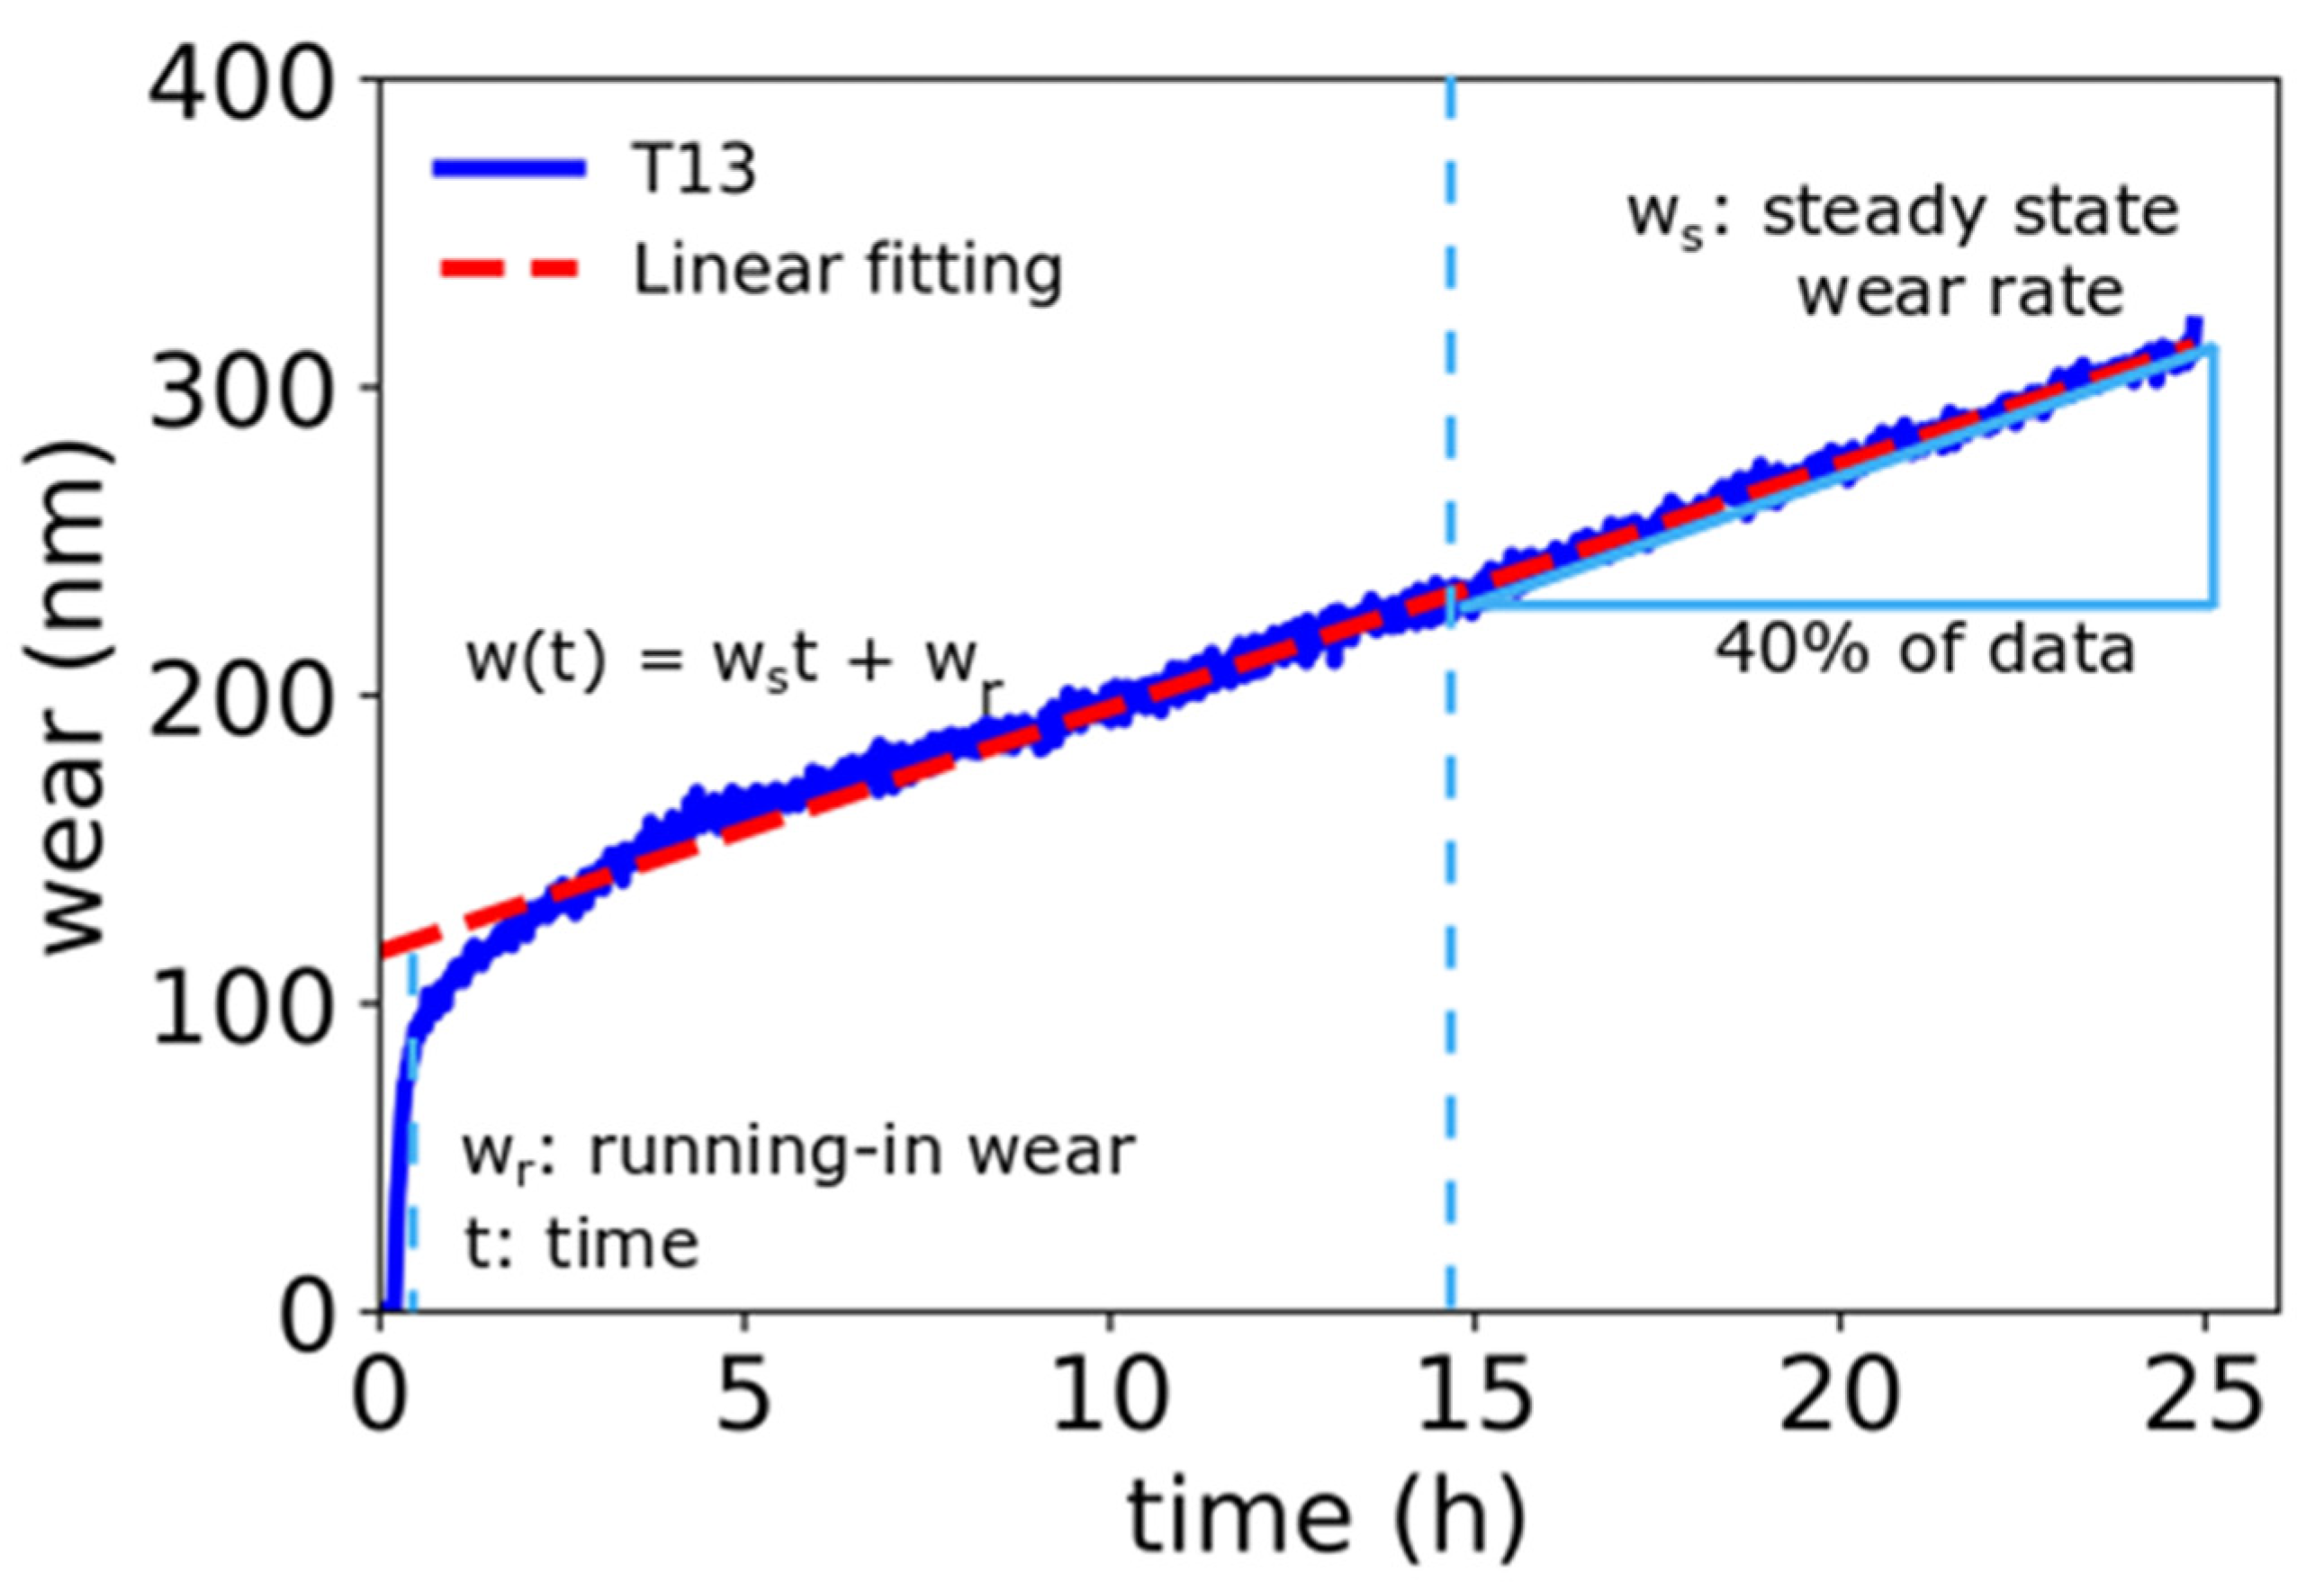
2.2. Wear Measurements
2.3. Surface Analysis
3. Results
3.1. Effect of Load, Frequency, and Temperature on Friction and Wear Behaviour
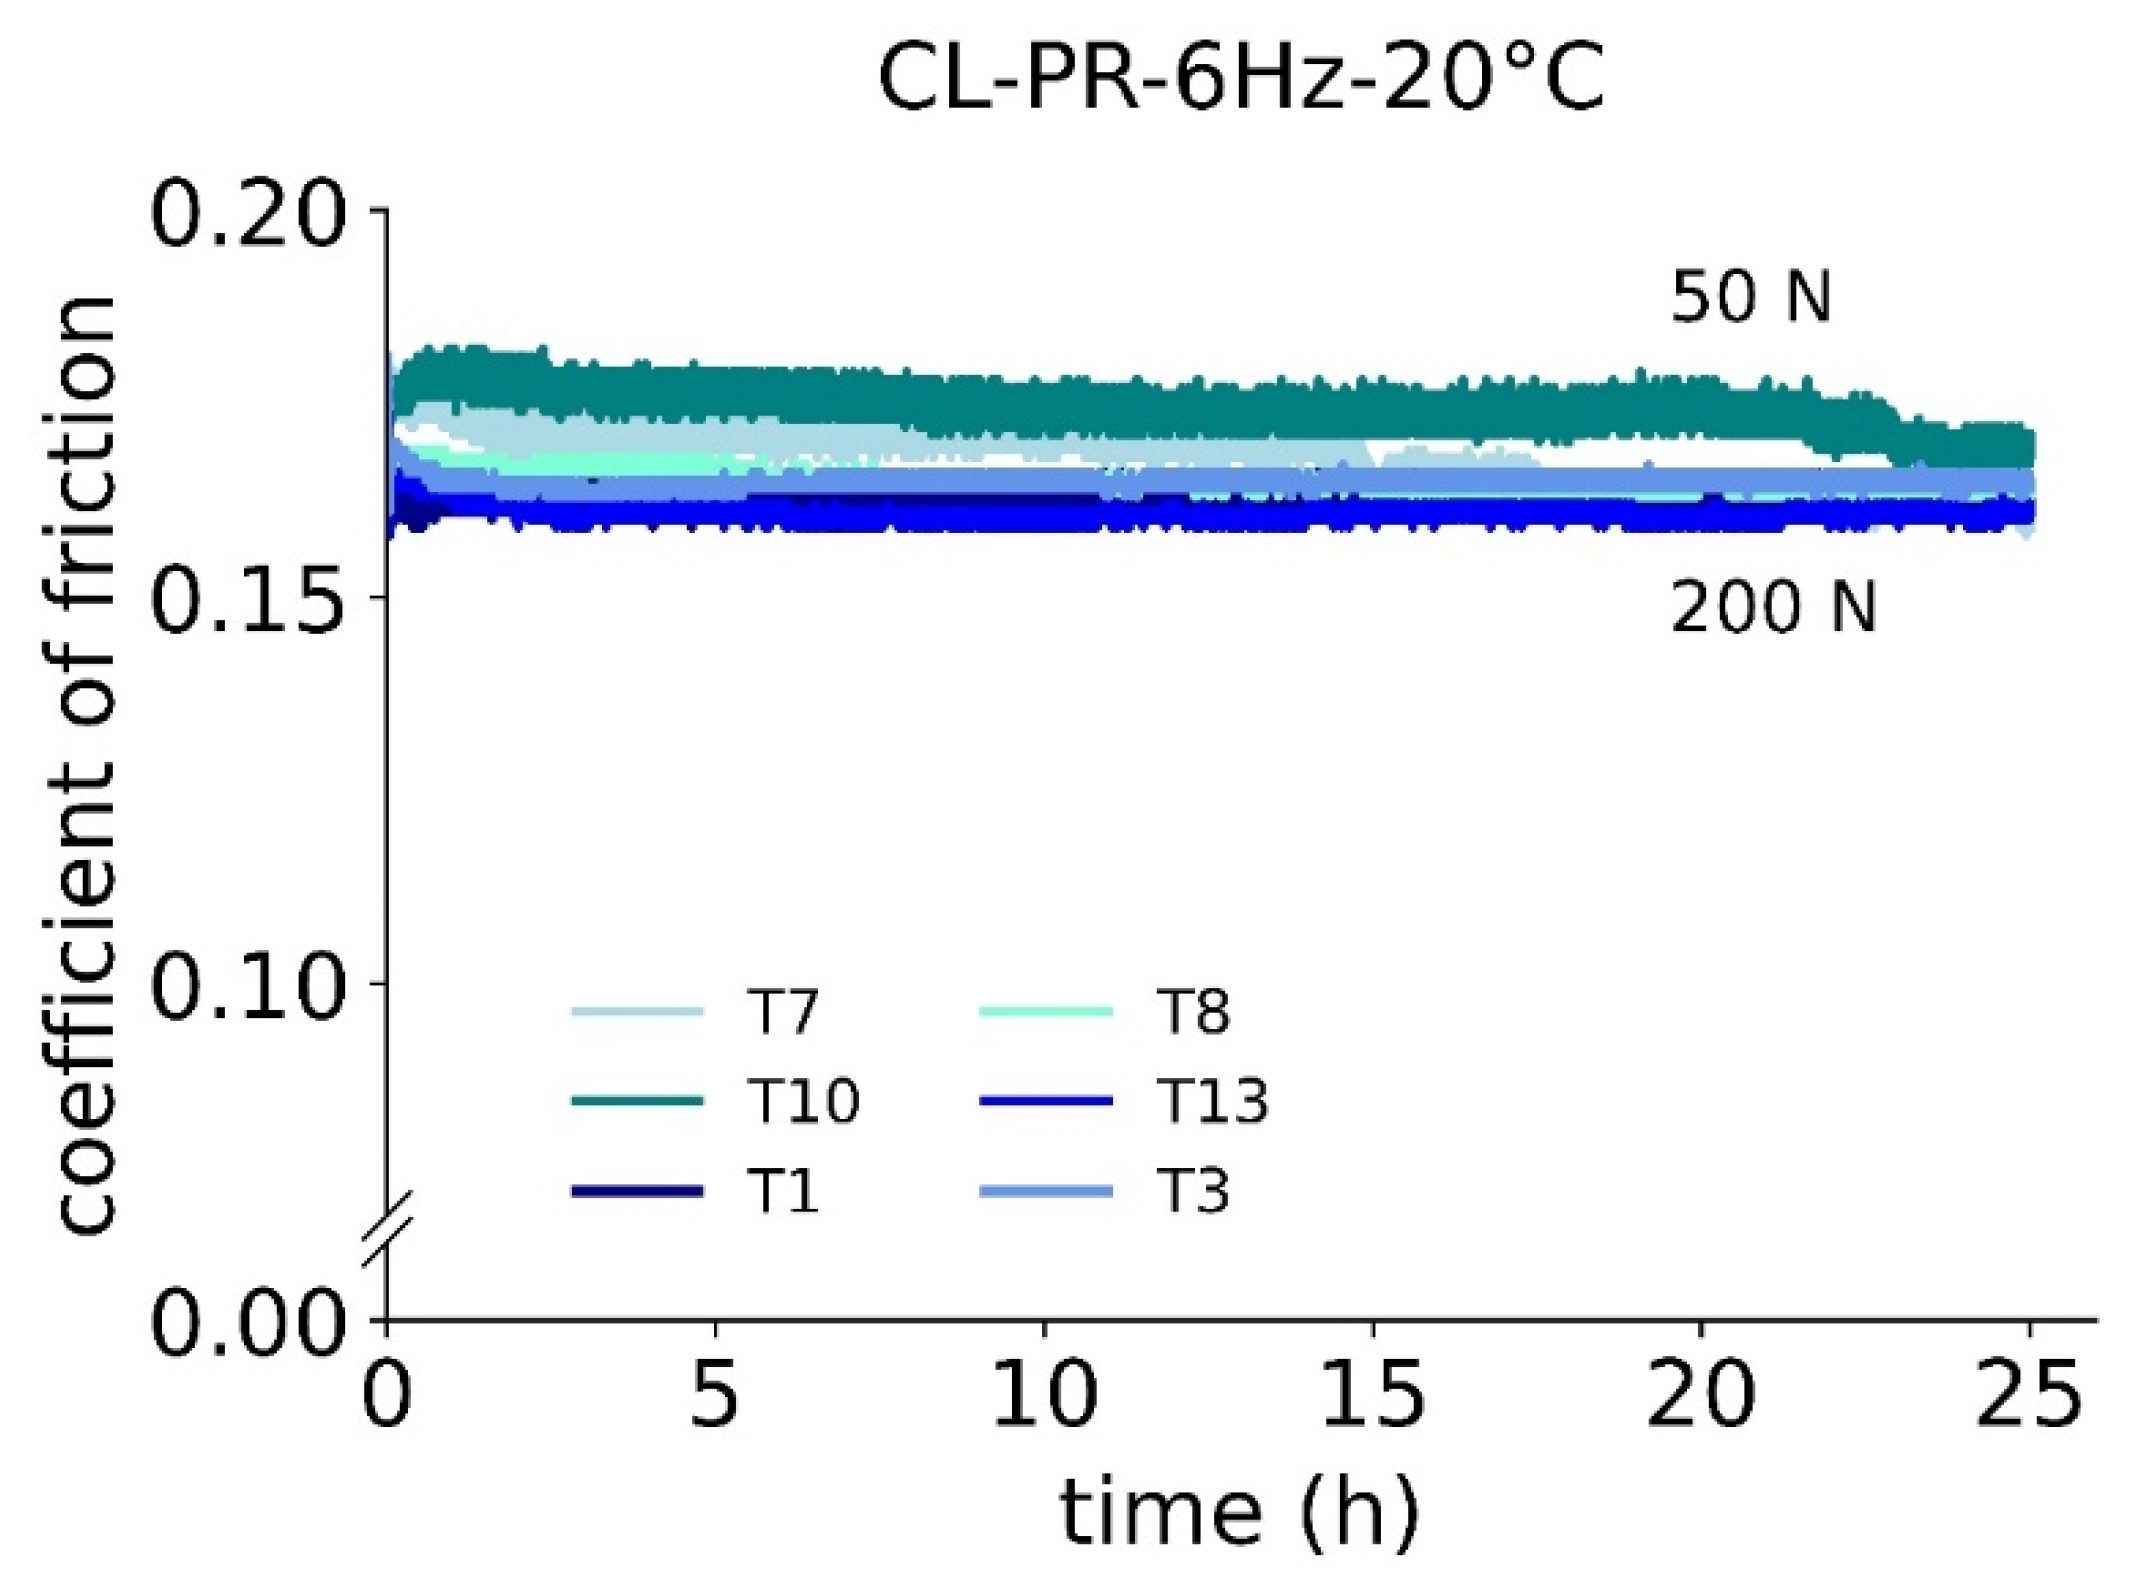
3.1.1. Load
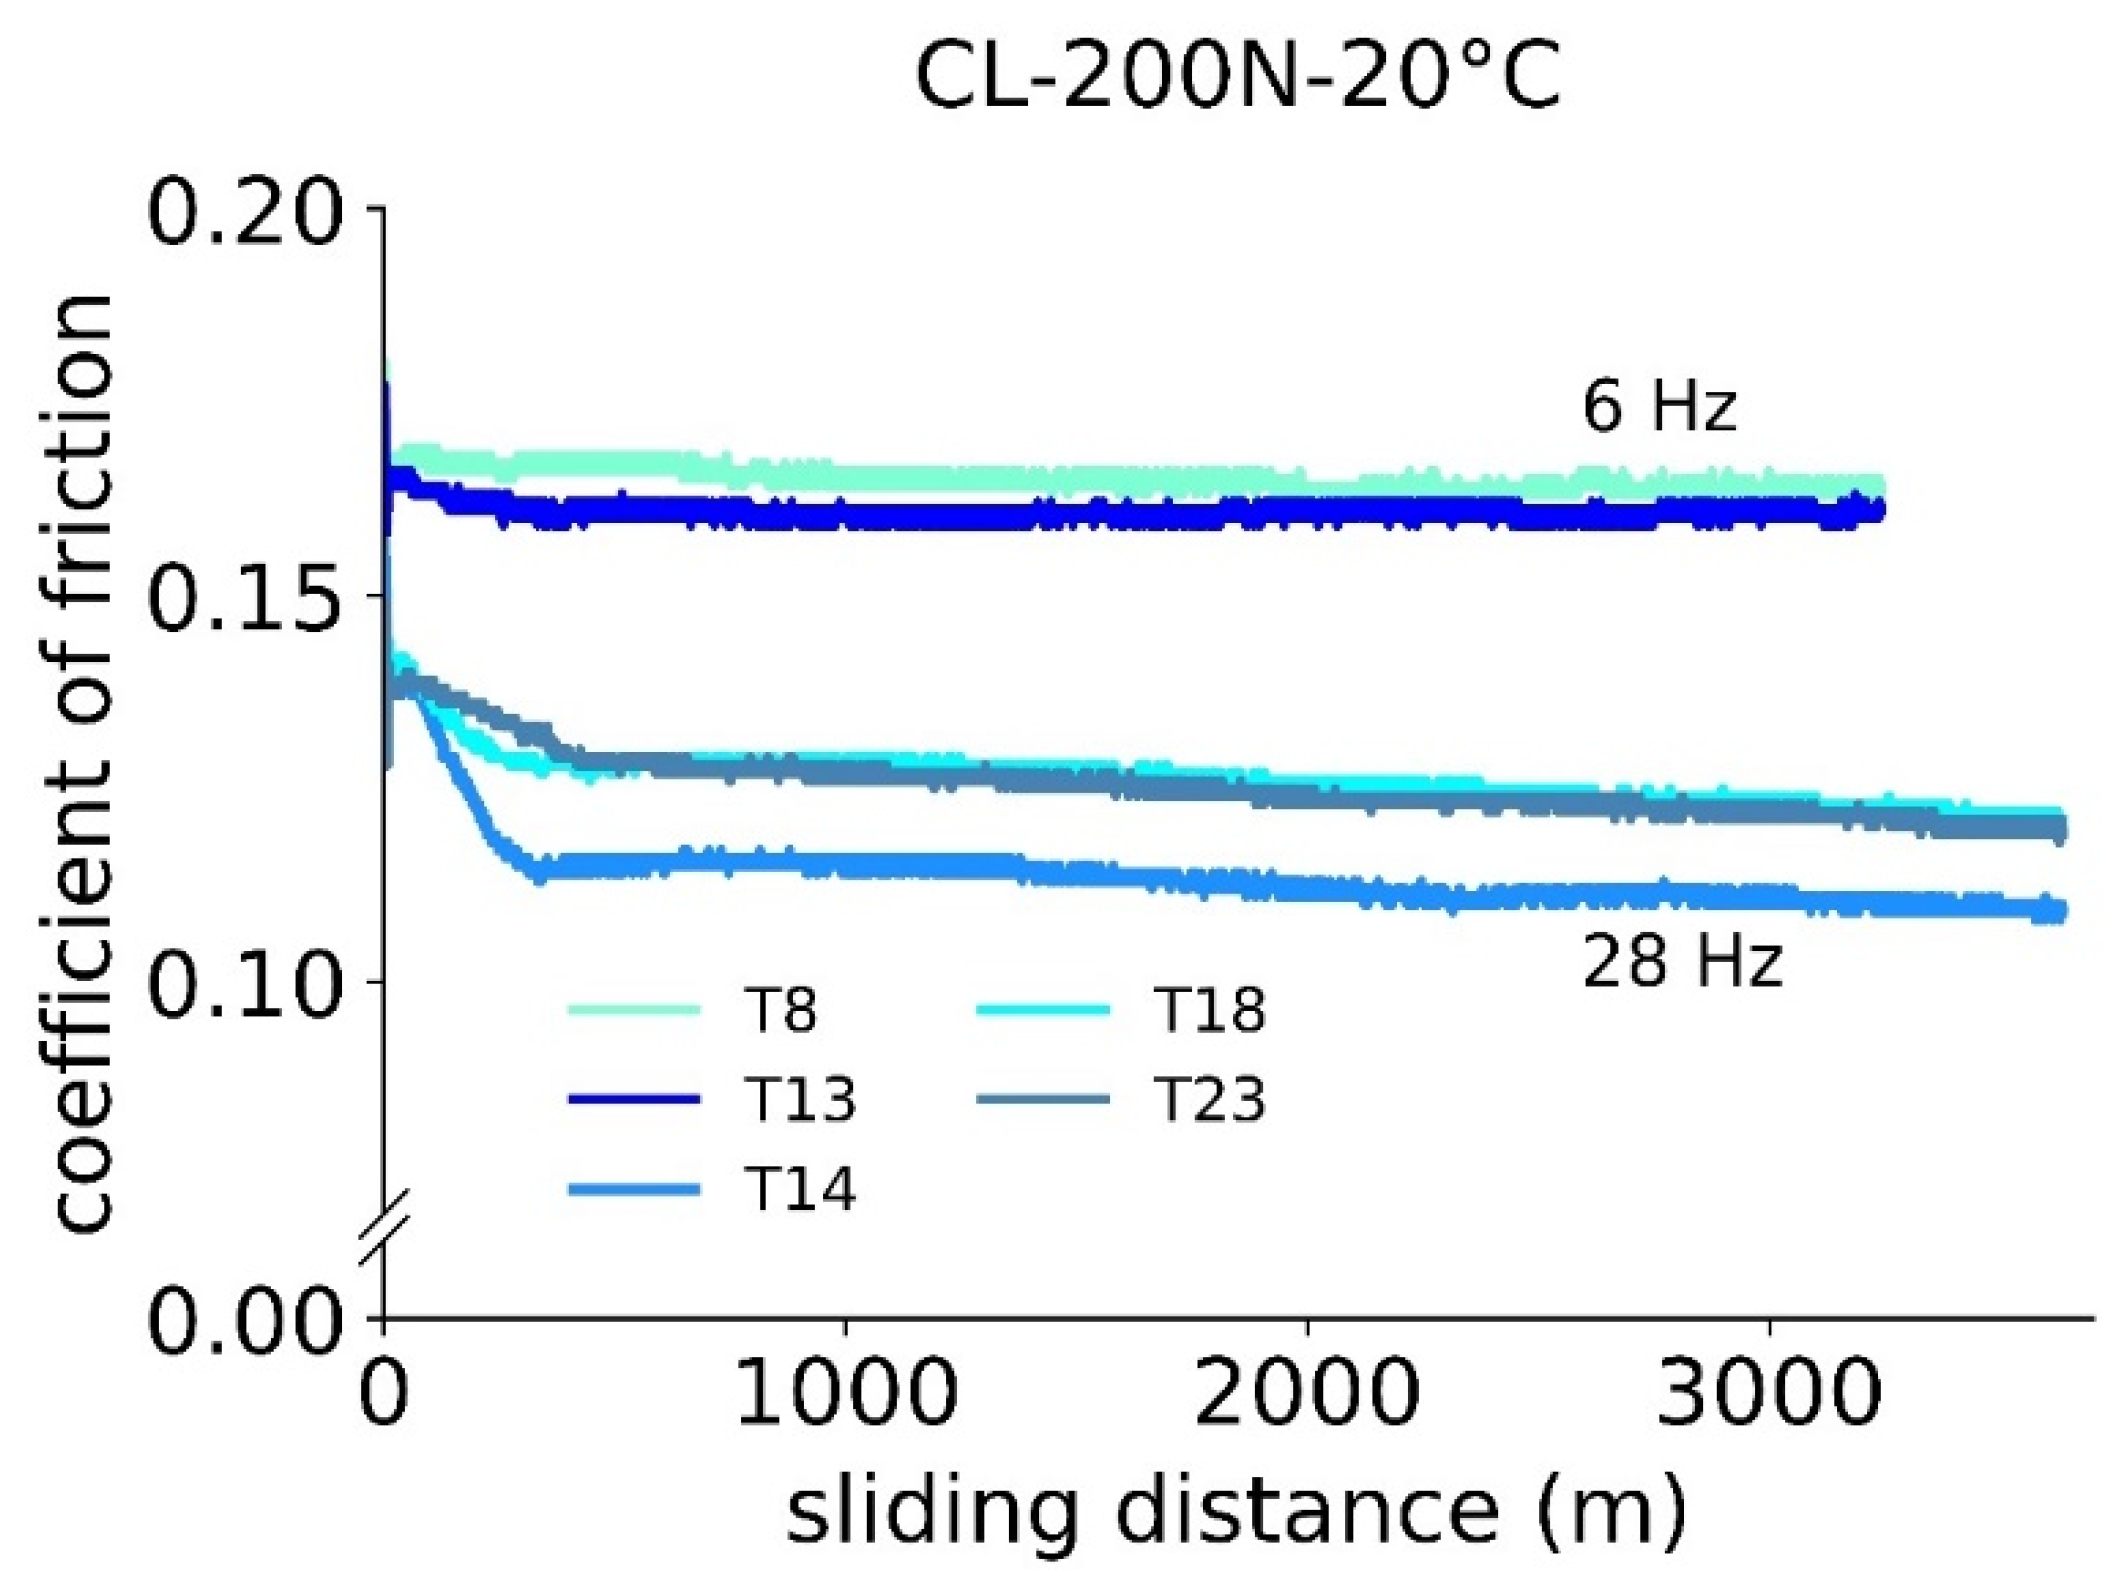
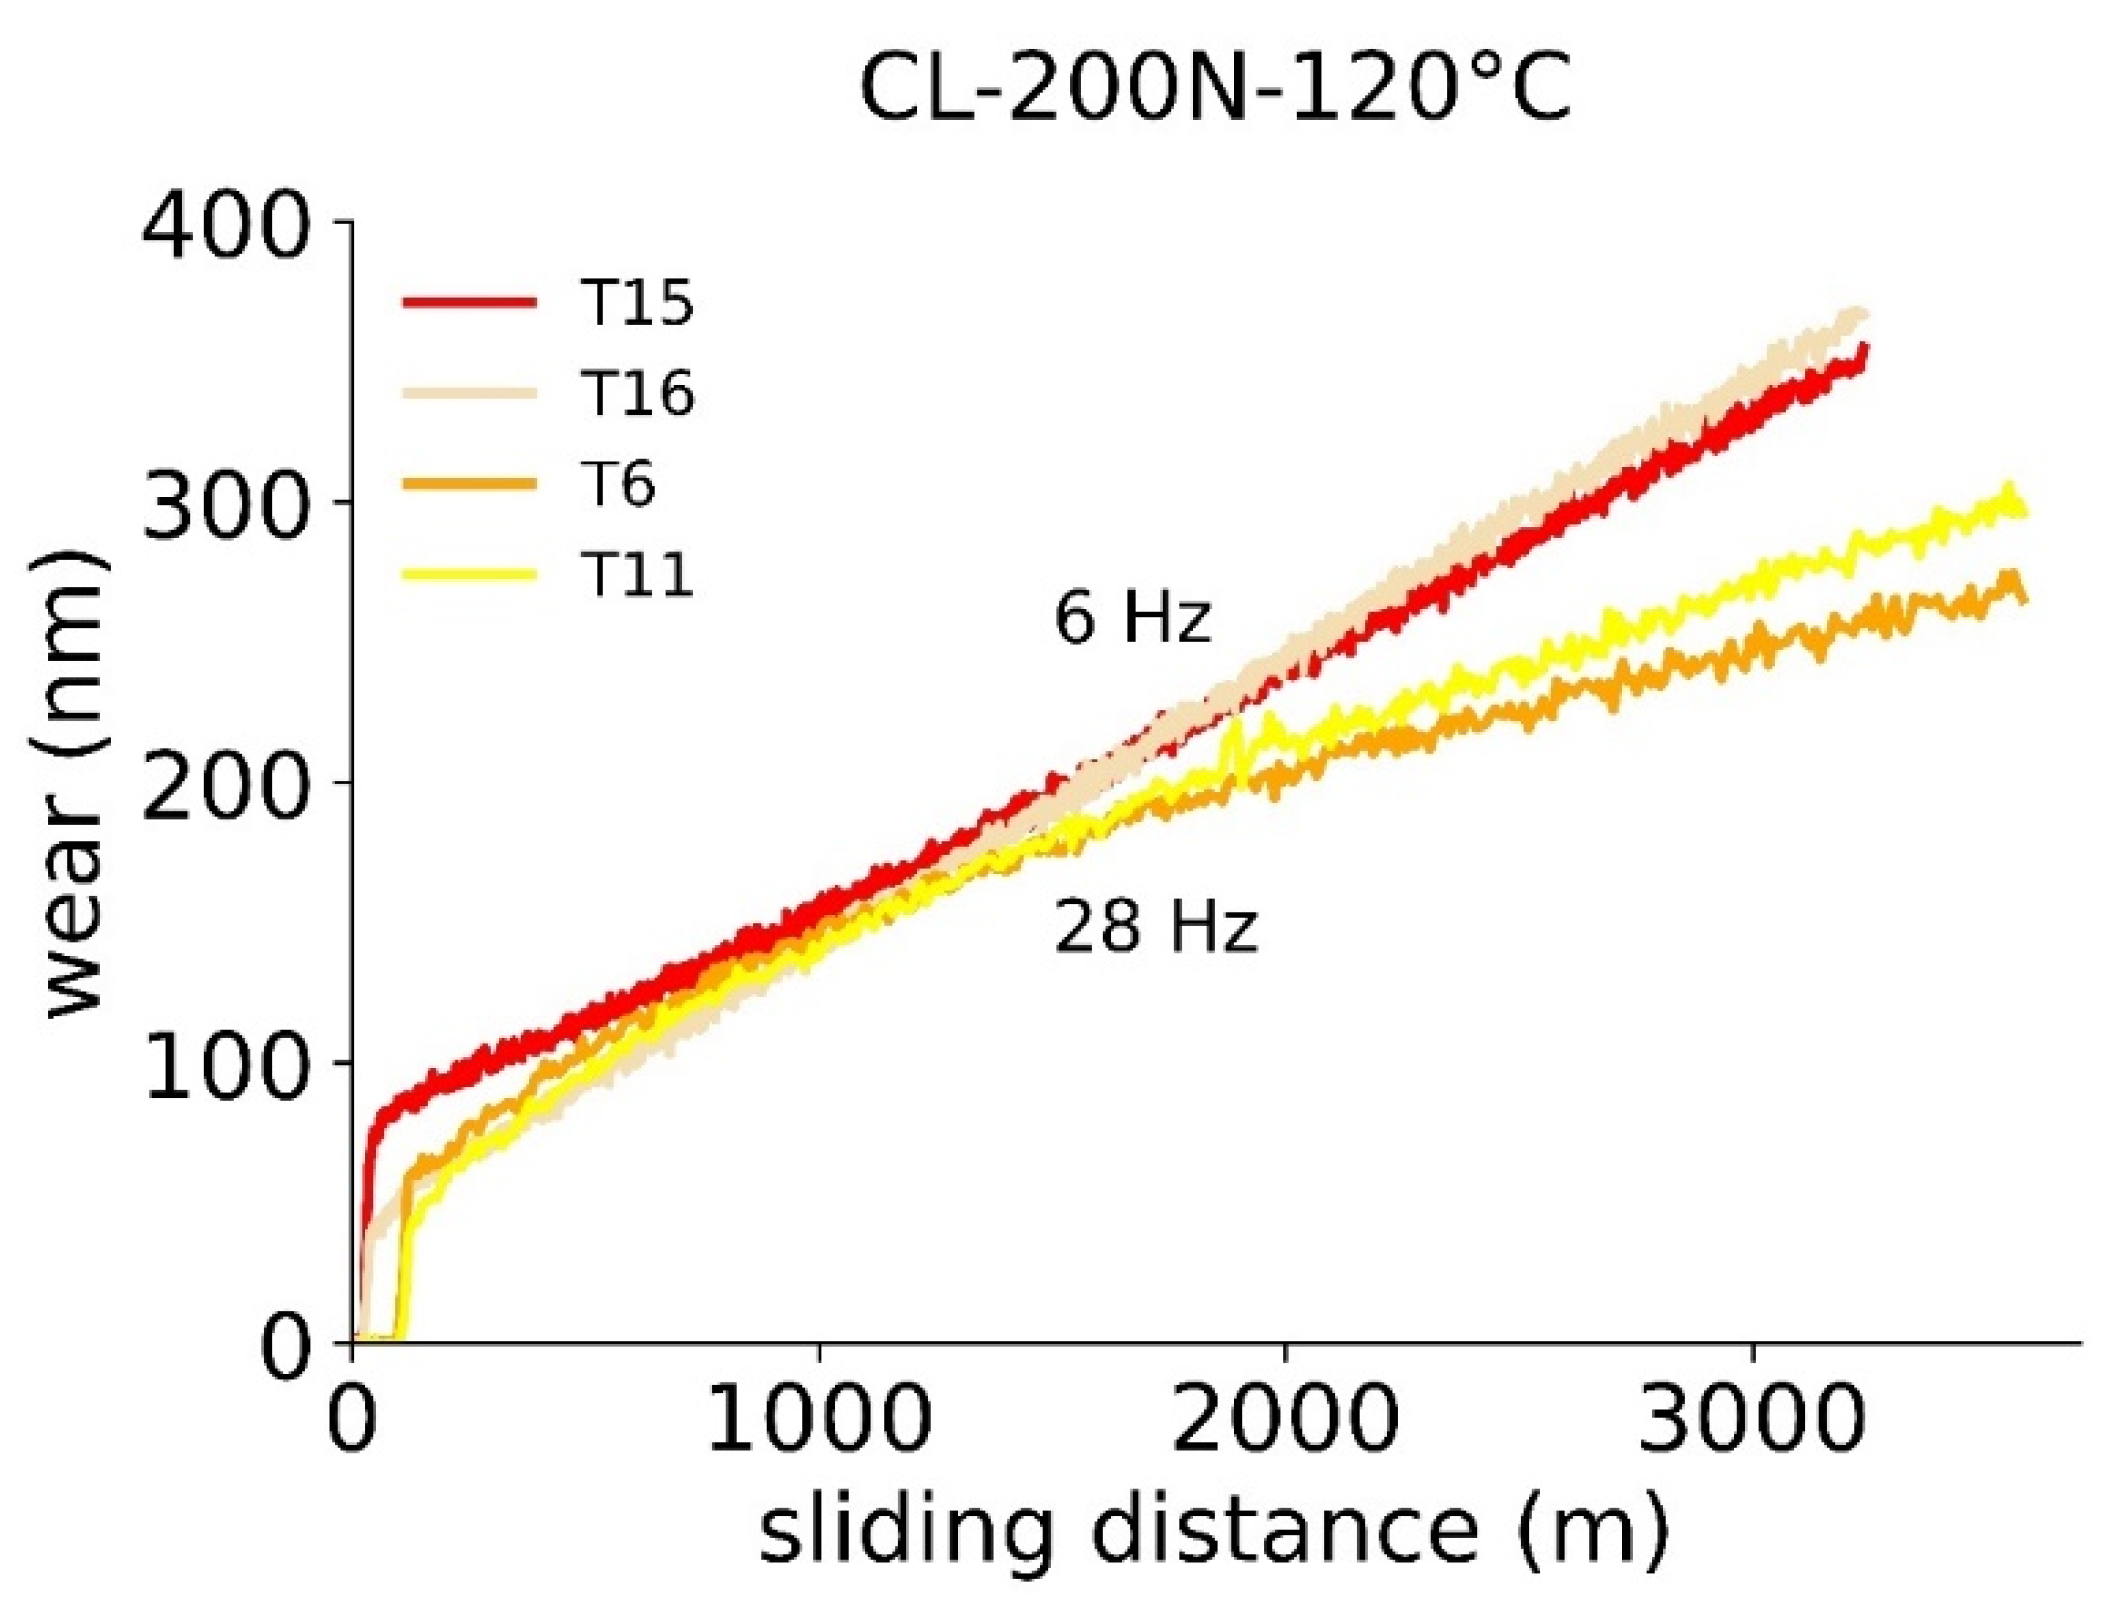
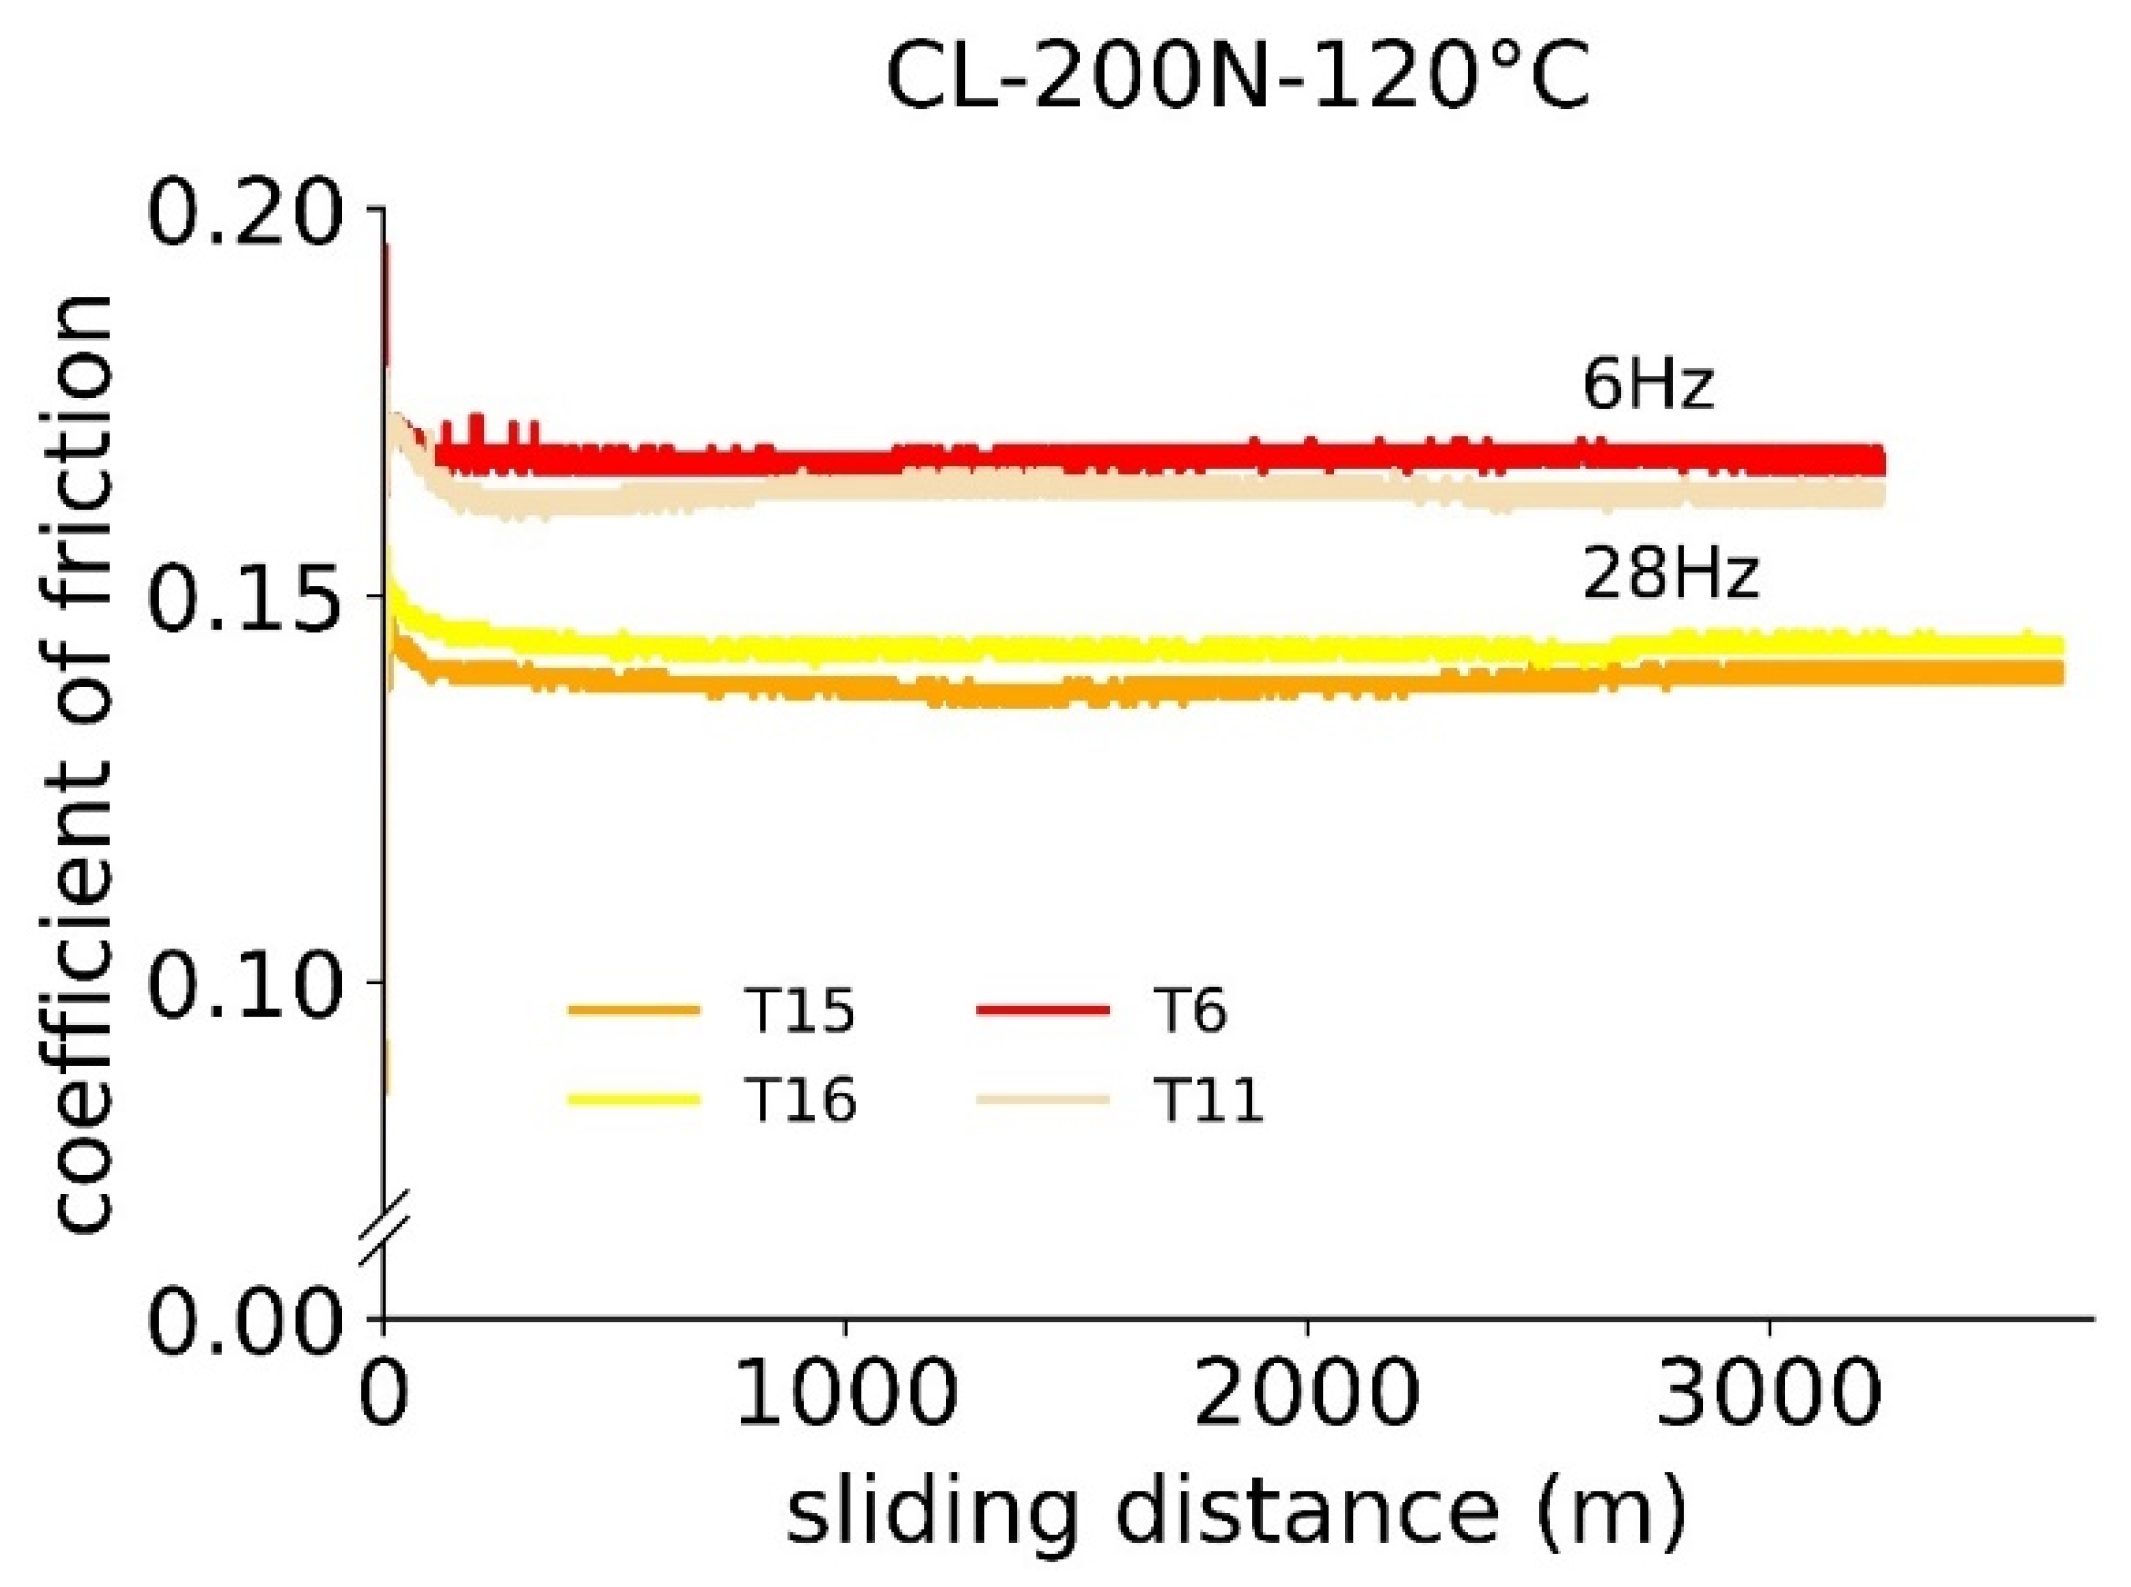
3.1.2. Frequency
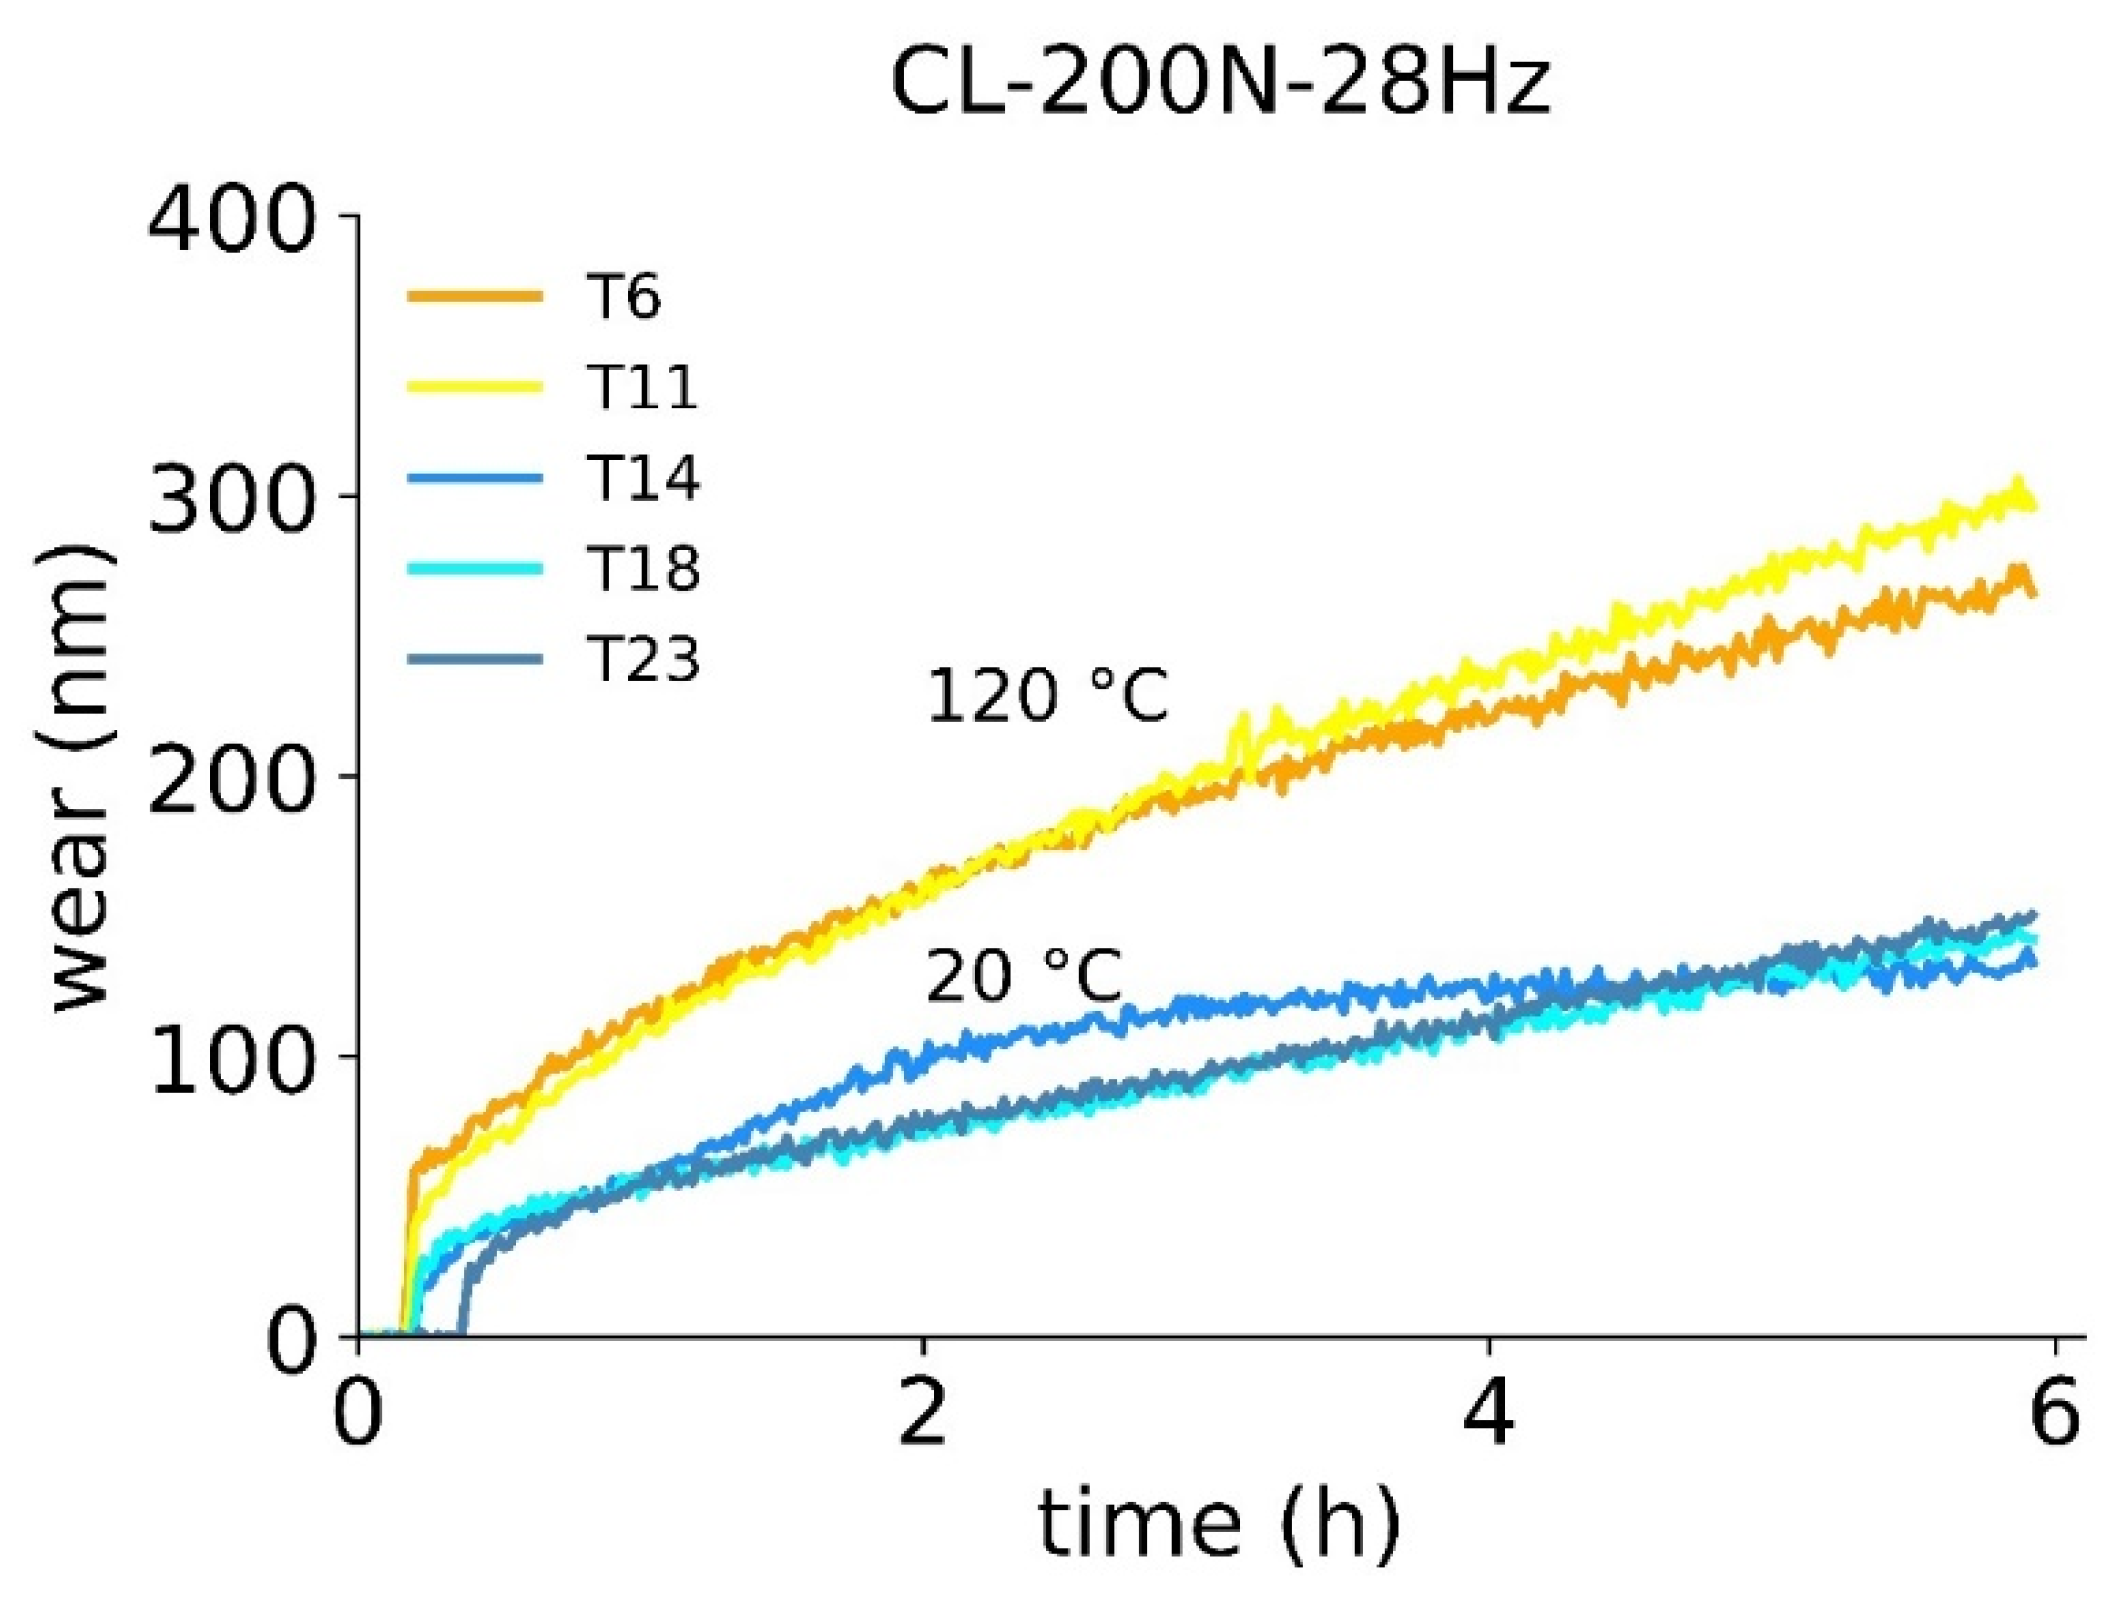
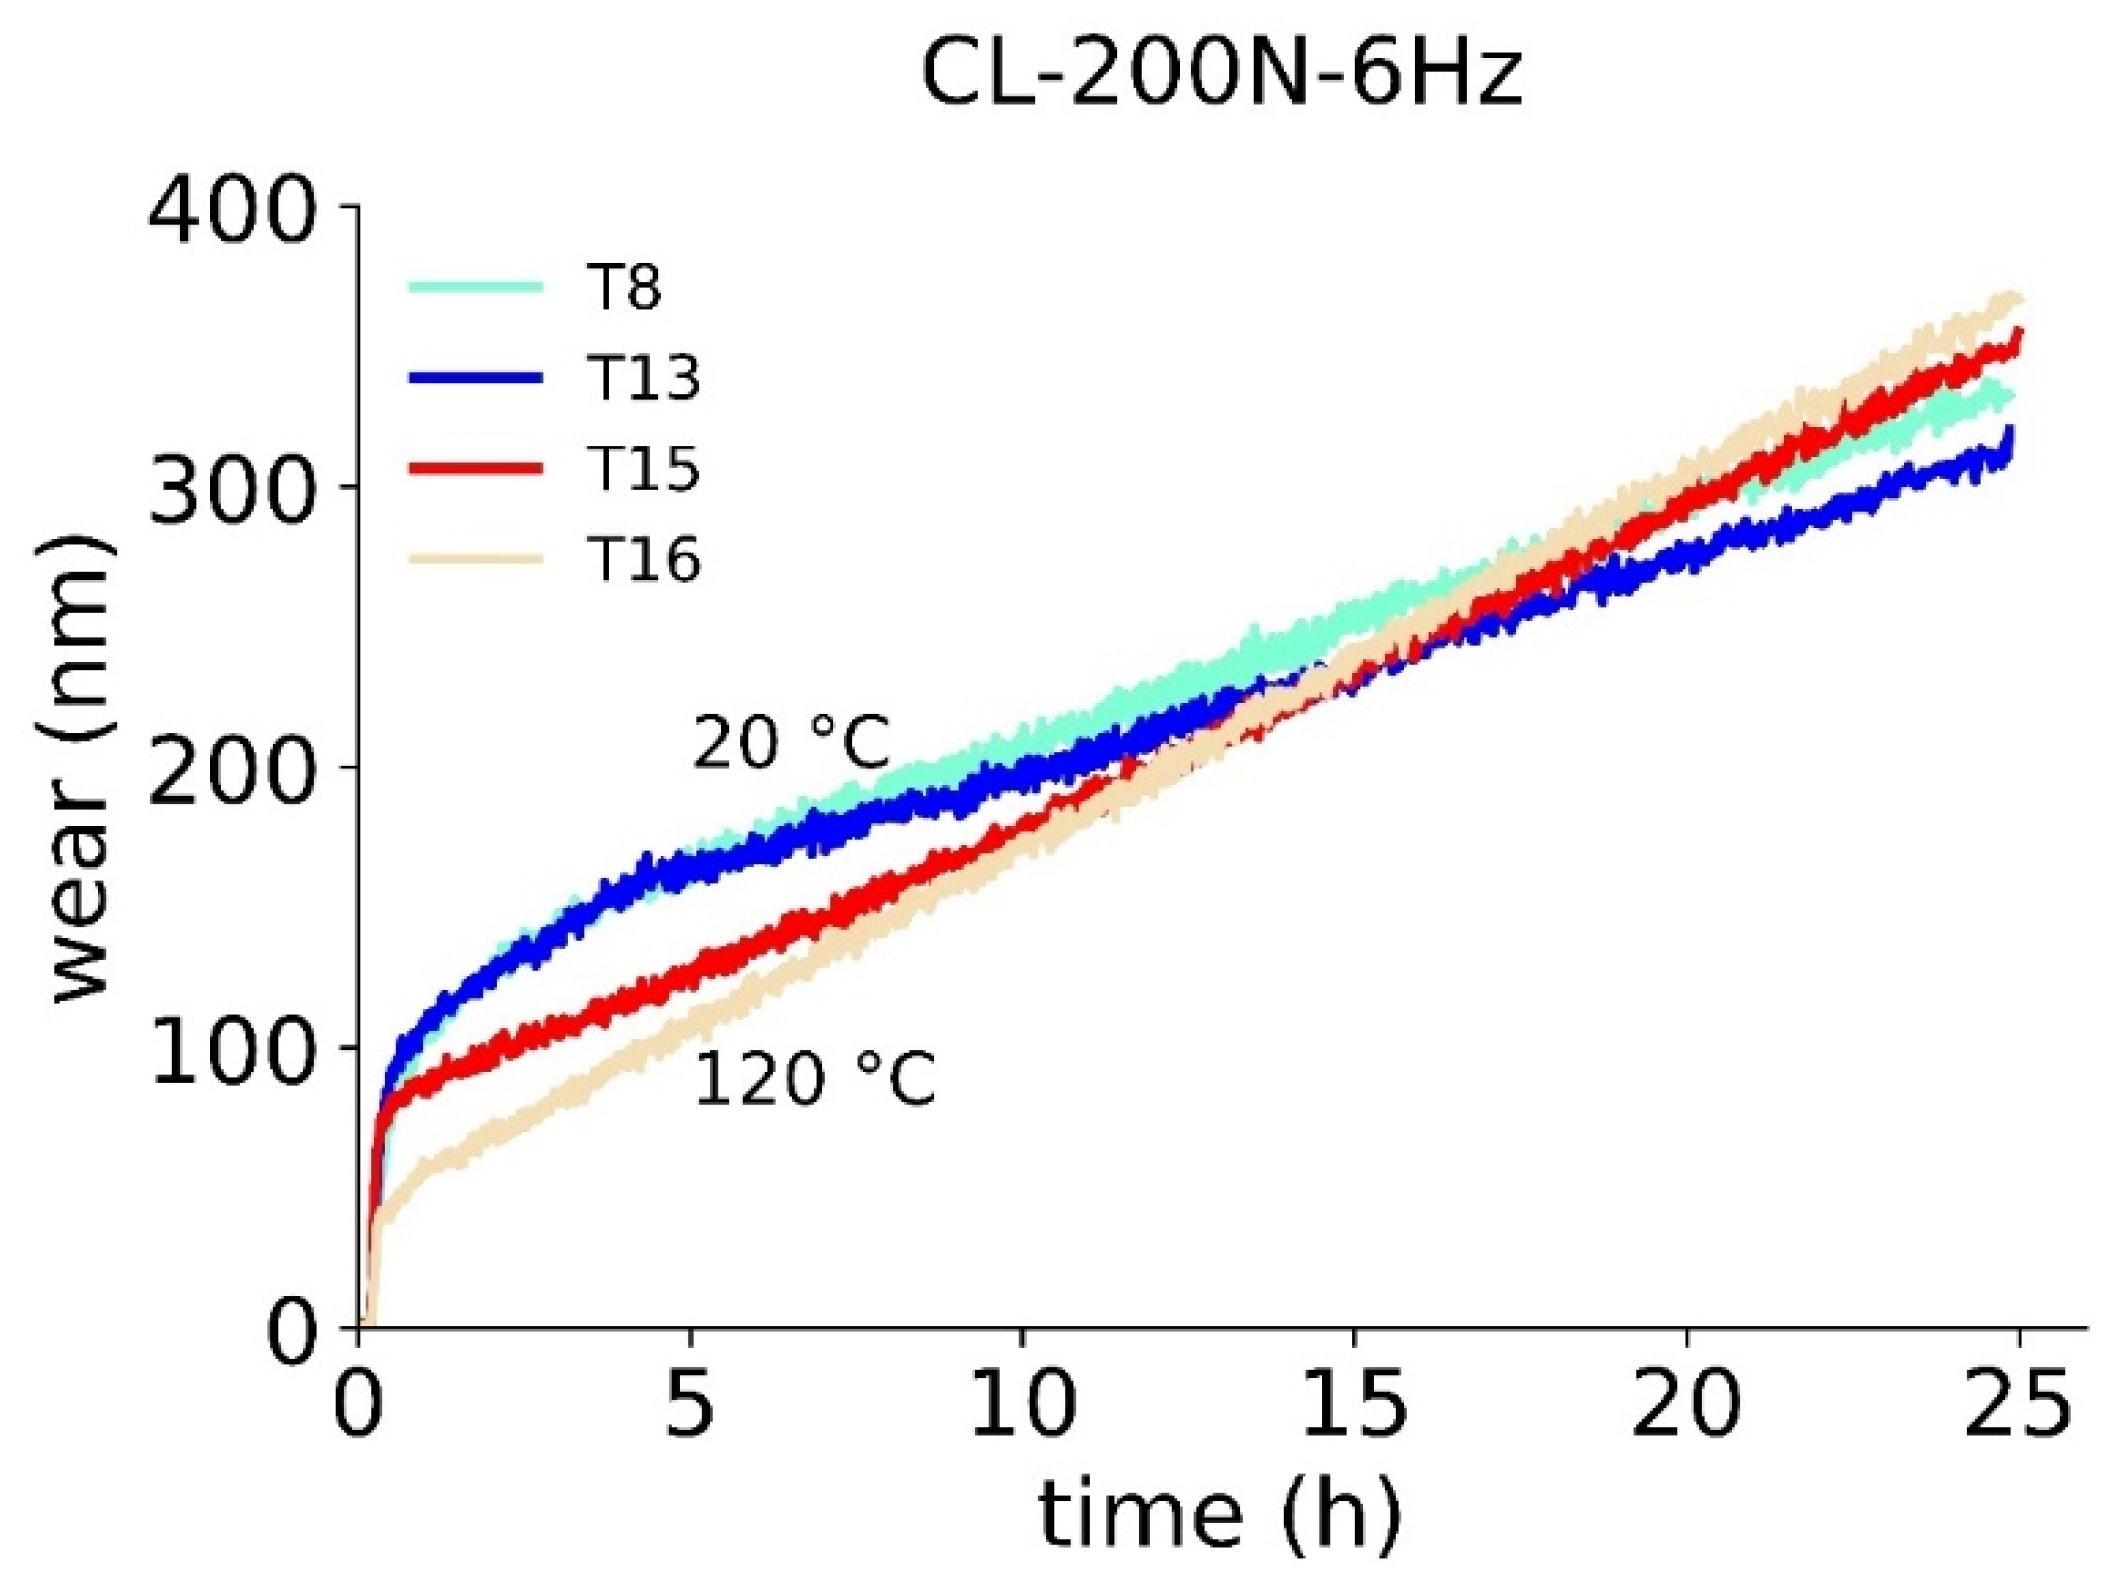
3.1.3. Temperature
3.2. Surface Analysis Performed on Cylinder Liners and Piston Ring Samples
3.2.1. Analysis of the Surfaces by SEM
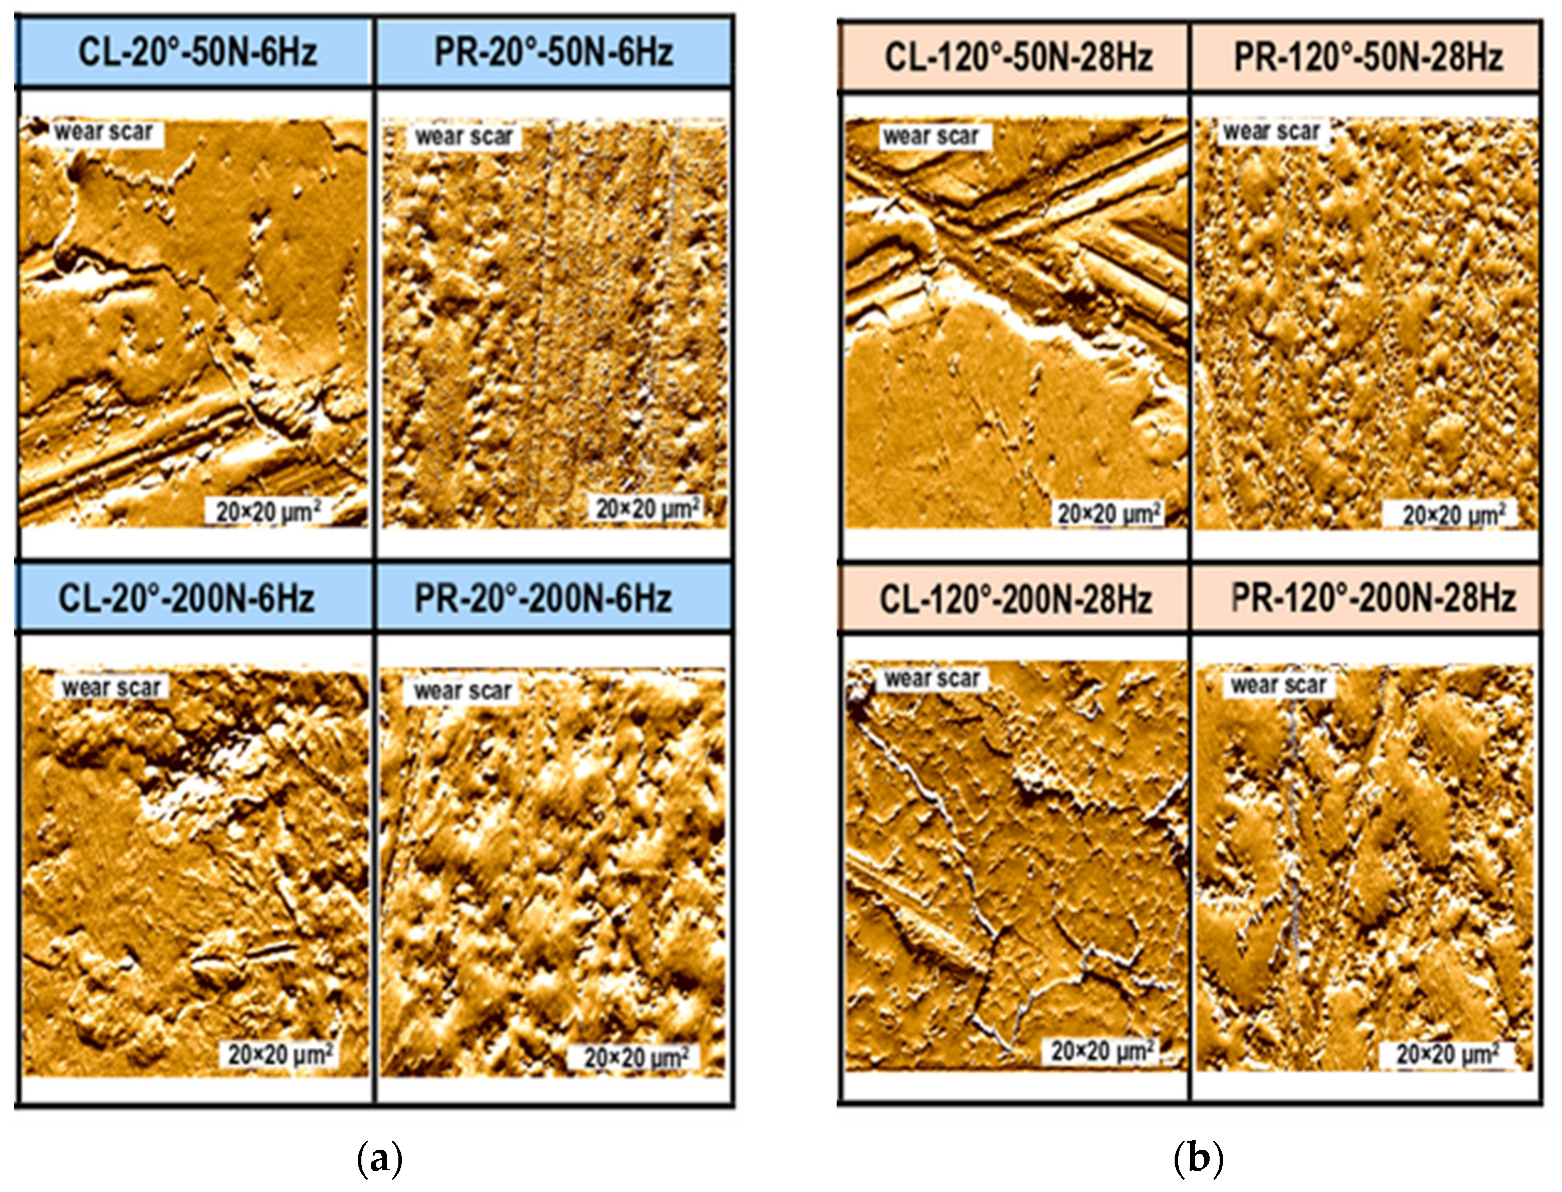
3.2.2. Surface Topography of the Samples by AFM
3.2.3. Comparison of Tribofilm Structure Obtained with AFM and SEM
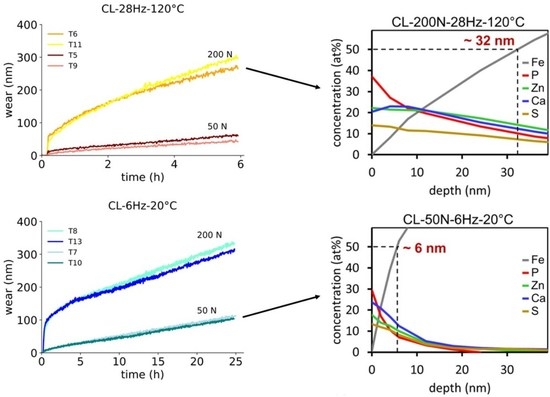
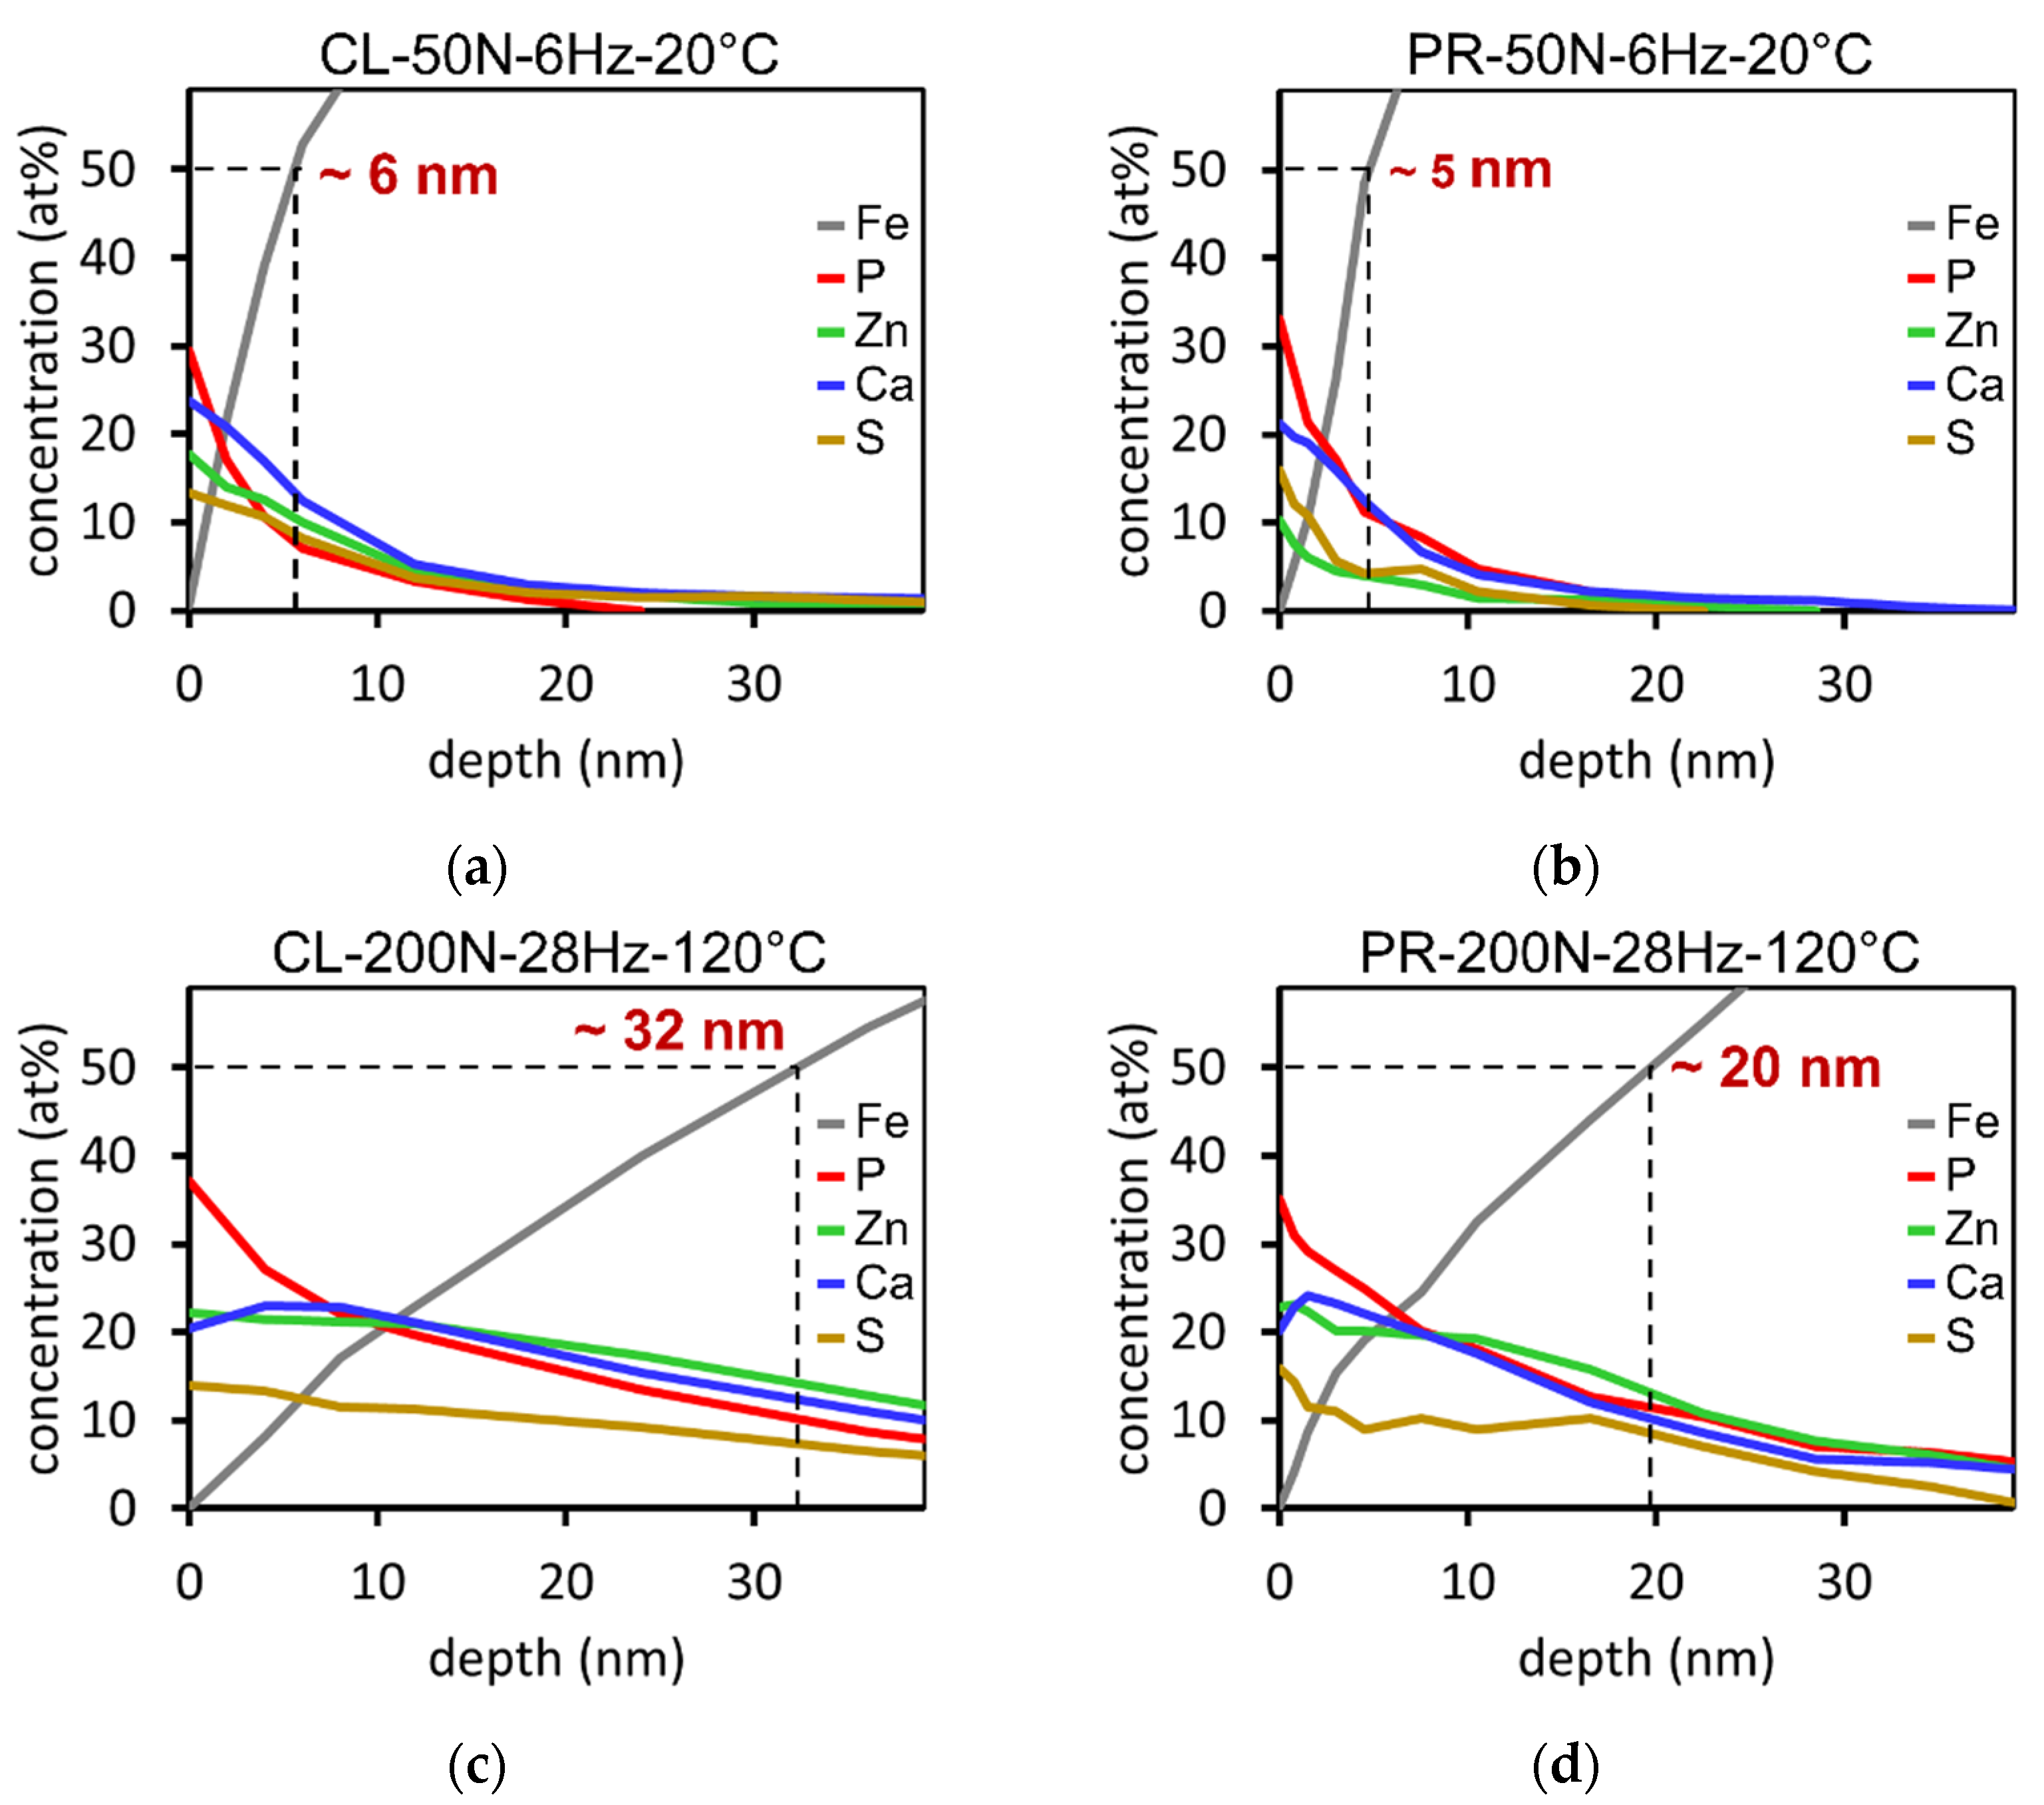
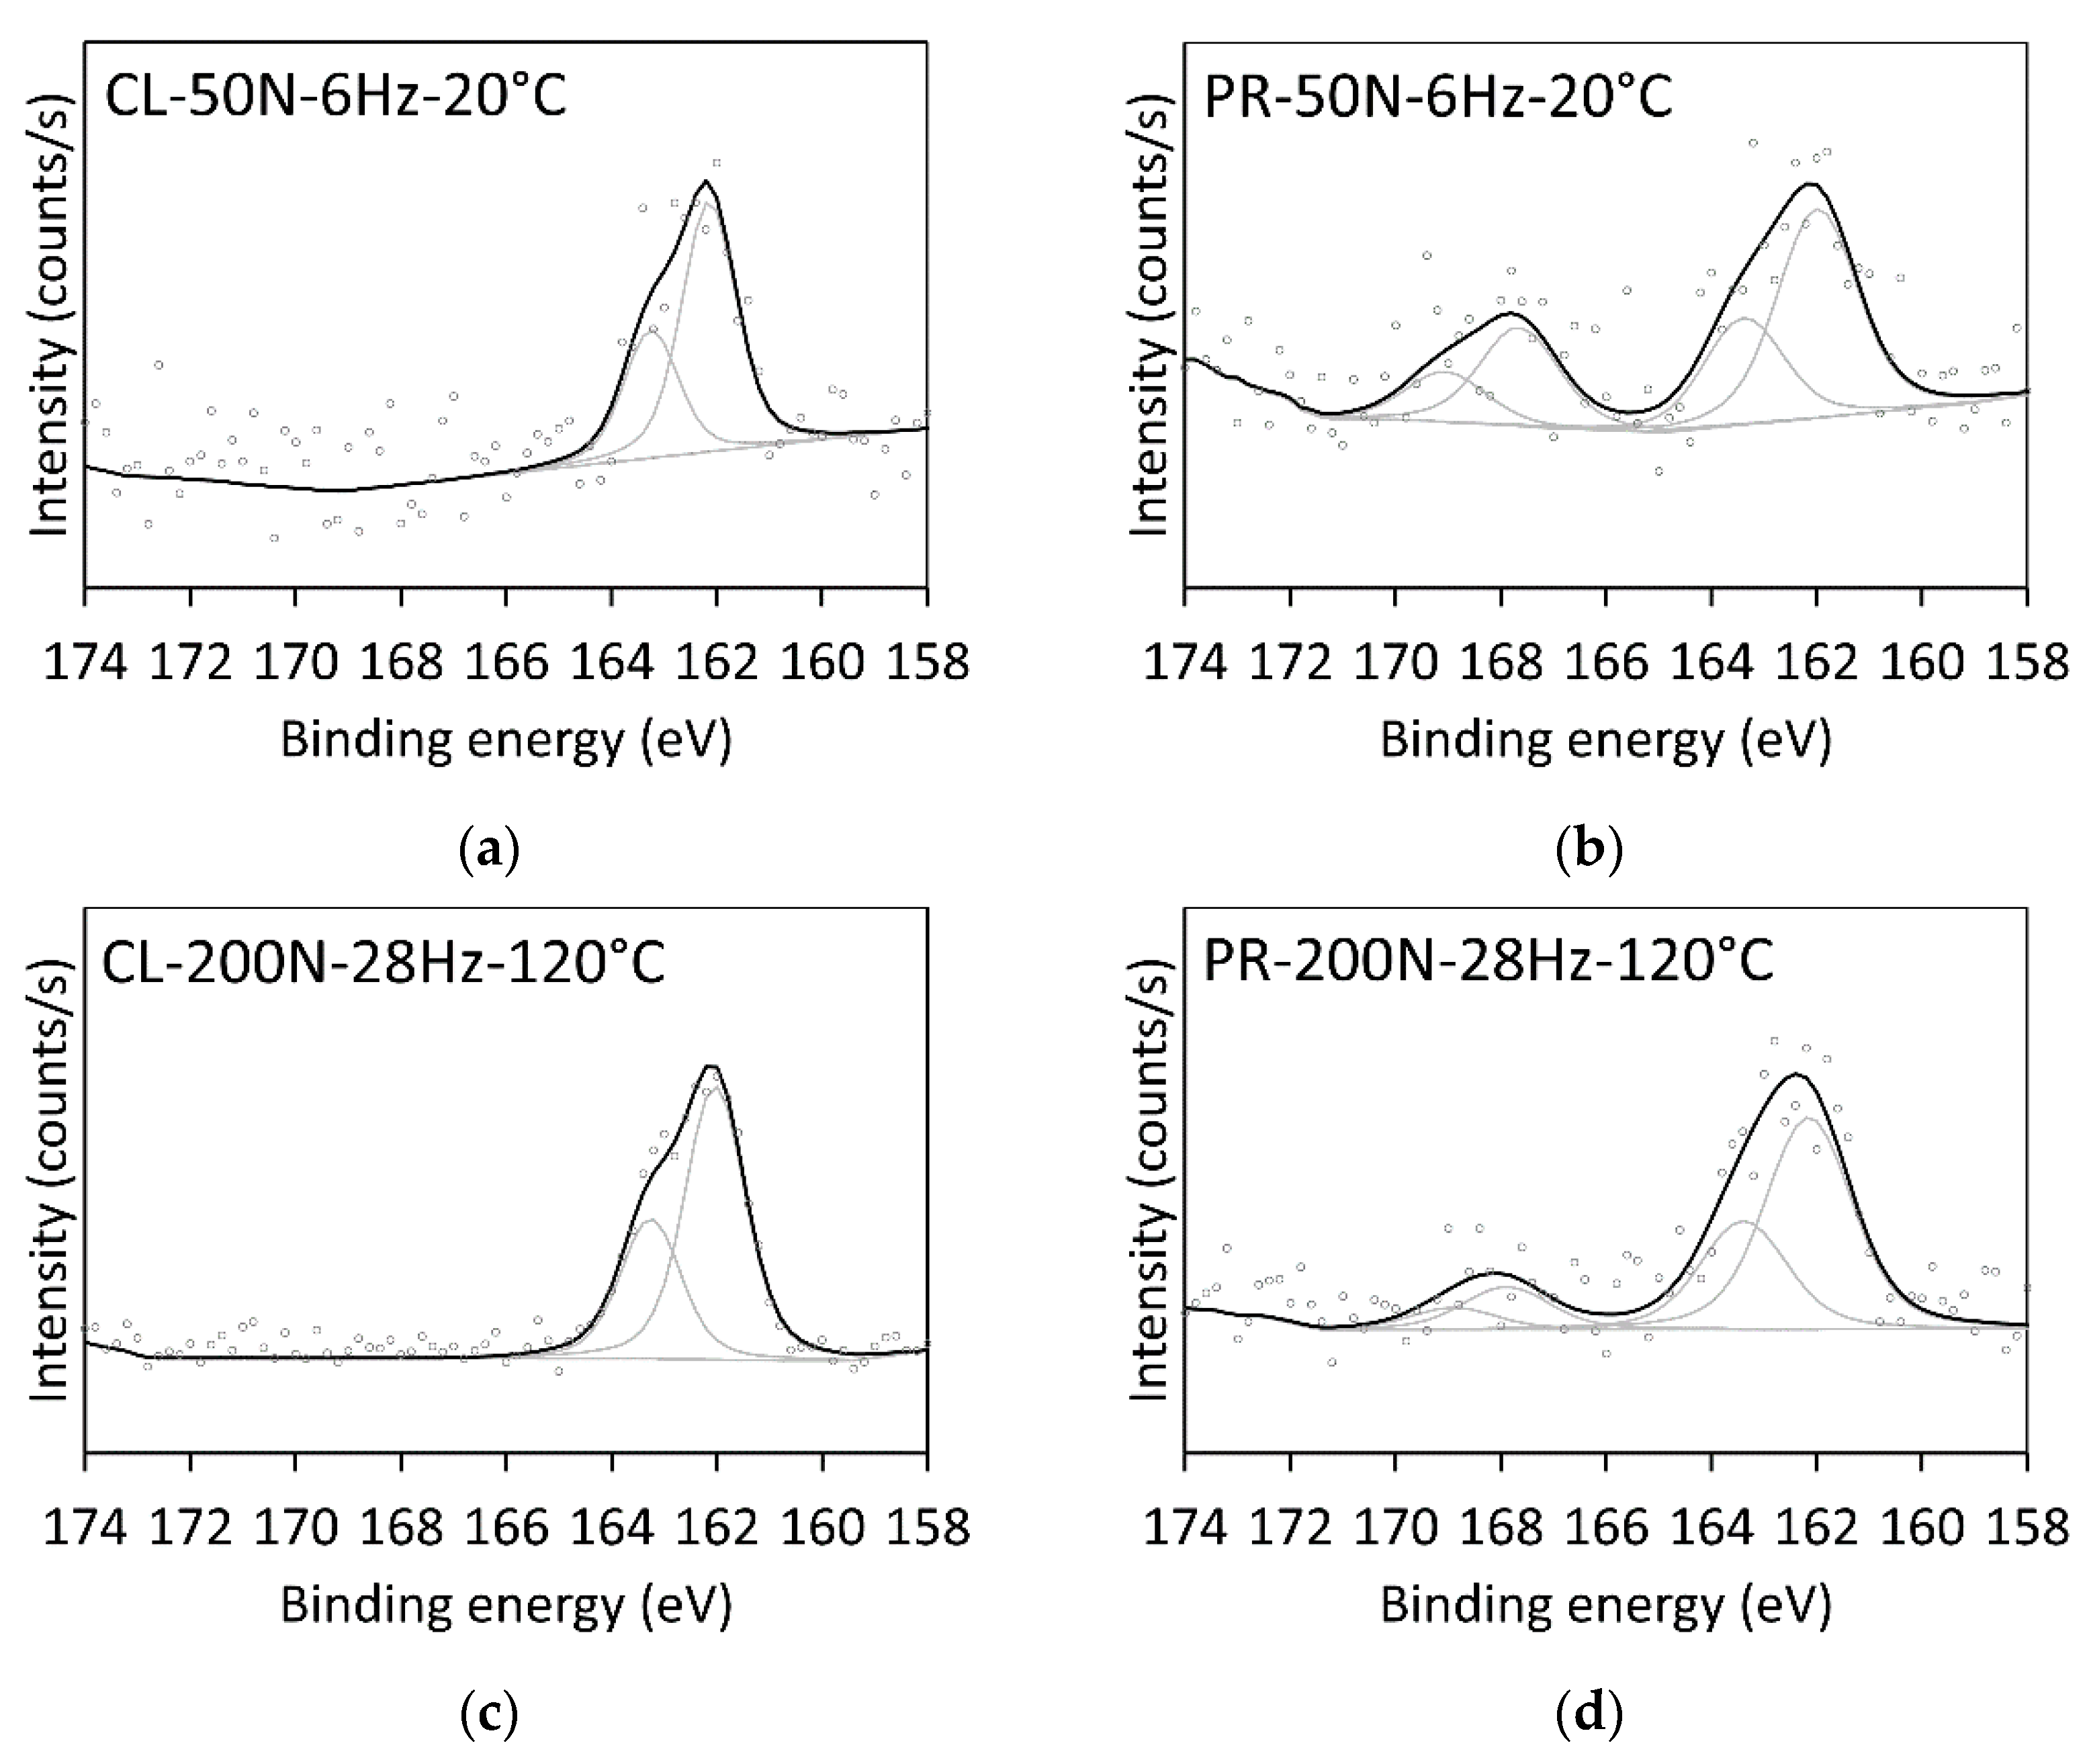
3.2.4. Tribofilm Analysis by XPS Depth Profiling
4. Discussion
4.1. Friction
4.2. Wear
4.3. Tribofilm
4.4. Tribofilm and Wear
- The initial surface is not completely covered by the tribofilm and exposed to direct contacts with the counter-acting body. This is in accordance with the topographic images obtained with AFM and SEM (see Table 4). All the images show features and even blank areas of the initial surface besides the patch-like tribofilm.
- The tribofilm is too thin or not strong enough to prevent asperities of the counteracting body to plough through it and scratch the initial surface.
- The initial surface chemically reacts with the tribofilm. Rubbing off the tribofilm consequently leads to an increase of worn material of the initial surface in the lubricant, which is subsequently measured via the RIC method.
5. Conclusions
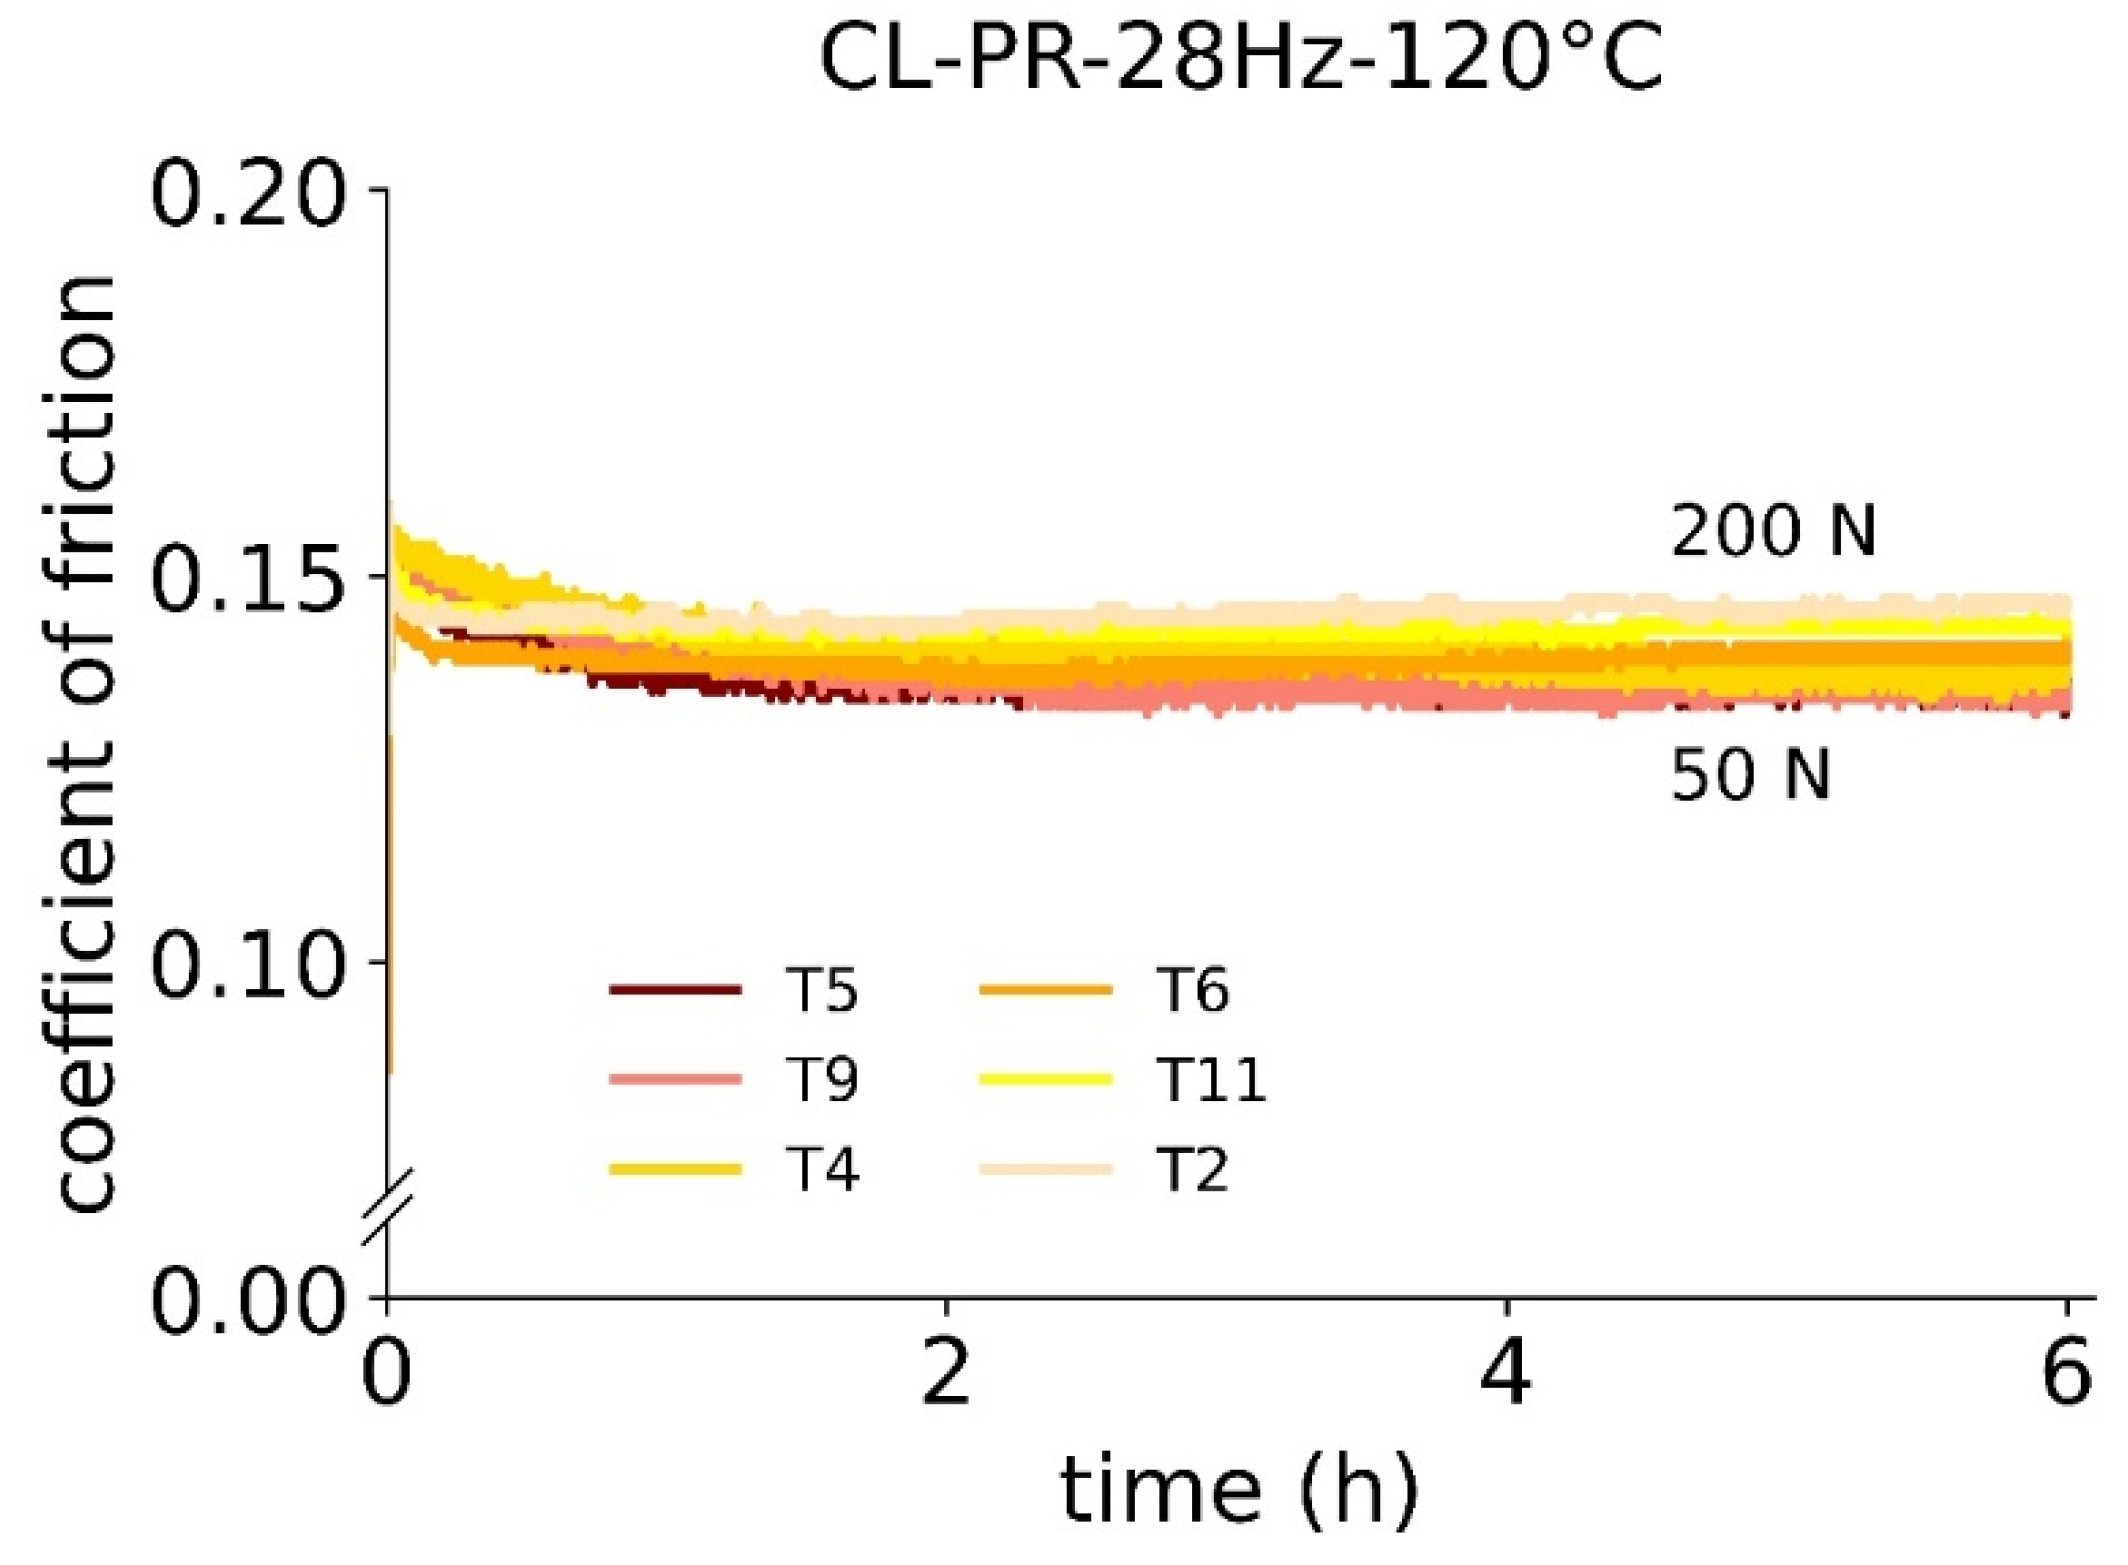
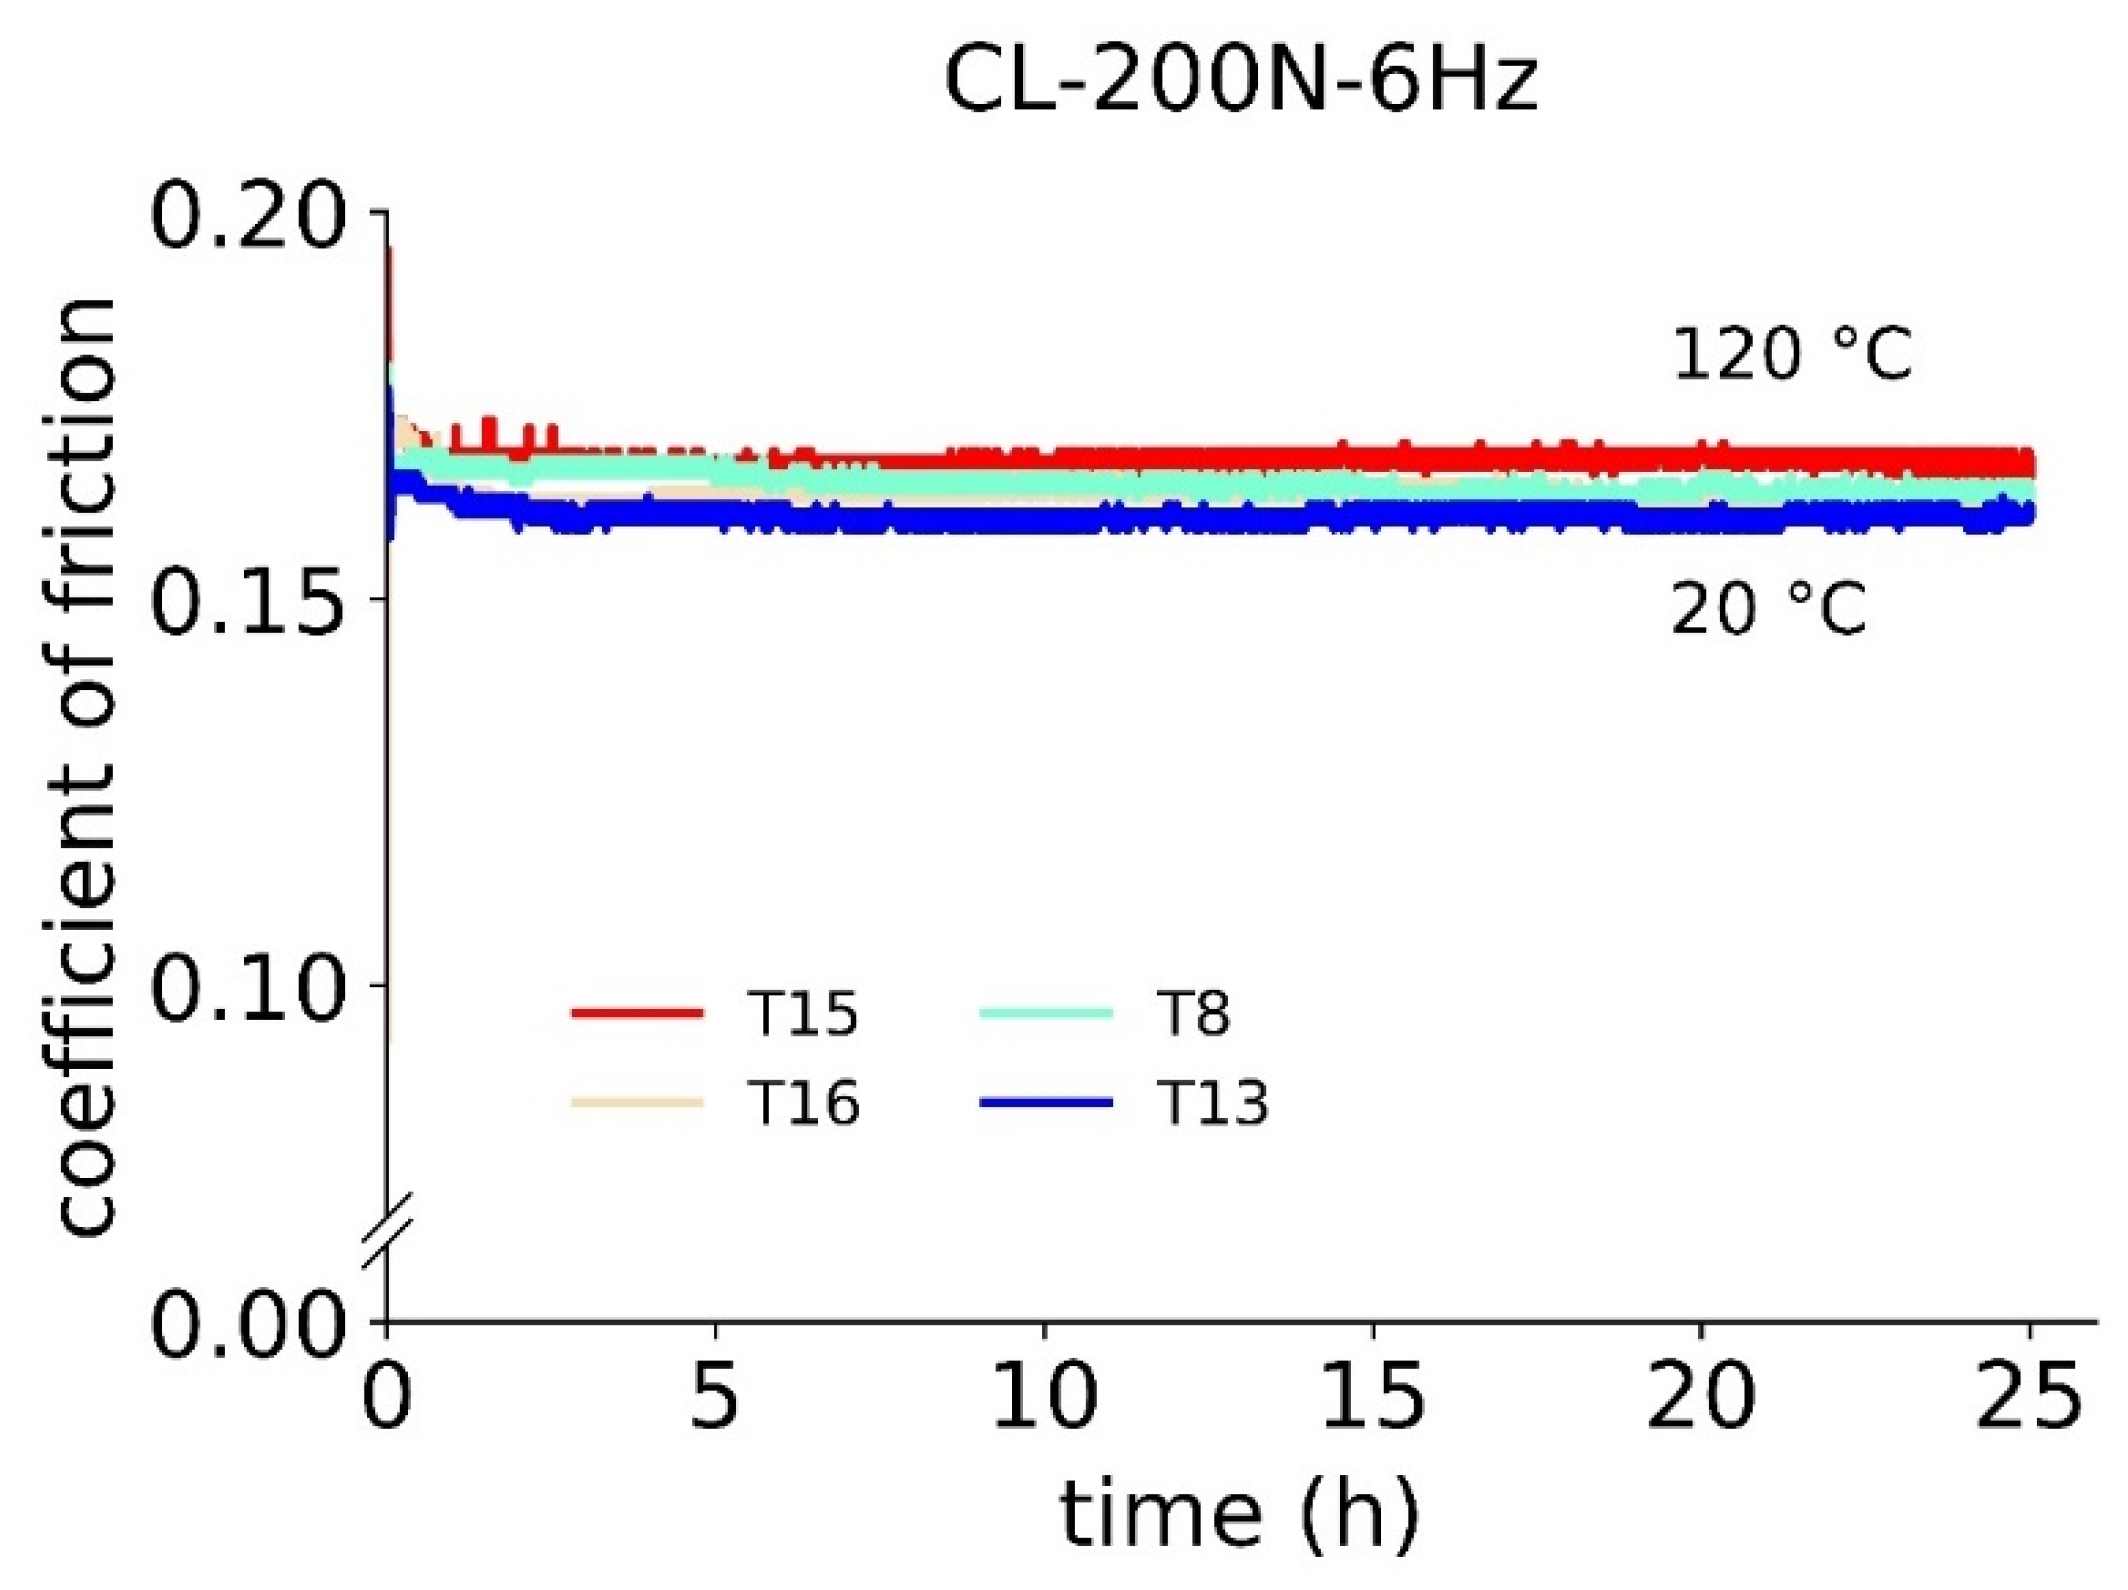
- Coefficient of friction: Higher friction is directly related to higher temperature and lower sliding frequency as expected for the boundary and mixed lubrication regime. The load has no (or hardly any) effect on the friction coefficients measured within this study;
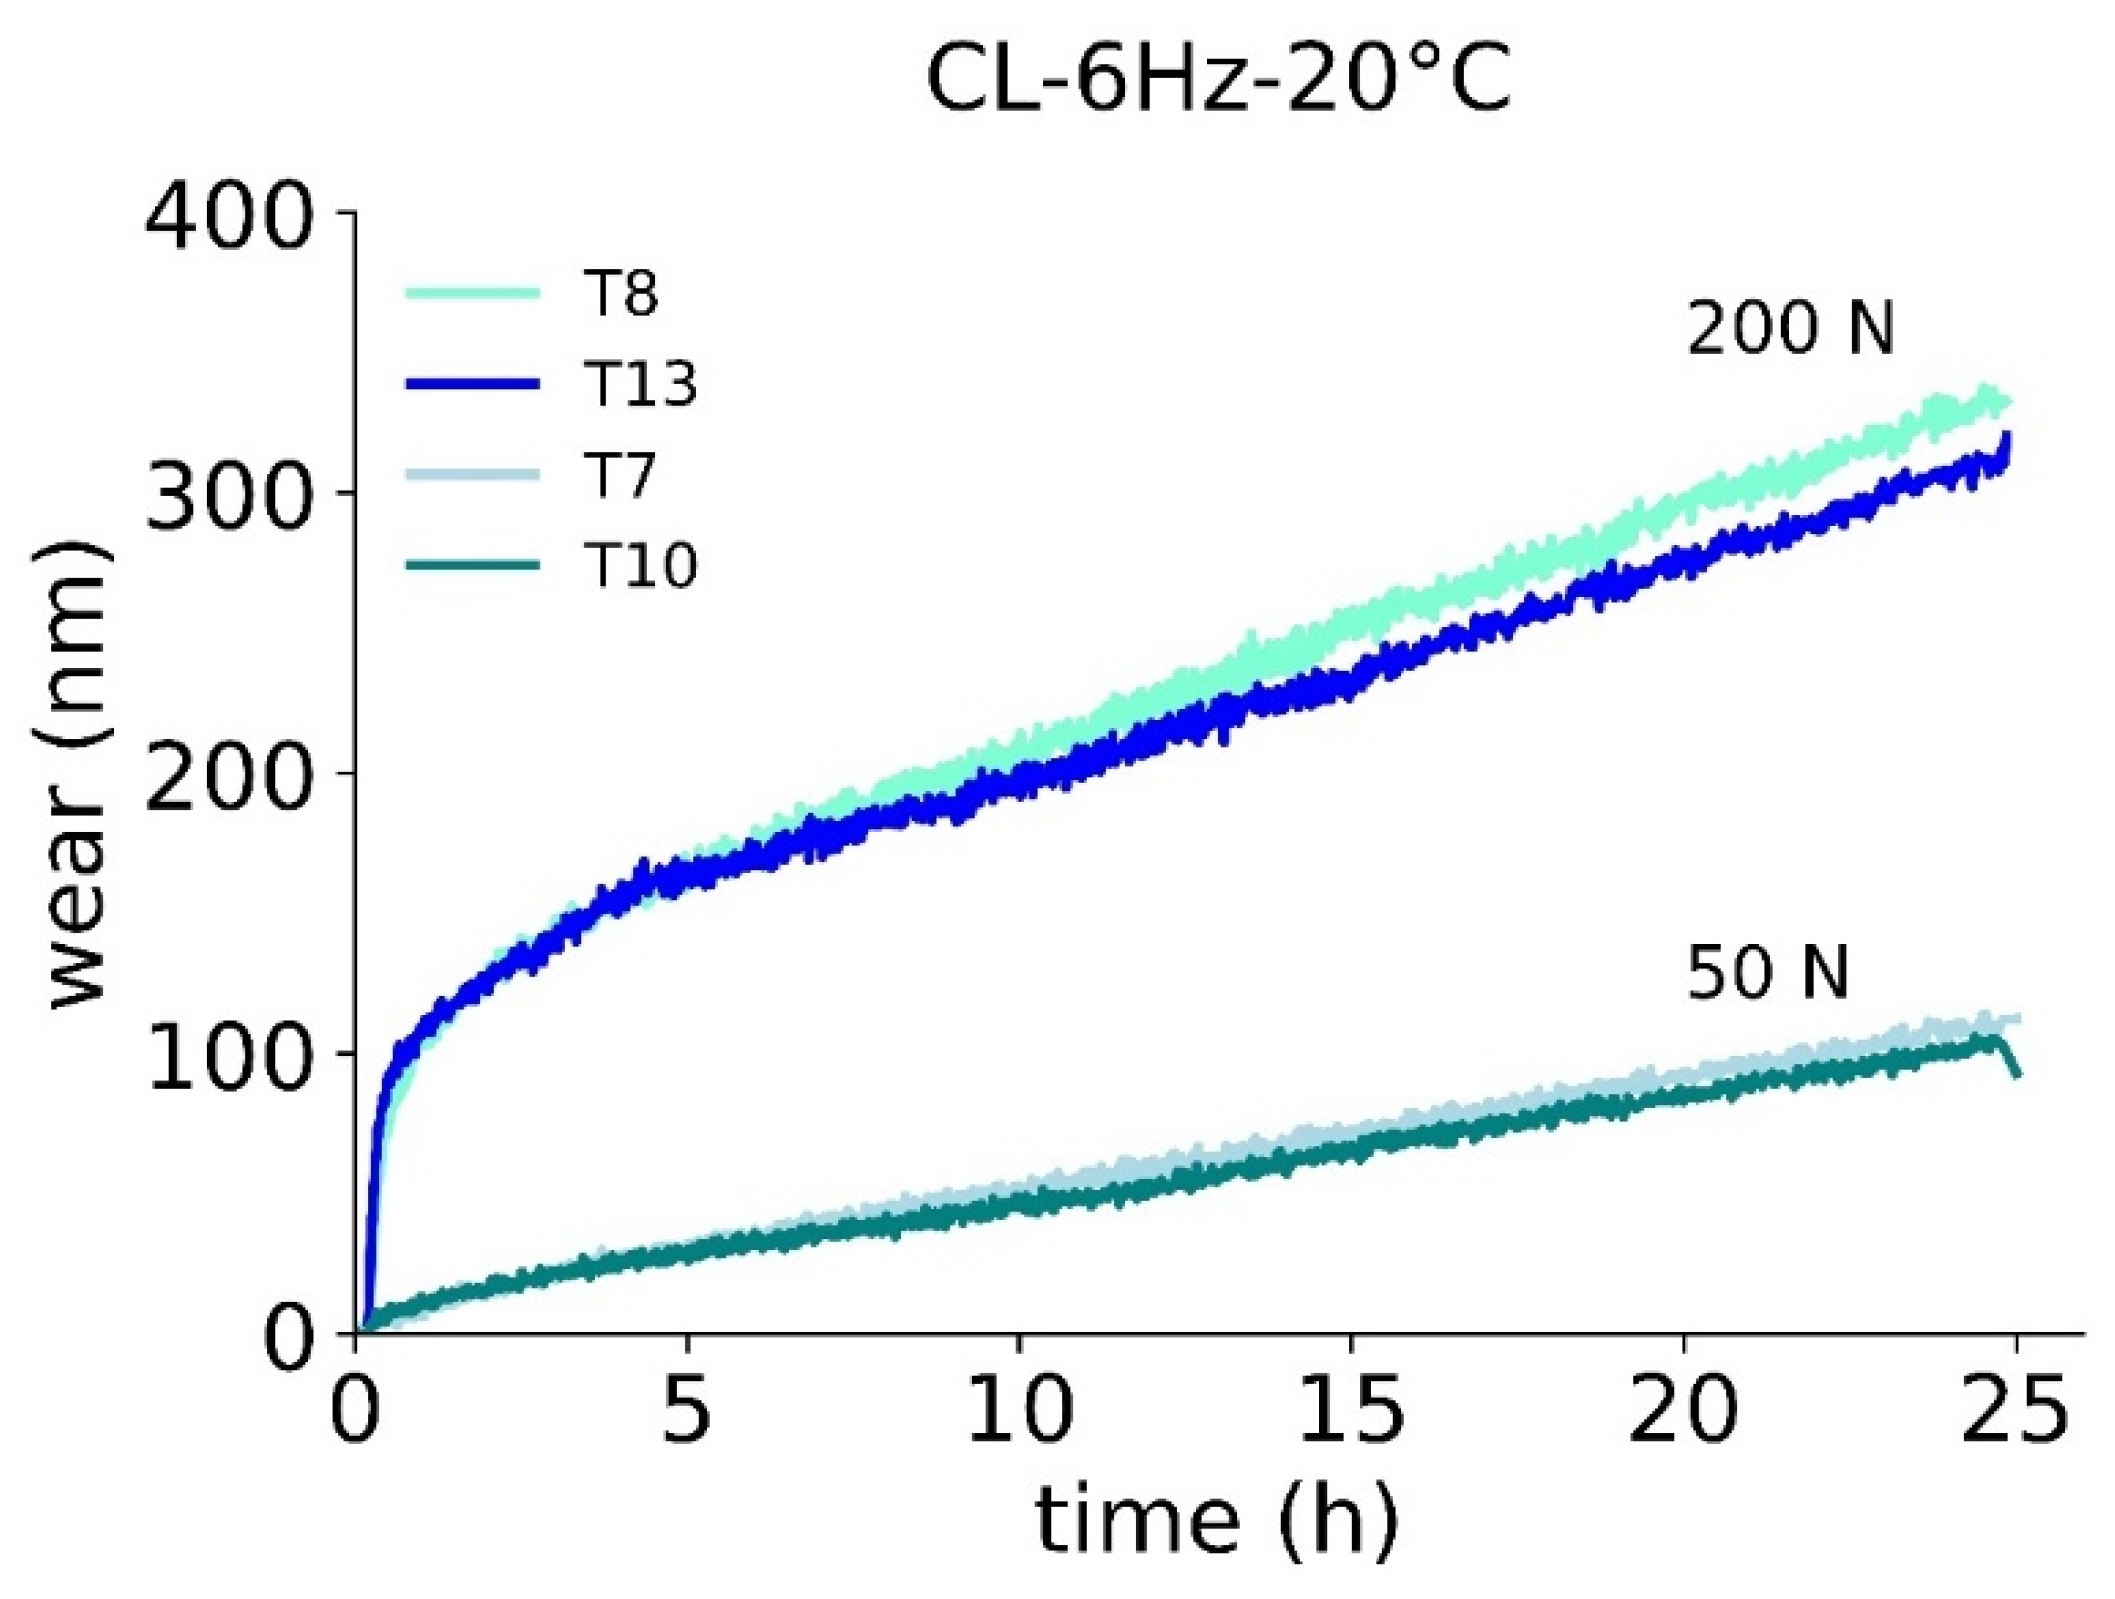
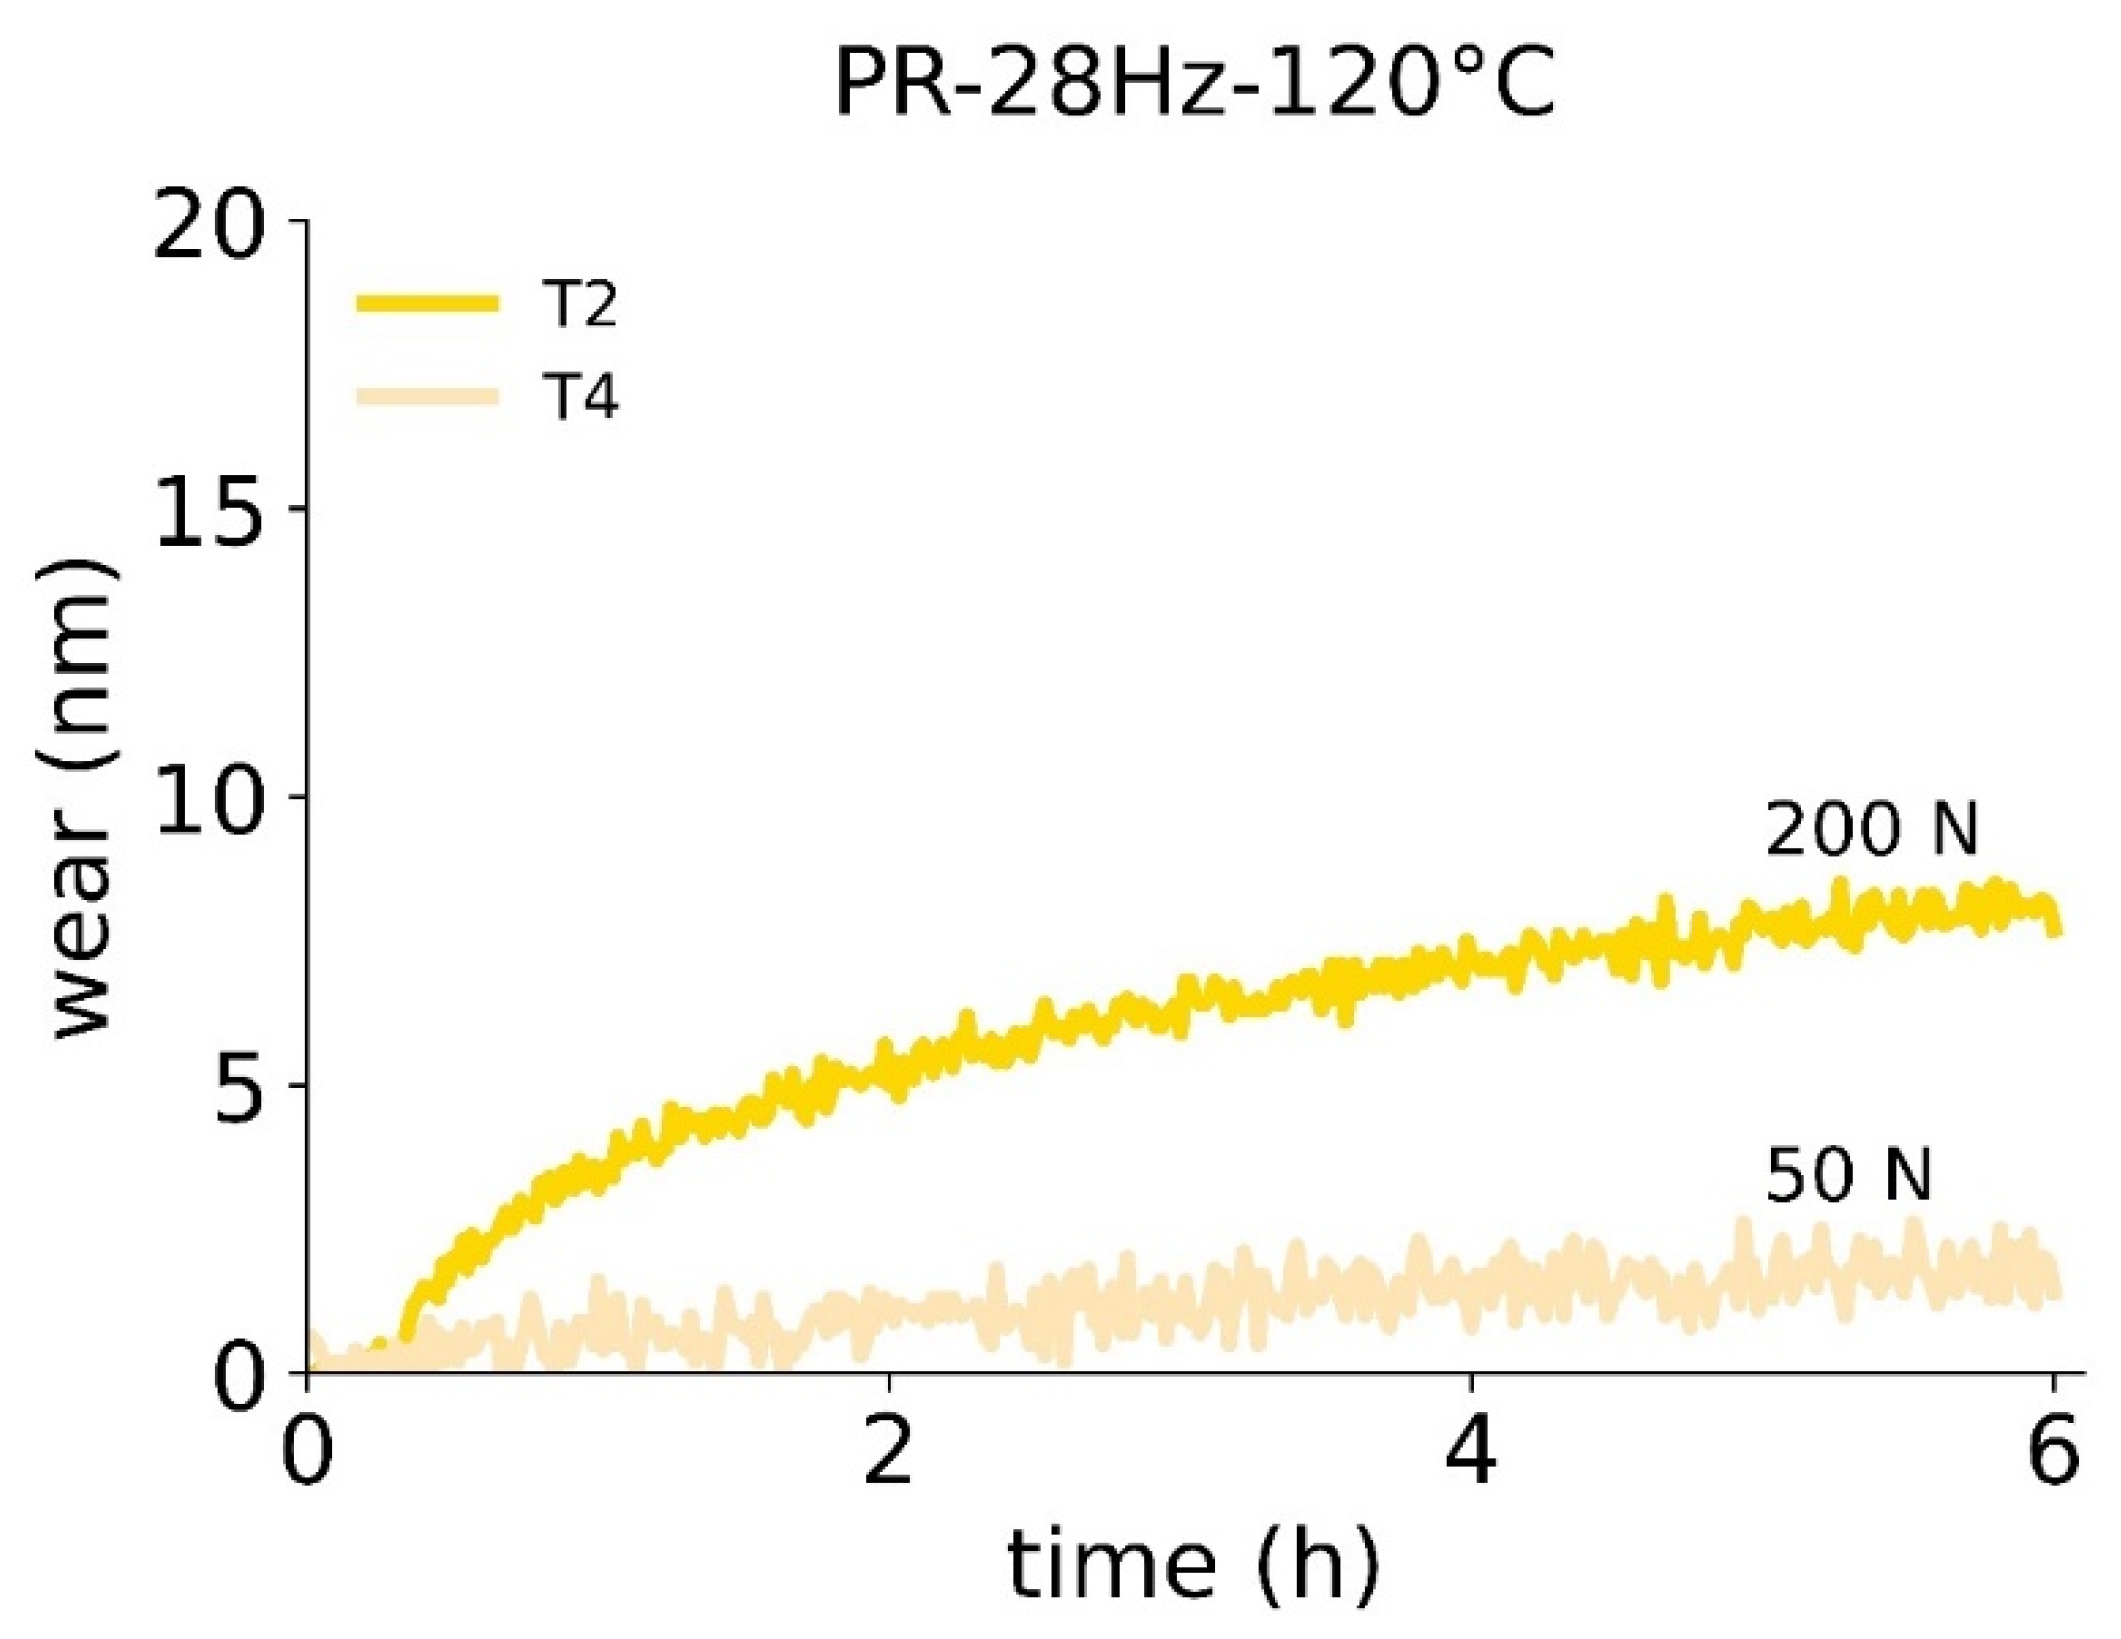
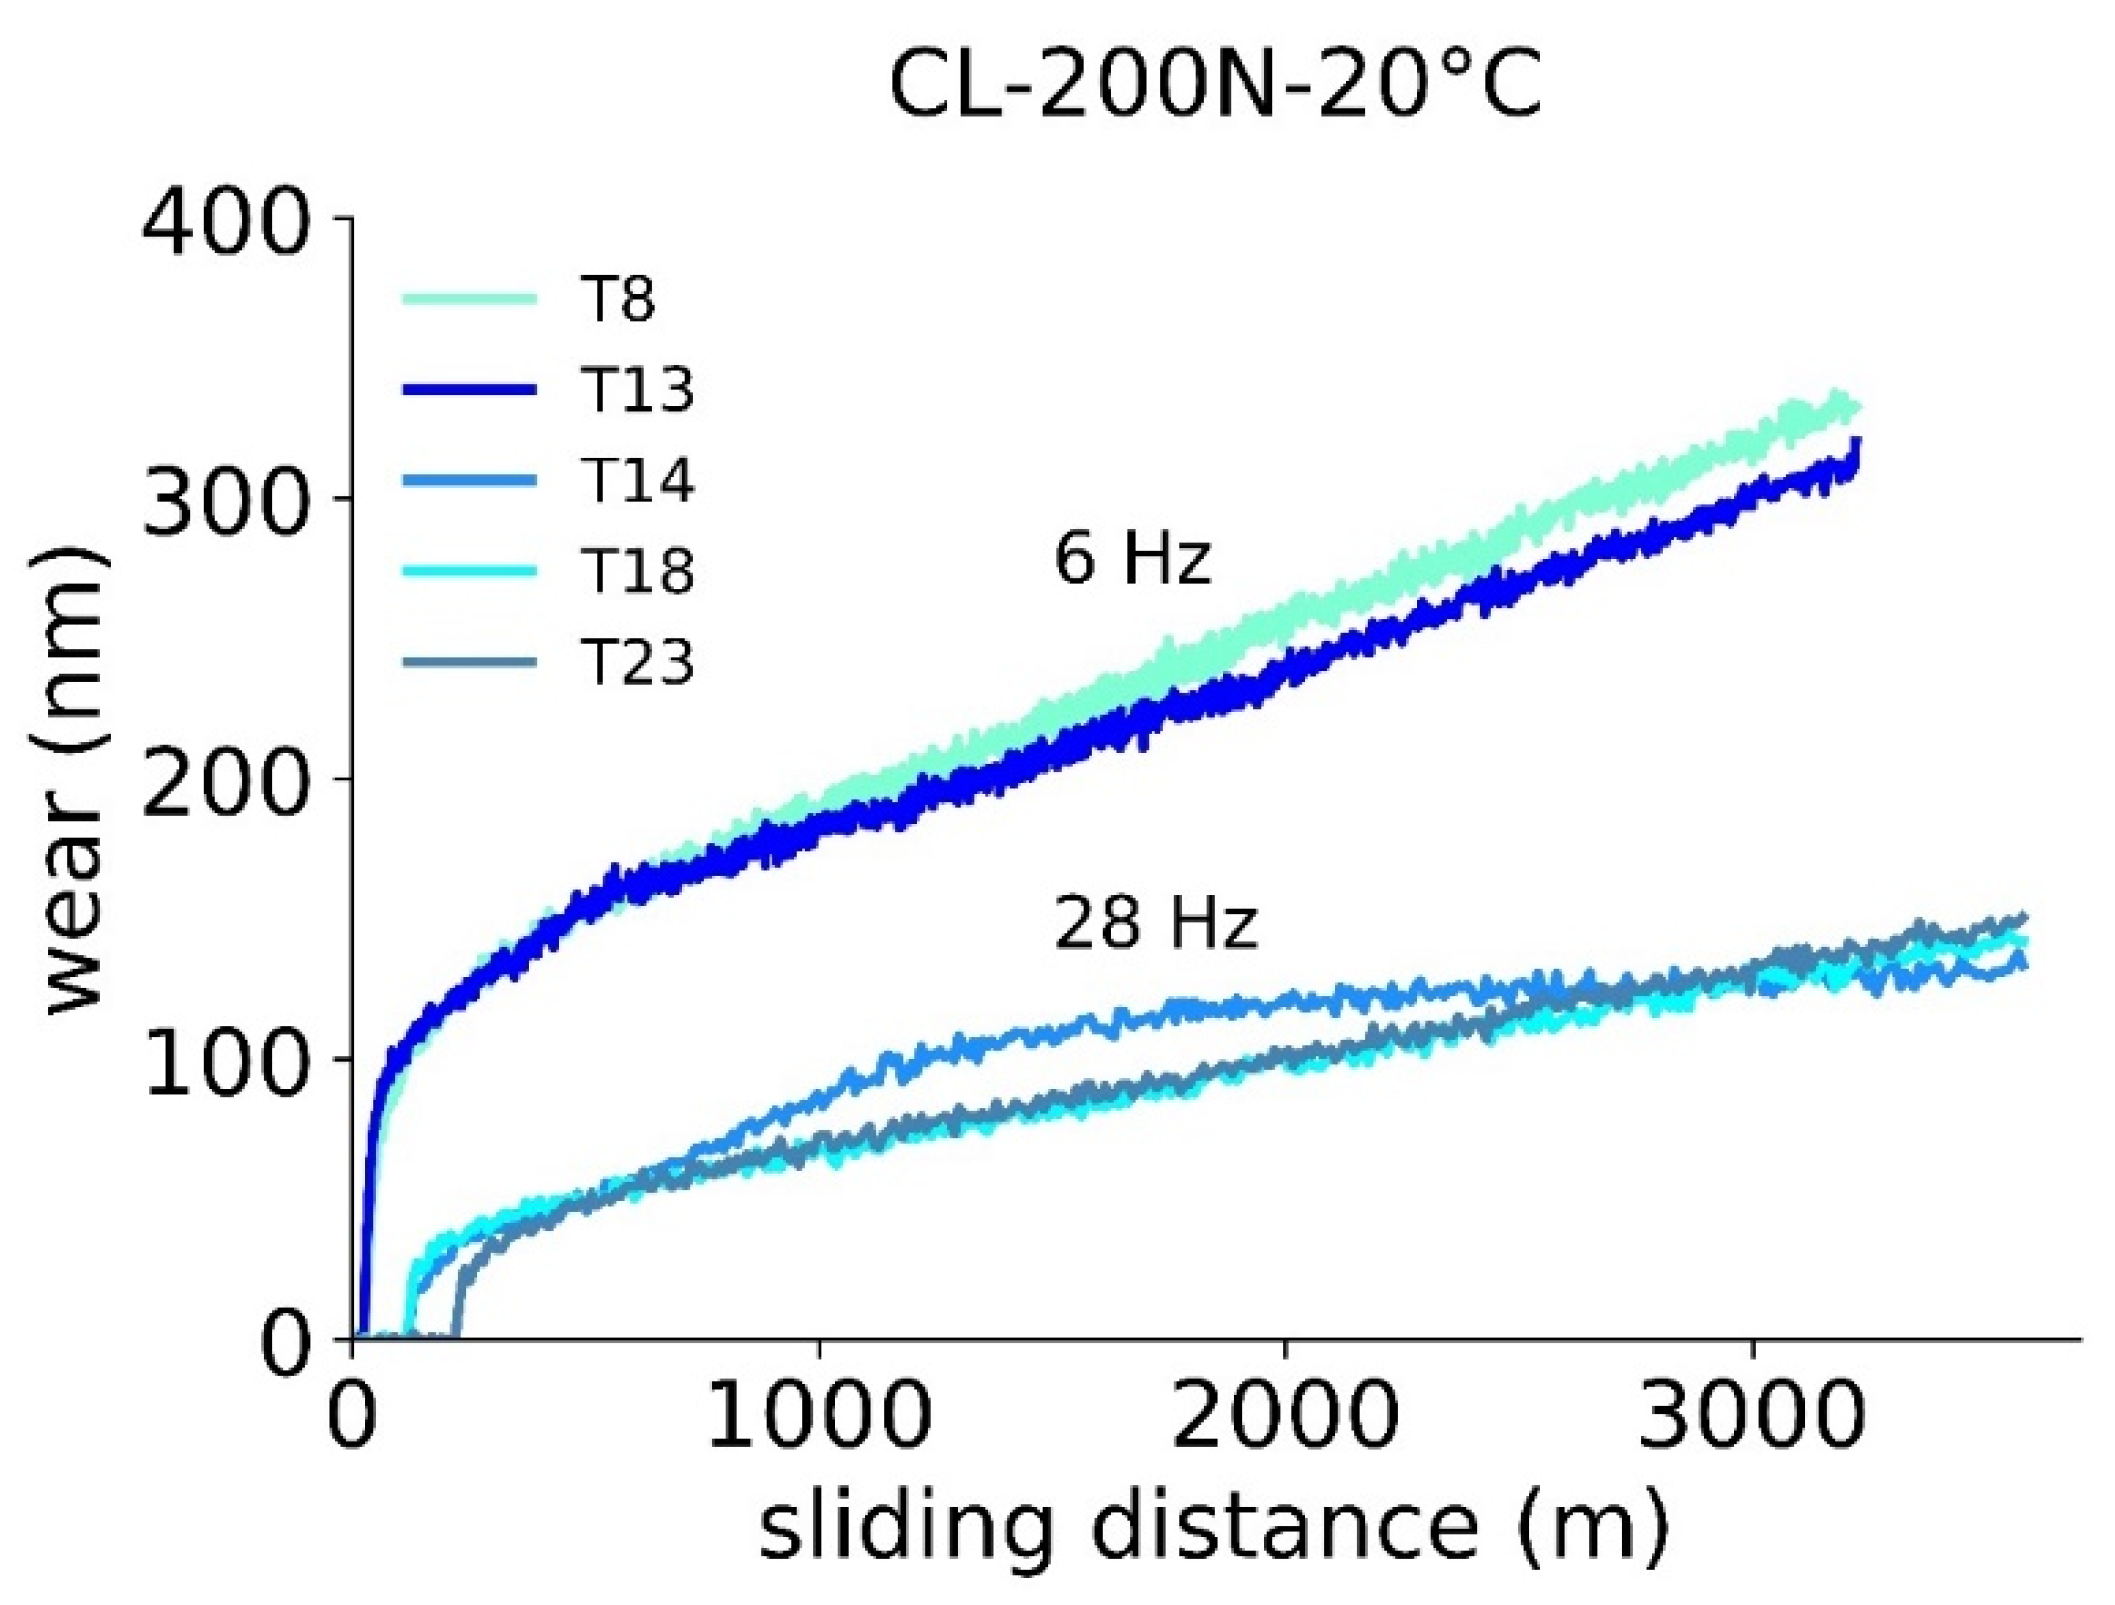
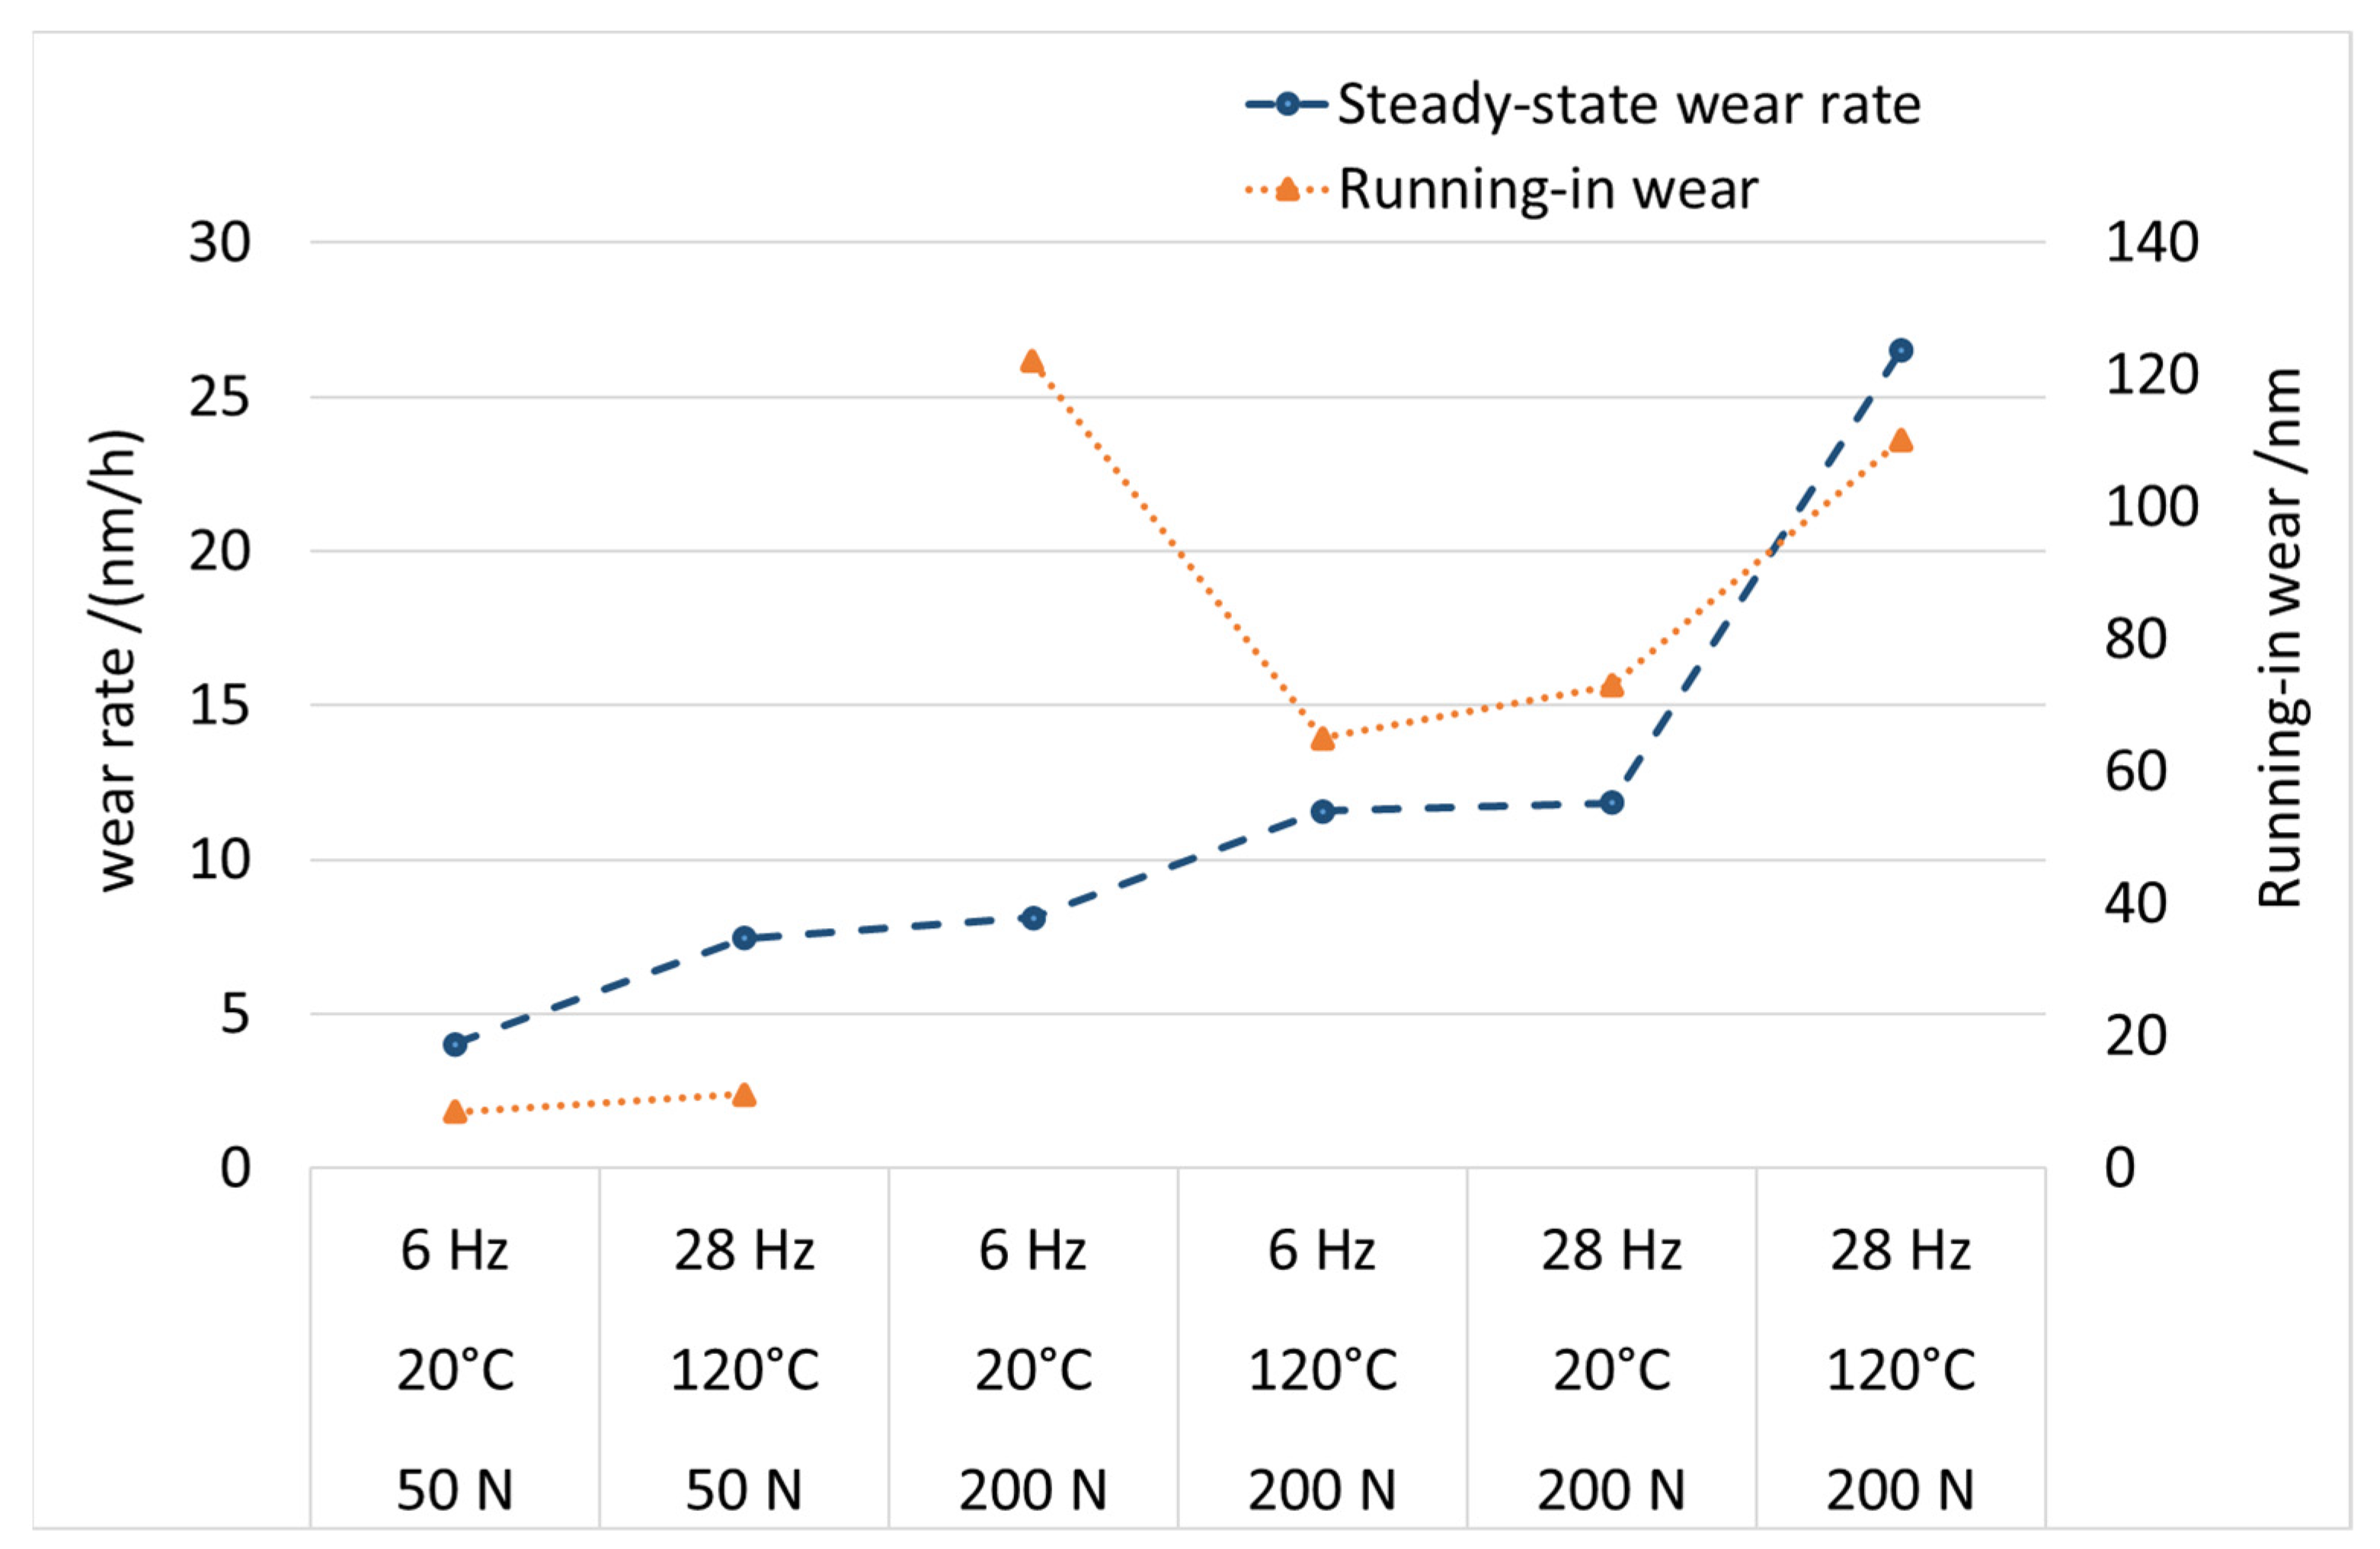
- Wear analysis: The wear results show the load-dependent behaviour that is expected from Archard´s wear model. For the interpretation of the wear trend due to the change in sliding frequency or temperature, the Archard wear model would need an extension taking the tribofilm formation as well as the respective lubrication condition into account;
- Surface analysis: Based on the XPS studies and the comparison with AFM and EDX measurements, a ranking in terms of tribofilm appearance is obtained, which states that higher shear and temperature result in a more pronounced tribofilm. That thickness of the tribofilm is however a matter of debate because of the pad-like geometry of the ZDDP films and therefore more topographic parameters need to be considered in this context.
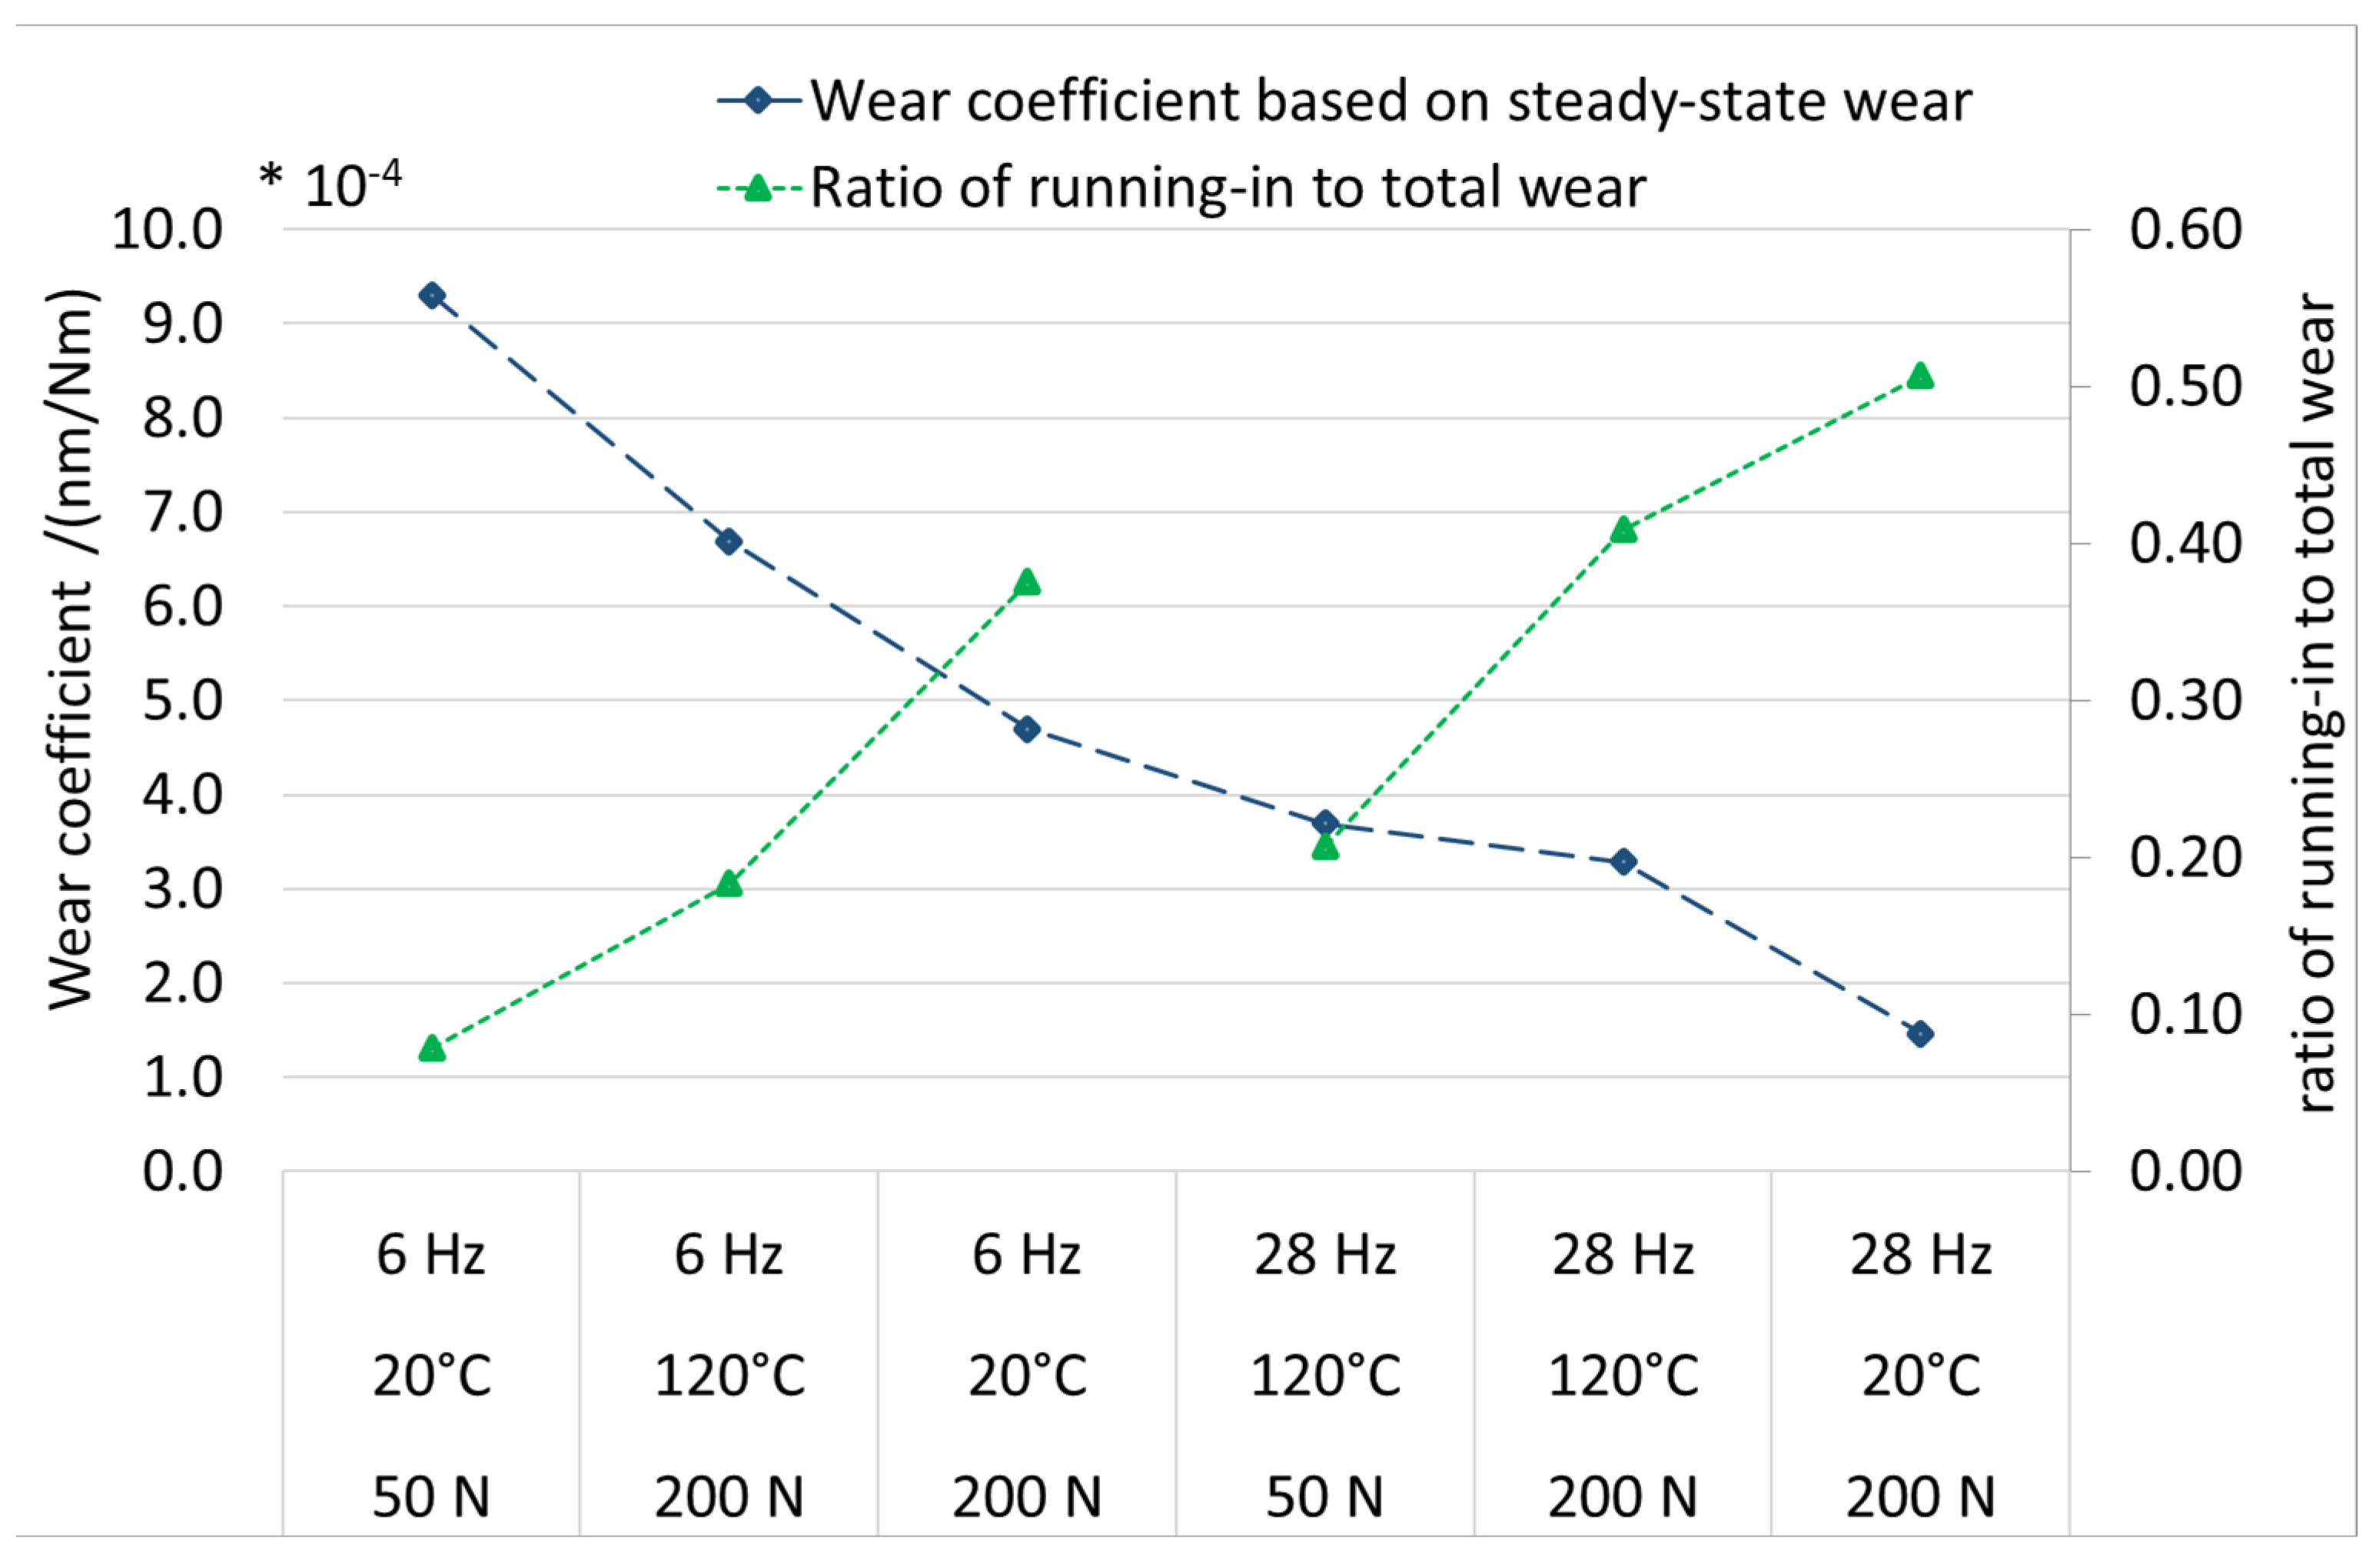
- Tribofilm and wear: A thicker tribofilm does not automatically imply lower wear or wear rates. According to other research papers in the field, the thicker tribofilm should lead to higher friction but lower wear, which is not necessarily the case based upon the testing conditions in this study. The presented results indicate that a steady-state condition somehow is reached, including tribofilm formation, tribofilm removal and substrate removal. The substrate removal is obvious due to the physical characteristics of the applied wear measurement method as only the substrate has been activated.
- Lubrication regime: The formation of the tribofilm is a consequence of the applied shearing and temperature, and the removal is a consequence of the shearing. As such, the loading conditions need to be considered for better characterising the lubrication regime, which then has to be taken into account for modelling the tribofilm formation and wear behaviour of the tribofilm and substrate.
Author Contributions
Funding
Data Availability Statement
Acknowledgments
Conflicts of Interest
References
- Spikes, H. The History and Mechanisms of ZDDP. Tribol. Lett. 2004, 17, 469–489. [Google Scholar] [CrossRef]
- Nicholls, M.A.; Do, T.; Norton, P.R.; Kasrai, M.; Bancroft, G. Review of the lubrication of metallic surfaces by zinc dialkyl-dithiophosphates. Tribol. Int. 2005, 38, 15–39. [Google Scholar] [CrossRef]
- Barnes, A.M.; Bartle, K.D.; Thibon, V.R. A review of zinc dialkyldithiophosphates (ZDDPS): Characterisation and role in the lubricating oil. Tribol. Int. 2001, 34, 389–395. [Google Scholar] [CrossRef]
- Wong, V.W.; Tung, S.C. Overview of automotive engine friction and reduction trends–Effects of surface, material, and lubricant-additive technologies. Friction 2016, 4, 1–28. [Google Scholar] [CrossRef]
- Luiz, J.F.; Spikes, H. Tribofilm Formation, Friction and Wear-Reducing Properties of Some Phosphorus-Containing Antiwear Additives. Tribol. Lett. 2020, 68, 1–24. [Google Scholar] [CrossRef]
- Umer, J.; Morris, N.; Leighton, M.; Rahmani, R.; Balakrishnan, S.; Rahnejat, H. Nano and microscale contact characteristics of tribofilms derived from fully formulated engine oil. Tribol. Int. 2019, 131, 620–630. [Google Scholar] [CrossRef]
- Thersleff, T.; Jenei, I.; Budnyk, S.; Dörr, N.; Slabon, A. Structure and Formation of Soot Particles from Tribofilm Decomposition Under Real Engine Conditions. ChemRxiv 2020. [Google Scholar] [CrossRef]
- Parsaeian, P.; Ghanbarzadeh, A.; Van Eijk, M.C.; Nedelcu, I.; Neville, A.; Morina, A. A new insight into the interfacial mechanisms of the tribofilm formed by zinc dialkyl dithiophosphate. Appl. Surf. Sci. 2017, 403, 472–486. [Google Scholar] [CrossRef]
- Ueda, M.; Kadiric, A.; Spikes, H. On the Crystallinity and Durability of ZDDP Tribofilm. Tribol. Lett. 2019, 67, 123. [Google Scholar] [CrossRef]
- Wang, C.; Gojzewski, H.; Schipper, D.J. A multi-technique characterization of the tribofilm formed by a fully formulated CVT fluid. Tribol. Int. 2020, 146, 106201. [Google Scholar] [CrossRef]
- Chen, Z.; Gu, C.; Tian, T. Modeling of Formation and Removal of ZDDP Tribofilm on Rough Surfaces. Tribol. Lett. 2021, 69, 1–9. [Google Scholar] [CrossRef]
- Zhang, J.; Ueda, M.; Campen, S.; Spikes, H. Boundary Friction of ZDDP Tribofilms. Tribol. Lett. 2021, 69, 8. [Google Scholar] [CrossRef]
- Miranda-Medina, M.D.L.; Tomastik, C.; Truglas, T.; Groiss, H.; Jech, M. Effect of engine oil additives reduction on the tribofilm structure of a cylinder liner model surface. Ind. Lubr. Tribol. 2020, 72, 515–523. [Google Scholar] [CrossRef]
- Gosvami, N.N.; Bares, J.A.; Mangolini, F.; Konicek, A.R.; Yablon, D.G.; Carpick, R.W. Mechanisms of antiwear tribofilm growth revealed in situ by single-asperity sliding contacts. Science 2015, 348, 102–106. [Google Scholar] [CrossRef]
- Zhang, J.; Spikes, H. On the Mechanism of ZDDP Antiwear Film Formation. Tribol. Lett. 2016, 63, 24. [Google Scholar] [CrossRef]
- Pu, W.; Zhang, Q.; Zhang, W.; Ren, S.; Chen, Z.; Tian, T. Flash temperature and anti-wear tribofilm growth mechanisms by asperity contact in top-ring/liner conjunction of IC engines. Tribol. Int. 2020, 146, 106186. [Google Scholar] [CrossRef]
- Akchurin, A.; Bosman, R. A Deterministic Stress-Activated Model for Tribo-Film Growth and Wear Simulation. Tribol. Lett. 2017, 65, 59. [Google Scholar] [CrossRef]
- Martin, J.M. Antiwear mechanisms of zinc dithiophosphate: A chemical hardness approach. Tribol. Lett. 1999, 6, 1–8. [Google Scholar] [CrossRef]
- Fujita, H.; Spikes, H.A. The formation of zinc dithiophosphate antiwear films. Proc. Inst. Mech. Eng. Part J J. Eng. Tribol. 2004, 218, 265–277. [Google Scholar] [CrossRef]
- Shimizu, Y.; Spikes, H. The Tribofilm Formation of ZDDP Under Reciprocating Pure Sliding Conditions. Tribol. Lett. 2016, 64, 46. [Google Scholar] [CrossRef] [Green Version]
- Ghanbarzadeh, A.; Piras, E.; Nedelcu, I.; Brizmer, V.; Wilson, M.C.; Morina, A.; Dowson, D.; Neville, A. Zinc dialkyl dithiophosphate antiwear tribofilm and its effect on the topography evolution of surfaces: A numerical and experimental study. Wear 2016, 362–363, 186–198. [Google Scholar] [CrossRef]
- Mohammadtabar, K.; Eder, S.J.; Dörr, N.; Martini, A. Heat-, Load-, and Shear-Driven Reactions of Di-tert-butyl Disulfide on Fe(100). J. Phys. Chem. C 2019, 123, 19688–19692. [Google Scholar] [CrossRef]
- Hsu, C.-J.; Barrirero, J.; Merz, R.; Stratmann, A.; Aboulfadl, H.; Jacobs, G.; Kopnarski, M.; Mücklich, F.; Gachot, C. Revealing the interface nature of ZDDP tribofilm by X-ray photoelectron spectroscopy and atom probe tomography. Ind. Lubr. Tribol. 2020, 72, 923–930. [Google Scholar] [CrossRef]
- Miranda-Medina, M.; Spiller, S.; Vernes, A.; Jech, M. Spectroscopic ellipsometry and X-ray photoelectron comparative studies of tribofilms formed on cast iron surfaces. Tribol. Int. 2017, 113, 101–110. [Google Scholar] [CrossRef]
- Dawczyk, J.; Morgan, N.; Russo, J.; Spikes, H. Film Thickness and Friction of ZDDP Tribofilms. Tribol. Lett. 2019, 67, 34. [Google Scholar] [CrossRef]
- Truhan, J.J.; Qu, J.; Blau, P.J. A rig test to measure friction and wear of heavy duty diesel engine piston rings and cylinder liners using realistic lubricants. Tribol. Int. 2004, 38, 211–218. [Google Scholar] [CrossRef]
- Benedet, J.; Green, J.H.; Lamb, G.D.; Spikes, H.A. Spurious Mild Wear Measurement Using White Light Interference Microscopy in the Presence of Antiwear Films. Tribol. Trans. 2009, 52, 841–846. [Google Scholar] [CrossRef]
- Corniani, E.; Jech, M.; Ditroi, F.; Wopelka, T.; Franek, F. TLA and wear quantification of an aluminium–silicon–copper alloy for the car industry. Wear 2009, 267, 828–832. [Google Scholar] [CrossRef]
- Spiller, S.; Lenauer, C.; Wopelka, T.; Jech, M. Real time durability of tribofilms in the piston ring—Cylinder liner contact. Tribol. Int. 2017, 113, 92–100. [Google Scholar] [CrossRef]
- Lenauer, C.; Tomastik, C.; Wopelka, T.; Jech, M. Piston ring wear and cylinder liner tribofilm in tribotests with lubricants artificially altered with ethanol combustion products. Tribol. Int. 2015, 82, 415–422. [Google Scholar] [CrossRef]
- International Atomic Energy Agency, Radiotracer Technologies for Wear, Erosion and Corrosion Management., IAEA-TECDOC-1897. 2020. Available online: https://www.iaea.org/publications/13532/radiotracer-technologies-for-wear-erosion-and-corrosion-measurement (accessed on 6 February 2023).
- Wopelka, T.; Cihak-Bayr, U.; Lenauer, C.; Ditrói, F.; Takács, S.; Sequard-Base, J.; Jech, M. Wear of different material pairings for the cylinder liner—Piston ring contact. Ind. Lubr. Tribol. 2018, 70, 687–699. [Google Scholar] [CrossRef]
- Azam, A.; Ghanbarzadeh, A.; Neville, A.; Morina, A.; Wilson, M.C. Modelling tribochemistry in the mixed lubrication regime. Tribol. Int. 2019, 132, 265–274. [Google Scholar] [CrossRef]
- Azam, A.; Dorgham, A.; Parsaeian, P.; Morina, A.; Neville, A.; Wilson, M.C. The mutual interaction between tribochemistry and lubrication: Interfacial mechanics of tribofilm. Tribol. Int. 2019, 135, 161–169. [Google Scholar] [CrossRef]
- Archard, J.F. Contact and Rubbing of Flat Surfaces. J. Appl. Phys. 1953, 24, 981–988. [Google Scholar] [CrossRef]
- Software.Informer, “Hertzwin2020,” Informer Technologies, Inc. Available online: https://hertzwin.software.informer.com/ (accessed on 20 September 2021).
- Jech, M.; Lenauer, C.; Totten, G.E.; Czichos, H.; Woydt, M.; van der Heide, E.; Schipper, D.J.; Budinski, K.; van Spengen, W.M.; Fischer, H.; et al. Radionuclide Methods; ASM International: Almere, The Netherlands, 2017; pp. 1045–1055. [Google Scholar] [CrossRef]
- Shirley, D.A. High-Resolution X-Ray Photoemission Spectrum of the Valence Bands of Gold. Phys. Rev. B 1972, 5, 4709–4714. [Google Scholar] [CrossRef]
- DEUTSCHE NORM Normenausschuss Materialprüfung (NMP) im DIN Fachausschuss Mineralöl-und Brennstoffnormung (FAM) des NMP, “DIN 51834-1,” 2010. Available online: www.din.de (accessed on 20 March 2012).
- Bahari, A.; Lewis, R.; Slatter, T. Hardness characterisation of grey cast iron and its tribological performance in a contact lubricated with soybean oil. Proc. Inst. Mech. Eng. Part C J. Mech. Eng. Sci. 2016, 232, 190–203. [Google Scholar] [CrossRef]
- Zhu, D.; Wang, Q.J. On the λ ratio range of mixed lubrication. Proc. Inst. Mech. Eng. Part J J. Eng. Tribol. 2012, 226, 1010–1022. [Google Scholar] [CrossRef]
- Morina, A.; Neville, A. Tribofilms: Aspects of formation, stability and removal. J. Phys. D Appl. Phys. 2007, 40, 5476–5487. [Google Scholar] [CrossRef]
- Konicek, A.R.; Jacobs, P.W.; Webster, M.N.; Schilowitz, A.M. Role of tribofilms in wear protection. Tribol. Int. 2016, 94, 14–19. [Google Scholar] [CrossRef]


| Oil Temperature (°C) | Load (N) | Frequency (Hz) | Test Duration (h) | Stroke (mm) | Sliding Distance (m) |
|---|---|---|---|---|---|
| 20 | 50 | 6 | 25 | 3 | 3240 |
| 20 | 200 | 6 | 25 | 3 | 3240 |
| 20 | 200 | 28 | 6 | 3 | 3628 |
| 120 | 50 | 28 | 6 | 3 | 3628 |
| 120 | 200 | 28 | 6 | 3 | 3628 |
| 120 | 200 | 6 | 25 | 3 | 3240 |
| Physical Properties | |
| Kinematic viscosity (mm2/s) | 40 °C: 56.2 |
| 100 °C: 9.84 | |
| TAN, (mg KOH/g) | 3.6 |
| TBN, (mg KOH/g) | 10.5 |
| Antiwear additive | primary ZDDP |
| Friction modifier | no Mo and B containing compounds |
| Base oil group | III |
| Chemical Elements (ppm) | |
| Zn | 1190 |
| Ca | 3860 |
| Mg | <10 |
| B | <10 |
| P | 1065 |
| Mo | 0 |
| Cl | <30 |
| Tribotest Parameters | 20 °C-6 Hz | 20 °C-28 Hz | 120 °C-28 Hz | 120 °C-6 Hz | |||||||||||
|---|---|---|---|---|---|---|---|---|---|---|---|---|---|---|---|
| 50 N | 200 N | 200 N | 50 N | 200 N | 200 N | ||||||||||
| Activated for RIC | CL | PR | CL | PR | CL | CL | PR | CL | PR | CL | |||||
| Tribometer test | T7 T10 | T1 | T8 T13 | T3 | T14 T18 T23 | T5 T9 | T4 | T6 T11 | T2 | T15 T16 | |||||
| SEM | ✓ | - | ✓ | - | - | ✓ | - | ✓ | - | - | |||||
| AFM | ✓ | ✓ | ✓ | ✓ | - | ✓ | ✓ | ✓ | ✓ | - | |||||
| XPS | ✓ | ✓ | - | - | - | - | - | ✓ | ✓ | - | |||||
| SEM | AFM | |||
|---|---|---|---|---|
| out of the contact zone | wear scar | wear scar | out of the contact zone | |
| 50 N 6 Hz 20 °C | 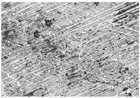 260 × 180 µm2 |  260 × 180 µm2 |  100 × 100 µm2 | 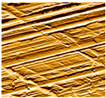 100 × 100 µm2 |
| 50 N 28 Hz 120 °C | 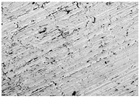 260 × 180 µm2 | 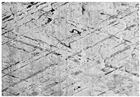 260 × 180 µm2 | 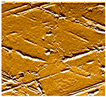 100 × 100 µm2 | 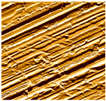 100 × 100 µm2 |
| 200 N 6 Hz 20 °C |  260 × 180 µm2 | 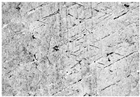 260 × 180 µm2 | 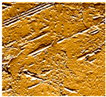 100 × 100 µm2 |  100 × 100 µm2 |
| 200 N 28 Hz 120 °C | 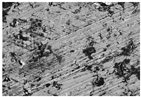 260 × 180 µm2 | 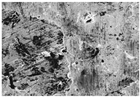 260 × 180 µm2 | 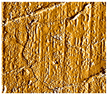 100 × 100 µm2 | 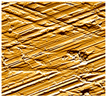 100 × 100 µm2 |
Disclaimer/Publisher’s Note: The statements, opinions and data contained in all publications are solely those of the individual author(s) and contributor(s) and not of MDPI and/or the editor(s). MDPI and/or the editor(s) disclaim responsibility for any injury to people or property resulting from any ideas, methods, instructions or products referred to in the content. |
© 2023 by the authors. Licensee MDPI, Basel, Switzerland. This article is an open access article distributed under the terms and conditions of the Creative Commons Attribution (CC BY) license (https://creativecommons.org/licenses/by/4.0/).
Share and Cite
Jech, M.; Miranda-Medina, M.L.; Wopelka, T.; Tomastik, C.; Gachot, C. Effect of Sliding on the Relation of Tribofilm Thickness and Wear. Lubricants 2023, 11, 72. https://doi.org/10.3390/lubricants11020072
Jech M, Miranda-Medina ML, Wopelka T, Tomastik C, Gachot C. Effect of Sliding on the Relation of Tribofilm Thickness and Wear. Lubricants. 2023; 11(2):72. https://doi.org/10.3390/lubricants11020072
Chicago/Turabian StyleJech, Martin, Maria L. Miranda-Medina, Thomas Wopelka, Christian Tomastik, and Carsten Gachot. 2023. "Effect of Sliding on the Relation of Tribofilm Thickness and Wear" Lubricants 11, no. 2: 72. https://doi.org/10.3390/lubricants11020072