Review

Changes in Surface Topography and Light Load Hardness in Thrust Bearings as a Reason for Tribo-Electric Loads

Chair of Machine Elements, Gears and Tribology (MEGT) RPTU Kaiserslautern-Landau, Gottlieb Daimler Straße 42, 67663 Kaiserslautern, Germany
*
Author to whom correspondence should be addressed.
Lubricants 2024, 12(9), 303; https://doi.org/10.3390/lubricants12090303
Submission received: 21 June 2024 / Revised: 22 August 2024 / Accepted: 23 August 2024 / Published: 28 August 2024
(This article belongs to the Special Issue Tribology in Germany: Latest Research and Development)

Abstract

:
The article focuses on the findings of endurance tests on thrust bearings. In addition to the mechanical load (axial load: 10 ≤ C0/P ≤ 19, lubrication gap: 0.33 µm ≤ h0 ≤ 1.23 µm), these bearings are also exposed to electrical loads (voltage: 20 Vpp ≤ U0 ≤ 60 Vpp, frequency 5 kHz and 20 kHz), such as those generated by modern frequency converters. In a previous study, the focus was on the chemical change in the lubricant and the resulting wear particles. In contrast, this article focuses on the changes occurring in the metallic contact partners. Therefore, the changes in the surface topography are analysed using Abbott–Firestone curves. These findings show that tests with an additional electrical load lead to a significant reduction in roughness peaks. A correlation to acceleration measurements is performed. Moreover, it is shown that the electrical load possibly has an effect on the light load hardness. An increase in the occurring wear could not be detected during the test series. Also, a comparison with mechanical reference tests is made. The article finally provides an overview of different measurement values and their sensitivity to additional electrical loads in roller bearings.

1. Introduction

Rolling bearings are critical components in mechanical engineering, facilitating independent rotational movements between two machine parts. They are exposed to a variety of loads (e.g., mechanical, thermal, chemical) under different operating conditions. These influence the service life of the rolling bearings and can be largely classified and considered by means of service life calculations.
As a result of the increased use of electric motors in combination with fast-switching frequency inverters with IGB (insulated-gate bipolar) or SiC (carbon silicide) transistors [1,2,3], the motor bearings, for example, may be exposed to electrical loads in addition to mechanical loads. This phenomenon is known as parasitic electrical current passage. This current passage causes accelerated damage to the rolling bearings [4,5] and lubricants [6,7], which can lead to component failure within a short time. Different damage mechanisms can be identified. In the case of lubricants, for example, accelerated oxidation [8,9] or molecular changes in the lubricant chemistry [6,10] can occur. Grey running marks [11,12,13], accumulations of individual discharge craters [11,12,13] or electromechanically caused lenticular protrusions known as fluting [14,15,16] appear on the metallic raceways of the rolling bearings. To date, these electromechanical damage events can only be considered to a limited extent in the design of rolling bearings or other machine elements. The dimensioning parameters currently used in design do not yet provide sufficient reliability in practical applications [13,17,18,19]. Furthermore, no distinction is made between the types of damage (lubricant oxidation, grey track or fluting) to be dimensioned against. This leads to overdimensioning and unexpected early failures of the components [17,18,19,20,21]. Alternatively, expensive protective measures are taken to limit the parasitic current flow [17,21,22,23].
By focussing on the damage to the metallic components of a rolling bearing, a correlation between component vibrations and the onset of damage phenomena [23,24,25,26] could be demonstrated. The vibration excitation caused by fluting in particular is used to reliably identify these at an early stage and initiate maintenance [27,28]. Furthermore, in [29,30], the component vibration was correlated to the occurring discharge energies of the individual breakdowns. This behaviour was also observed in [18].
Further studies on components damaged by the passage of current focus on the changes that occur in the material as described by microscopy [30,31,32,33,34], metallurgy [30,33,34] or spectroscopy [35]. These publications describe the damage that occurs in more general terms.
In addition, there are also publications that prevent or delay the occurrence of electrical damage through the use of targeted, expensive measures (such as the use of insulation [20] and adaptation of the electrical control system [35]) so that the calculated L10 bearing service life is achieved.
The following investigation continues the results of article [36]. While the changes in the lubricant were considered in detail in [36], the focus here is on the influence on the metallic surface. Different measurement methods are used, which present the test series regarding the changes in the surface topography, the influence of the electrical load on the light load hardness and the results of a vibration analysis.

2. Test Setup

The Chair of Machine Elements, Gears and Tribology (MEGT) has specialised test benches to investigate the electrical loads in rolling bearings of inverter-fed electric motors. These test rigs make it possible to vary electrical and mechanical operating conditions independently of each other, which enables a detailed investigation of the influence of electrical currents on rolling bearings [11,22,36].
The GESA (ger. Gerät zur erweiterten Schmierstoffanalyse—device for advanced lubricant analysis/developed by MEGT) test rig used in the investigations presented here allows the specific investigation and measurement of bearing currents in thrust bearings, among others. The purely vertical load (see Figure 1) ensures uniform tribological conditions at the rolling contacts. This makes it possible to precisely analyse the electrical properties of the rolling bearings and lubricants.
In the tests, axial deep groove ball bearings (type 51208) are subjected to a combined mechanical and electrical load. These mechanical and electrical boundary conditions can be found in Table 1 and Table 2. To make it easier to differentiate between the test regimes, they are labelled as a function of the axial force applied. This results in the following relationship:
  • Test series A—axial load 4000 N (C0/P 19);
  • Test series B—axial load 6000 N (C0/P 13);
  • Test series C—axial load 8000 N (C0/P 10).
Using the lubricant used here (non-additive mineral oil identical to [36]), the following mechanical loads and tribological lubricant film heights are present in the tests.

3. Test Procedure and Measured Variables

The test bearings are first subjected to a 16 h mechanical run-in. This results in individual roughness peaks being smoothed out and constant tribological and electrical behaviour being achieved. This running-in is carried out at 2400 N, 1000 rpm and a lubricant temperature of 40 °C. The bearing is then dismantled, and the surface topography of the bearing raceways is measured. This is performed using the method described in Section 3.2, which has already been successfully tested in [11,21,22,23,38]. The test specimen is then remounted and loaded for 168 h. The load collectives correspond to the boundary conditions listed in Table 1. After completion of the test run, the surface topography of the bearing raceways is measured again. The measured variables listed below are analysed.

3.1. Acceleration Measurement

To gain insights into the relationship between running noise, vibrations and surface topography of the bearing raceway, continuous vibration measurements were performed during the test runs. For this purpose, an acceleration sensor is located on the housing of the test cell (Figure 1 A), and the rotation speed of the bearing is also recorded via a Hall sensor. A piezoelectric sensor (manufacturer: Dytran, Los Angeles, CA, USA/designation: 3056B5) is used; it has a resolution of 50 mV/g and covers a measuring range between 0 and 100 g amplitude at a frequency of 1 Hz to 10 kHz. The subsequent evaluation is carried out by visualising the order spectra over the test time.

3.2. Confocal and Light Microscopy of the Rolling Elements and Raceway Surfaces

Two different methods are used to measure the surfaces of the rolling elements at selected test points. A selection of different microscopes and macroscopes is used to visually compare the surfaces. The 3D surface measurement is carried out using a confocal microscope (vertical resolution of the lens used is 0.006 µm). A developed test fixture ensures that the sample (such as the bearing rings) is always positioned and aligned identically to the microscope. This allows the almost identical surface section to be monitored at different times. In order to enable comparability of the measured surface sections at the different test times, a special measurement recording was developed. This is shown schematically in Figure 2. To ensure optimum and reproducible positioning, the test bearing is provided with a chamfer before the start of the actual test series. After inserting the bearing ring on the base surface, the position is determined via the contact surface and the positioning bolt. In addition, the chamfer is pressed against the contact surface via the clamping screw and thus fixed in position.
The reproducibility of the surface measurement using this image was confirmed in [11,18]. The objective used in the measurements on the confocal microscope (manufacturer: NanoFocus, Oberhausen, Germany) achieves a resolution of 1.55 µm in the plane and 0.006 µm in the height.
The post-processing and preparation of the 3D surfaces is conducted using the commercial programme MountainsMap (manufacturer: Digital Surf, Besancon, FRA/version: premium 6.0). In this step, so-called artefacts, such as reflections or strong measurement deviations of the surface measurement, are first searched for and eliminated by means of interpolation. Based on this, the shape is then separated from the roughness for further evaluation, resulting in a plane with superimposed roughness and corrugation. The evaluation is carried out using Abbott–Firestone curves [39], histograms of the surface heights and a selection of surface characteristics in accordance with [40].

3.3. Light Load Hardness

As a result of the electromechanical load, the surface is massively reshaped in parts. This can be observed and documented in the form of a change in the topography or a change in individual surface parameters). In addition to this influence on the surface topography, it can be assumed that the mechanical properties of the rolling bearing raceways close to the surface are also influenced. In line with this hypothesis, the light load hardness of the bearing raceways was measured as part of a separate series of tests. A Micro-Vickers hardness tester (manufacturer: Mitutoyo Cooperation, Kawasaki, Japan/designation: HM-112) with a test weight of 1 kg (↦ light load hardness) was used for this purpose. Microindentation was carried out on each bearing ring in the centre of the raceway. In order to include any scatter in the hardness measurement in the assessment of the results, five measurements were taken along the raceway for each bearing ring. Furthermore, sufficient spacing between the individual indentation points ensured that there was no mutual interference between the individual measurements.

3.4. Determination of Wear Weights

A high-precision balance (manufacturer: Ohaus, Parsippany, NJ, USA/designation: Explorer EX225D) is employed to measure the electroerosive wear of the analysed rolling bearings. This has a readability of 0.01 mg with a repeatability of 0.02 mg. It is used to weigh the individual rolling bearing rings as well as the rolling element sets (including the cage) in selected tests.

4. Results

4.1. Electrical Load over Time

The results of test series A (see Figure 3a) show the expected influence of the amplitude of the source voltage on the resulting load characteristics. Furthermore, tests A-e1 and A-e2 show an almost constant behaviour of apparent bearing current density and bearing apparent power over the test period. Irrespective of this, A-e1 continues to show a slight increase in the load level and an increase in scatter from a running time of around 72 h. This effect is more pronounced for the bearing apparent power than for the average bearing current density, for example. The tests with identical loads (A-e3-a and A-e3-b) show the repeatability of the energisation over the test time at a comparable load level. In addition, both tests have a short isolating phase (A-e3-a → 30 h/A-e3-b → 48 h), after which the load values are almost identical until the end of the test. Test A-e4 was carried out within an increased lubricant temperature of 80 °C but with a source voltage of 60 V (pk to pk) comparable to A-e1. This is also confirmed by the trend of the load variables, as shown in Figure 3a. However, after around 120 h, there is a sudden drop in the average load value in both characteristic values of this test. The measurement data do not provide conclusive information regarding the cause of this drop. Test series B is shown together with the electrical test of test series C in Figure 3b. For test series B, despite the identical amplitude of the source voltage, there are clearer differences in the resulting apparent bearing current density and bearing apparent power than in test series A, for example. However, this difference in the electrical load can still be categorised as small, at least in this type of evaluation. Both test B-e1 and test C-e1 scatter more strongly at the beginning of the tests. This scatter decreases after a test duration of about 72 h. As in test series A, this change is also more clearly recognisable in the diagrams of the average storage appearance performance due to the more pronounced gradients. It should also be noted that in test B-e1, there was no further electrical load from 158 h onwards. This occurred due to a single failure of the voltage source. The other tests in test series B, which were carried out with a reduced switching frequency (B-e2) and increased lubricant temperature (B-e3), show an almost constant electrical load over the test period and are unremarkable. When comparing the test series with each other, it should be noted that the load levels of the electrical rating parameters differ. Thus, due to the lack of reference to a mechanical load variable, the average bearing apparent power at identical source voltage is in a similar range (at 60 V (pk to pk) approx. 4 VA). Using the bearing current density, the electrical load levels are dependent on the Hertzian contact area, which is why test series A has the highest load and test series C the lowest load at identical source voltage.

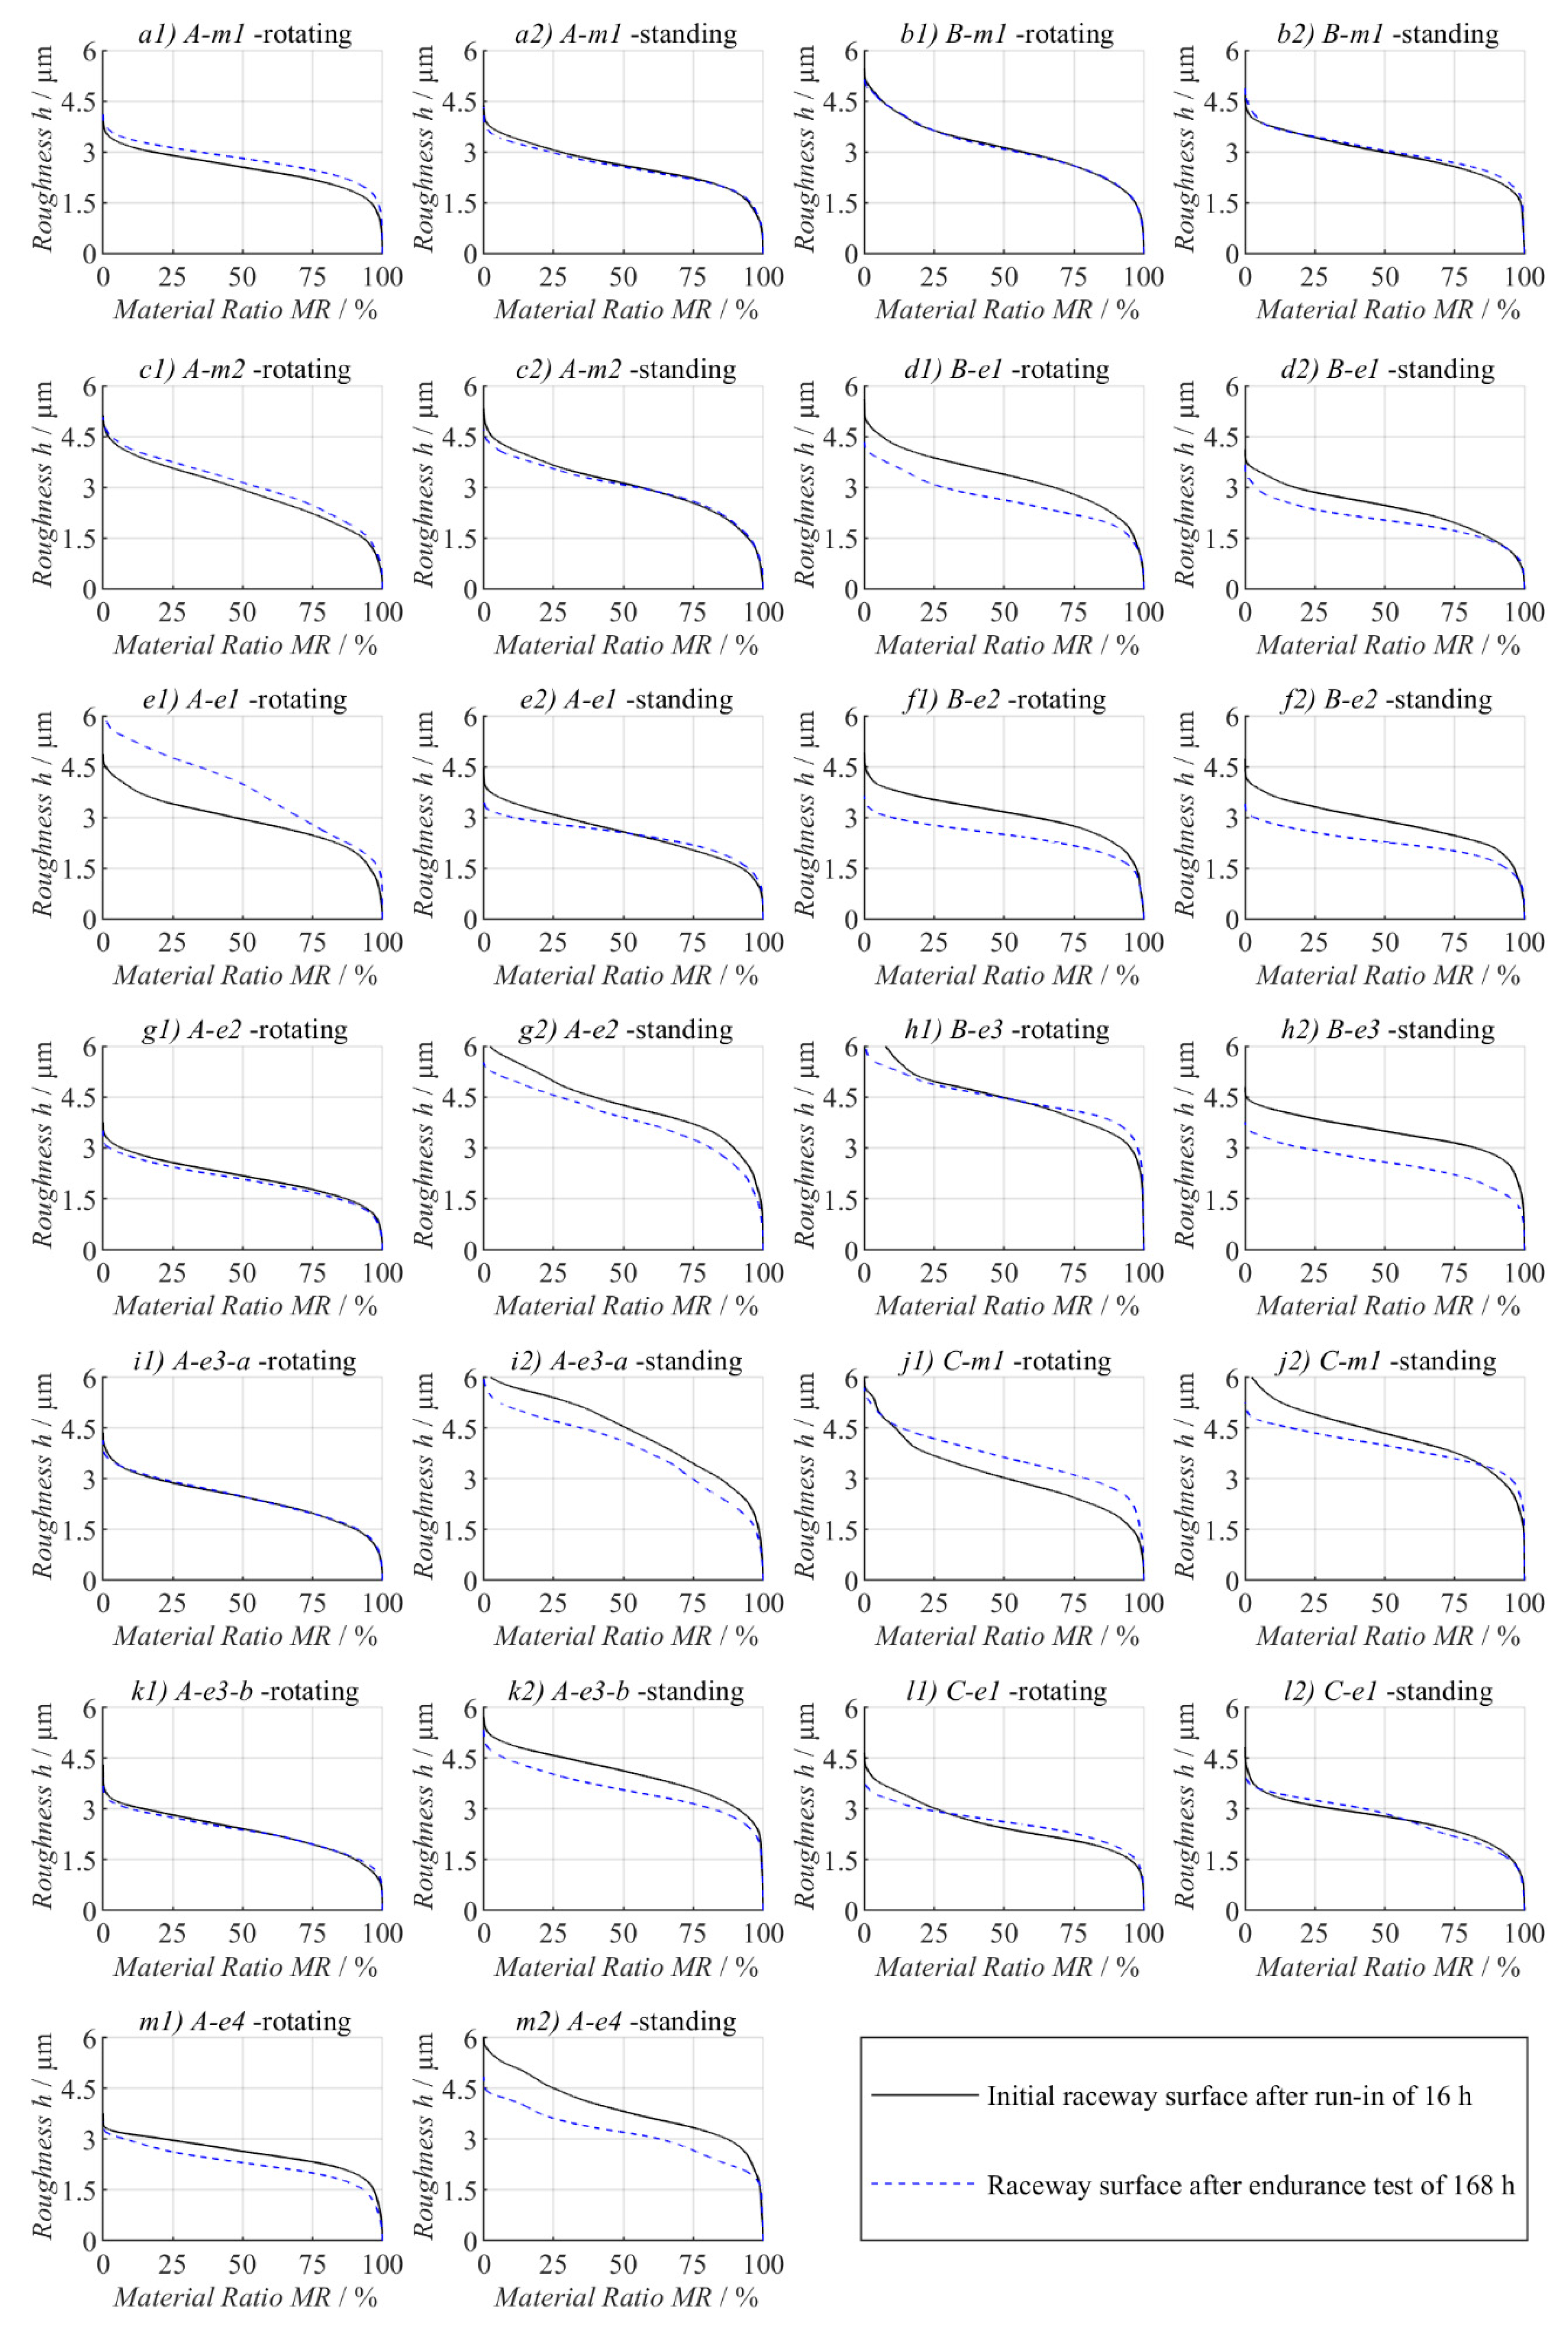
4.2. Surface Topography

To supplement the visual assessment of the surface changes [36], a quantifying measurement of the roughness of the bearing raceways was carried out using a confocal microscope. The method presented in [11] was used here, in which the bearing rings are provided with a mirror coating, which then allows them to be positioned and aligned exactly to the microscope used in a specially developed test fixture. This allows the almost identical surface section to be measured at different times. Using this image, the bearing raceways were scanned after running-in for 16 h and after the load phase of 168 h. Figure 4 shows the Abbott–Firestone curves resulting from these measurements after the running-in and loading phases for all tests.
Figure 4 shows that there is no significant surface change in the purely mechanical reference tests of test series A and B. The material area curves on the rotating and stationary ring after the running-in and loading phase of the respective tests are almost identical (see Figure 4(a1–c2)). This behaviour does not correspond to the results of the reference test C-m1. This is due to the severe surface damage that occurred in this test and must be considered when interpreting the results.
Furthermore, this type of visualisation clearly shows the influence of the electrical load. Based on the microscopic assessment of the surface [36], a smoothing effect was observed. This is shown by a clear drop in the profile heights after the electromechanical load compared to the initial level after the bearing run-in. The results from test A-e1 deviate from this (see Figure 4e1 A-e1-rotating). Here, there was an increase in the profile height of the rotating ring. This is a direct consequence of the fluting created here (see Figure 4c), which results in a noticeable deepening of the surface. In addition, this type of surface evaluation shows that the corrugation shading or bearing current marks are not noticeable.
Looking at the other results of test series A with lower source voltage and increased temperature, it is noticeable that there was no or only a slight drop in the profile heights on the rotating ring. In contrast, the influence of the electrical load and the smoothing that occurs is clear on the stationary ring. An effect of the different heights of the source voltage between 20 V (pk to pk) and 40 V (pk to pk) (see figure parts g2, i2 and k2) cannot be determined in this form of visualisation. While only minor changes occurred on the rotating ring in test series A, reductions in the profile height can be observed on both bearing rings in test series B.
Furthermore, no difference in the surface smoothing that occurs as a result of the varied switching frequency from test B-e1 (see Figure 4(d1,d2)) to B-e2 (see Figure 4(f1,f2)) can be determined. The evaluation of the material contact ratio curves of test series C cannot be clearly assigned to a purely mechanical or electrical load as a result of the severe surface damage occurring here in the form of pronounced material breakouts (pitting).
The tests with an increased lubricant temperature of 80 °C (A-m2, A-e4 and B-e3) should be emphasised separately. While the mechanical reference test showed no changes in the distribution of the profile height even at this temperature, the tests with additional electrical load resulted in a significant reduction in roughness. This is increased in comparison to the other electrically and mechanically loaded tests carried out in the respective test series. Accordingly, the tests with electrical load and increased temperature resulted in the greatest smoothing of the bearing raceway on the rotating ring. The stationary ring is also smoothed at elevated temperatures, but these changes are rather small compared to the rotating ring. This is also evident in a direct comparison with tests performed at an identical source voltage with a lubricant temperature of 40 °C. Here, in test A-e1, there is a pronounced ripple formation, which did not occur when the lubricant film height was reduced by tempering the lubricant to 80 °C (test A-e4).

4.3. Acceleration Detection

Parallel vibration measurement proved to be a useful tool during the tests for recording the interaction between the electrical and mechanical load. The continuous recording of measured values allows strong changes in the contact partners to be limited in time, which is not possible with the surface examination based on measurements at the start and end of the test.
As part of the vibration analysis that follows the vibration measurement or is carried out in parallel, the order spectrum is formed from the measured vibrations. The magnitude of the amplitude is represented as a multiple of the excitation frequency (speed) of the so-called order. The representation above the order allows the identification of characteristic multiples of the excitation frequency and an analysis of the measured vibrations. Figure 5 shows the temporal development of the acceleration amplitude over the order to investigate the operating behaviour over the test time. A proven tool for converting the measurement data recorded at the acceleration sensor into an order spectrum is the Fourier transformation, which is also used here. The order spectrum is formed and stored over a vibration measurement interval of 20 min. This means that the temporal change in the order spectrum is also available via the measurement of the endurance test, which is also mapped. To analyse the order spectrum, the characteristic frequencies of the test specimen must be known. In particular, the kinematic conditions of the thrust bearing must be considered. Due to the identical raceway diameter of the stationary and rotating ring, it can be assumed that the cage rotates at approximately half the angular velocity of the driving ring. In addition, the rollover speed of the rolling elements is the multiple of the number of rolling elements multiplied by the speed of the cage. The frequency of the test fixture must also be taken into account. During the evaluation, it was shown that the design of the contact surface of the stationary ring (see Figure 1 pos. 7) has an influence on the vibrations of the test cell. The contact surface of the stationary ring is provided with eight recesses to facilitate the removal of the ring and increase the volume of the oil sump. These interruptions in the contact surface led to jumps in rigidity when the rolling elements rolled over the stationary ring. This results in periodic excitation, which is recognisable in the order spectrum. The position of these individual frequencies and details of their respective order are marked separately in Figure 5. In the evaluation, the continuous individual measurements are combined to form a three-dimensional temporal curve and displayed for each test. The respective test series were arranged one below the other to facilitate direct comparability in the respective load situation. Furthermore, recurring characteristic frequencies, such as the triple rollover frequency of the rolling element set fRolling Element or the multiples of the passing frequency of the rolling element set over the support surface fSupport Surface, were identified. The reason for the clear indication of the triple rollover frequency of the rolling element set is the way in which the test cell is connected to the four-ball apparatus. As a result of the manufacturing tolerances, the coaxiality of the drive unit to the test cell cannot be maintained exactly, resulting in a slight radial and angular offset of the two axes. These offsets are absorbed and compensated for by the centre point and the centring ball. As a result, however, the multiples of the first characteristic frequency of the bearing are excited more strongly and, therefore, appear more clearly in the order spectrum. In test A-e1, in contrast to all other endurance tests, not the triple but the double rolling element set frequency occurs. One possible explanation for this is a stochastic better coaxiality of the two axes of rotation, which is why there was a double excitation.
The occurrence of rollover frequencies with several multiples shows that the test cell has natural oscillations in the frequency range under consideration. In addition to the passing frequency of the rolling elements, including their multiples, frequency bands could also be determined that are caused by jumps in stiffness when rolling over the bearing surface of the stationary ring, which is provided with pockets. Irrespective of this, the occurrence of pronounced surface changes, such as the fluting in test A-e1 (see Figure 5e) or the bearing failure in test series C, could be localised in time by means of the changes in the order spectra. Minor surface changes such as fluting shading were also characterised by an increase in individual spectra but are more difficult to identify. Overall, vibration monitoring of mechanically and electrically loaded tests is a good complementary measurement method for localising individual phenomena over time and quantifying their effects.

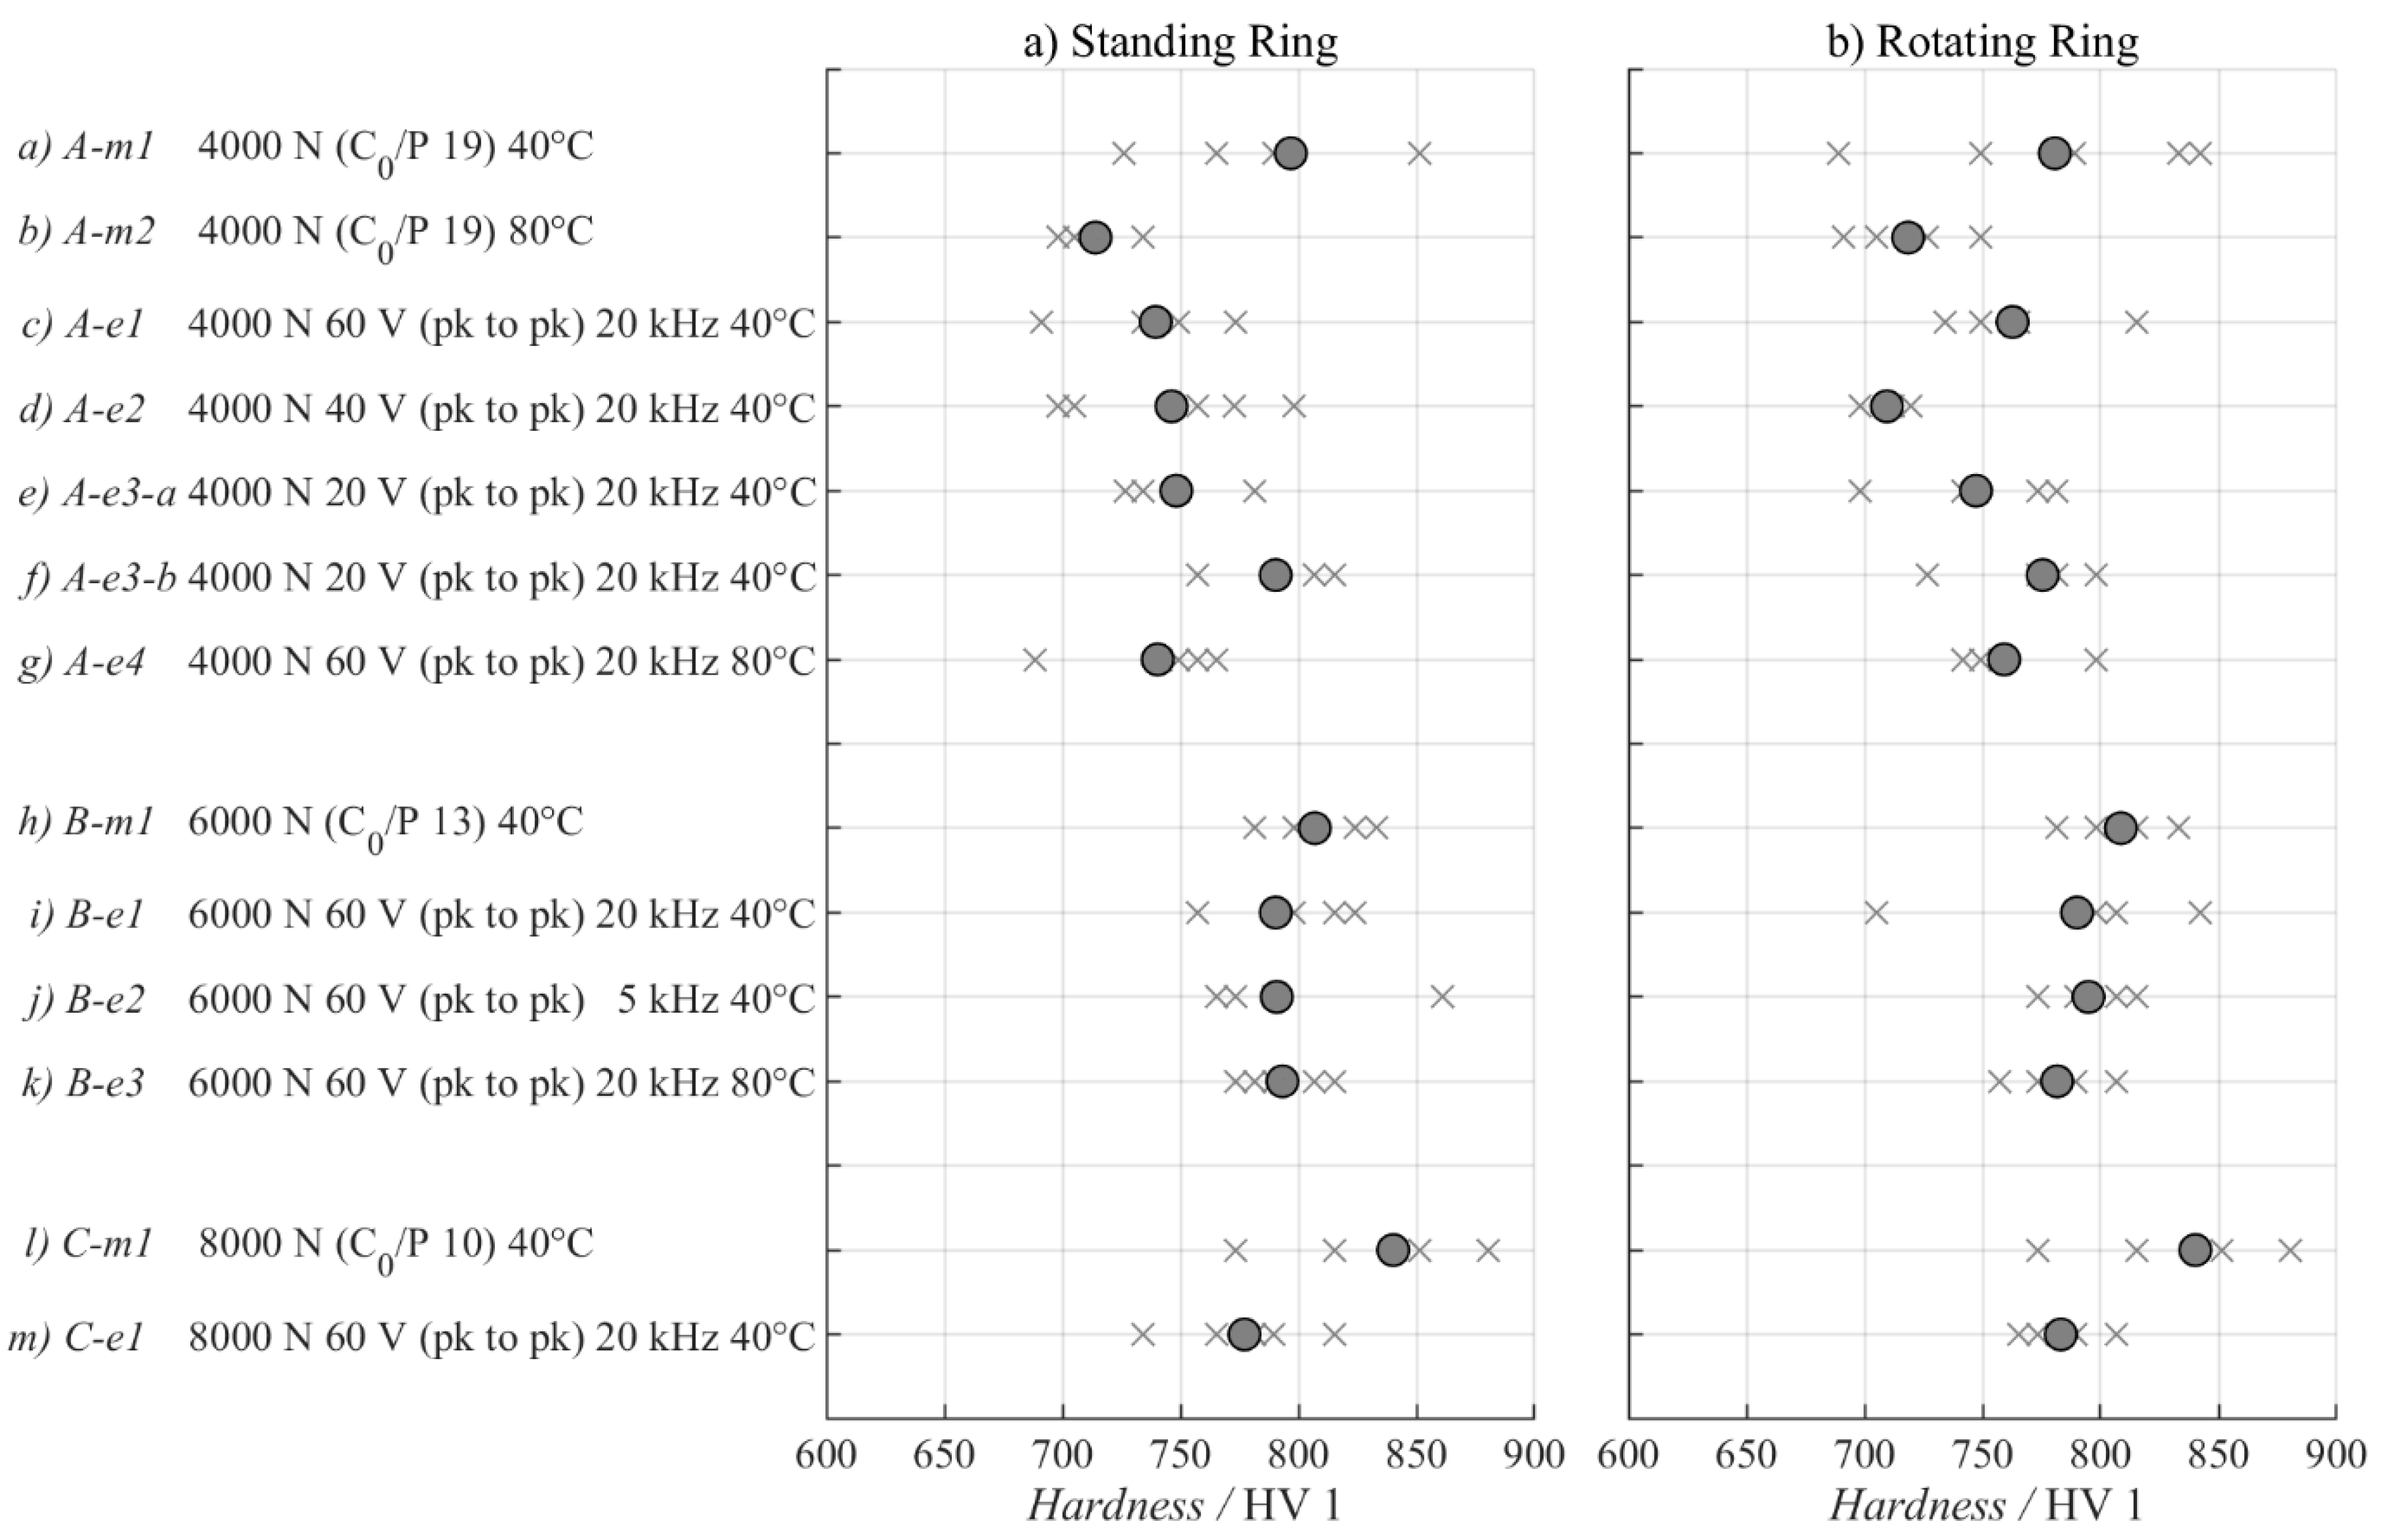
4.4. Light Load Hardness

The results of the five individual measurements and the resulting mean value are visualised in Figure 6 and listed in Table 3. It should be noted that in test A-e1, in which corrugations occurred on the rotating ring, the small load hardness measurement was carried out differently. Five individual measurements were taken between the corrugations, and five further individual measurements were taken in the corrugation valley. These results are also listed in Table 3. For better comparability, Figure 6 shows only the small load hardnesses between the corrugations for this test.
Overall, the individual measurements in the respective tests show a scatter of around 100 degrees of hardness (<15% of the average hardness). Due to the nature of the test using a minimum load, scattering of this magnitude is to be expected and is, therefore, not particularly conspicuous. Furthermore, it can be seen that as the contact force increases in the individual test series, the hardness increases. This behaviour is independent of whether an additional electrical load is present or a purely mechanical reference test was carried out. This effect can be explained by the greater plasticisation of the surface roughness because of the increase in contact pressure (see Section 4.2). This means that a larger proportion of roughness peaks are plasticised and compacted, which is accompanied by a corresponding increase in hardness. Figure 6 shows that the average light load hardness of the bearing raceways is reduced compared to the mechanical reference when an additional electrical load is applied. This behaviour can be observed in all three test series. One exception is the mechanical reference test A-m2 (Figure 6b), which was carried out with an increased lubricant temperature of 80 °C. Here, the hardness is lower than in the other tests. Overall, however, these deviations or reductions in hardness under additional electrical stress are within the scatter of the mechanical tests and, therefore, not so clear that a compelling correlation can be recognised. Further tests need to be carried out in order to obtain the necessary statistical validation.
However, there is a clear difference between the hardness in the corrugated valley and between the corrugations. This is reduced by an average of 80 degrees of hardness in the fluting valley compared to the raceway hardness. This may be due to the changed material structure or the changed topography of the surface (see also Figure 4(e1)). A pronounced sponge structure can be seen in the riffle valley, while the raceway was electrically smoothed in the areas in between.
Overall, the influence of the electrical load on the near-surface hardness cannot yet be conclusively determined from this series of tests. However, it seems appropriate to investigate this parameter in the future.

4.5. Wear Weight

Table 4 summarises the weights of the two bearing rings and the rolling element, including the cage, before and after the tests. Only minimal changes in the single-digit milligram range were observed between the measurements; no correlation with the current flow can be recognised. It should also be noted that even in test A-e1, despite the pronounced fluting, no detectable difference in weight could be recorded.

5. Discussion of the Findings

Based on the investigations conducted on the electrical load and its interaction with the changes occurring in the components due to current flow, the following partial conclusions and evaluations can be drawn.

5.1. Surface Topography—Significant

The use of a topographical measurement (in this case by means of a confocal microscope) of the surface shows a decisive added value in the classification of the change in surface roughness as a result of an electrical load. The comparison of the Abbott–Firestone curves of the running-in phase with those of the loading phase clearly shows the influence of the electrical–mechanical load (see Figure 4). The comparison with the mechanical reference tests, in particular, once again shows the significant influence of the additional electrical load. Based on the evaluation of the surface characteristics, it appears advisable in the context of the present tests to use the surface parameters of the reduced peak height (Spk) and the reduced valley height (Svk) to classify the effect of the electromechanical load on the surface topography.

5.2. Acceleration Analysis—Assisting Interpretation

With the help of the vibration analysis, the first occurrence of pronounced surface changes, such as the fluting in test A-e1 or the bearing failure in test series C, could be localised in time based on changes in the order spectra. It also confirms the smoothing observed in the surface examination, which is characterised by a decreasing amplitude of the vibrations. At the same time, localised track changes led to the formation of new bands, and the ripple shading observed in some tests manifested itself in a comparable form. By analysing the rollover frequencies, it was possible to determine that the test setup has vibrations in the evaluated frequency range during operation. In addition to the passing frequency of the bearing rings, including several multiples, frequency bands could also be determined that are caused by jumps in stiffness when rolling over the bearing surface of the stationary ring, which is fitted with pockets.
Furthermore, a possible cross-correlation between the occurring electrical load, the occurring surface topography and the temporal occurrence of individual vibration amplitudes in the order spectrum could be demonstrated.

5.3. Light Load Hardness—Further Research Necessary

As expected, the surface hardness of the bearing raceways also increases with an increase in contact pressure. This effect is due to the increasing compaction and plasticisation of the roughness peaks because of the increased contact force. It was also observed that the minimum hardness in the tests with additional electrical load was reduced by up to 5% compared to the mechanical reference tests. Due to the high scatter of the individual measurements, however, it is not possible to clearly determine whether this effect is a consequence of the electrical load or whether it is a statistical uncertainty. However, the significantly lower hardness in the centre of the corrugation (11% lower) than in the areas between the individual corrugations, where the initial raceway is still present, seems clear.
The extent to which the change in the topography of the surface or the increased thermal load on the material is the cause of this could not be conclusively clarified. However, the series of measurements suggests that the material change caused by the electrical load should be investigated in more detail.

5.4. Wear Mass—Possibly Too Short Test Duration

The results of the weight determination allow several possible interpretations; for example, the selected test time may not have been sufficient for detectable wear, or the temperature associated with the electrical load may have led to a forming process of the surface, which is why the roughnesses are only plastically deformed.

6. Conclusions

This study examined the effects of electrical loads on the surface topography and material properties of thrust ball bearings under various operating conditions. The results demonstrate that electrical loads can cause significant changes in surface roughness and hardness of the bearing raceways, leading to accelerated component damage. These findings highlight the need to consider electrical loads in the design of rolling bearings to avoid unexpected failures and over-dimensioning.
It is important to note that these results are based on a series of measurements that show the effects of current passage on metallic components under real load conditions. However, since only a limited number of tests were conducted, including a single repeat test, no statistically robust conclusions can be drawn regarding the correlation between surface changes and electrical load. Instead, the results illustrate more general effects induced by electrical influences.
In conclusion, it can be stated that, in addition to the precise analysis of the electrical loads and the vibrations developing over the test period, the changes in the surfaces of the contact partners are one of the most meaningful characteristics of the electromechanical loads. The influence of the electrical load on the light load hardness and wear could not be fully clarified within the scope of this article. The associated impact of these effects on the service life of the components will be the subject of future research.

Author Contributions

Conceptualization, S.G. and O.K.; methodology, S.G.; investigation, S.G.; writing—original draft preparation, S.G.; writing—review and editing, O.K. All authors have read and agreed to the published version of the manuscript.

Funding

This work was carried out within the framework of the projects “Model for determining the thermal stress of lubricants as a result of mechanical and electrical loads in rolling contact” (Project No. SA898/25-1/407468812) and “Determination of ball bearing impedances under steady-state operating conditions by means of a further developed rolling contact model at full film lubrication” (Project No. SA898/32-1/470273159). Both are financially supported by the Deutsche Forschungsgemeinschaft (DFG) e.V. (German Research Foundation).

Data Availability Statement

No new data were created or analyzed in this study.

Conflicts of Interest

The authors declare no conflict of interest.

References

  1. Ammann, C.; Reichert, K.; Joho, R.; Posedel, Z. Shaft voltages in generators with static excitation systems-problems and solution, Energy Conversion. IEEE Trans. 1988, 3, 409–419. [Google Scholar]
  2. Kerszenbaum, I. Shaft currents in electric machines fed by solid-state drives. In Proceedings of the 1992 IEEE Conference Record of the Industrial and Commercial Power Systems Technical Conference, Pittsburgh, PA, USA, 4–7 May 1992; pp. 71–79. [Google Scholar]
  3. Preisinger, G. Cause and Effect of Bearing Currents in Frequency Converter Driven Electrical Motor, Investigations of Electrical Properties of Rolling Bearings. Ph.D. Thesis, Technische Universität Wien, Vienna, Austria, 2002. [Google Scholar]
  4. Recker, C.; Weicker, M. Einfluss der elektrischen Schmierfettleitfähigkeit auf die Ausbildung von Lagerströmen bei umrichterbetriebenen 1.5 kW-Asynchronmotoren. In Proceedings of the 5th VDI-Fachkonferenz—Schadensmechanismen an Lagern, Aachen, Germany, 28–29 June 2022. [Google Scholar]
  5. Zika, T. Electric Discharge Damaging in Lubricated Rolling Contacts. Ph.D. Thesis, Technische Universität Wien, Vienna, Austria, 2010. [Google Scholar]
  6. Spikes, H.A. Triboelectrochemistry: Influence of Applied Electrical Potentials on Friction and Wear of Lubricated Contacts. Tribol. Lett. 2020, 68, 1–27. [Google Scholar] [CrossRef]
  7. García Tuero, A.; Rivera, N.; Rodríguez, E.; Fernández-González, A.; Viesca, J.L.; Hernandez Battez, A. Influence of Additives Concentration on the Electrical Properties and the Tribological Behaviour of Three Automatic Transmission Fluids. Lubricants 2022, 10, 276. [Google Scholar] [CrossRef]
  8. Durkin, W.; Fish, G.; Dura, R. Compositional Effects on the Electrical Properties of Greases. In Proceedings of the ELGI Eurogrease Q2, Hamburg, Germany, 22 March 2022. [Google Scholar]
  9. Erdemir, A.; Farfan-Cabrera, L.; Anderson, W.B. Comparative Tri Comparative Tribological Properties of Commercial Drivetrain Lubricants under Electrified Sliding Contact Conditions. In Proceedings of the 2nd STLE Tribology & Lubrication for E-Mobility Conference, San Antonio, TX, USA, 30 November–2 December 2022. [Google Scholar]
  10. Holweger, W.; Bobbio, L.; Mo, Z.; Fliege, J.; Goerlach, B.; Simon, B. A Validated Computational Study of Lubricants under White Etching Crack Conditions Exposed to Electrical Fields. Lubricants 2023, 11, 45. [Google Scholar] [CrossRef]
  11. Graf, S.; Sauer, B. Surface mutation of the bearing raceway during electrical current passage in mixed friction operation. Bear. World J. 2021, 5, 137–147. [Google Scholar]
  12. Schneider, V.; Stockbrügger, J.O.; Poll, G.; Ponick, B. Abschlussbericht FVA 863 I—Stromdurchgang am Wälzlager–Verhalten Stromführender Wälzlager; Forschungsvereinigung Antriebstechnik e.V.: Frankfurt, Germany, 2022. [Google Scholar]
  13. Tischmacher, H. Systemanalysen zur Elektrischen Belastung von Wälzlagern bei Umrichtergespeisten Elektromotoren. Ph.D. Thesis, Gottfried Wilhelm Leibniz University, Hannover, Germany, 2017. [Google Scholar]
  14. Kohaut, A. Riffelbildung in Wälzlagern infolge elektrischer Korrosion. Z. Für Angew. Phys. 1948, 1, 197–211. [Google Scholar]
  15. Capan, R.; Graf, S.; Koch, O.; Sauer, B.; Safdarzadeh, O.; Weicker, M.; Binder, A. Abschlussbericht FVA 650 III—Stromdurchgang in Wälzlagern—Untersuchung von Oberflächenveränderungen und Folgeschäden an Wälzoberflächen durch Stromdurchgang; Forschungsvereinigung Antriebstechnik e.V.: Frankfurt, Germany, 2024. [Google Scholar]
  16. Muetze, A. Bearing Currents in Inverter-Fed AC Motors; Shaker Verlag: Darmstadt, Germany, 2004. [Google Scholar]
  17. Gemeinder, Y. Lagerimpedanz und Lagerschädigung bei Umrichtergespeisten Antrieben. Ph.D. Thesis, Technische Universität Darmstadt, Darmstadt, Germany, 2016. [Google Scholar]
  18. Graf, S. Charakterisierung und Auswirkungen von Parasitären Lagerströmen in Mischreibung. Ph.D. Thesis, University of Kaiserslautern-Landau, Landau in der Pfalz, Germany, 2023. [Google Scholar]
  19. Kriese, M.; Wittek, E.; Gattermann, S.; Tischmacher, H.; Poll, G.; Ponick, B. Influence of bearing currents on the bearing lifetime for converter driven machines. In Proceedings of the 2012 XXth International Conference on Electrical Machines, Marseille, France, 2–5 September 2012; pp. 1735–1739. [Google Scholar] [CrossRef]
  20. Boyanton, H.E.; Hodges, G. Bearing fluting [motors]. IEEE Ind. Appl. Mag. 2002, 8, 53–57. [Google Scholar] [CrossRef]
  21. Bechev, D. Prüfmethodik zur Charakterisierung der Elektrischen Eigenschaften von Wälzlagerschmierstoffen. Ph.D. Thesis, Technische Universität Kaiserslautern, Kaiserslautern, Germany, 2020. [Google Scholar]
  22. Gonda, A.; Capan, R.; Bechev, D.; Sauer, B. The Influence of Lubricant Conductivity on Bearing Currents in the Case of Rolling Bearing Greases. Lubricants 2019, 7, 108. [Google Scholar] [CrossRef]
  23. Graf, S.; Capan, R.; Koch, O. Wechselwirkung von Tribologie und Elektrisch Induzierter Oberflächenmutation in Wälzlagern. In Proceedings of the 5th VDI-Fachkonferenz—Schadensmechanismen an Lagern, Aachen, Germany, 28–29 June 2022. [Google Scholar]
  24. Biswas, S.; Bose, S.C.; Bhave, S.K.; Pramila Bai, B.N.; Biswas, S.K. Study of corrugations in motor bearings. Tribol. Int. 1992, 25, 27–36. [Google Scholar] [CrossRef]
  25. Tsypkin, M. Induction motor condition monitoring: Vibration analysis technique—A practical implementation. In Proceedings of the 2011 IEEE International Electric Machines & Drives Conference (IEMDC), Niagara Falls, ON, Canada, 15–18 May 2011; pp. 406–411. [Google Scholar] [CrossRef]
  26. Zuercher, M.; Heinzler, V.; Schlücker, E.; Esmaeili, K.; Harvey, T.J.; Holweger, W.; Wang, L. Early failure detection for bearings in electrical environments. Int. J. Cond. Monit. 2018, 8, 24–29. [Google Scholar] [CrossRef]
  27. Hemati, A. A Case Study: Fluting Failure Analysis by Using Vibrations Analysis. J Fail. Anal. Preven. 2018, 19, 917–921. [Google Scholar] [CrossRef]
  28. Kudelina, K.; Asad, B.; Vaimann, T.; Belahcen, A.; Rassõlkin, A.; Kallaste, A.; Lukichev, D.V. Bearing Fault Analysis of BLDC Motor for Electric Scooter Application. Designs 2020, 4, 42. [Google Scholar] [CrossRef]
  29. Romanenko, A.; Mütze, A.; Ahola, J. Incipient Bearing Damage Monitoring of 940-h Variable Speed Drive System Operation. IEEE Trans. Energy Convers. 2017, 32, 99–110. [Google Scholar] [CrossRef]
  30. Ma, J.; Xue, Y.; Han, Q.; Li, X.; Yu, C. Motor Bearing Damage Induced by Bearing Current: A Review. Machines 2022, 10, 1167. [Google Scholar] [CrossRef]
  31. Didenko, T.; Pridemore, W.D. Electrical Fluting Failure of a Tri-Lobe Roller Bearing. J Fail. Anal. Preven. 2012, 12, 575–580. [Google Scholar] [CrossRef]
  32. He, F.; Xie, G.; Luo, J. Electrical bearing failures in electric vehicles. Friction 2020, 8, 4–28. [Google Scholar] [CrossRef]
  33. Becker, A.; Abanteriba, S. Electric discharge damage in aircraft propulsion bearings. Proc. Inst. Mech. Eng. Part J J. Eng. Tribol. 2014, 228, 104–113. [Google Scholar] [CrossRef]
  34. Ost, W.; De Baets, P. Failure analysis of the deep groove ball bearings of an electric motor. Eng. Fail. Anal. 2005, 12, 772–783. [Google Scholar] [CrossRef]
  35. Ghosh, B.; Cao, J.; Zhu, J. A Study on Heatsink Cooling Fan Lifetime Evaluation. In Proceedings of the 2023 Annual Reliability and Maintainability Symposium (RAMS), Orlando, FL, USA, 23–26 January 2023; pp. 1–5. [Google Scholar] [CrossRef]
  36. Graf, S.; Koch, O.; Sauer, B. Influence of Parasitic Electric Currents on an Exemplary Mineral-Oil-Based Lubricant and the Raceway Surfaces of Thrust Bearings. Lubricants 2023, 11, 313. [Google Scholar] [CrossRef]
  37. Hamrock, J.B.; Dowson, D. Isothermal elastohydrodynamic lubrication of point contacts III: Fully Flooded Results. J. Lubr. Technol. 1977, 99, 264–275. [Google Scholar] [CrossRef]
  38. Gonda, A.; Paulus, S.; Graf, S.; Koch, O.; Götz, S.; Sauer, B. Basic experimental and numerical investigations to improve the modeling of the electrical capacitance of rolling bearings. Tribol. Int. 2024, 193, 109354. [Google Scholar] [CrossRef]
  39. Abbott, E.; Firestone, F. Specifying Surface Quality—A Method Based on Accurate Measurement and Comparison. Mech. Eng. 1933, 55, 569–572. [Google Scholar]
  40. DIN-EN-ISO-25178-2; Geometrische Produktspezifikation (GPS)—Oberflächenbeschaffenheit: Flächenhaft—Teil 2: Begriffe und Oberflächen-Kenngrößen. Deutsches Institut für Normung (DIN): Berlin, Germany, 2012.
Figure 1. Sectional view of GESA (1 distributing ring/2 driving shaft/3 centring ball/4 shaft/5 housing/6 tested bearing/6a rotating ring/6b rolling element/6c stationary ring/7 bearing ring holder/A acceleration sensor) [36].
Lubricants 12 00303 g001
Figure 2. Surface measuring equipment: (a) confocal microscope with positioning stage on which the sample is placed; (b) sample holder with visualisation of possible measurement points [11].
Lubricants 12 00303 g002
Figure 3. Mean apparent bearing current density and mean bearing apparent power for the test series with visualisation of the critical load values in the measuring range (0.1 A/mm2) for test series -A (a) and -B (b).
Lubricants 12 00303 g003
Figure 4. Abbott–Firestone curves of the bearing raceways at the beginning and end of the endurance tests for different operating conditions.
Lubricants 12 00303 g004
Figure 5. Development of the order spectra (related to a rotation speed of 1000 rpm) over the test period.
Lubricants 12 00303 g005
Figure 6. Light load hardness measured on the (a) stationary and (b) rotating bearing ring after a loading phase of 168 h. Representation of the five individual measurements (×) and the respective mean value (∙) in accordance with Table 3.
Lubricants 12 00303 g006
Table 1. Boundary conditions specified at the test bench.
DesignationForce/NRotation Speed/rpmTemperature/°CCommon-Mode-Voltage/VppSwitching Frequency/kHz
A-m14000100040--
A-m280
A-e140001000406020
A-e24040
A-e3 *4020
A-e48060
B-m16000100040--
B-e160001000406020
B-e2405
B-e38020
C-m18000100040--
C-e180001000406020
* including retry with -a and -b denoted.
Table 2. Mechanical parameters at the test bench.
ParameterUnitTest Series ATest Series BTest Series C
Contact forceN400060008000
C0/P-191310
Hertzian pressureMPa149417101883
Single contact areamm20.270.350.43
Lubrication gap height *µm0.79 @40 °C0.76 @40 °C0.72 @40 °C
0.22 @80 °C0.21 @80 °C-
Specific lubrication gap-1.23 @40 °C1.19 @40 °C1.13 @40 °C
0.34 @80 °C0.33 @80 °C-
* according to [37].
Table 3. Results of the hardness measurements using Vickers microindentation for the stationary and rotating bearing rings of the bearing rings of the test bearings after the loading phase of 168 h.
DesignationLight Load Hardness @Standing Ring
(in HV 1)
Mean (Single Measurement)
Light Load Hardness @Rotating Ring
(in HV 1)
Mean (Single Measurement)
A-m1796.6 (765/851/851/726/790)780.4 (749/689/842/833/789)
A-m2713.8 (734/698/698/734/705)718.4 (705/691/720/749/727)
A-e1739.2 (749/749/734/691/773)762.4 (749/734/815/765/749)
A-e1 in fluting area 681.2 (665/678/652/720/691)
A-e2746.2 (773/698/798/705/757)709.6 (698/698/720/712/720)
A-e3-a748.0 (749/749/727/781/734)747.2 (773/781/742/742/698)
A-e3-b790.2 (757/815/757/815/807)775.4 (798/727/781/773/798)
A-e4740.2 (688/765/757/749/742)759.0 (742/749/798/749/757)
B-m1806.8 (798/798/781/824/833)808.4 (815/781/815/798/833)
B-e1790.2 (824/757/757/815/798)790.0 (842/798/705/798/807)
B-e2790.8 (765/861/773/790/765)795.0 (815/790/807/773/790)
B-e3793.2 (781/773/790/807/815)781.6 (781/773/790/757/807)
C-m1-840.0 (880/773/852/815/880)
C-e1777.0 (734/781/815/790/765)783.2 (765/790/781/773/807)
Table 4. Change in weight (in grams) after the loading phase of 168 h with comparison to the weights of the components after the run-in phase.
DesignationMass after Run-In/g
(Figure 1—6a/6b/6c)
Mass after Load Phase/g
(Figure 1—6a/6b/6c)
Delta/g
(Figure 1—6a/6b/6c)
A-m189.413/76.958/83.48689.411/76.937/83.486−0.002/−0.021/0.001
A-m2---
A-e188.846/76.935/83.81788.847/76.905/83.8180.001/−0.030/0.001
A-e289,221/76,828/83,45389,219/76,760/83,455−0.002/−0.068/0.002
A-e3-a---
A-e3-b89,317/76,525/83,71889,317/76,477/83,7190.001/−0.047/0.001
A-e4---
B-m188,751/76,331/83,35088,750/76,328/83,351−0.001/−0.003/0.001
B-e1---
B-e289,512/76,924/83,81489,510/76,872/83,810−0.002/−0.052/−0.004
B-e389,938/76,804/83,50289,934/76,810/83,495−0.004/0.007/−0.006
C-m189,380/76,408/83,61489,380/76,380/83,619−0.001/−0.028/0.005
C-e188,916/77,009/83,42988,916/76,971/83,4310.000/−0.038/0.002
Disclaimer/Publisher’s Note: The statements, opinions and data contained in all publications are solely those of the individual author(s) and contributor(s) and not of MDPI and/or the editor(s). MDPI and/or the editor(s) disclaim responsibility for any injury to people or property resulting from any ideas, methods, instructions or products referred to in the content.

