Abstract
Diamond-like carbon is one of the most studied and used solid lubricants on the market. Despite this large use and its outstanding mechanical and tribological properties, there are still some unclear aspects related to its self-lubricant properties, and some drawbacks in the deposition methods. We deposited “soft” DLC films on Si(100), iron, and stainless steel substrates by PVD magnetron sputtering technique with a Cr/CrN adhesive interlayer. The DLC films were characterized from a chemical, mechanical, and tribological point of view. Our aim was to connect the coating chemical and mechanical characteristics to the different conditions used for the deposition, such as discharge power and substrate–target distance. We found a stronger sp3 dependence on the discharge power for DLC deposited closer to the target. The tribological results did not depend on the chosen substrate–target distance, but rather on the hardness of the substrate. This could be ascribed to the better mechanical coupling of soft DLC films on harder substrates.
1. Introduction
In several industries, such as automotive and packaging, diamond-like carbon (DLC) films have become a winning choice for engineering and modification of mating surfaces because of their excellent tribological performances, such as low friction and high wear resistance [1,2,3]. Since carbon atoms are able to form a great variety of crystalline and disordered structures, carbon-based materials could provide a wide range of different properties [4,5]. Carbon atoms could arrange in three hybridization states, so these could form very different structures, such as graphite and diamond, characterized by 100% sp2 and 100% sp3 hybridization, respectively. Graphite is the thermodynamically preferred structure at room temperature (RT). Its structure consists in hexagonal basal planes with strong covalent in-plane bonds and weak van der Waals out-off-plane bonds justifying the low coefficient of friction (CoF) of graphite [6,7]. Conversely, diamond is organized in a tetrahedral structure, where each atom is covalent bonded to the other three. This ensures the highest hardness in nature, an extremely efficient thermal conductivity and an electrical insulator behavior [6,8,9]. The DLC structure lies in between the above-mentioned structures, as it shows a mixture of sp2 and sp3 hybridization, whose ratio determines the DLC properties as explained by the two-phase model [4,10,11,12,13]. This tunable phase allows the DLC film to obtain outstanding properties such as low friction coefficient, high mechanical hardness, good wear resistance, biocompatibility, chemical inertness, optical transparency in the infrared region, and an optical band gap up to a few eV [5,8,10,14,15]. DLC films characterized by a high C–C sp3 percentage (ta-C) are mainly used as protective coatings. In fact, the higher hardness reduces the possibilities of brittle fractures. The CoF value is mainly related to the hydrogen content and the test environment [16].
Different deposition techniques lead to DLC with manifold characteristics. The most common method based on gaseous hydrocarbons precursors is the plasma-enhanced chemical vapor deposition (PECVD), while those employing solid carbon targets are ion beam sputtering, laser ablation, cascade arc, and magnetron sputtering [8,17,18]. In particular, magnetron sputtering has been widely used for the preparation of DLC films, as it can be easily adapted to industrial applications. It does not require the use of toxic gases and it allows the growth of a homogeneous film on large areas with high deposition rates and a high forming quality [19,20]. Soft DLC films are mostly deposited by these systems with very little or no hydrogen content, which is an additional influencing parameter for the DLC coating properties [4,10,15,21,22]. According to the sub-plantation model, the sp2–sp3 ratio can be controlled by adjusting the impinging carbonaceous species energy [14,19,23]. The determination of the chemical composition and the structure of carbon-based materials is decisive, but the sp3 fraction estimation is especially challenging [4,23].
Depending on the physical, chemical, and mechanical situation at the contact point, the friction and wear are influenced by different phenomena, such as adhesion, shearing, and abrasion [15,24]. In particular, in soft coating, the shearing component could lead to the formation of a thin surface film partially responsible for the friction reduction [25,26]. There are many parameters influencing the tribological performances of DLC films. The most important are the hydrogen content in the coating and in the environment (humidity), the mechanical characteristics of the substrates, and the surface roughness of the counterparts [27,28,29]. The sliding induces different phenomena on the DLC film and on the counterpart, all contributing to the friction mechanism. Two main explanations for steady state low friction are the wear-induced graphitization [14] and the surface dangling bonds passivation done by the environmental hydrogen and OH groups [20,21,30]. For instance, a hydrogenated DLC coating shows very low CoF when tested in a high vacuum or with inert gases at about 0.001–0.01 [31]. The presence of moisture and oxygen affects the tribological performances of these films, increasing friction (CoF up to 0.3) [15,32]. On the other hand, hydrogen-free DLC coatings are associated with an opposite behavior, showing a lower friction in an inert atmosphere [33,34].
In most cases, only one of the sliders is covered with DLC, while on the counterpart a layer of mixed carbon-rich and metal oxides with low shear resistance, acting as a lubricant, is often transferred [27,35]. The transfer film acts as a third body in the tribological contact [36]. Scharf and Singer highlighted the importance of the transfer film for the self-lubricating properties of DLC coatings. The dynamic motion of the transfer layer could be explained using the velocity accommodation mode, either the shearing and extrusion of debris, or the interfacial sliding of wear particles, which may adhere to the counterface acting as a sacrificial layer [37,38,39].
The aim of the present research work is to link the mechanical and tribological properties of DLC with the related growth parameters. We decided to vary the distance between the substrate holder and the target aside with the DC supply power (100 W, 200 W, and 500 W). For the tribological tests, we focused on the DLC films deposited at 500 W on metal substrates. At first, the tests concerned coated iron disks, considered as a model substrate due to its higher chemical simplicity. The stainless steel substrate was then selected in view of possible technological applications, still keeping the substrate composition close to pure iron.
2. Materials and Methods
2.1. Materials
DLC coatings were deposited to a nominal thickness of 1–1.5 μm by DC magnetron sputtering technique using 4-in. graphite target (purity 99.99%). For the chemical analysis of the deposited DLC, we used Si(100) wafers as substrates, while for tribological tests we chose disks made of either AISI 304 stainless steel or iron (99.98% pure), whose hardness varied from 1.7 to 2.1 GPa and from 0.3 to 0.5 GPa, respectively. Before deposition, disks were all polished in order to obtain a 30 nm surface average roughness. The substrates were ultrasonically cleaned for 6 min in acetone followed by 6 min of ultrasonic cleaning in ethanol and dried with a compressed filtered airflow. We grew a Cr/CrN interlayer to improve the DLC coating adhesion to the substrates using the same deposition setup [40]. For the Cr layer, the RF magnetron sputtering technique was used (200 W RF discharge power), while reactive sputtering was employed to deposit a CrN film (200 W RF discharge power, 5 sccm N2 flow), for a total thickness of 200 nm. For the deposition phase, a base pressure of about 3 × 10⁻² mbar was achieved, filling the chamber with Ar gas (99.99% pure). To change the coating properties, two extreme positions of the substrate holder were chosen, corresponding to 18 and 6 cm gaps and labeled respectively as Zmax and Zmin. We highlighted a strong film thickness dependence on the radial distance from the target center, as can be seen in Appendix A. After the deposition, the coating roughness was checked via a mechanical profilometer (P-6 stylus KLA Tecnor equipped with a microhead 5XR) and the thickness of the film was estimated measuring the film step height of a semi-shield co-deposited Si(100) wafer. This was also used to test the chemical composition by means of X-ray photoelectron spectroscopy (XPS).
2.2. Methods
2.2.1. X-ray Photoelectron Spectroscopy
The equipment employed in this research consist of a hemispherical electron energy analyzer (PHOIBOS HSA3500 150, SPECS GmbH, Berlin, Germany). The X-ray source was the MgKα emission line (1253.6 eV). The survey scan, collected to identify elements present in the sample, was characterized by an energy resolution of 1 eV, while the high resolution scans of some selected peaks were obtained in order to determine a more comprehensive picture of the chemical composition (0.1 eV energy resolution, final spectrum as the sum of 15 spectra). The XPS measurements were limited to the surface analysis.
2.2.2. Raman Spectroscopy
Raman characterization of the DLC deposited on silicon substrates was performed using a commercial Jobin–Yvon microscope Raman LABRAM (HORIBA France SAS, Palaiseau, France), equipped with a He–Ne laser (632.81 nm, 20 mW). The laser spot size was about 4 µm wide, while we chose an accumulation time of 10 s. The wavenumber range investigated started from 200 cm−1 to end at 3000 cm−1.
2.2.3. Mechanical Tests
The hardness (H) was measured using a Berkovich indenter (Open Platform device, CSM Instruments SA, Graz, Austria) [23,41]. Hardness was computed from the loading–unloading curves using the Oliver–Pharr procedure [42]. Test conditions included an indenter approach speed about 3000 nm/min, an acquisition frequency of 45 Hz, and 15 s of holding at maximum load. The penetration depth never exceeded 10% of the total coating thickness, so substrate effects were negligible. Discontinuities observed in the load–displacement curve of the coated system indicate coating fractures occurring during loading [10,43].
The adhesion of the DLC coating was qualitatively determined by a scratch test, with a constant scratch length of 6 mm and the applied load linearly increased at a rate of 10 N/min (tip speed: 1 mm/min, force range: 20 mN–30 N). The instrument was equipped with a Rockwell C diamond tip of 200 μm of diameter. The normal loads at which appreciable coating damages appear are referred to as critical loads (Lc) [10,44]. The occurrence of lateral cracks is denoted as Lc1, lateral hollows as Lc2, central delamination as Lc3, and total delamination as Lc4 or Ldelam [45,46,47].
2.2.4. Tribological Tests
Tribological investigations of the deposited films were performed using a commercial tribometer UMT-2 in a ball-on-disk configuration mounting a lateral force sensor with a 0.05–5 N range, at a constant linear velocity of 0.1 m/s and a nominal load of 1 N. A precision spindle can rotate the lower specimen at speeds from 0.001 to 5000 rpm. The forces can be measured with a resolution of 0.05 N. As a counterpart to all tribological tests, a 100Cr6 ball (Ø = 4 mm, RMS ≈ 30 nm) was used. In this configuration, the initial Hertzian contact pressure is approximately 800 MPa. Tribological measurements were performed in different environments: humid air and dry nitrogen (purity of dry N2 = 5.0). A hygrometer, placed near the testing head, was used to estimate the relative humidity for the tests in humid air. In the last case, tests were performed in a smaller vessel saturated with dry nitrogen, in which a continuous flow of gas during tests was guaranteed. As said previously, the surfaces were analyzed by Raman spectroscopy inside and outside the wear tracks before and after the tests. The wear tracks and the counterpart ball were both observed via optical microscope, and the morphological alteration induced by sliding was tested via a profilometer. The disk-specific wear rate was deduced from the cross section of the wear track (S), the circumference length (d = 2πR), the applied load (L) and the number of cycles (n) as k = Sd/(Ln), whereas the specific wear rate of the counterpart ball was calculated by the observation of the ball wear average radius (a), used to evaluate the wear volume (V), together with the ball radius (r) and the total test length (l), kball = V/(Ll), where V = π/6 × (h2 + 3a2)h, and h = r − .
3. Results and Discussion
3.1. Chemical and Mechanical Characterization
The first chemical characterization of the surface of DLC films was realized via XPS. Specifically, XPS analyses were performed in order to obtain information on the DLC composition and to estimate the carbon hybridization state, to be compared to the results of Raman analysis. The obtained spectra of the C1s peak were fitted using multi pseudo-Voigt functions [48]. The peaks centered at 284.5 and 285.5 eV are assigned to the sp2 and sp3 hybridization states, respectively [19]. The last broad peak in the binding energy range of 286–289 eV is due to C–O (or C=O) bonds, but the C–O component at 286.5 eV is in general dominant [14,49]. The Raman spectra were collected for all possible combinations of the selected deposition parameters (discharge power and substrate–target distance) was summarized in Table 1.

Table 1.
XPS and Raman analyses of the DLC film deposited at various supply powers and for both substrate–target distances. Together with chemical characterization of the DLC films, the corresponding hardness values are displayed in the last column. The error on the element concentration via XPS is about 0.5%.
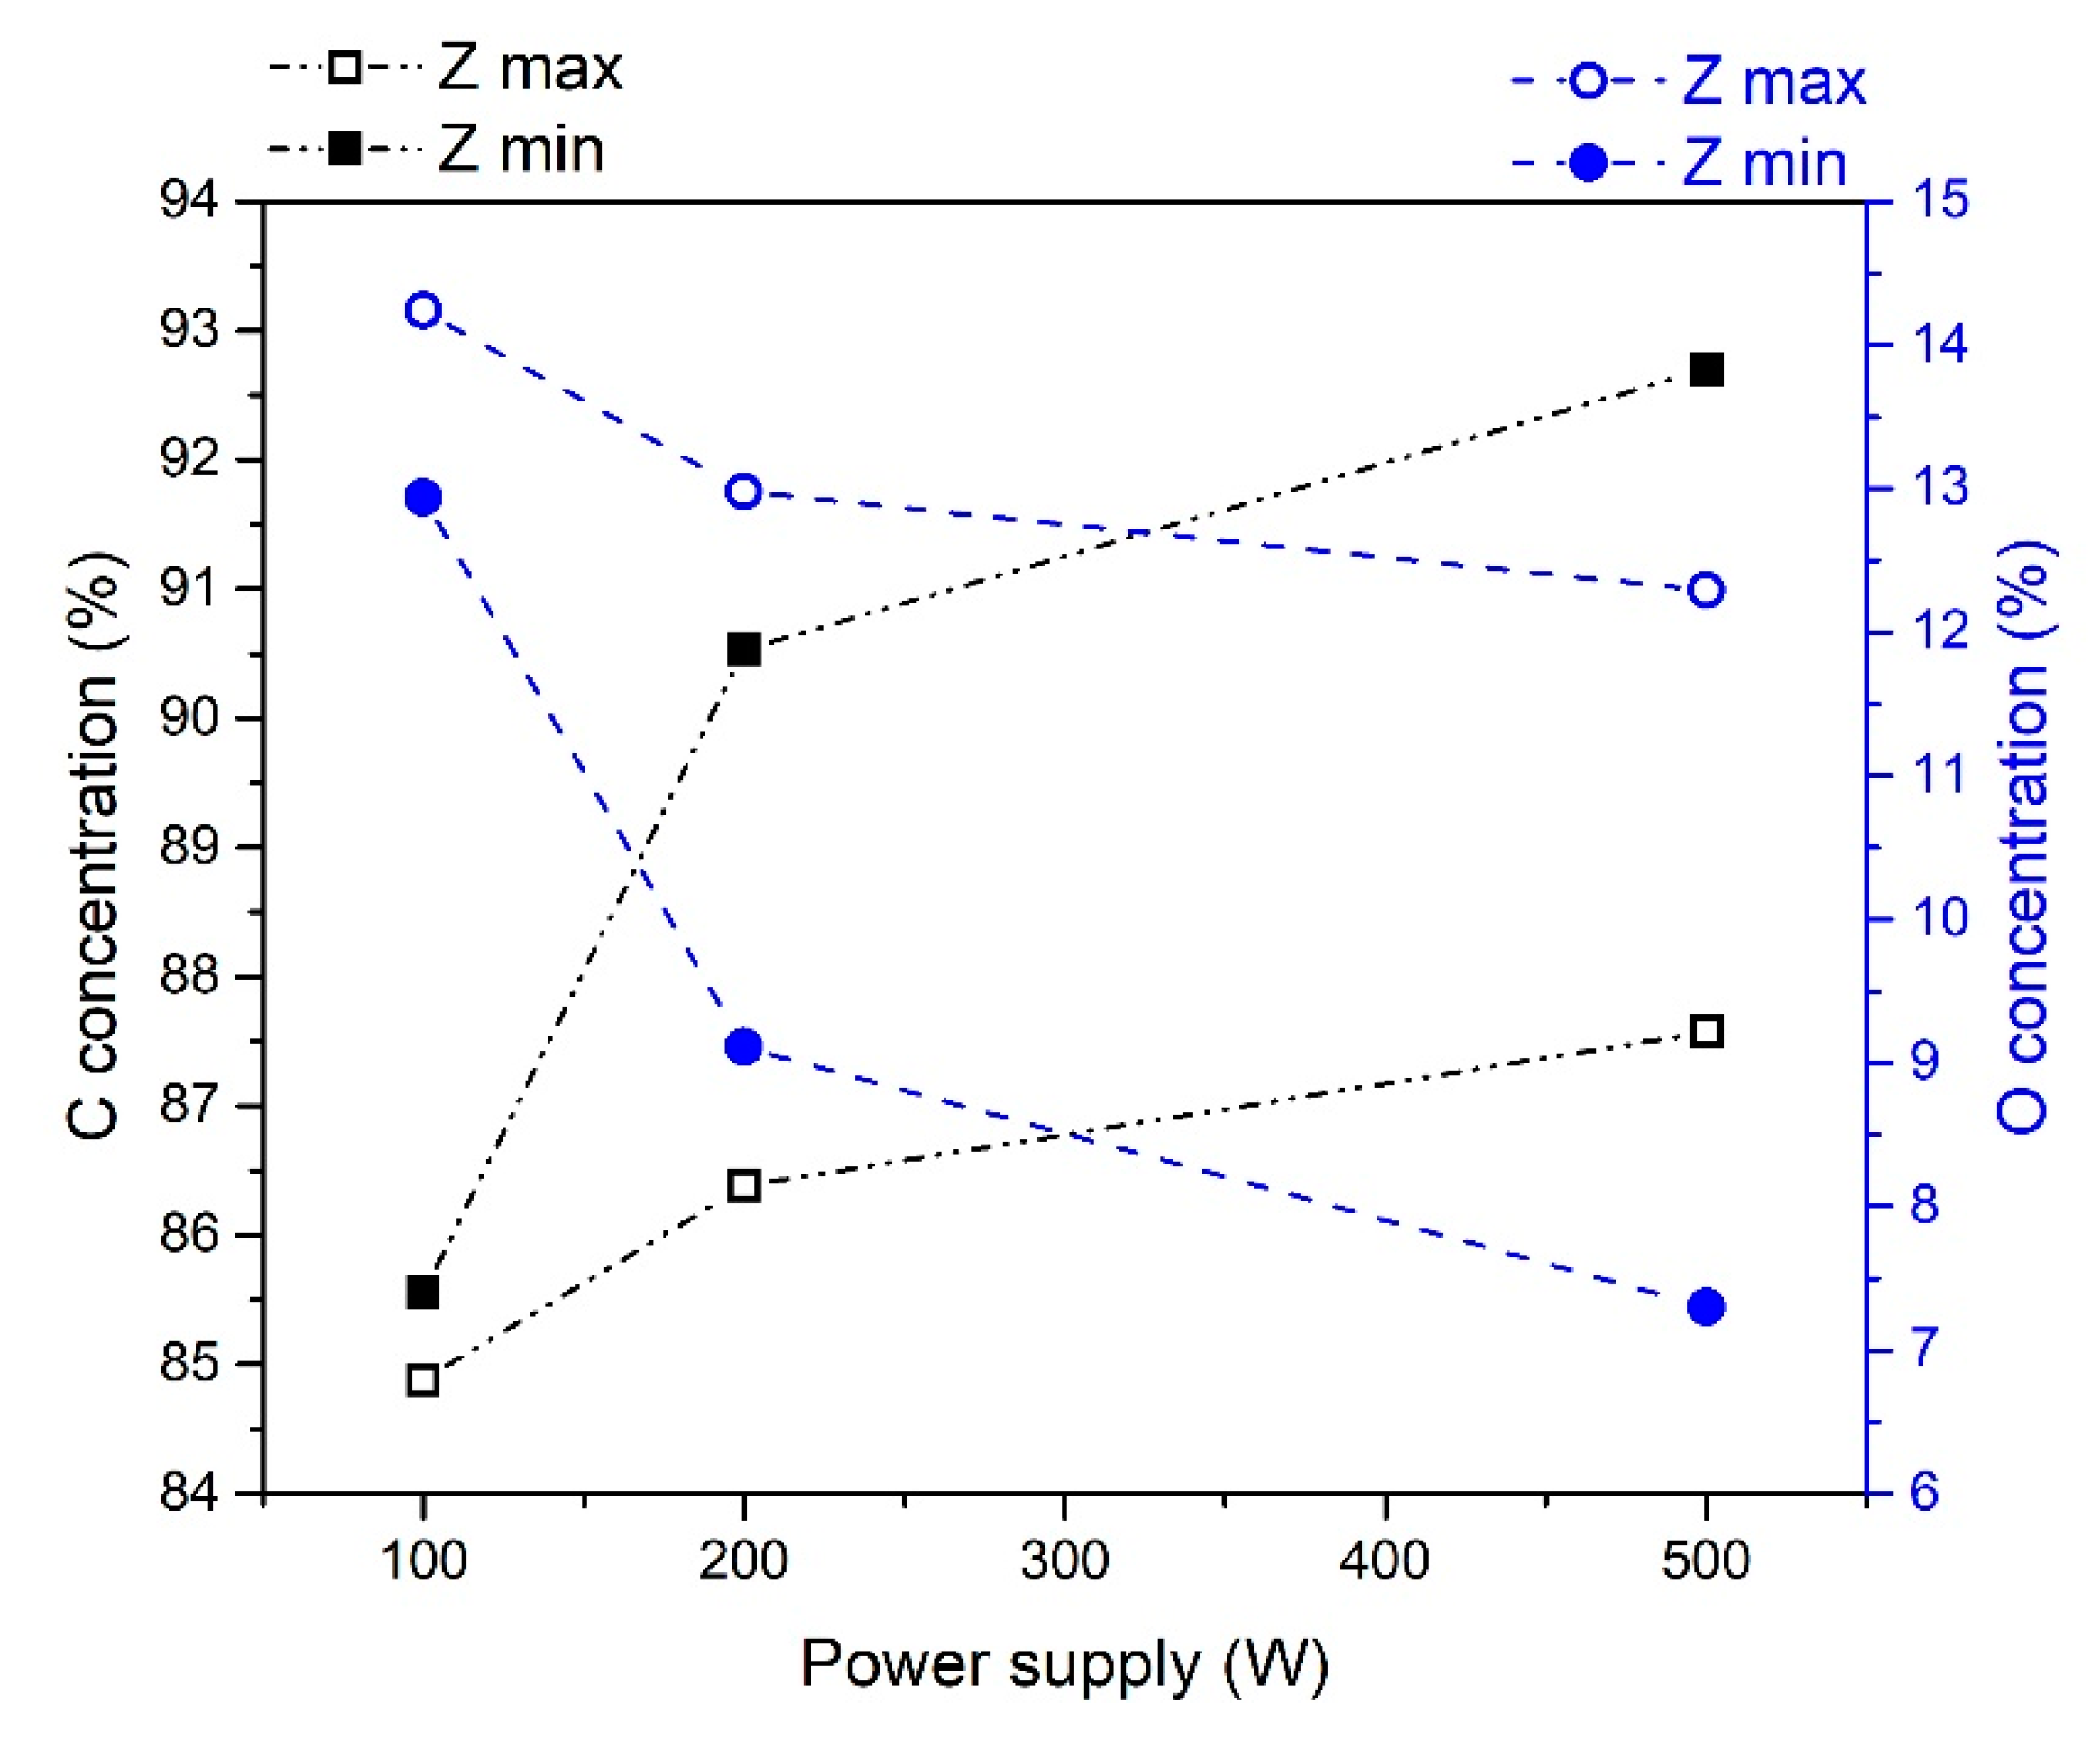
As reported in Figure 1, the carbon and oxygen concentration showed univocal trends with increasing discharge power. The oxygen content decreased, moving from 100 to 500 W, while the carbon content increased. The trend was analogous for the two vertical positions, even though the relation was more pronounced at Zmin. Similarly to the deposition rate radial inhomogeneity, the DLC chemical composition was more susceptible to the other deposition parameter changes if the substrate–target distance was minimal. In fact, the oxygen concentration reduction was about 44% for the Zmin group and ~14% for the Zmax group, while the carbon increase was about 8% and 3%, respectively.
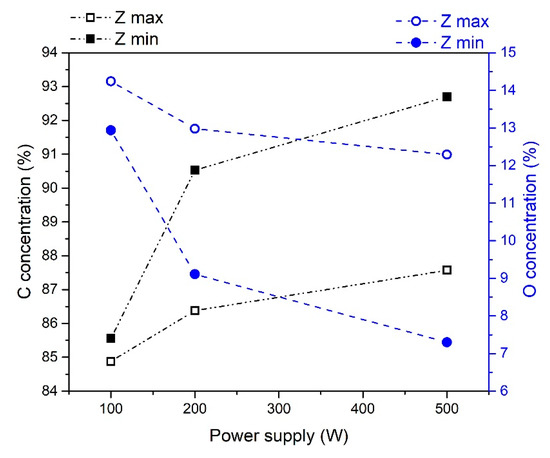
Figure 1.
Carbon (black squares) and oxygen (blue circles) concentration determined from XPS spectra of DLC deposited at different power supplies and substrate–target distances. The maximum distance corresponds to empty symbols, while the minimum distance corresponds to plain markers. The error on the element concentration via XPS is about 0.5%.
The sp3 content derived from the XPS analysis, reported in the fourth column of Table 1, seemed to increase for higher discharge power. The variation appeared to be stronger for DLC films deposited at Zmax and to lead to a saturation of the tetrahedral component for both substrate–target distances (figure not shown). However, this trend was in contrast with the results obtained with the indentation tests. This undesired aspect was probably due to the high oxygen concentration, due to the environmental contamination in the first layers, as the XPS apparatus was not equipped with a system to clean the first layers of the sample surface. As the oxygen content was relatively high, the sp3 fraction derived from the XPS analysis could not be considered reliable [50].
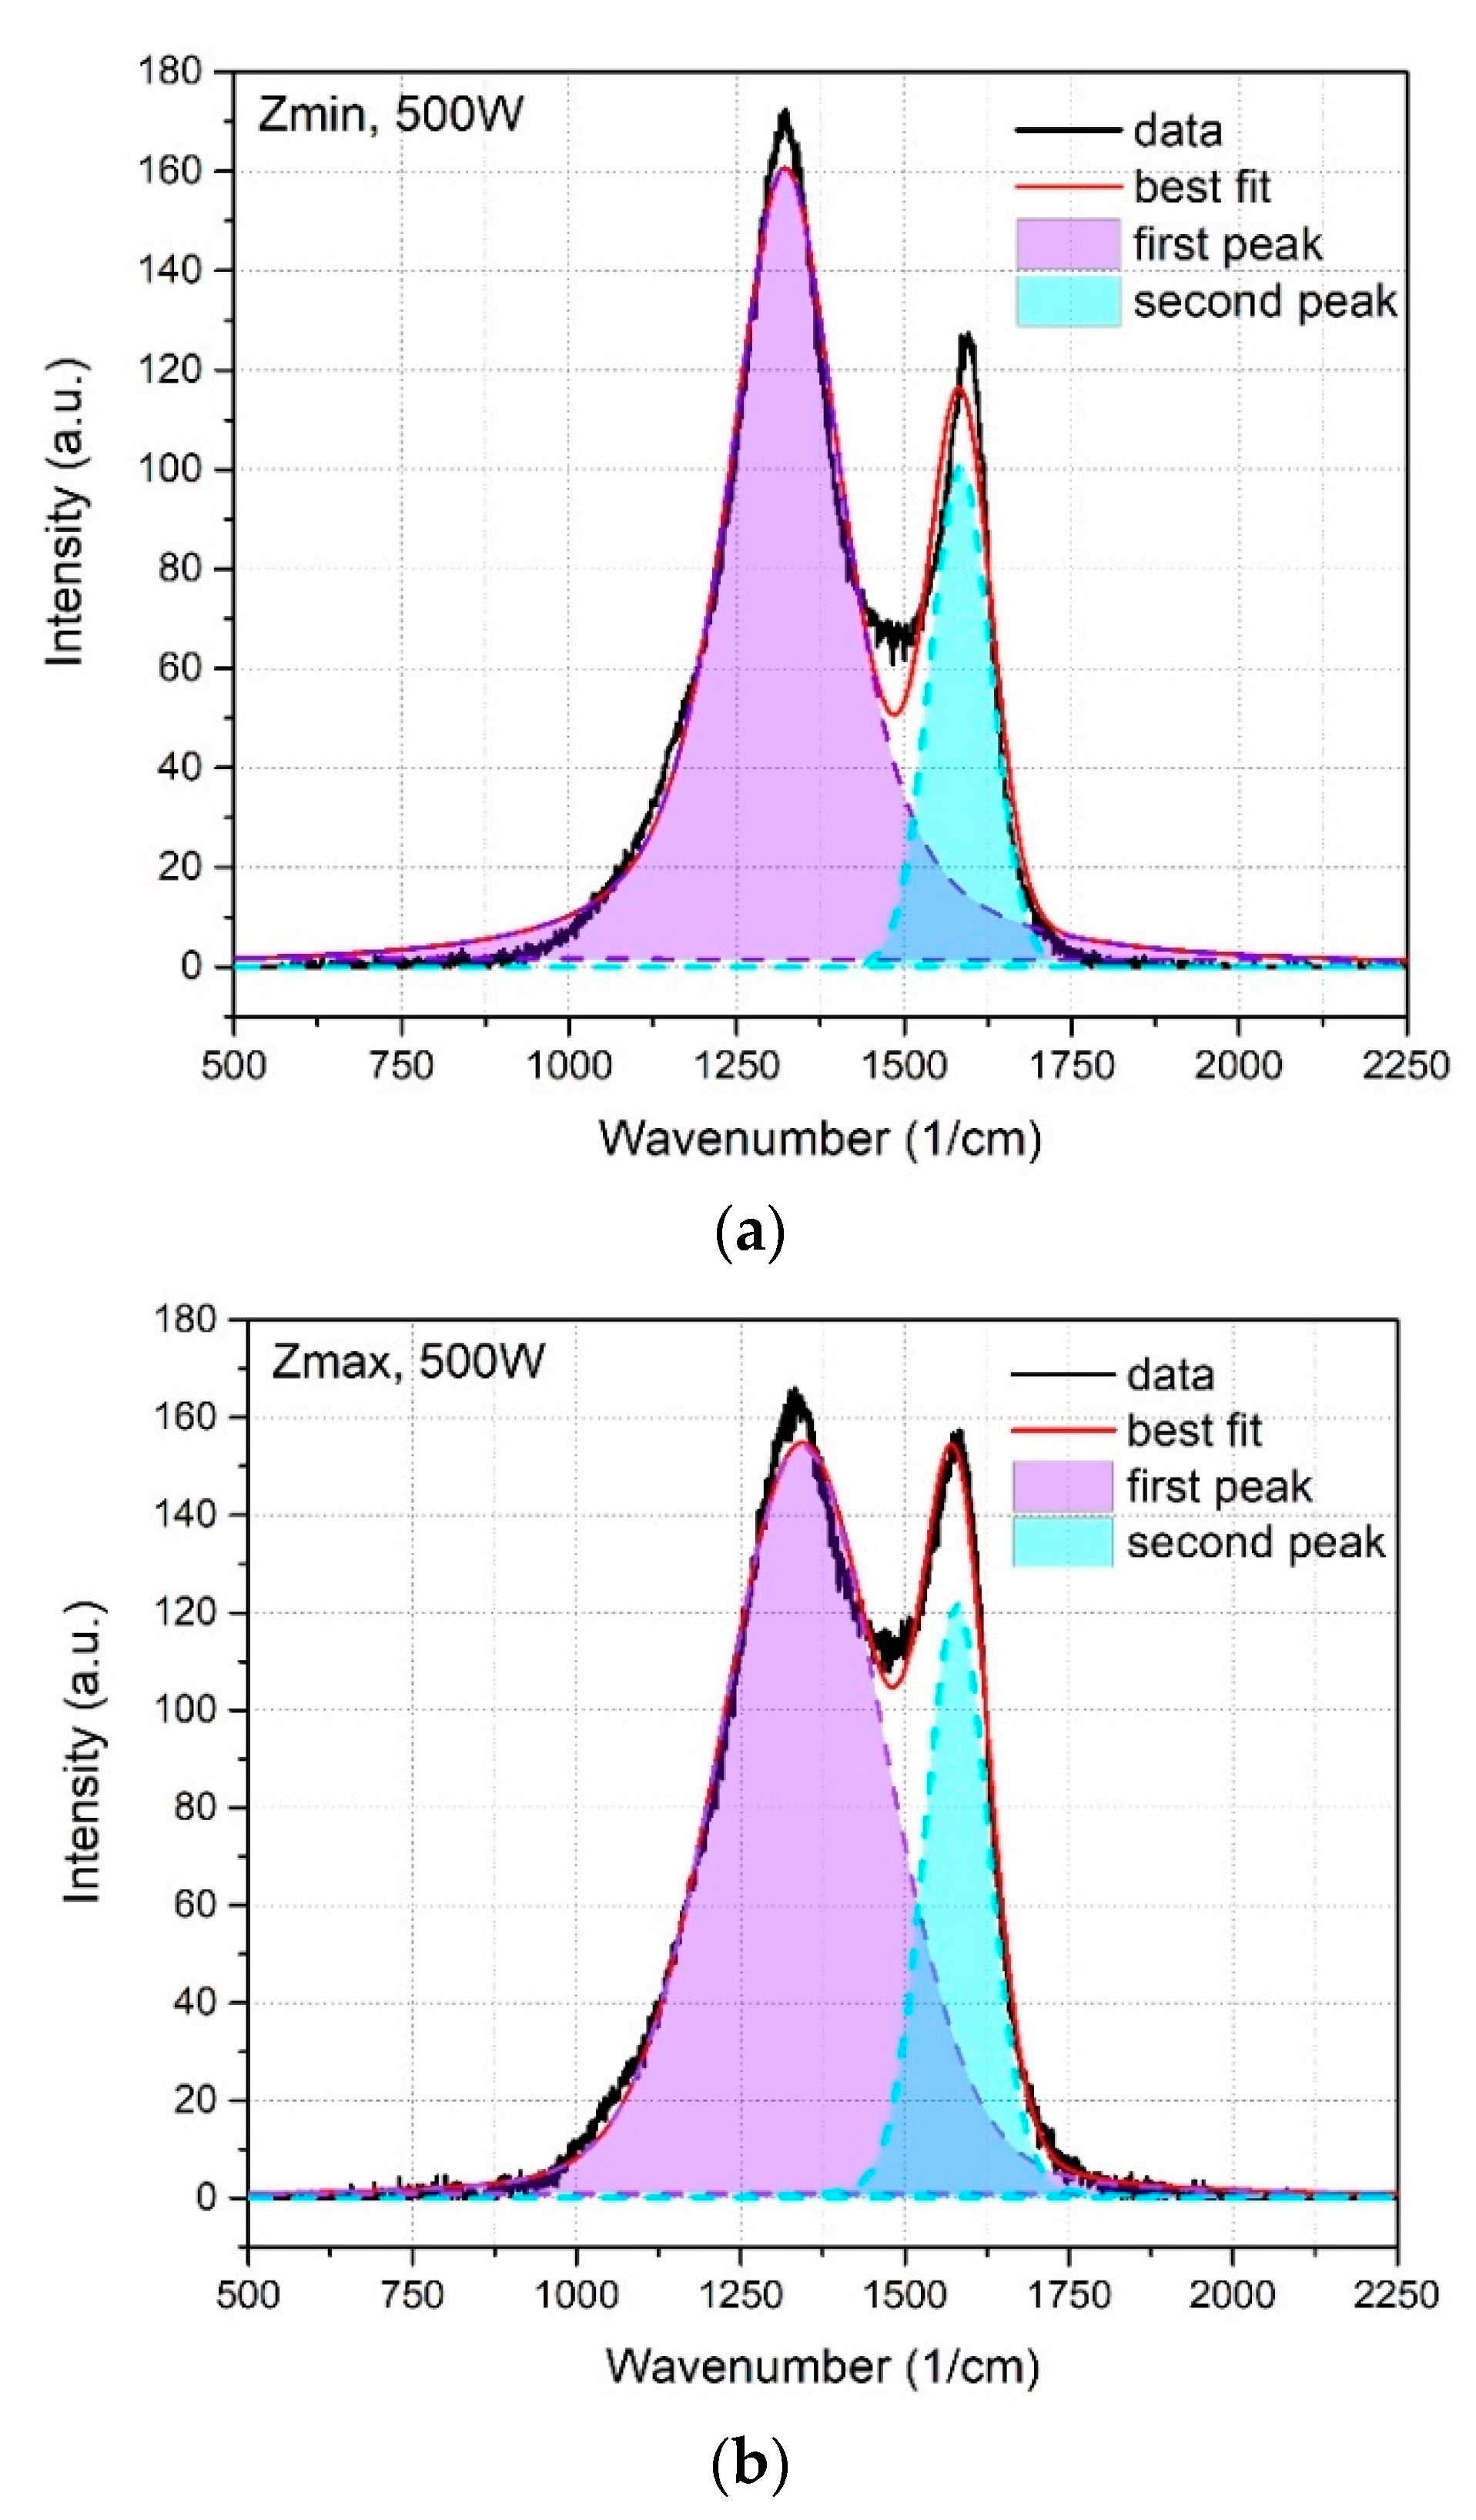
The Raman analysis was alternatively employed to provide an insight on the structural arrangement of the carbon atoms in the DLC coating. In fact, the Raman spectrum of DLC consists of two broad peaks around 1345–1355 cm−1 and 1570–1590 cm−1, the D and G bands respectively [14,17]. The D band is associated with the breathing modes of the sp2 atoms in rings, while the G band is due to the stretching vibrations of sp2 C–C bonds in both chains and rings. Raman spectroscopy employing visible sources has a higher cross section for the sp2 sites [17,22]. The I(D)–I(G) ratio, which usually ranges from 0.8 to 3.5, increases as the sp2 phase grows, so the sp3 content drops [12,14,41]. Two examples of Raman spectra are shown in Figure 2, where graph (a) refers to the DLC film deposited at 500 W and closer to the target (Zmin), while the spectrum in (b) belonged to the DLC coating realized at 500 W and at Zmax. Additional consideration derived from the Raman analysis are collected in Appendix B.
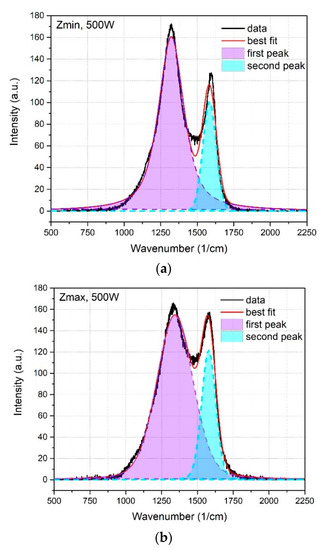
Figure 2.
Two examples of Raman spectra obtained for DLC films deposited by magnetron sputtering at 500 W for the minimum substrate–target distance (a) and the maximum ones (b). The original data correspond to the black line (without the background), while the total fit is presented in red and the curves for the single peak for band D and G using with dashed lines and colored areas violet and cyan, respectively.
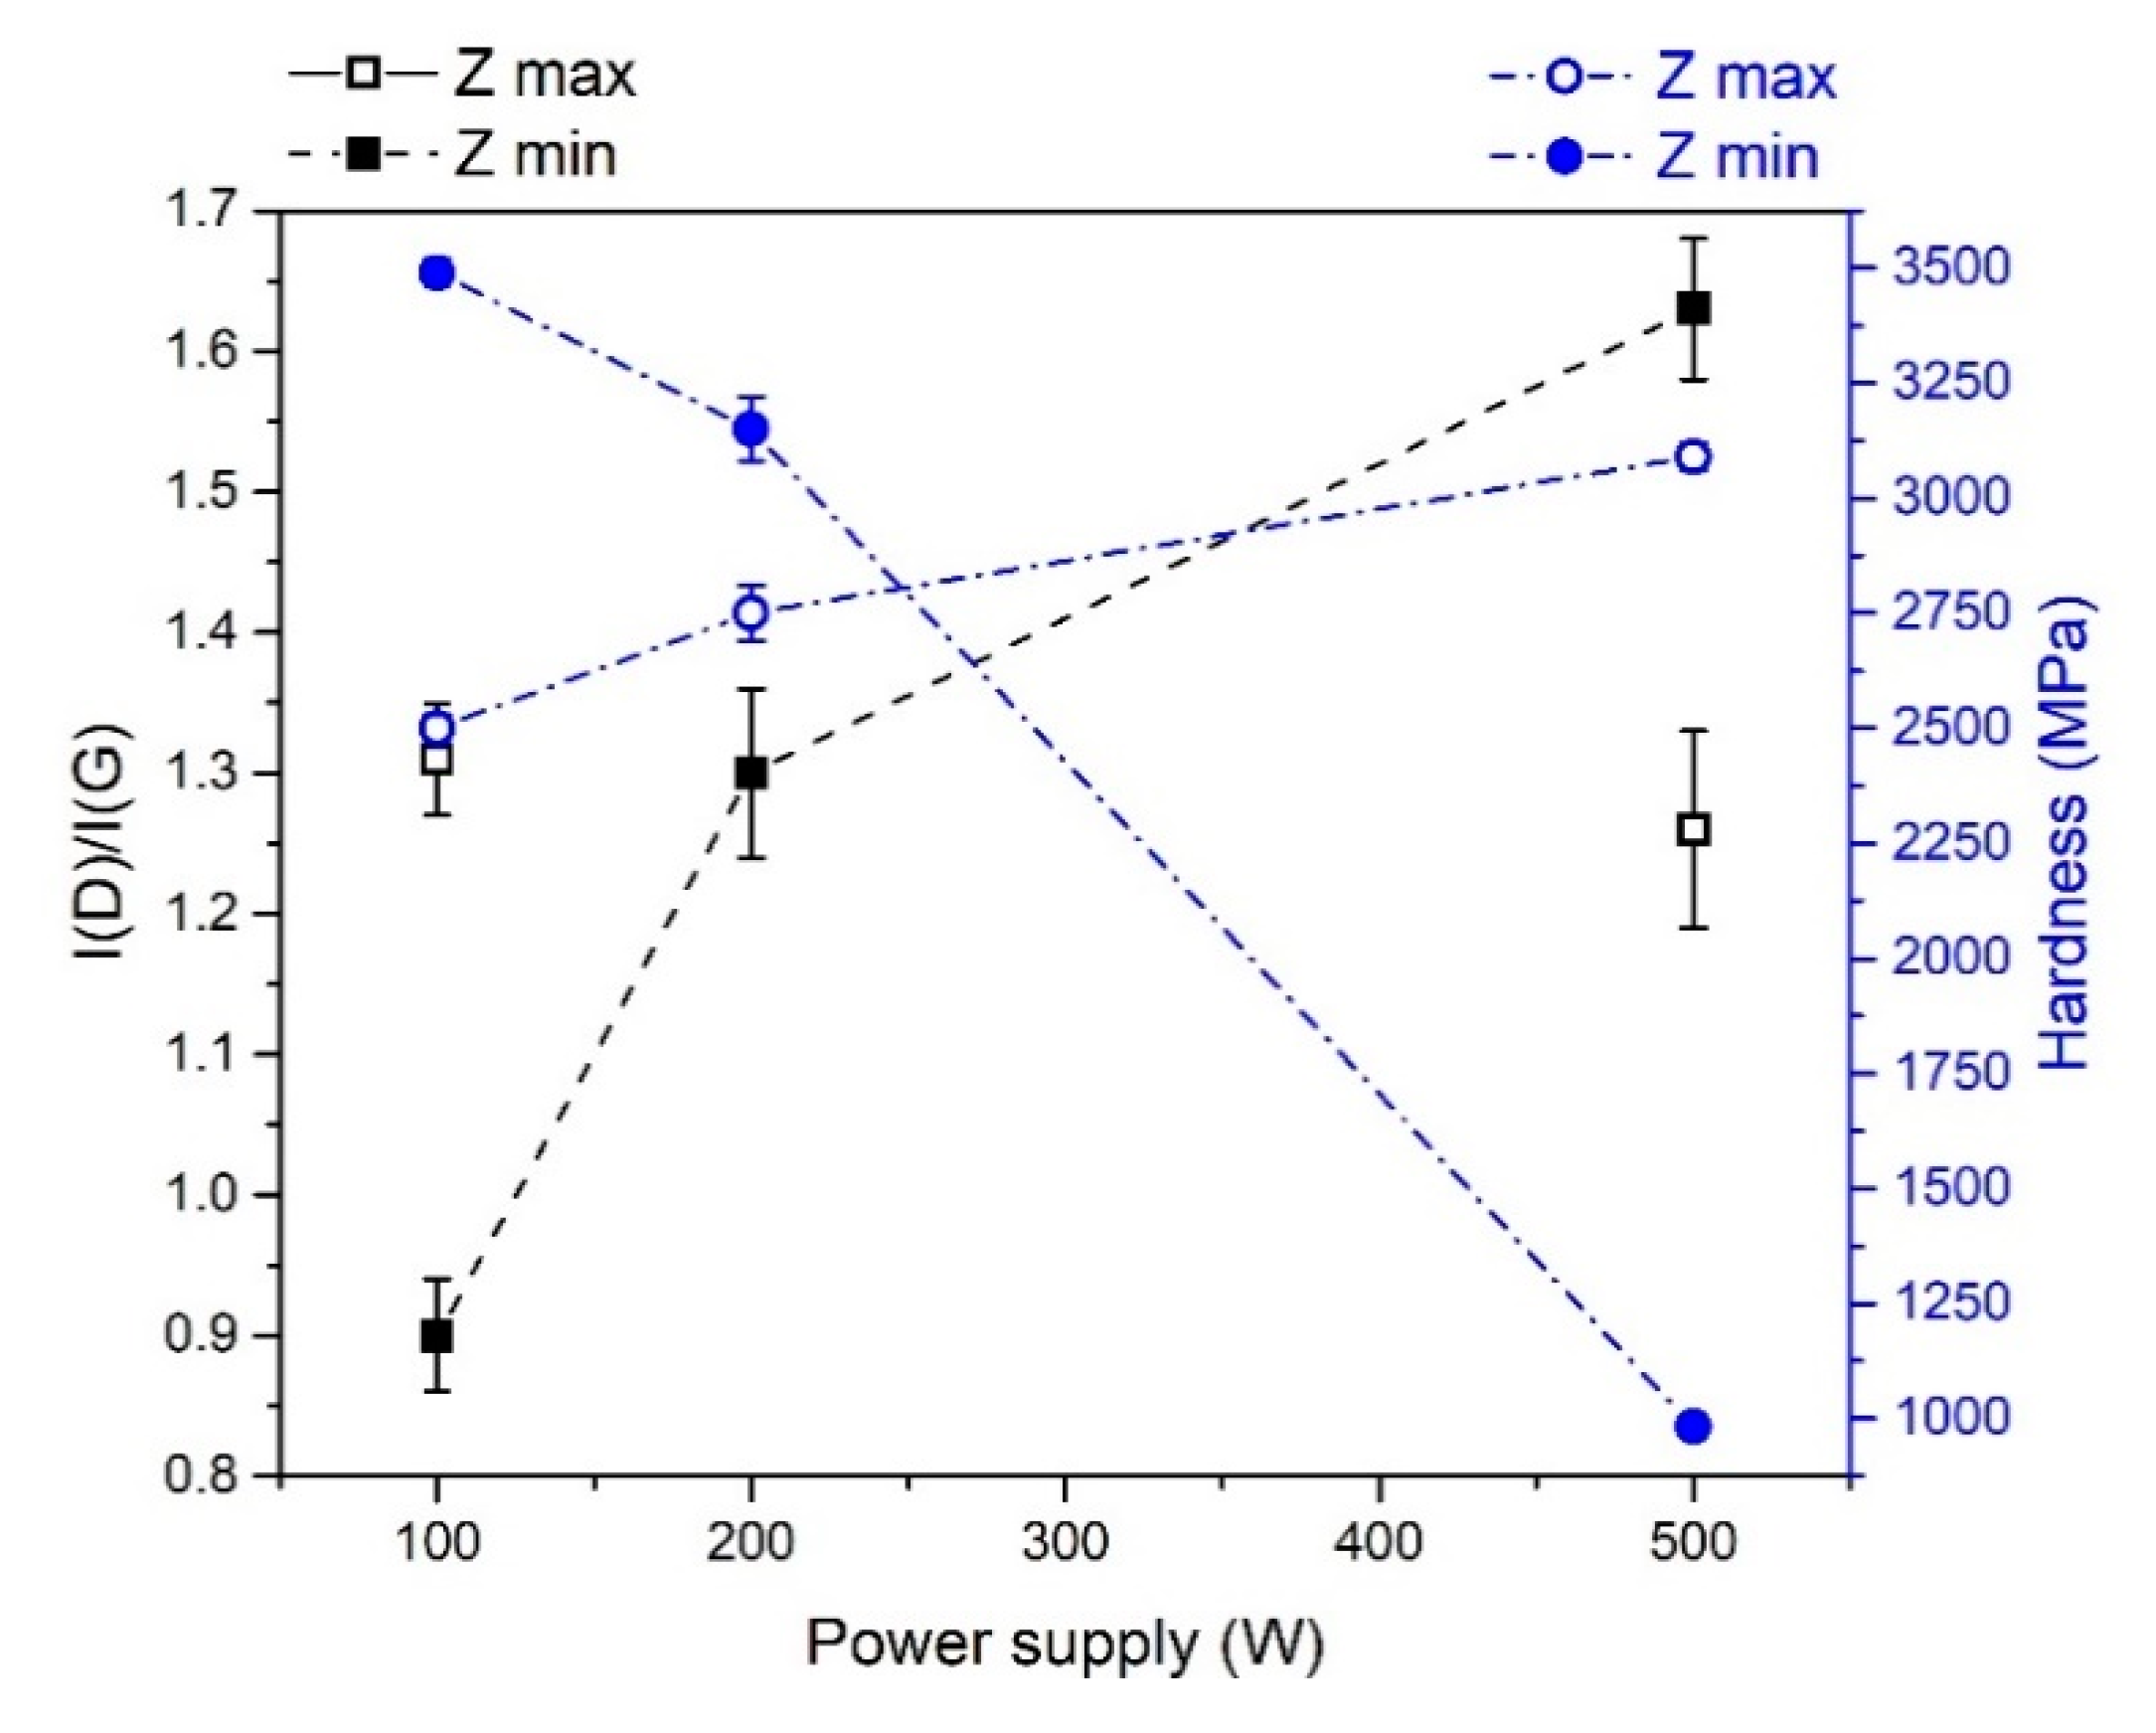
On the contrary, Raman analysis provided valuable information on the variation of the sp3 content as a function of the discharge power, as shown with black markers in Figure 3.
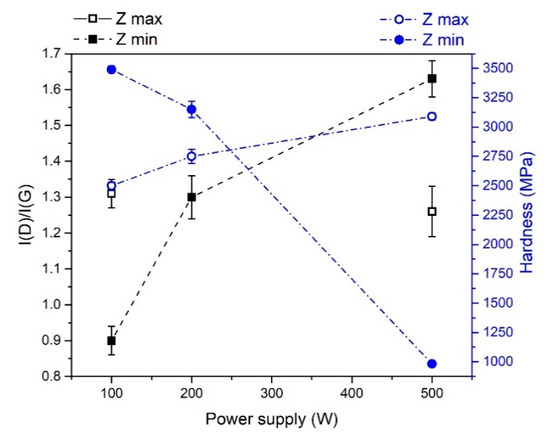
Figure 3.
In the graph, the Raman I(D)–I(G) ratio and the indentation hardness are reported in order to identify a trend in the sp3 content variation as a function of the discharge power. The I(D)–I(G) ratio is presented with black squares, while the hardness measurements are displayed with blue circles. The filled symbols refer to the DLC film deposited at Zmin, while the empty markers correspond to Zmax DLC.
The I(D)–I(G) ratio was almost insensitive to the power supply variation for the Zmax vertical geometry, in agreement with the slight change in film composition determined via XPS. On the other hand, at Zmin the I(D)/I(G) increase was considerable, as it varied from 0.9 to 1.63. This showed that a higher power supply would lead to a more graphitic DLC, as corroborated by the hardness measurement also shown in Figure 2 with blue squares. This could be explained by an excess of energy of the incident carbon atoms, which caused a graphitization of the coating according to the subplantation model [51]. Concerning the hardness of DLC films deposited at Zmax (empty blue circles in Figure 3), its trend had a slight dependence on the discharge power, showing a minimal increase. On the one hand, this agrees with the negligible variation of the I(D)–I(G) ratio with the power supply. On the other hand, according to the subplantation model, the increase in the discharge power, keeping the maximum substrate–target distance, would optimize the incident ion energy enhancing the sp3 content in the film and its hardness [15].
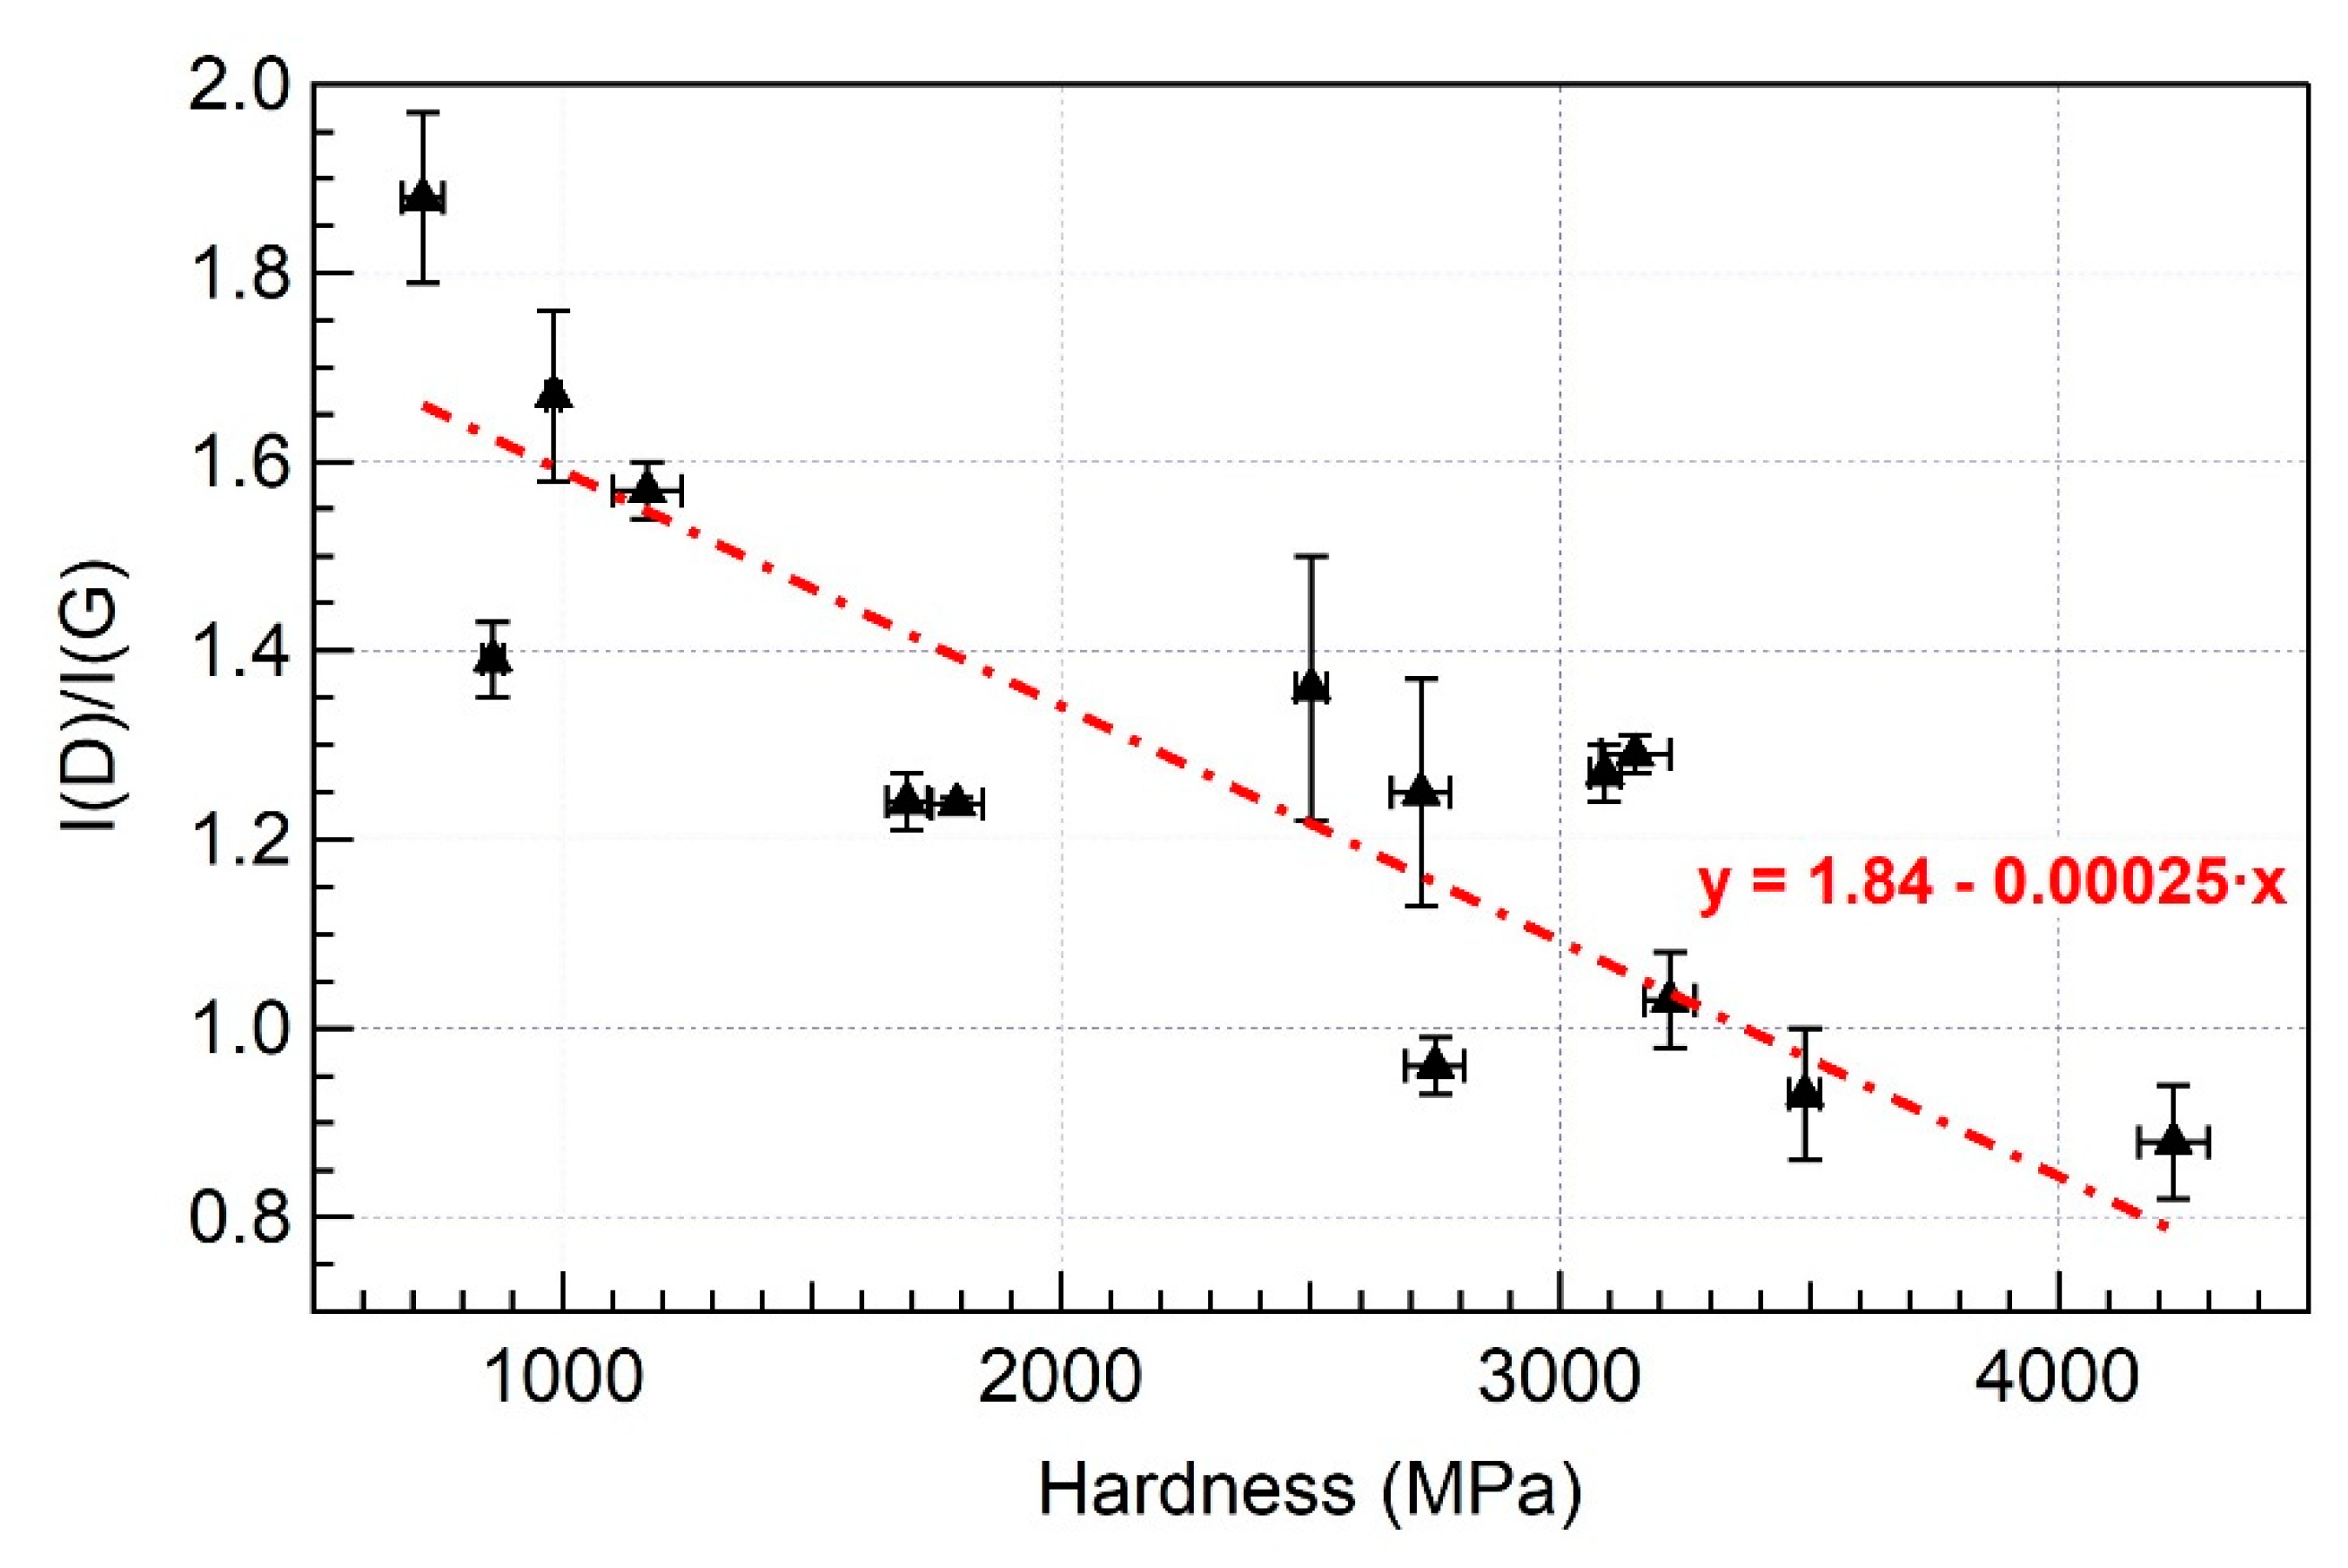
The robust agreement between the decrease of the I(D)–I(G) ratio with increasing DLC hardness, displayed in Figure 4, supported the decision to discard the sp3 concentration determined by XPS analysis in favor of the trend derived by Raman spectroscopy.
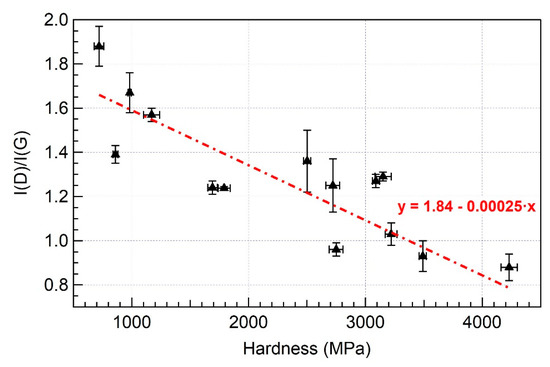
Figure 4.
The I(D)–I(G) ratio of DLC films deposited at various deposition conditions is presented as a function of their hardness. Data refer to both substrate–target distances. The linear relation linking the decrease of the I(D)–I(G) ratio with the increasing DLC hardness is highlighted with a dashed red line.
A linear relation linked the decrease of the I(D)–I(G) ratio with the increasing DLC hardness, as clarified with the red dashed fit in the graph. All the measurements presented before concern DLC films deposited on silicon substrates, both for the chemical characterization and the hardness measurements. The determined hardness was valid independently from the substrate. It is worth noting that the hardness values found were a few MPa, suggesting a graphite-like nature of the deposited films [15].
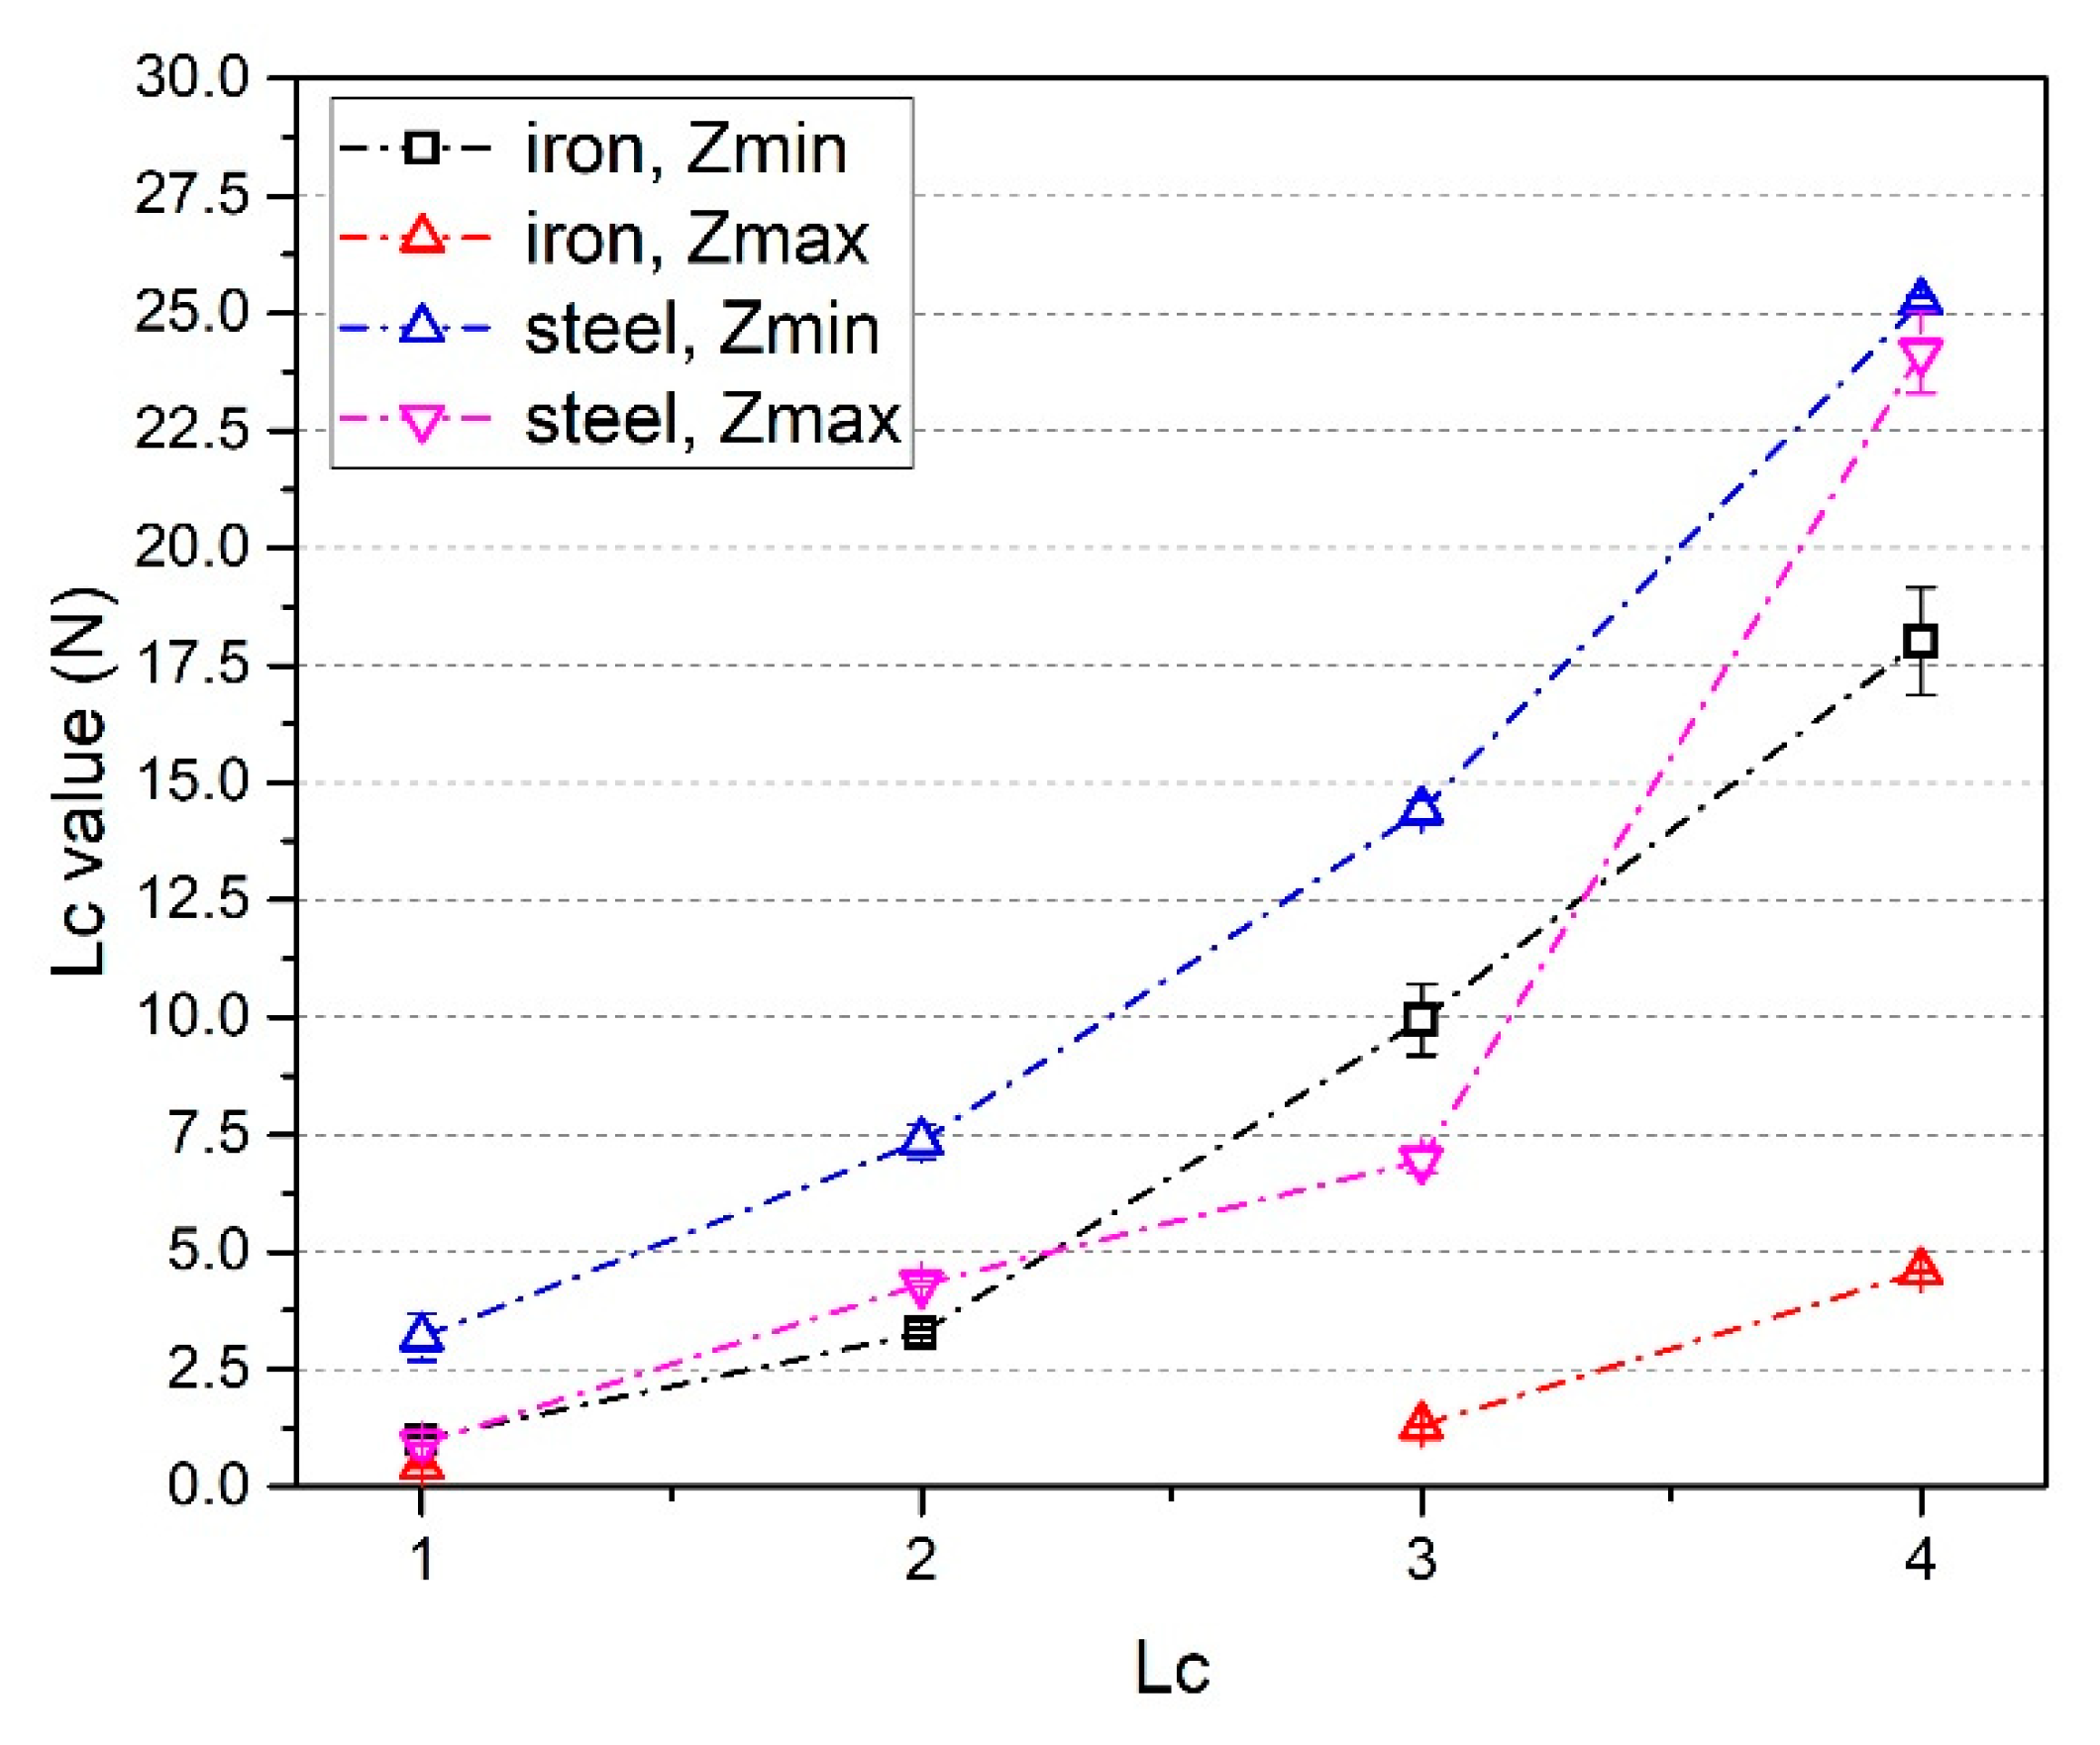
We decided to examine the coating adhesion and, then, the tribological properties of DLC films deposited at 500 W DC discharge power. The results are displayed in Figure 5. Concerning the adhesion measurements reported in the following, the DLC films tested were deposited on pure iron and stainless steel substrates.
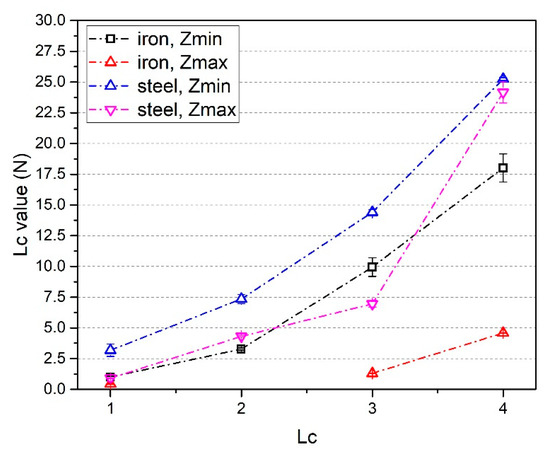
Figure 5.
The critical loads (Lc) characterizing DLC coatings deposited on different substrates at both substrate–target distances. Black void squares correspond to DLC films deposited on pure iron substrates at Zmin, while red void triangles at Zmax. Whereas DLC coatings deposited on stainless steel substrates are represented by blue void upwards triangle and magenta void downwards triangles, if grown at Zmin and Zmax, respectively.
It was clearly visible from the graph that the adhesion on the iron substrate was worse, in particular if the coating was deposited at the maximum distance from the target. The better adhesion obtained for stainless steel substrates could be linked to the lower mismatch between the mechanical properties of DLC and AISI 304 steel, compared to pure iron ones. This result was in agreement with the higher adhesion of soft-DLC films on hard substrates found by Owens et al. [52].
In addition, relative to the same substrate, higher critical loads were achieved for DLC films deposited closer to the target. This could be due to the more graphitic nature of the DLC film and, thus, its lower residual stresses.
3.2. Tribological Tests
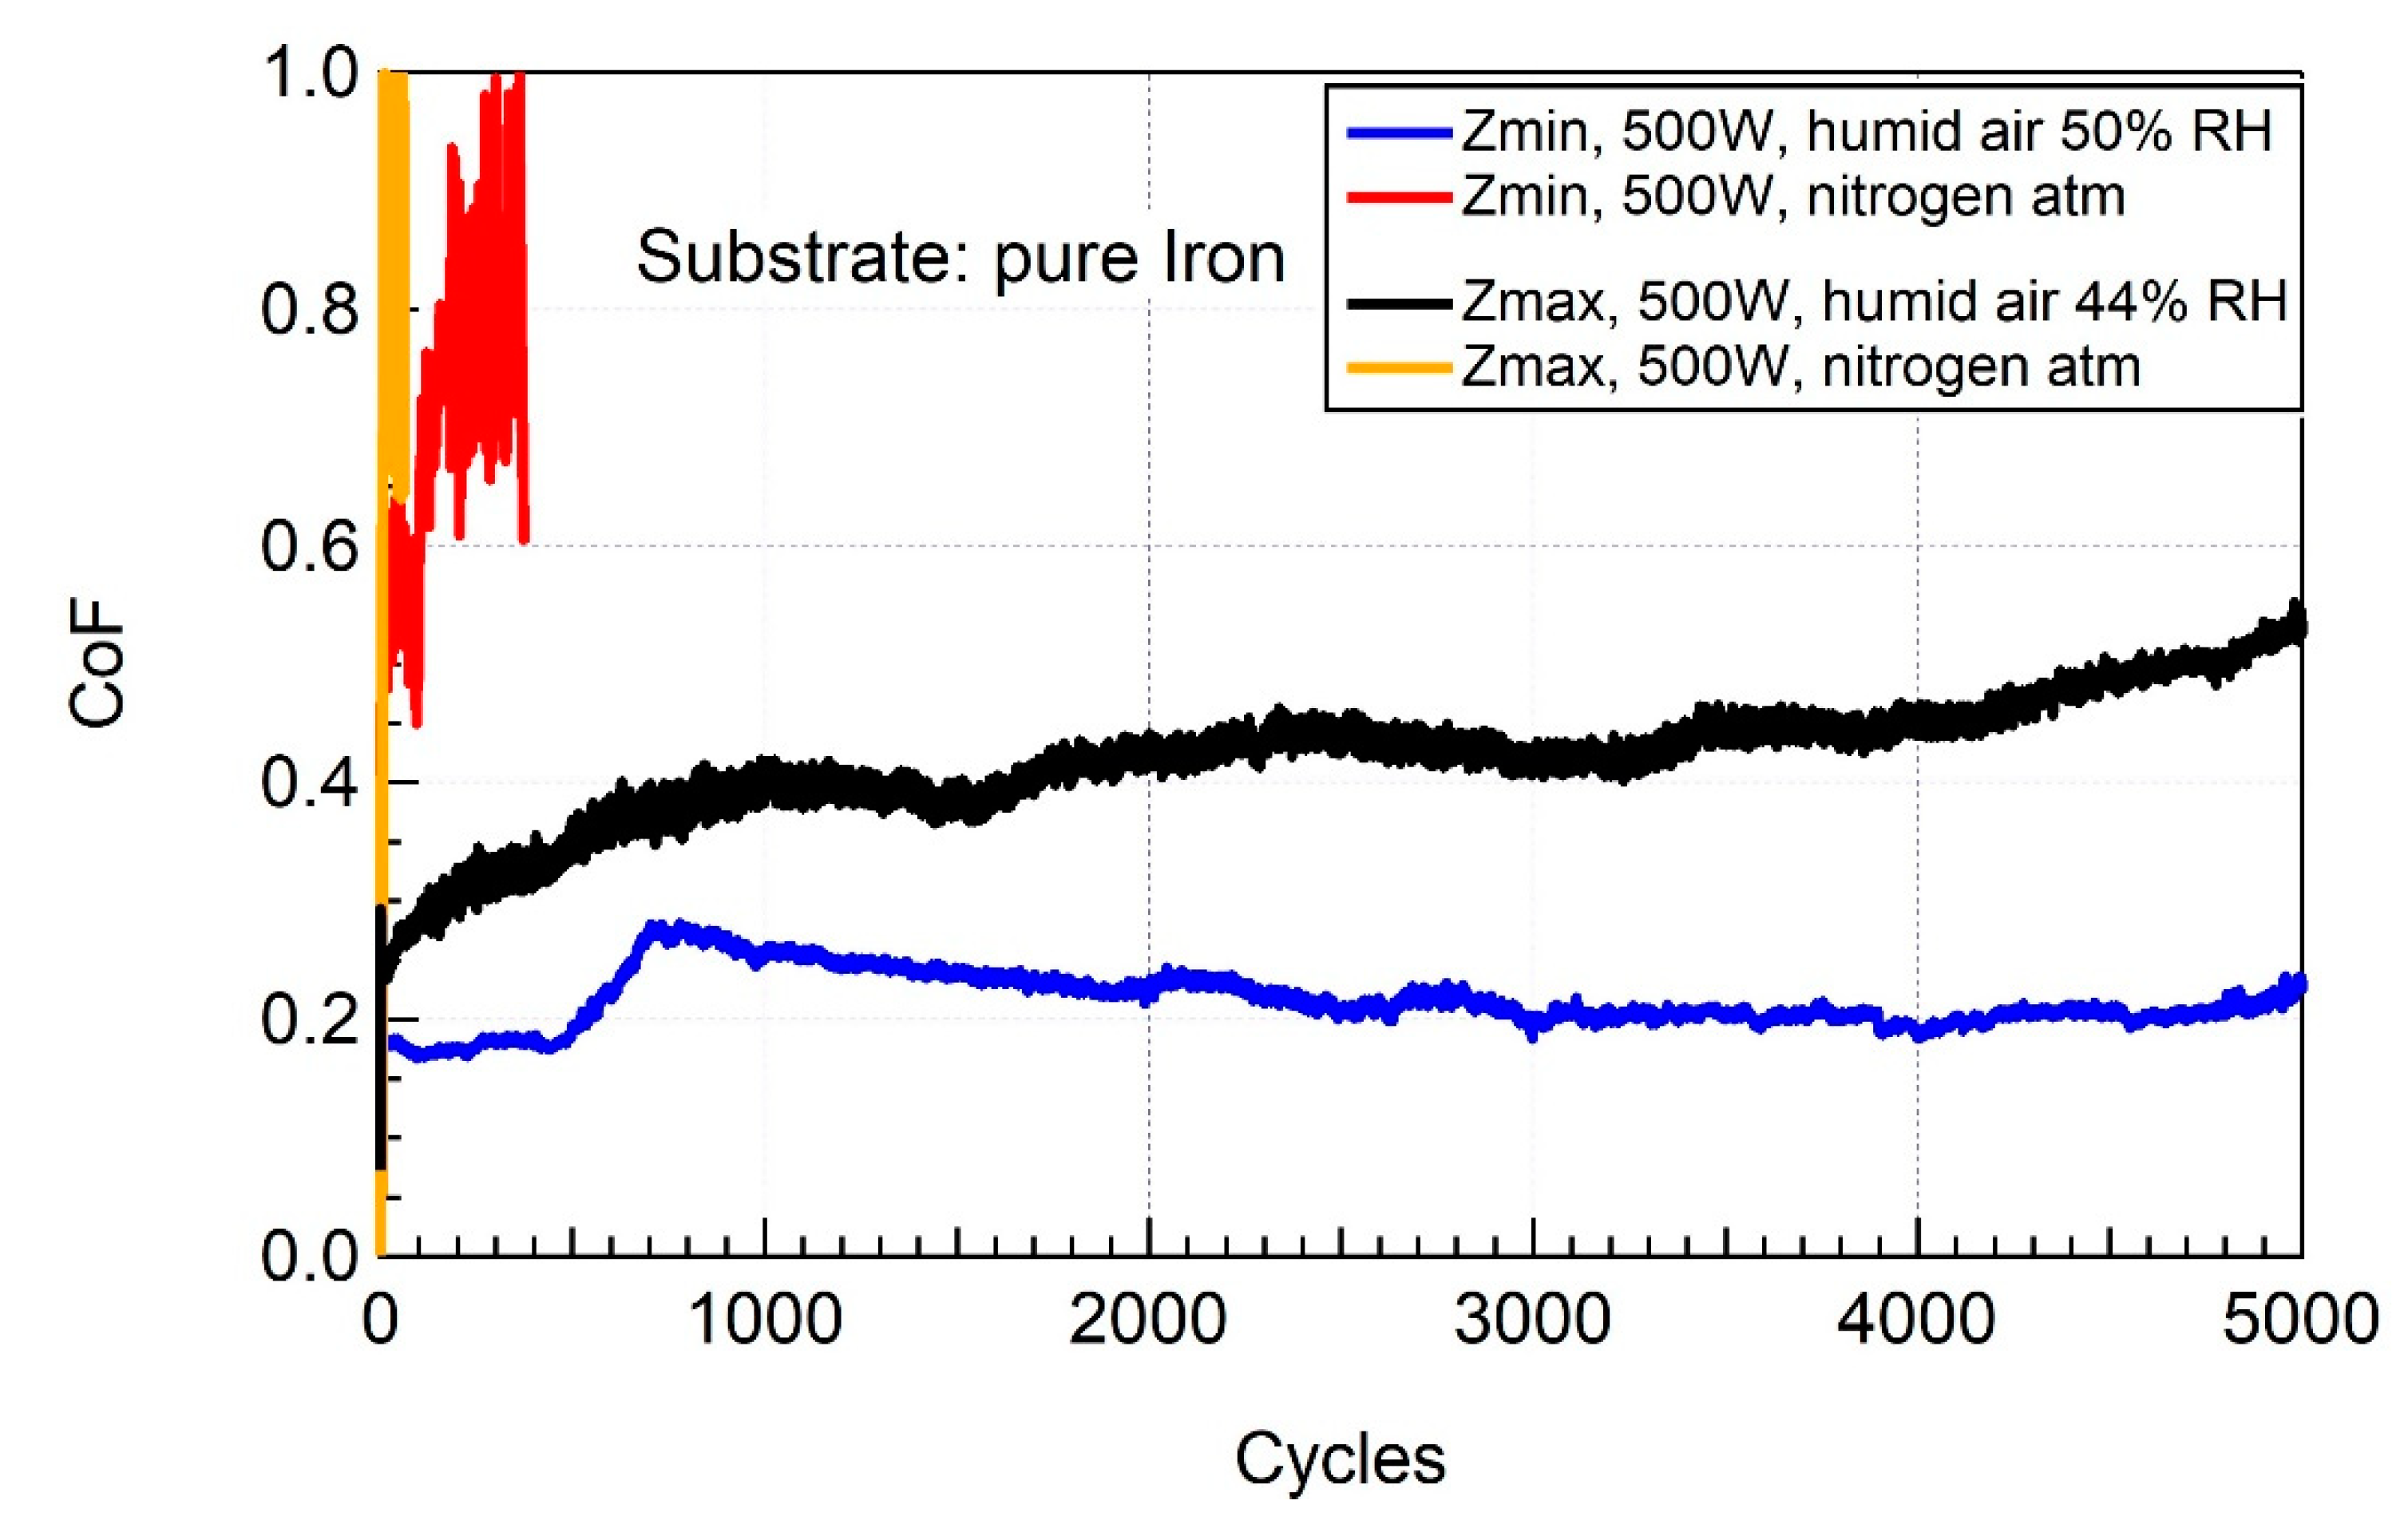
As already mentioned, the tribological analysis on the DLC coatings was realized just for the DLC films deposited at 500 W of discharge power on both pure iron and stainless steel substrates. In Figure 6, the results for ball-on-disk tests for DLC on iron specimens are presented. The tribological responses to diverse test environments of DLC films deposited at different substrate–target distances were comparable. In fact, in both cases the DLC films had a lower CoF for tests in humid air (blue and black curves), while their behavior in the nitrogen atmosphere was detrimental, leading to a friction higher than in metal-on-metal dry contact (red and orange curves).
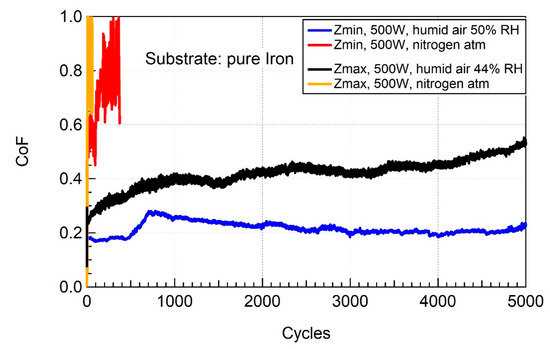
Figure 6.
Ball-on-disk tests for DLC films deposited at Zmin and Zmax on pure iron substrates. The friction tests were performed at RT in humid air (blue and black curves) and a nitrogen atmosphere (red and orange curves), for Zmin and Zmax DLC films, respectively. It is worth noting that the tests in the nitrogen atmosphere were stopped after reaching the steady state, as the coating failure has already happened.
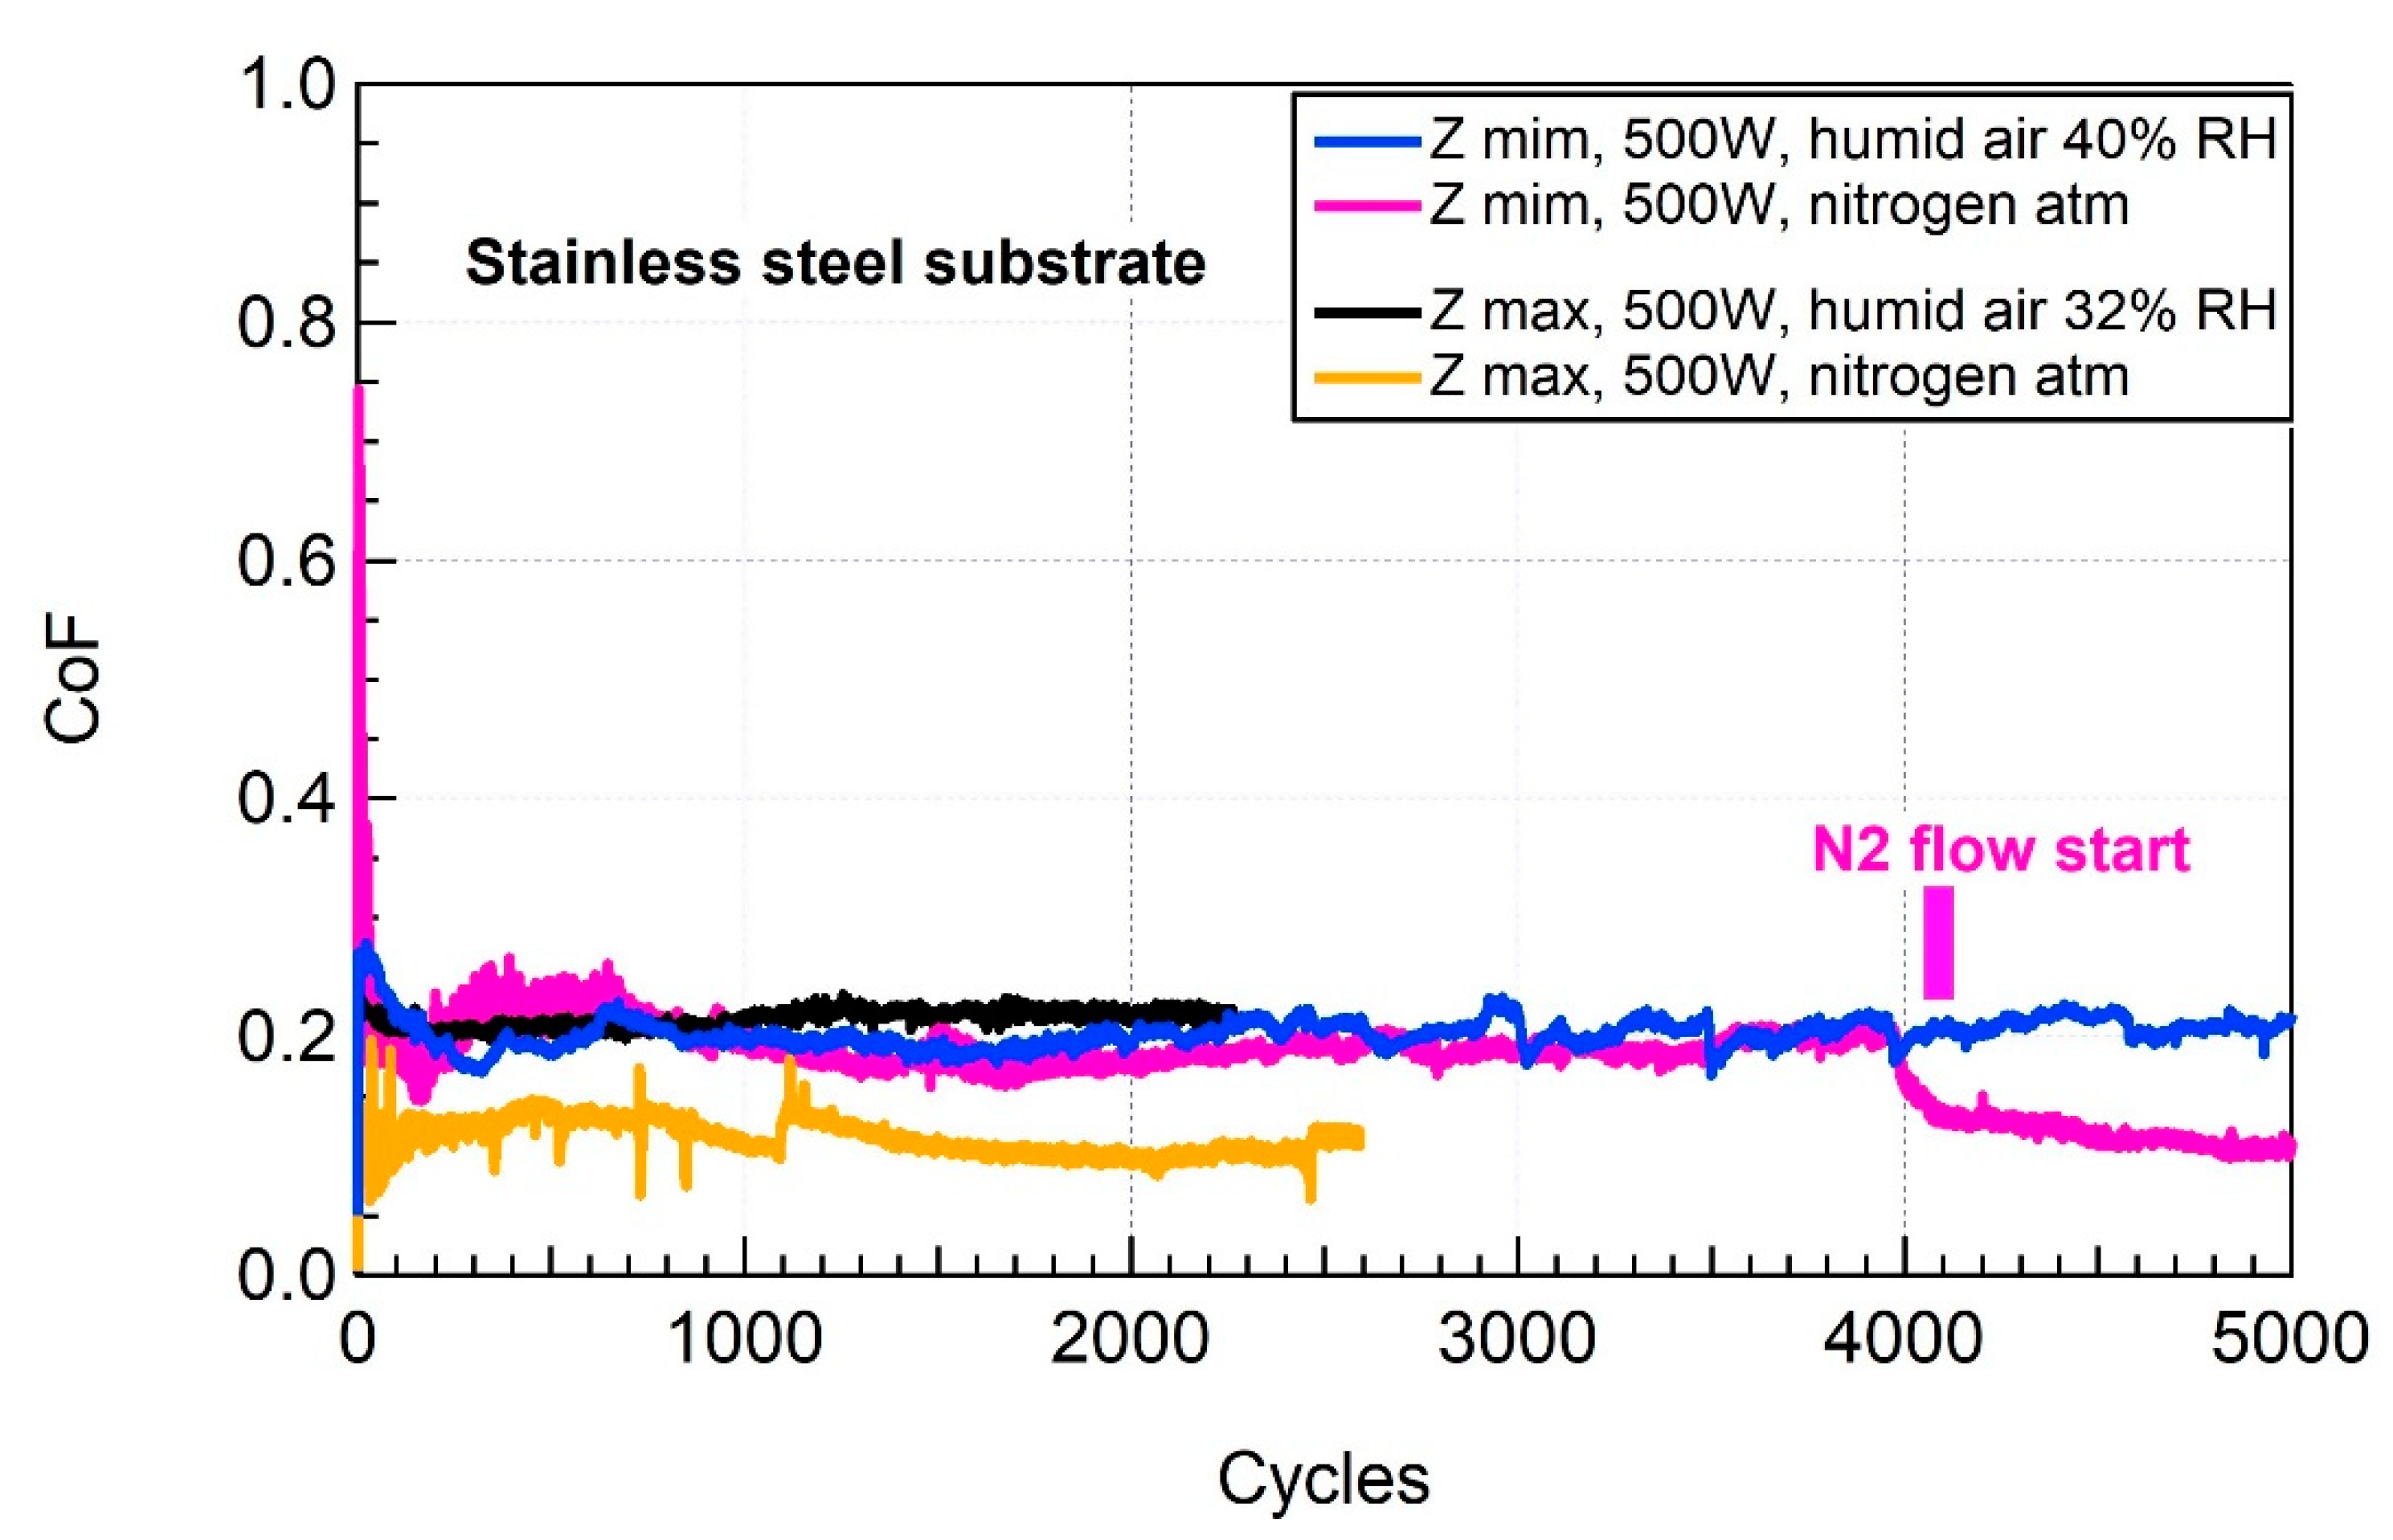
The analogous tests realized for DLC on stainless steel substrates are shown in Figure 7. As a matter of fact, for both vertical positions of the substrate holder the DLC films had a lower CoF for tests in the nitrogen atmosphere (red and orange curves), while the behavior in humid air led to a slightly higher friction coefficient but still lower than that of steel-on-steel systems (blue and black curves). The difference in the absolute values of the CoF for Zmin and Zmax, DLC films was almost negligible for the stainless steel substrates, unlike the iron substrate case, which was consistent with their similar critical loads.
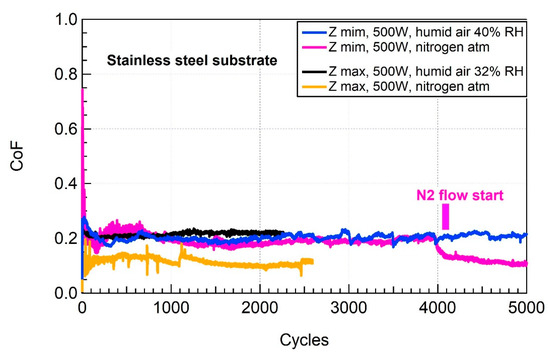
Figure 7.
Ball-on-disk tests for DLC films deposited at the maximum and minimum substrate–target distance on stainless steel substrates. The friction tests were performed at RT in humid air (blue and black curves) and a nitrogen atmosphere (red and orange curves), for Zmin and Zmax DLC films, respectively. For the DLC film deposited at Zmin, the beginning of the nitrogen flow was postponed to observe the passage between sliding in the air and in an inert atmosphere.
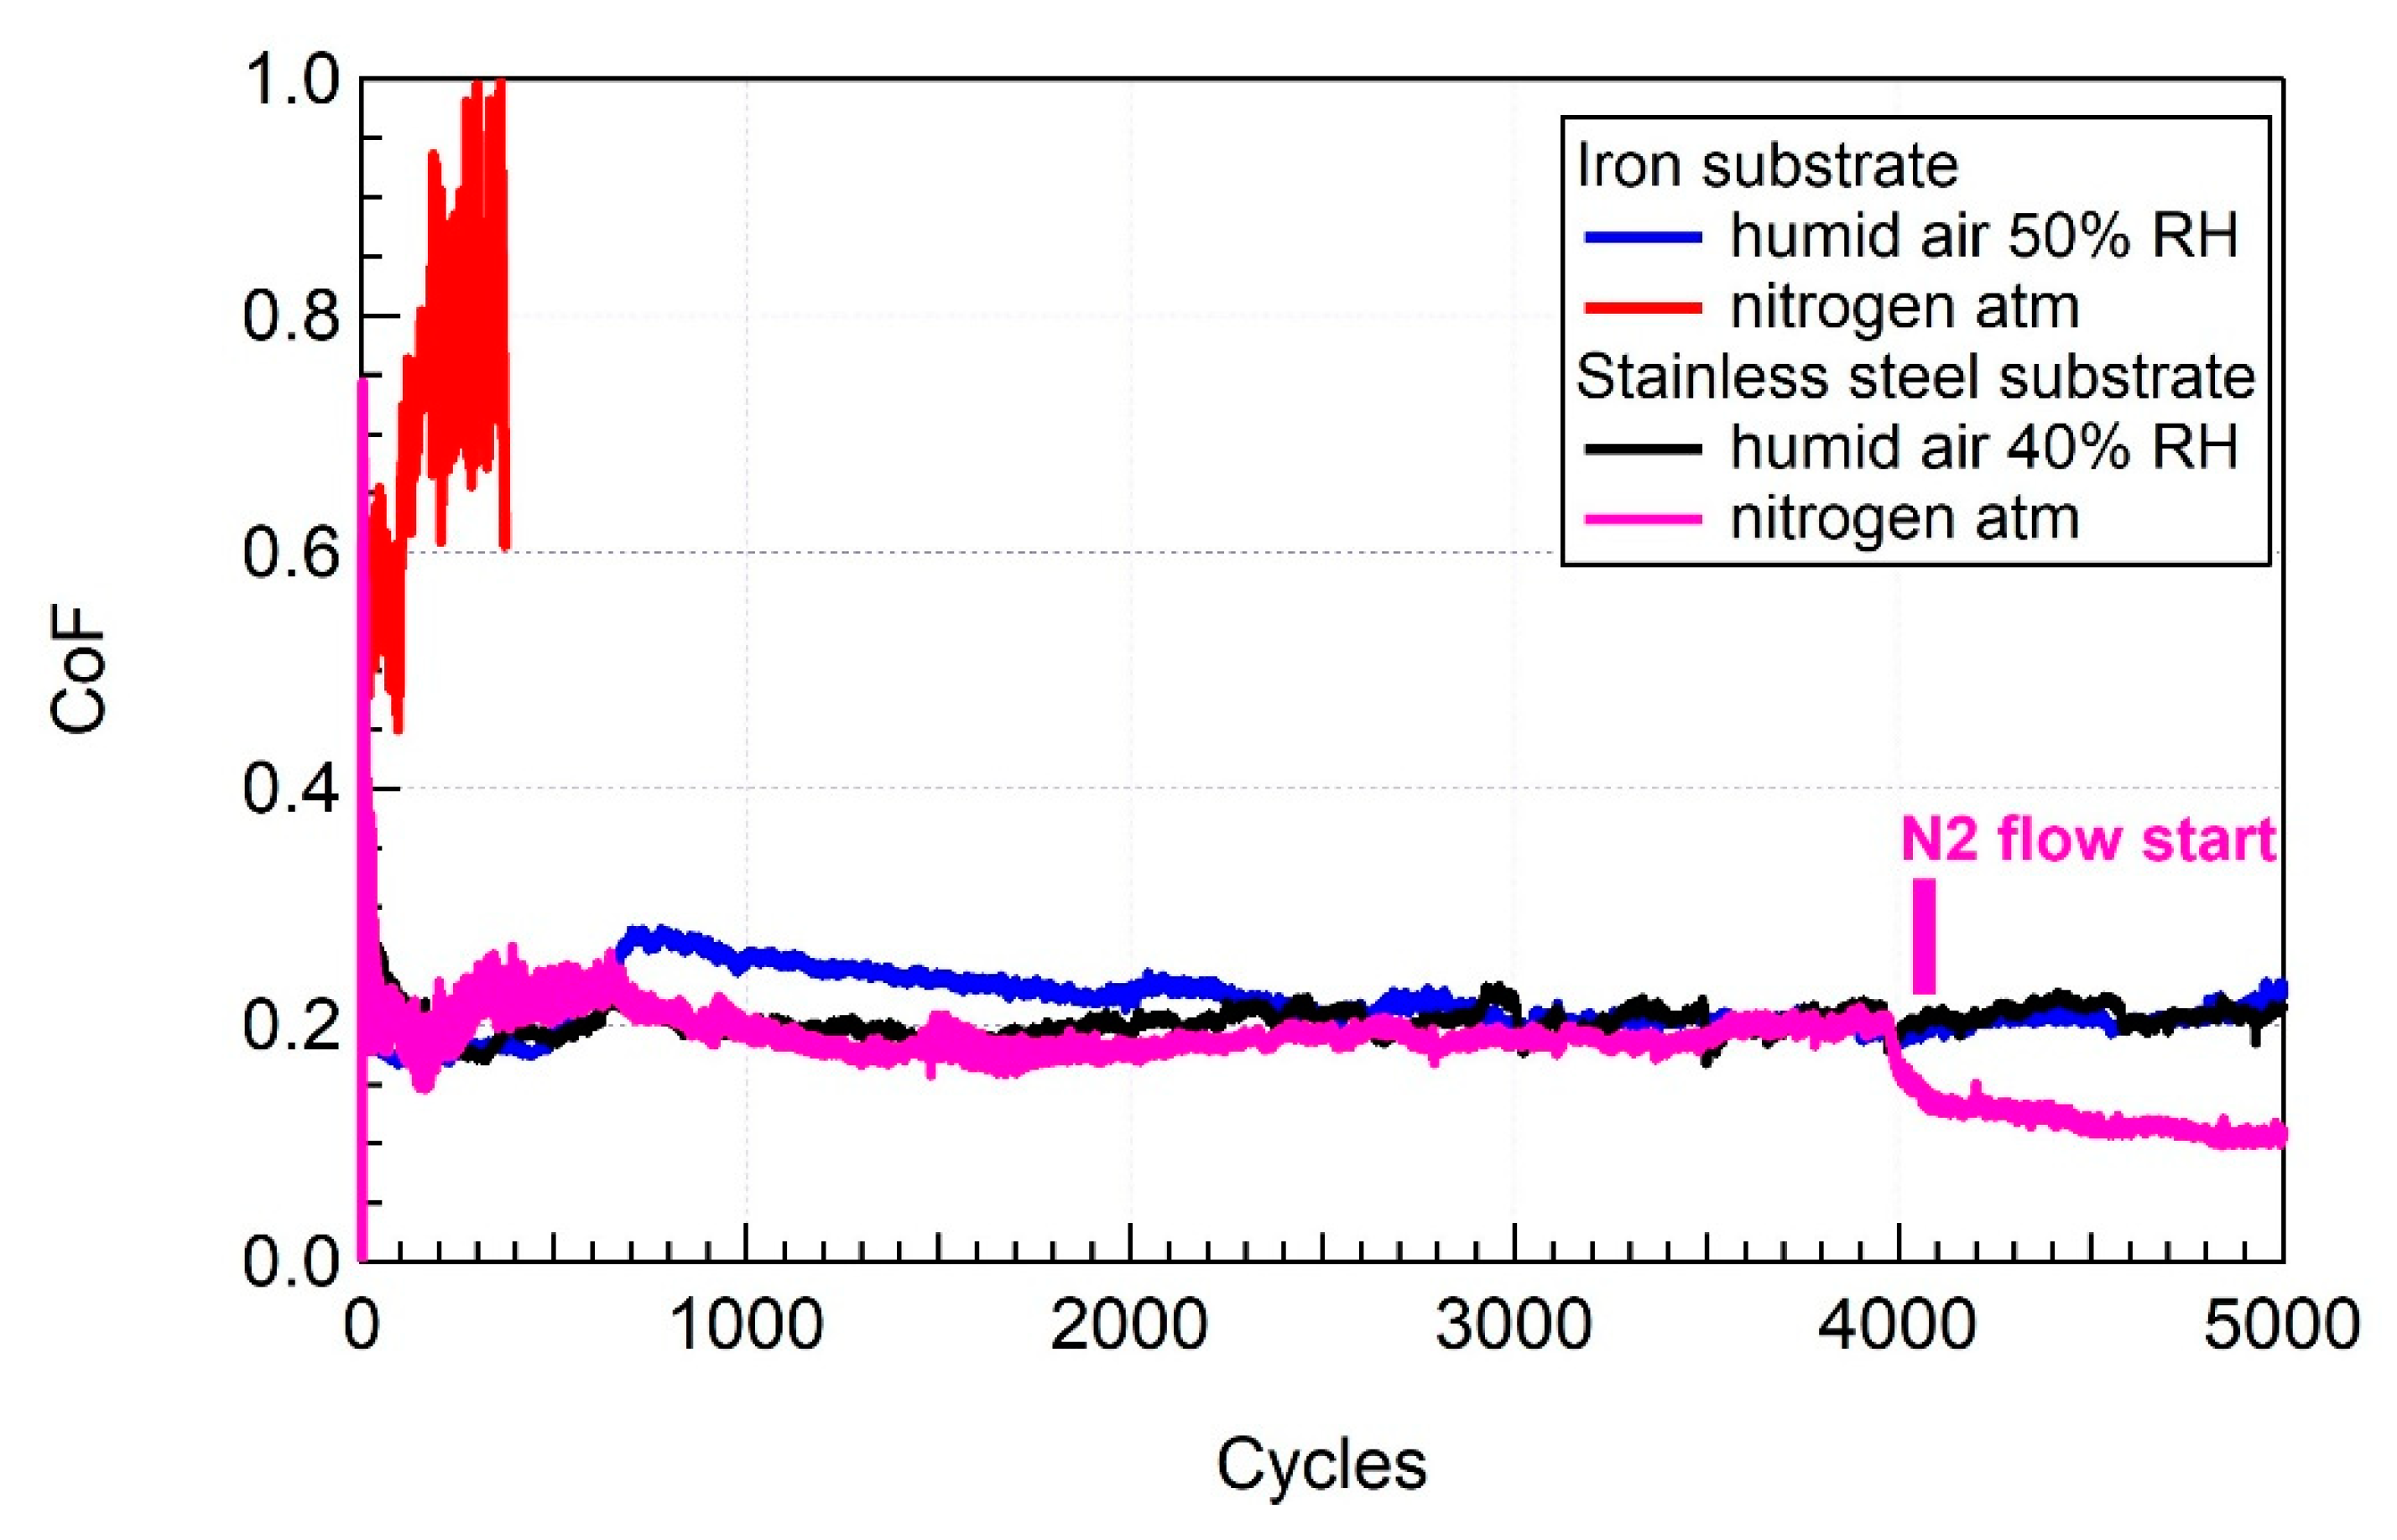
Finally, the comparison of the tribological results for DLC films deposited at Zmin on both pure iron and stainless steel substrates revealed unexpected behavior. For this comparison, we group in Figure 8 the curves in blue (tribological test in humid air) and in purple (tribological test in the nitrogen atmosphere) derived from Figure 6; Figure 7, respectively, for DLC deposited on iron and stainless steel substrates. Even when the DLC coatings were grown using the same deposition parameters, the final tribological response showed a different reaction to the test environment. While the DLC on iron had a lower CoF in humid air and dramatically failed in the nitrogen atmosphere, the DLC on stainless steel did not present an abrupt collapse in either of the environments and exhibited a lower CoF in an N2 atmosphere.
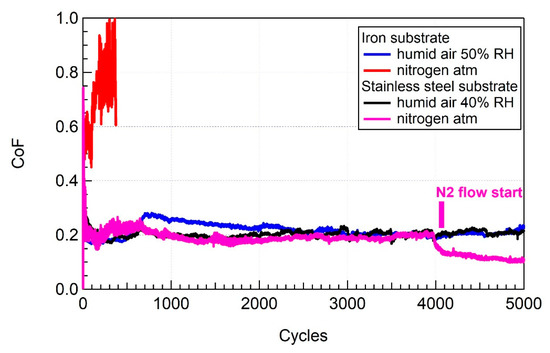
Figure 8.
Comparison of the friction tests for DLC films deposited at Zmin on both pure iron and stainless steel substrates. The tribological tests were performed at RT in humid air (blue and black curves) and a nitrogen atmosphere (red and magenta curves), for DLC deposited on iron and stainless steel substrates, respectively. It is worth noting that for the DLC on the iron substrate the test in the nitrogen atmosphere (red curve) was stopped after the steady state had been reached, since the coating failure had already happened. For the DLC film deposited on the stainless steel substrate, the beginning of the nitrogen flow was postponed to observe the passage between sliding in the air and in the inert atmosphere.
This atypical behavior might be explained by a different hydrogen concentration in DLC grown on steel and iron substrates. This theory would assimilate the first to a hydrogenated DLC, while the second one to a hydrogen-free coating. As reported by Donnet et al. [15], the hydrogen concentration in DLC coating plays a fundamental role on the friction coefficient [53,54]. A higher hydrogen content embedded in the DLC film during the deposition phase leads to a worse tribological performance of the coating if tested in humid air (O–, OH–, or H-rich test atmospheres) [53,55]. However, as the deposition parameters were kept the same and the growth of DLC films on different substrates were alternated, we would not expect a difference in the chemical composition so marked to justify such a different tribological behavior. A more probable explanation could be given considering the different mechanical coupling of the DLC film with the substrate material. In fact, the different tribological response could be linked to the difference in substrate hardness. The pure iron substrate, having a low hardness, could not provide an adequate mechanical support for the DLC coating and undergo plastic deformations, as opposed to the steel substrate. It is well known that the substrate hardness, as well as its elastic modulus, is a key parameter in the coupling of a thin film and the substrate [56,57]. The mechanical matching of coating and substrate is fundamental to assure good tribological performances. Multiple authors have reported that, if a DLC film were coupled with a softer substrate, this latter could easily undergo plastic deformation during sliding leading to a change in the shear stress distribution at the interface [57,58,59]. Moreover, if the soft substrate, such as pure iron disks, bends, it may increase both friction and wear [59]. Finally, it is worth noting that a role could be played by the iron oxide layer formed at the surface of the iron disk before the deposition step [60,61]. This is still an open point in our research and will be the subject of further investigation.
3.3. Wear Measurements
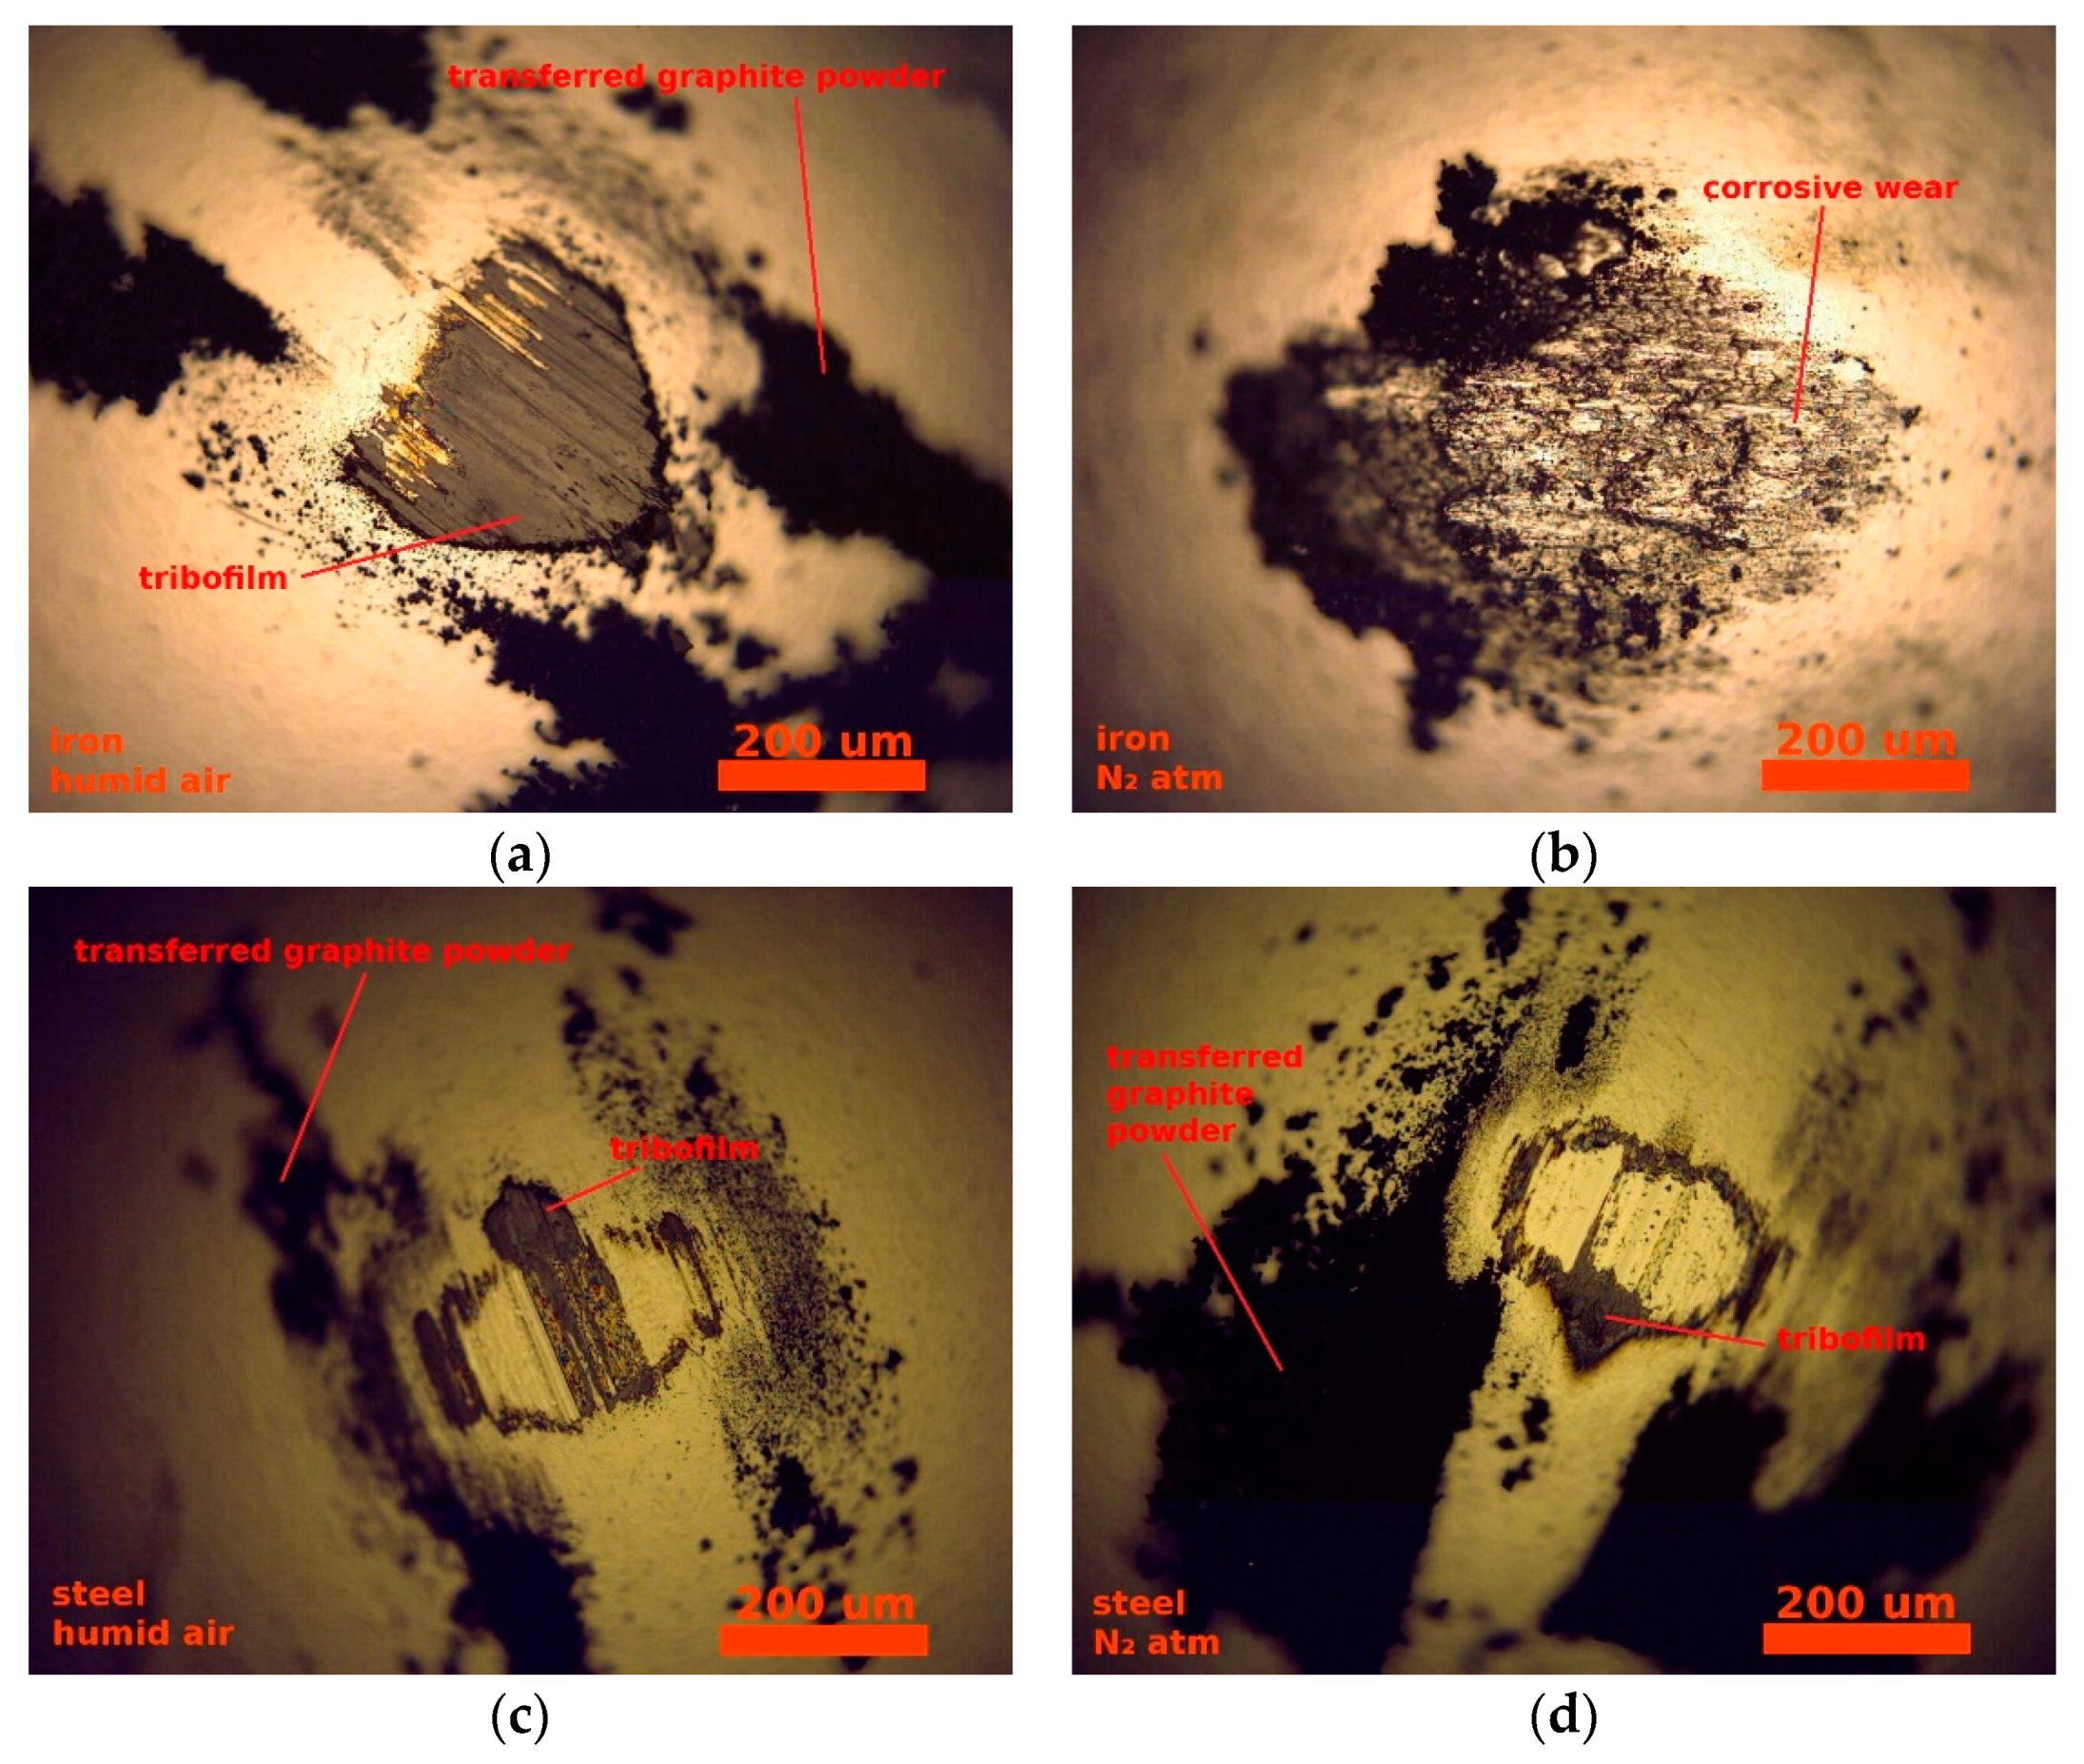
The wear measurements support the reasoning just elaborated. The optical images were collected after the tribological tests. Those concerning the counterparts, reported in Figure 9, were employed to verify the presence of transferred material (tribofilm and graphitic powder), while those of the cleaned ball surfaces (not shown) were used to estimate the ball worn cup average radius. As shown in Figure 9b, for a DLC film on iron substrate sliding in a nitrogen atmosphere, the observation of the counterpart ball after the friction test revealed the minimal formation of a transfer film, which is indeed fundamental to achieve a low CoF in this kind of system [38]. The counterpart ball seemed to suffer corrosive wear, rather than an abrasive one. On the contrary, the optical images of the other counterparts presented a graphitic transfer film, as shown in Figure 9a,c,d.
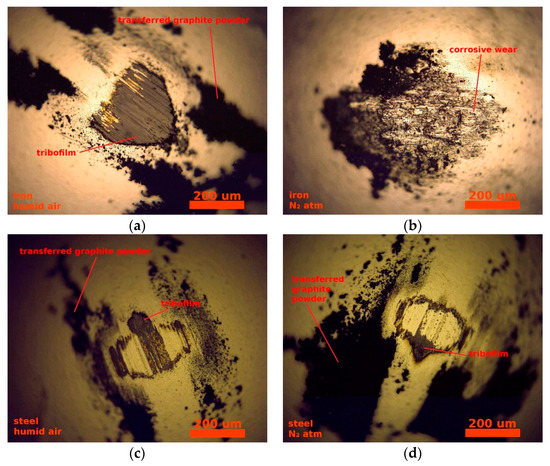
Figure 9.
Optical images of the counterpart ball for the friction test in humid air (a,c) and a nitrogen atmosphere (b,d) for DLC films deposited on pure iron (a,b) and stainless steel (c,d) substrates. The presence of a tribofilm, transferred graphite powder, or corrosive wear is highlighted. The orange stripe corresponds to 200 μm.
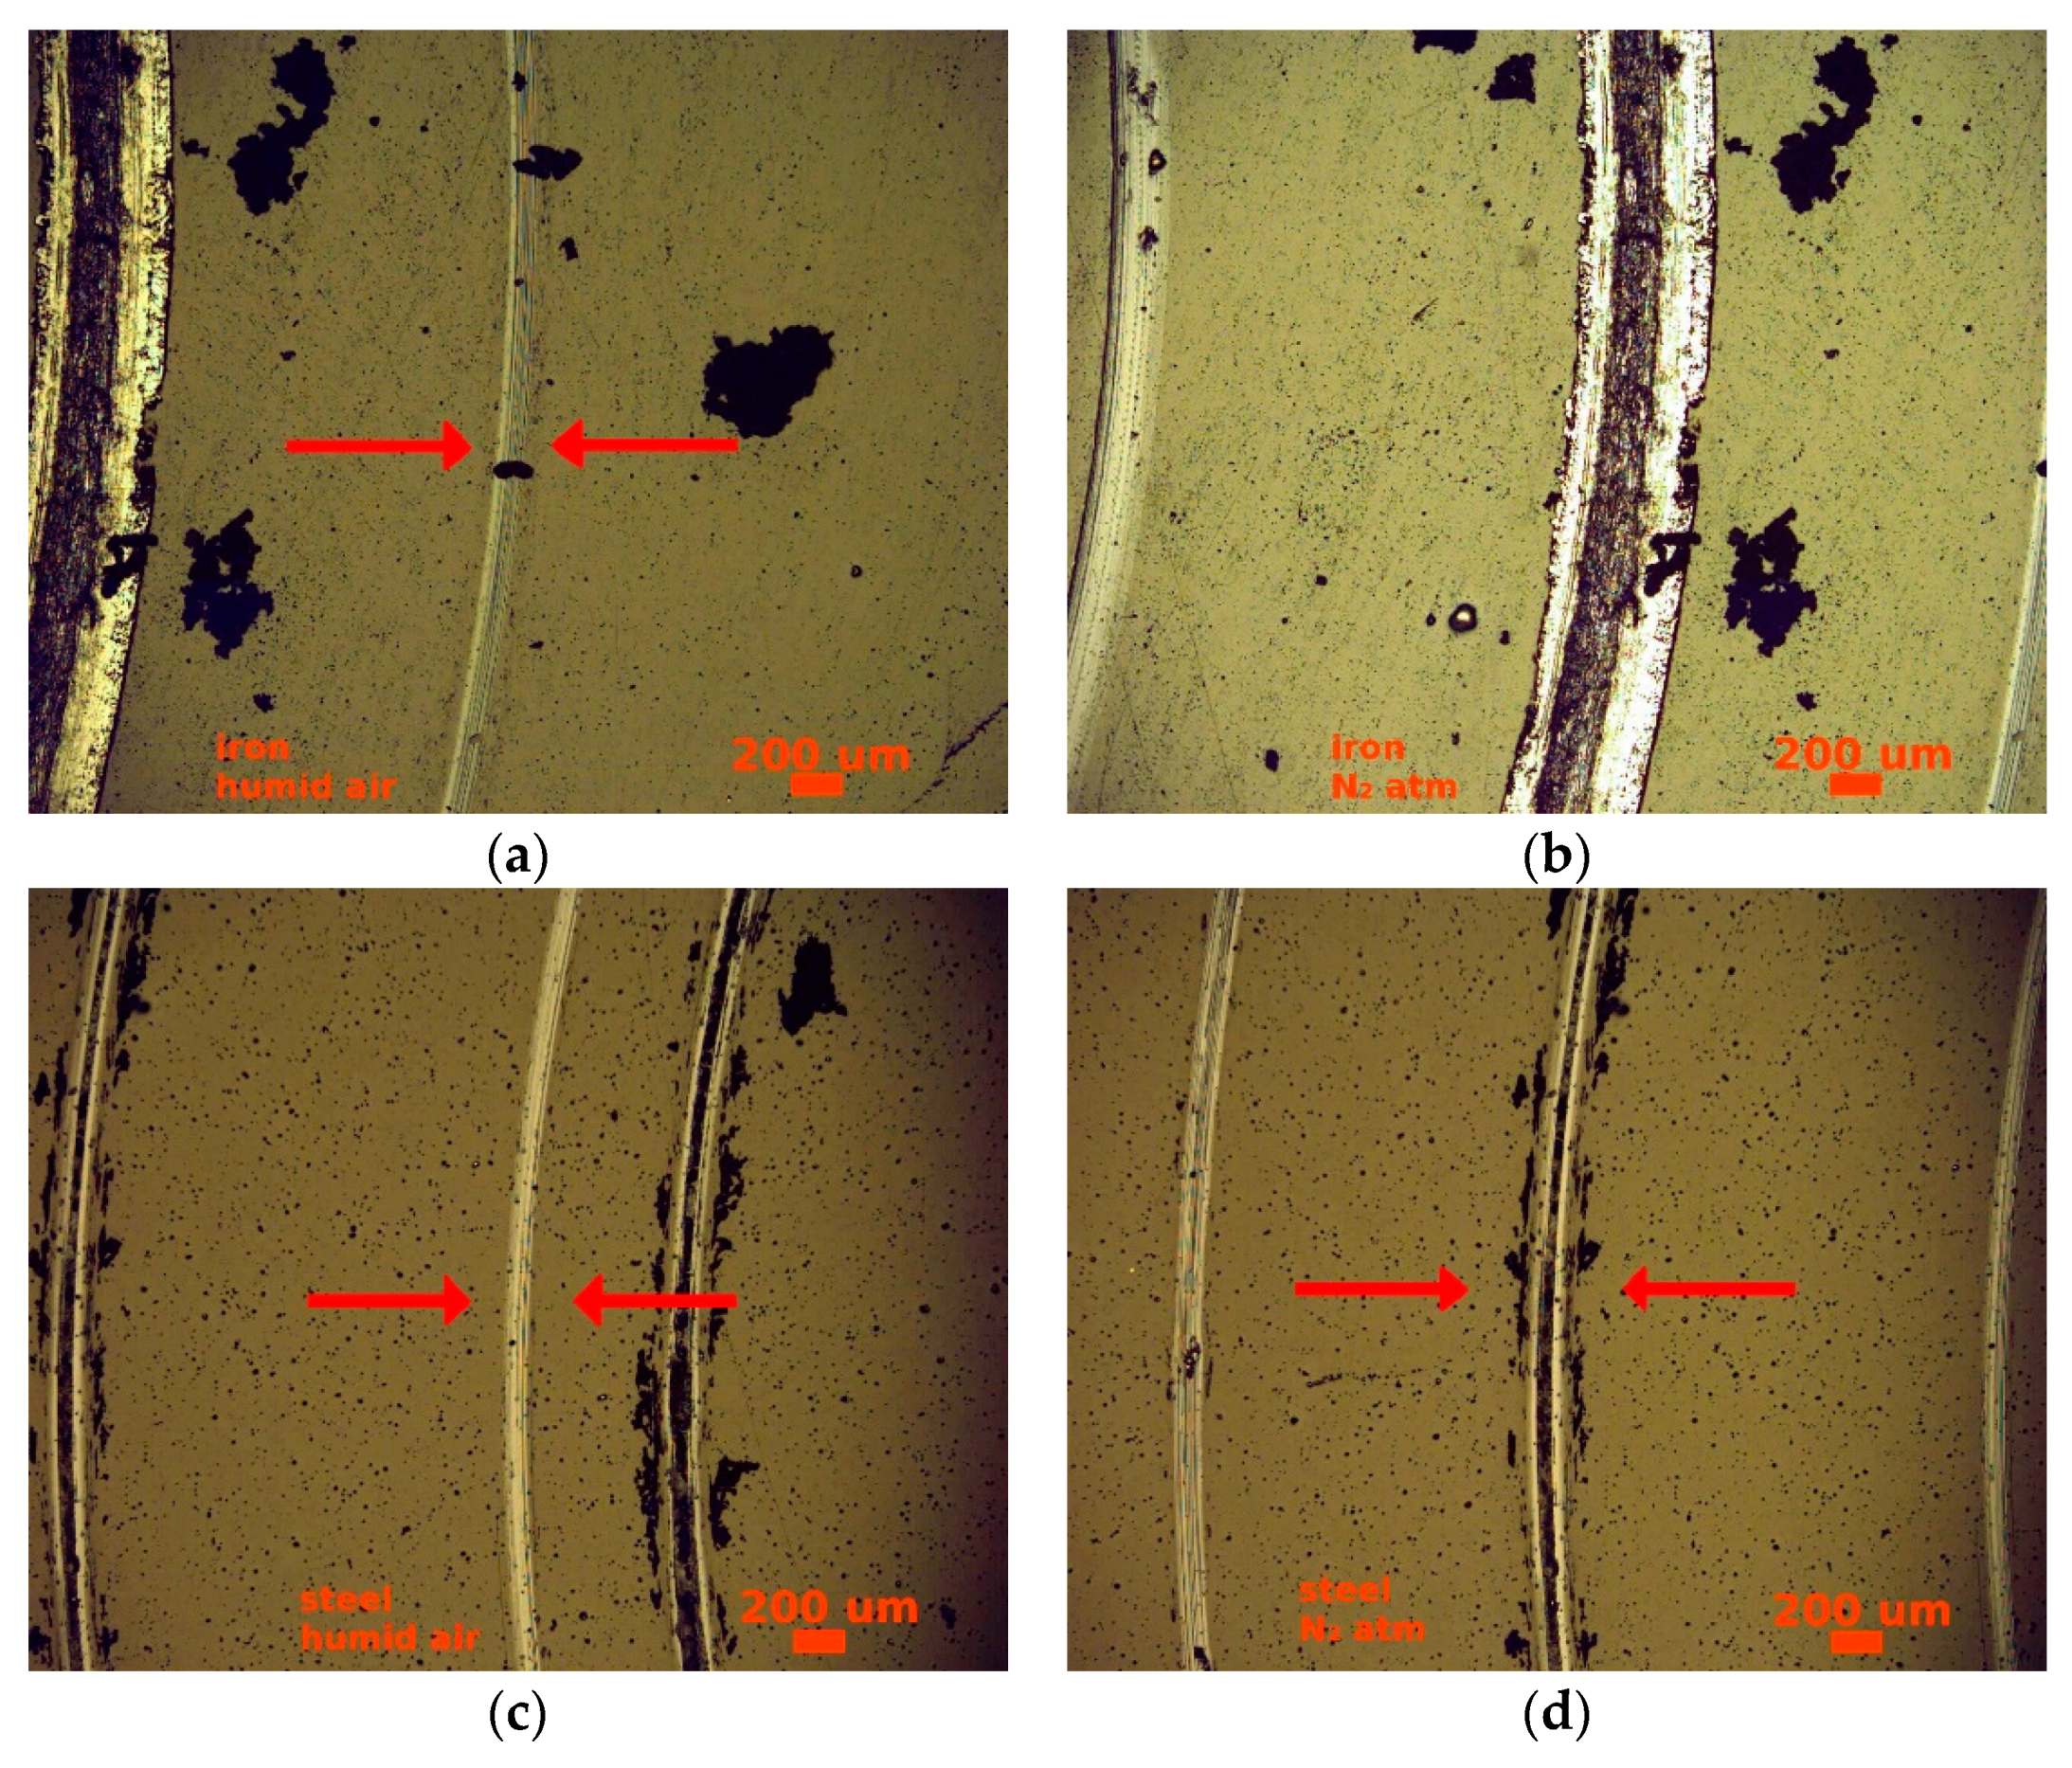
Moreover, the ball wear average radii related to the DLC samples deposited on iron disks were slightly higher than those of DLC films on stainless steel substrates, as reported in Table 2. The formation of a tribofilm corresponded to a low CoF and to a reduced specific wear rate of the coated disks, as listed in Table 3. Even the wear tracks, observed with an optical microscope, appeared less marked when a tribofilm formed, as shown in Figure 10a,c,d.

Table 2.
Ball wear average radius derived from the observation of the counterpart surfaces after the surface cleaning.

Table 3.
Specific wear rates of the coated disks and the counterpart ball (estimate) concerning both substrates (pure iron and stainless steel) and both test atmospheres (humid air and N2 atm).
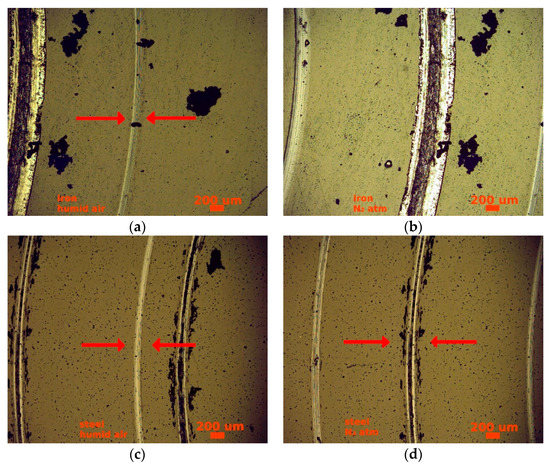
Figure 10.
Optical images of the wear tracks of the coated disks deriving from the test in humid air (a,c) and a nitrogen atmosphere (b,d) for DLC films deposited on pure iron (a,b) and stainless steel (c,d) substrates. The orange stripe corresponds to 200 μm. The red arrows highlight the investigated track when non-obvious.
In fact, the wear track of the DLC on iron tested in the nitrogen atmosphere (Figure 10b) was much more evident than those relative to the other test-coupling conditions.
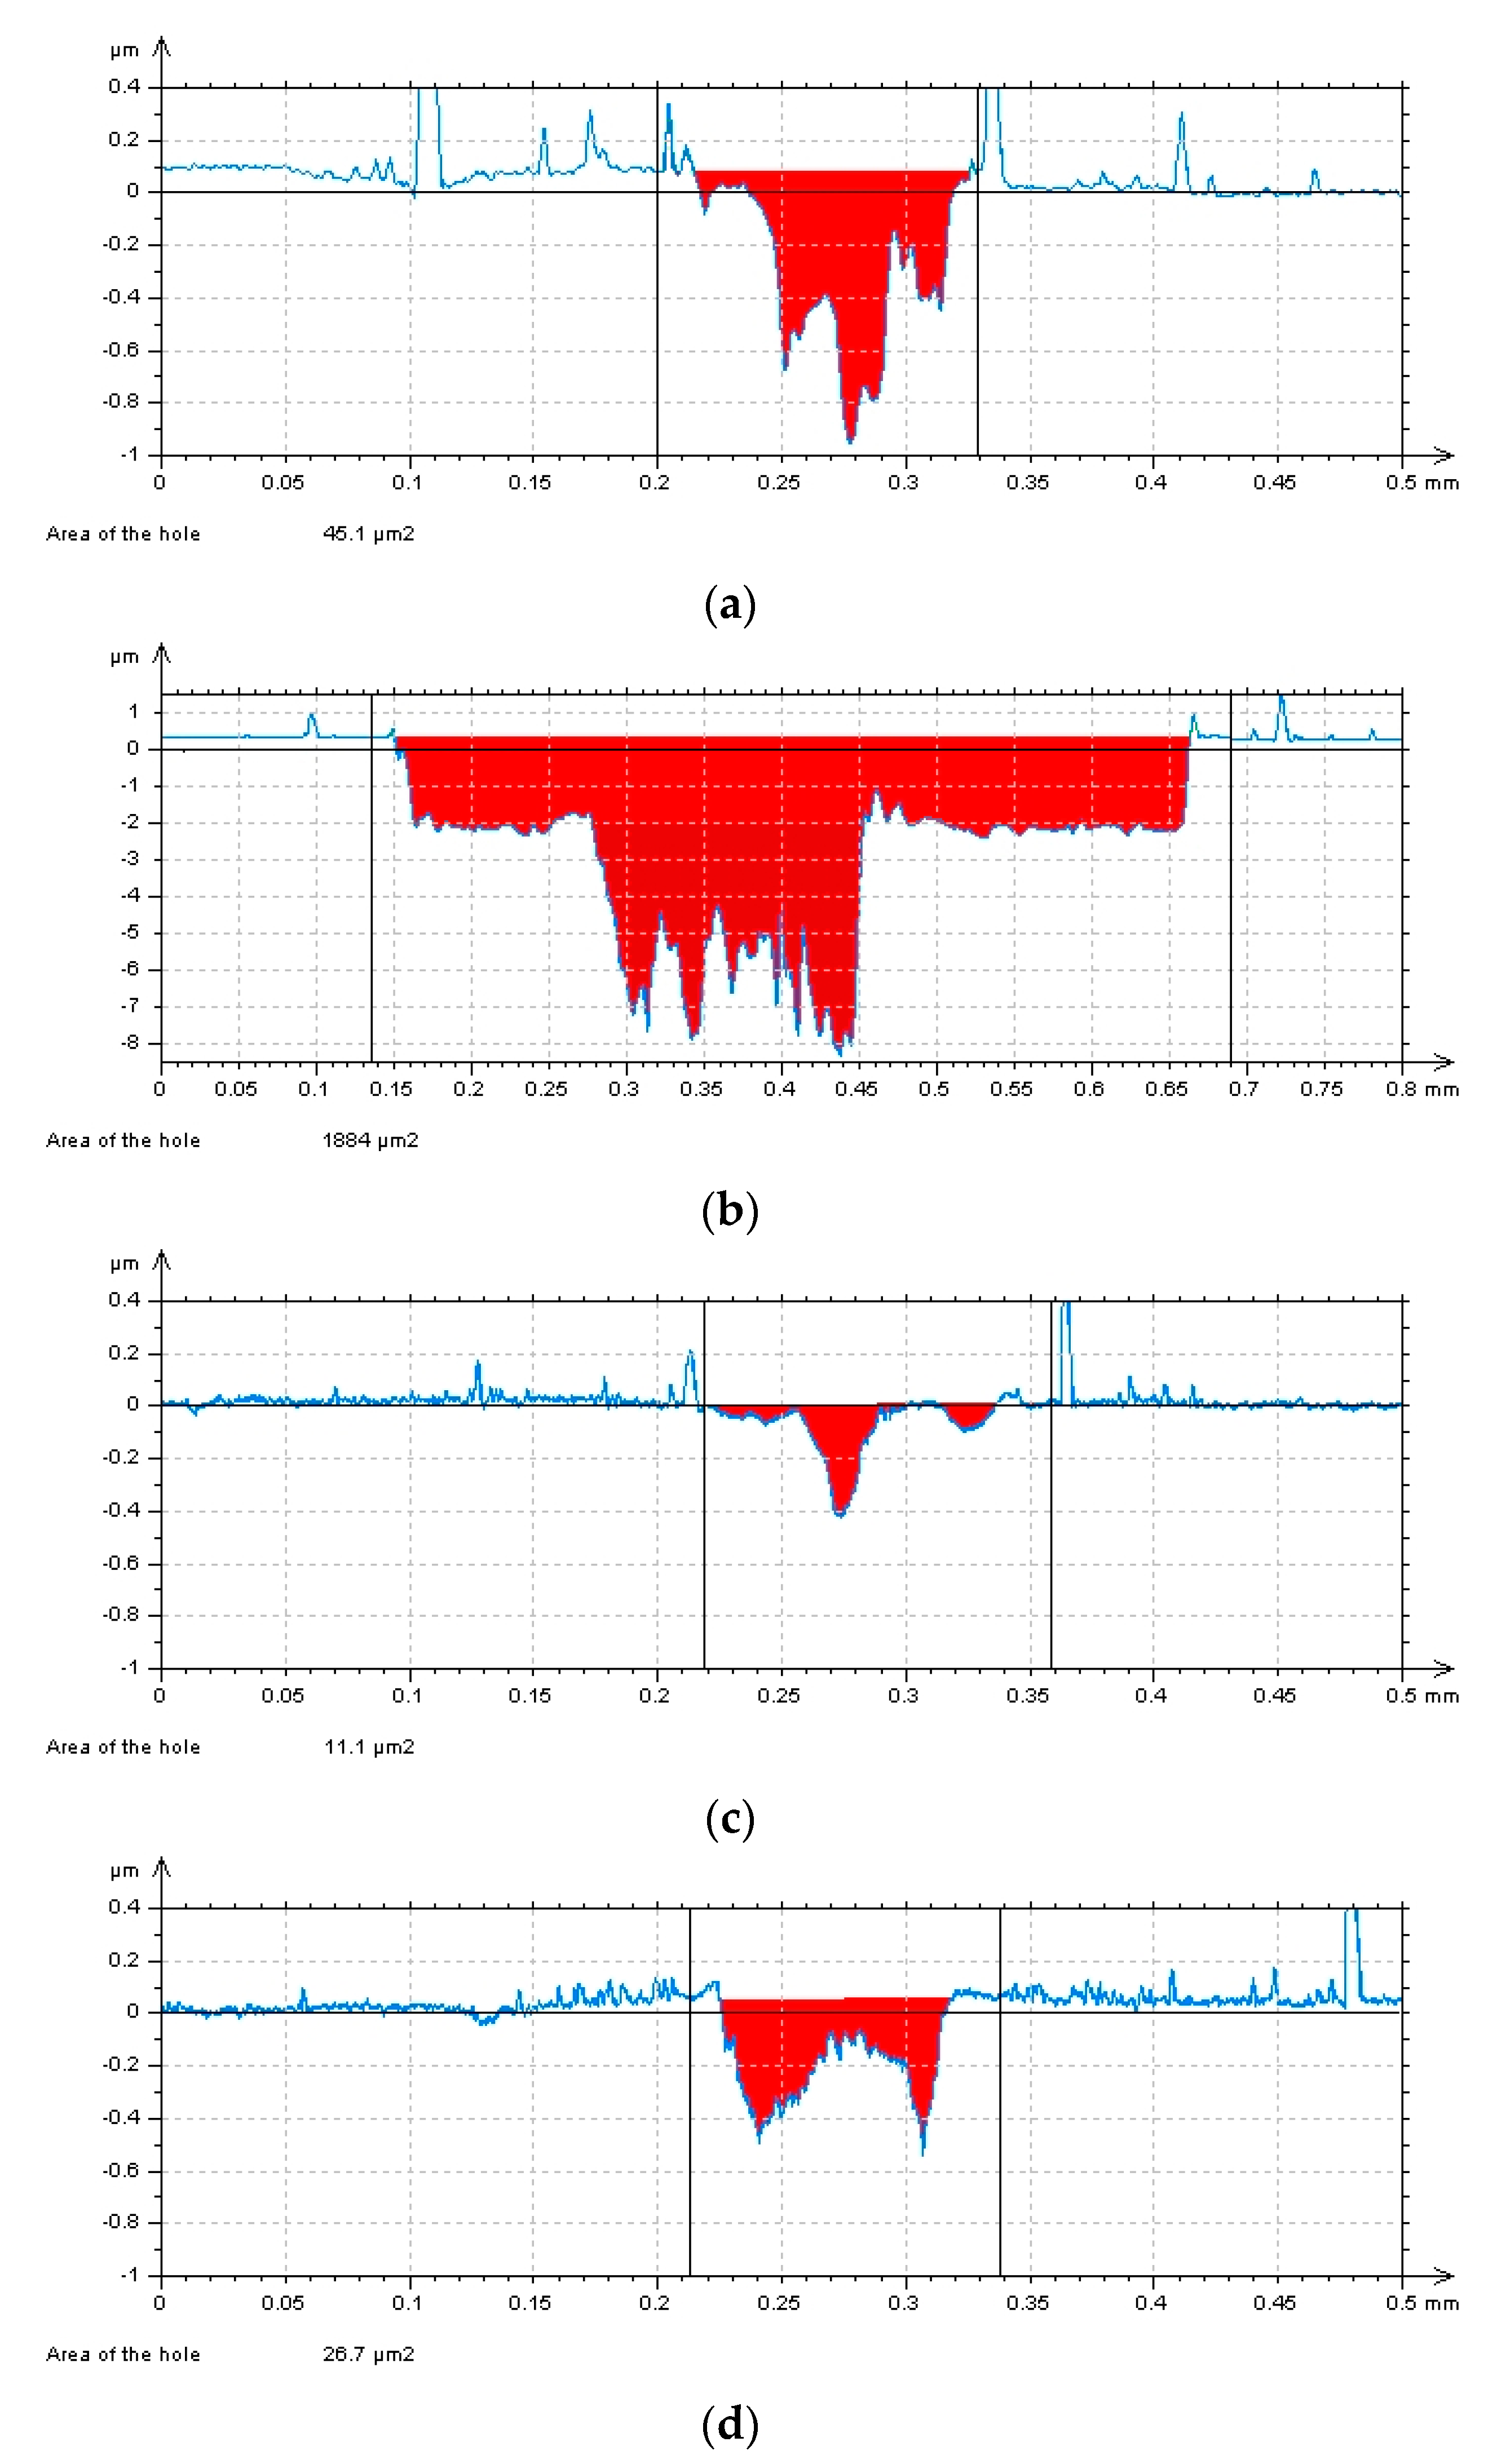
To better appreciate the differences in the wear rate for the tribological tests displayed in Figure 10, the profiles of the wear tracks, obtained using a stylus profiler, are shown in Figure 11. The worn area is highlighted in red for easier viewing.
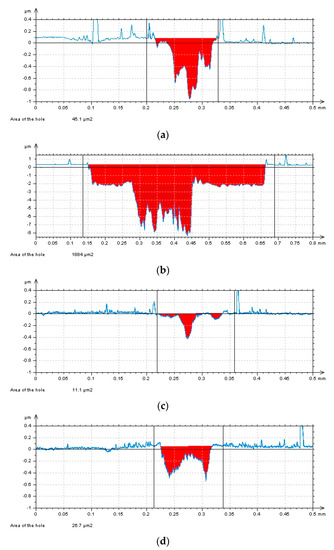
Figure 11.
Profiles of the wear tracks, shown in Figure 10, obtained by stylus profiler. Profiles in (a,c) derive from the tests in humid air, while those in (b,d) derive from those in the nitrogen atmosphere. DLC films were deposited on pure iron (a,b) and stainless steel (c,d) substrates, respectively. The worn area is highlighted in red.
A possible development of the wear analysis would be the potentiodynamic polarization test [62,63,64]. As mentioned by Papakonstantinou et al. [62], it would help to link the wear observed for DLC films in different test atmospheres with the corrosion resistance and inertness degree of these coatings. A future improvement in the study of friction and wear performances of DLC deposited by magnetron sputtering will involve a TEM investigation of cross sections of wear tracks and the wear debris collected after testing [45,46]. As reported by Chang et al., the TEM analysis of the transfer layer has given valuable insight on the graphitic- or diamond-like nature of the carbon films formed on the counterpart after a tribological test [45].
4. Conclusions
The study of the DLC coating produced by magnetron sputtering was composed by the optimization of the deposition phase, the chemical and mechanical analyses of the deposited coatings and their tribological validation. The XPS analysis of the DLC films deposited at different powers revealed a decrease in the oxygen concentration when the deposition power changed from 100 to 500 W. This trend was more pronounced for DLC films deposited at Zmin. The sp3 phase determination was deduced by the Raman analysis of the G and D bands associated with the indentation hardness measurement. While the sp3 phase content was almost constant with the discharge powers for DLC deposited at Zmax, it decreased when the supply power for coatings deposited at Zmin changed from 200 to 500 W. This latter phenomenon could be linked to an excess of energy of the incident carbon atoms, which caused a graphitization of the DLC film. For the tribological tests, we employed pure iron and stainless steel substrates and DLC films deposited at 500 W for both substrate–target distances. The ball on disk tests show that the tribological performances do not depend on the substrate–target distance. However, the tribological results for DLC films deposited on pure iron and stainless substrates showed different properties, although the DLC films were deposited using the same deposition parameters. In fact, the DLC coating deposited on the iron substrate showed a lower CoF in humid air and failed in the nitrogen atmosphere, while the DLC film on stainless steel disks did not collapse in either of the environments showing a lower CoF in the N2 atmosphere. This behavior could be explained considering the different mechanical coupling of the DLC film with the substrate material (higher adhesion on steel), together with the absence of a transfer layer on the counterpart ball in the case of DLC deposited on iron and tested in the nitrogen atmosphere.
Author Contributions
Conceptualization: G.F., D.M., and A.R.; investigation: G.F., A.B., and E.V.; resources: S.V.; data curation: G.F.; writing—original draft preparation: G.F. and D.M.; writing—review and editing: G.F. and A.R.
Funding
This research received no external funding.
Acknowledgments
The authors are indebted to A. Candeli (Department of Engineering “Enzo Ferrari”, University of Modena and Reggio Emilia, Via P. Vivarelli 10/1, 41125 Modena (MO), Italy, to Il Sentiero International Campus S.r.l.—via Friuli 11—36015 Schio (VI) Italy, who performed the mechanical tests. The authors gratefully acknowledge support from Cost Action MP1303 “Understanding and controlling nano and mesoscale friction”.
Conflicts of Interest
The authors declare no conflict of interest.
Appendix A
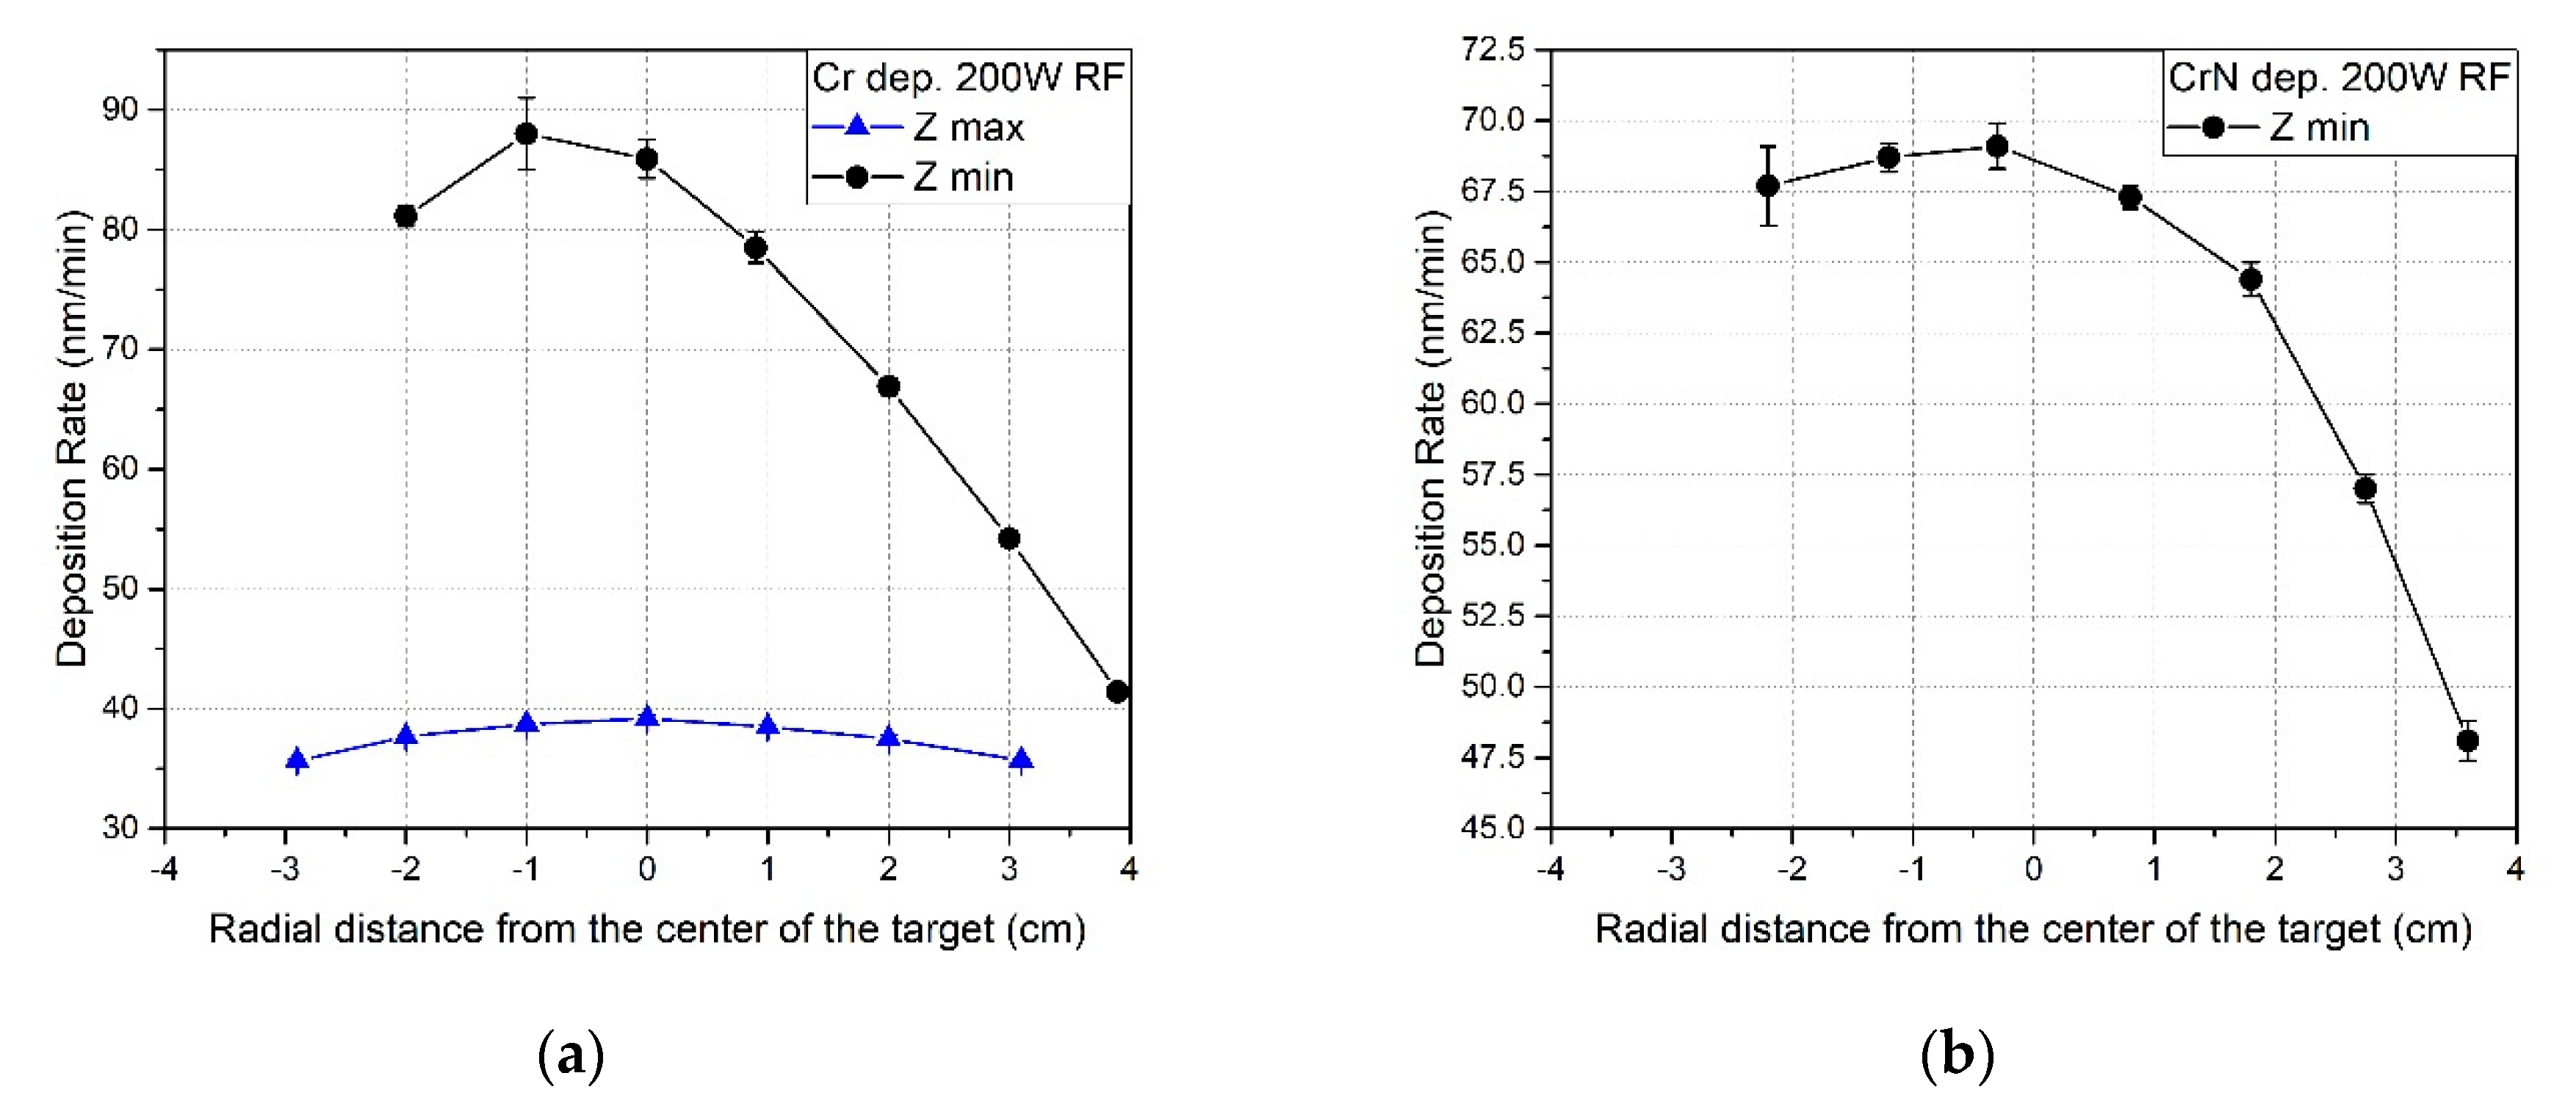
As can be seen in Figure A1a, the possible film thickness inhomogeneity was stronger when the substrate was closer to the target, i.e., the substrate holder height was minimum (Zmin), corresponding to black squares in the graph. The radial dependence for the deposition rate of CrN and DLC films realized at the minimum substrate height are reported in Figure A1b and Figure A2, respectively.
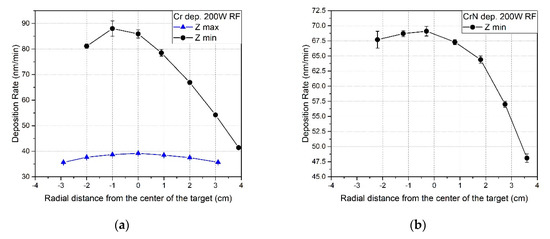
Figure A1.
Deposition rate (at 200 W RF) of (a) chromium for both maximum (blue triangles) and minimum (black circles) substrate–target distance and (b) CrN for the minimum substrate–target distance. The deposition rate is reported as a function of the radial distance from the center of the target, considering the positive values as points closer to the chamber wall and negative ones heading to the center of the deposition chamber.
Concerning the dependence on the discharge power supply, a decrease in the deposition rate decreasing the supply power was observed, which implies both a longer deposition duration and a limited film thickness. The principal deposition rates are listed in Table A1.
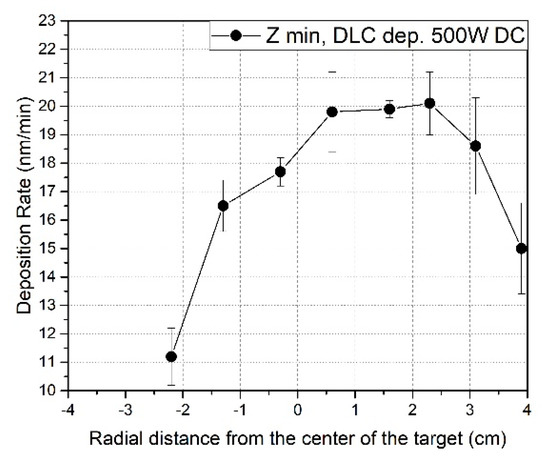
Figure A2.
Deposition rate (at 500 W DC) of DLC film for the minimum substrate–target distance in correspondence of the target. The deposition rate is reported as a function of the radial distance from the center of the target, considering the negative values as points closer to the chamber wall and positive ones heading to the center of the deposition chamber.
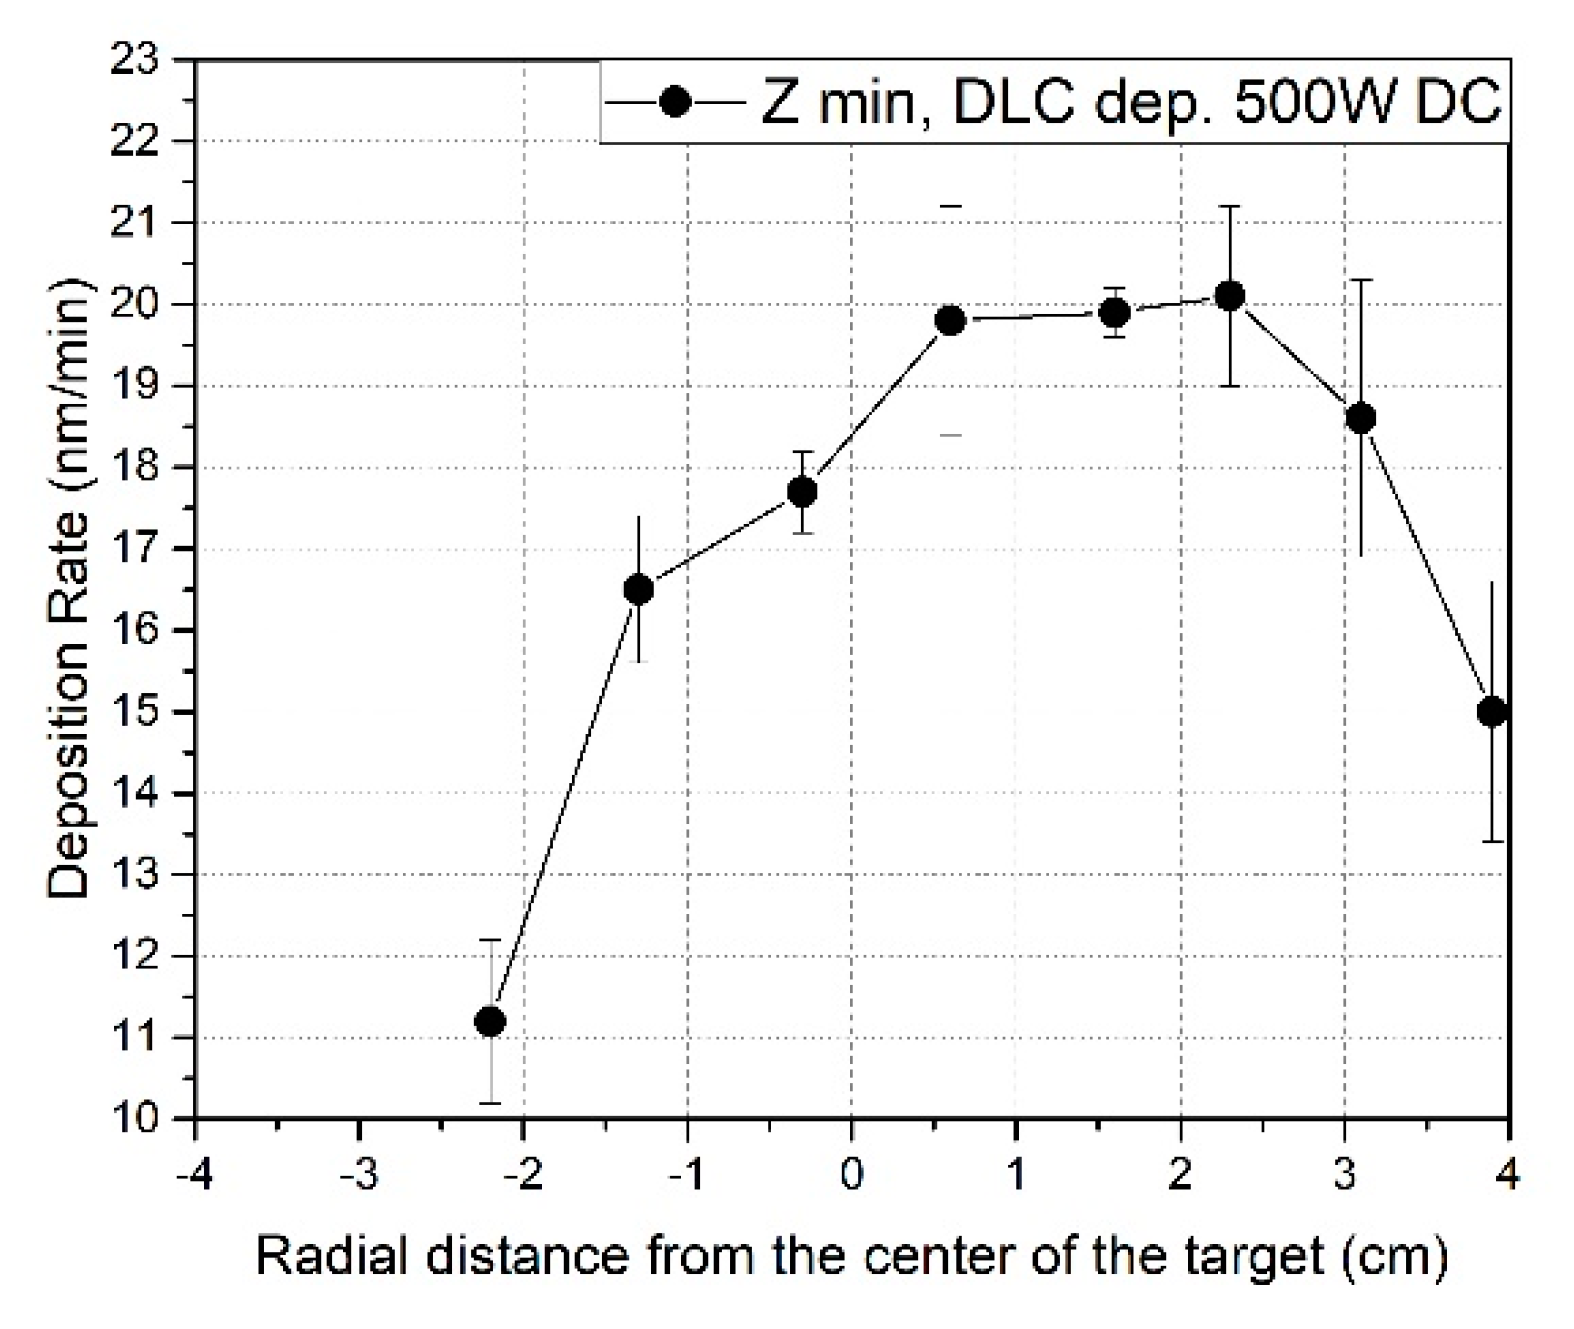

Table A1.
Maximum deposition rates for Cr and CrN films deposited at both Zmax and Zmin and DLC coatings deposited at different powers.
Table A1.
Maximum deposition rates for Cr and CrN films deposited at both Zmax and Zmin and DLC coatings deposited at different powers.
| Element–Compound | Deposition Rate (nm/min) |
|---|---|
| Cr (Zmax) | 39.2 ± 0.3 |
| Cr (Zmin) | 88 ± 3 |
| CrN (Zmax) | 7.0 ± 0.3 |
| CrN (Zmin) | 69.1 ± 0.8 |
| DLC (Zmin, 500W DC) | 20.1 ± 1.1 |
| DLC (Zmin, 200W DC) | 5.3 ± 0.6 |
| DLC (Zmin, 100W DC) | 2.32 ± 0.2 |
Appendix B
Raman spectroscopy has been widely used to evaluate the amount of sp3-hybridized C in DLC coatings [17]. Besides the intensity ratio between the D and G bands, I(D)/I(G), displayed in Section 3.1, the position of the G band, Pos(G), could provide information on the tetrahedral phase [17,41,65,66]. In fact, as the amount of sp3 C–C bonds increases, the G band moves towards a lower wavenumber. Furthermore, a monotonic but non-linear relation between the sp3 content and the FWHM(G) has been observed in hydrogen-free DLC [67].
Even if less explicit than the intensity ratio, the insight about the decrease of the sp3 content for DLC films deposited at Zmin using 500 W of discharge power could be derived also from the decrease in the FWHM of the G-band and its shift to higher wavenumbers, as can be seen in Table A2.

Table A2.
Raman parameters derived from the spectra deconvolution of the D and G bands. For all the possible deposition situations, we listed the position and the FWHM of band D and G.
Table A2.
Raman parameters derived from the spectra deconvolution of the D and G bands. For all the possible deposition situations, we listed the position and the FWHM of band D and G.
| Deposition Parameters | Pos(D) (cm−1) | FWHM(D) (cm−1) | Pos(G) (cm−1) | FWHM(D) (cm−1) |
|---|---|---|---|---|
| Zmin | ||||
| 100 W | 1325.4 ± 1.6 | 235.5 ± 0.1 | 1548.1 ± 1.0 | 179 ± 4 |
| 200 W | 1335.1 ± 0.4 | 276.2 ± 0.9 | 1582.2 ± 0.5 | 113.1 ± 0.8 |
| 500 W | 1323.3 ± 0.2 | 208 ± 2 | 1583.5 ± 0.14 | 110.0 ± 0.4 |
| Zmax | ||||
| 100 W | 1337.6 ± 1.3 | 281.5 ± 1.4 | 1580.8 ± 0.8 | 116.9 ± 0.2 |
| 200 W | 1330 ± 9 | 230 ± 12 | 1555 ± 5 | 177 ± 17 |
| 500 W | 1343 ± 2 | 298 ± 3 | 1579.2 ± 0.2 | 117.0 ± 0.9 |
References
- Kodali, P.; Walter, K.; Nastasi, M. Investigation of mechanical and tribological properties of amorphous diamond-like carbon coatings. Tribol. Int. 1997, 30, 591–598. [Google Scholar] [CrossRef]
- Ronkainen, H.; Varjus, S.; Holmberg, K. Friction and wear properties in dry, water-and oil-lubricated DLC against alumina and DLC against steel contacts. Wear 1998, 222, 120–128. [Google Scholar] [CrossRef]
- Matthews, A.; Eskildsen, S. Engineering applications for diamond-like carbon. Diam. Relat. Mater. 1994, 3, 902–911. [Google Scholar] [CrossRef]
- Mezzi, A.; Kaciulis, S. Surface investigation of carbon films: From diamond to graphite. Surf. Interface Anal. 2010, 42, 1082–1084. [Google Scholar] [CrossRef]
- Lifshitz, Y. Diamond-like carbon—Present status. Diam. Relat. Mater. 1999, 8, 1659–1676. [Google Scholar] [CrossRef]
- Bowden, F.; Young, J. Friction of diamond, graphite, and carbon and the influence of surface films. Proc. R. Soc. Lond. A Math. Phys. Eng. Sci. 1951, 208, 444–455. [Google Scholar]
- Bryant, P.; Gutshall, P.; Taylor, L. A study of mechanisms of graphite friction and wear. Wear 1964, 7, 118–126. [Google Scholar] [CrossRef]
- Cho, N.; Krishnan, K.; Veirs, D.; Rubin, M.; Hopper, C.; Bhushan, B.; Bogy, D. Chemical structure and physical properties of diamond-like amorphous carbon films prepared by magnetron sputtering. J. Mater. Res. 1990, 5, 2543–2554. [Google Scholar] [CrossRef]
- Brostow, W.; Lobland, H.E.H. Materials: Introduction and Applications; John Wiley & Sons: Hoboken, NJ, USA, 2016. [Google Scholar]
- Snyders, R.; Bousser, E.; Amireault, P.; Klemberg-Sapieha, J.E.; Park, E.; Taylor, K.; Casey, K.; Martinu, L. Tribo-Mechanical Properties of DLC Coatings Deposited on Nitrided Biomedical Stainless Steel. Plasma Process. Polym. 2007, 4, S640–S646. [Google Scholar] [CrossRef]
- Robertson, J. Properties of diamond-like carbon. Surf. Coat. Technol. 1992, 50, 185–203. [Google Scholar] [CrossRef]
- Diaz, J.; Paolicelli, G.; Ferrer, S.; Comin, F. Separation of the sp3 and sp2 components in the C1s photoemission spectra of amorphous carbon films. Phys. Rev. B 1996, 54, 8064. [Google Scholar] [CrossRef]
- Robertson, J. Structural models of aC and aC:H. Diam. Relat. Mater. 1995, 4, 297–301. [Google Scholar] [CrossRef]
- Liu, L.; Wang, T.; Huang, J.; He, Z.; Yi, Y.; Du, K. Diamond-like carbon thin films with high density and low internal stress deposited by coupling DC/RF magnetron sputtering. Diam. Relat. Mater. 2016, 70, 151–158. [Google Scholar] [CrossRef]
- Donnet, C.; Erdemir, A. Tribology of Diamond-like Carbon Films: Fundamentals and Applications; Springer Science & Business Media: Berlin, Gemany, 2007. [Google Scholar]
- Zhang, S.; Bui, X.L.; Fu, Y. Magnetron sputtered hard aC coatings of very high toughness. Surf. Coat. Technol. 2003, 167, 137–142. [Google Scholar] [CrossRef]
- Casiraghi, C.; Ferrari, A.; Robertson, J. Raman spectroscopy of hydrogenated amorphous carbons. Phys. Rev. B 2005, 72, 085401. [Google Scholar] [CrossRef]
- Siegal, M.; Barbour, J.; Provencio, P.; Tallant, D.; Friedmann, T. Amorphous-tetrahedral diamond like carbon layered structures resulting from film growth energetics. Appl. Phys. Lett. 1998, 73, 759–761. [Google Scholar] [CrossRef]
- Coşkun, Ö.D.; Zerrin, T. Optical, structural and bonding properties of diamond-like amorphous carbon films deposited by DC magnetron sputtering. Diam. Relat. Mater. 2015, 56, 29–35. [Google Scholar] [CrossRef]
- Gharam, A.A.; Lukitsch, M.; Qi, Y.; Alpas, A. Role of oxygen and humidity on the tribo-chemical behaviour of non-hydrogenated diamond-like carbon coatings. Wear 2011, 271, 2157–2163. [Google Scholar] [CrossRef]
- Erdemir, A.; Eryilmaz, O.; Kim, S. Effect of tribochemistry on lubricity of DLC films in hydrogen. Surf. Coat. Technol. 2014, 257, 241–246. [Google Scholar] [CrossRef]
- Ferrari, A.C.; Robertson, J. Raman spectroscopy of amorphous, nanostructured, diamond–like carbon, and nanodiamond. Philos. Trans. R. Soc. Lond. A Math. Phys. Eng. Sci. 2004, 362, 2477–2512. [Google Scholar] [CrossRef]
- Robertson, J. Deposition mechanisms for promoting sp3 bonding in diamond-like carbon. Diam. Relat. Mater. 1993, 2, 984–989. [Google Scholar] [CrossRef]
- Bhushan, B. Modern Tribology Handbook, Two Volume Set; CRC press: Boca Raton, FL, USA, 2000. [Google Scholar]
- Liu, Y.; Erdemir, A.; Meletis, E.I. A study of the wear mechanism of diamond-like carbon films. Surf. Coat. Technol. 1996, 82, 48–56. [Google Scholar] [CrossRef]
- Hirvonen, J.P.; Lappalainen, R.; Koskinen, J.; Anttila, A.; Jervis, T.R.; Trkula, M. Tribological characteristics of diamond-like films deposited with an arc-discharge method. J. Mater. Res. 1990, 5, 2524–2530. [Google Scholar] [CrossRef]
- Grill, A. Tribology of diamond-like carbon and related materials: An updated review. Surf. Coat. Technol. 1997, 94, 507–513. [Google Scholar] [CrossRef]
- Gangopadhyay, A. Mechanical and tribological properties of amorphous carbon films. Tribol. Lett. 1998, 5, 25–39. [Google Scholar] [CrossRef]
- Donnet, C.; Belin, M.; Auge, J.; Martin, J.; Grill, A.; Patel, V. Tribochemistry of diamond-like carbon coatings in various environments. Surf. Coat. Technol. 1994, 68, 626–631. [Google Scholar] [CrossRef]
- Cui, L.; Lu, Z.; Wang, L. Environmental effect on the load-dependent friction behavior of a diamond-like carbon film. Tribol. Int. 2015, 82, 195–199. [Google Scholar] [CrossRef]
- Erdemir, A. Genesis of superlow friction and wear in diamondlike carbon films. Tribol. Int. 2004, 37, 1005–1012. [Google Scholar] [CrossRef]
- Enke, K.; Dimigen, H.; Hübsch, H. Frictional properties of diamond-dlike carbon layers. Appl. Phys. Lett. 1980, 36, 291–292. [Google Scholar] [CrossRef]
- Voevodin, A.A.; Donley, M.S. Preparation of amorphous diamond-like carbon by pulsed laser deposition: A critical review. Surf. Coat. Technol. 1996, 82, 199–213. [Google Scholar] [CrossRef]
- Konca, E.; Cheng, Y.-T.; Alpas, A.T. Dry sliding behaviour of non-hydrogenated DLC coatings against Al, Cu and Ti in ambient air and argon. Diam. Relat. Mater. 2006, 15, 939–943. [Google Scholar] [CrossRef]
- Miyoshi, K. Studies of mechanochemical interactions in the tribological behavior of materials. Surf. Coat. Technol. 1990, 43, 799–812. [Google Scholar] [CrossRef]
- Godet, M. The third-body approach: A mechanical view of wear. Wear 1984, 100, 437–452. [Google Scholar] [CrossRef]
- Scharf, T.; Singer, I. Monitoring transfer films and friction instabilities with in situ Raman tribometry. Tribol. Lett. 2003, 14, 3–8. [Google Scholar] [CrossRef]
- Singer, I.; Dvorak, S.; Wahl, K.; Scharf, T. Role of third bodies in friction and wear of protective coatings. J. Vac. Sci. Technol. A 2003, 21, S232–S240. [Google Scholar] [CrossRef]
- Scharf, T.; Singer, I. Role of the transfer film on the friction and wear of metal carbide reinforced amorphous carbon coatings during run-in. Tribol. Lett. 2009, 36, 43–53. [Google Scholar] [CrossRef]
- Outka, D.; Hsu, W.L.; Phillips, K.; Boehme, D.; Yang, N.; Ottesen, D.; Johnsen, H.; Clift, W.; Headley, T. Compilation of Diamond-like Carbon Properties for Barriers and Hard Coatings; Technical Report; U.S. Department of Energy Office of Scientific and Technical Information: Oak Ridge, TN, USA, 1994. [Google Scholar]
- Ferrari, A.C.; Robertson, J. Interpretation of Raman spectra of disordered and amorphous carbon. Phys. Rev. B 2000, 61, 14095. [Google Scholar] [CrossRef]
- Sanchez-Lopez, J.; Donnet, C.; Loubet, J.; Belin, M.; Grill, A.; Patel, V.; Jahnes, C. Tribological and mechanical properties of diamond-like carbon prepared by high-density plasma. Diam. Relat. Mater. 2001, 10, 1063–1069. [Google Scholar] [CrossRef]
- Pharr, G.; Oliver, W. Measurement of thin film mechanical properties using nanoindentation. MRS Bull. 1992, 17, 28–33. [Google Scholar] [CrossRef]
- Xie, Z.H.; Singh, R.; Bendavid, A.; Martin, P.; Munroe, P.; Hoffman, M. Contact damage evolution in a diamond-like carbon (DLC) coating on a stainless steel substrate. Thin Solid Film 2007, 515, 3196–3201. [Google Scholar] [CrossRef]
- Chang, C.L.; Wang, D.Y. Microstructure and adhesion characteristics of diamond-like carbon films deposited on steel substrates. Diam. Relat. Mater. 2001, 10, 1528–1534. [Google Scholar] [CrossRef]
- Kuiry, S. Advanced Scratch Testing for Evaluation of Coatings. Available online: https://www.bruker.com/fileadmin/user_upload/8-PDF-Docs/SurfaceAnalysis/TMT/Webinars/Advanced-Scratch-Testing-for-Evaluation-of-Coatings-Slides.pdf (accessed on 23 April 2019).
- Pagnoux, G.; Fouvry, S.; Peigney, M.; Delattre, B.; Mermaz-Rollet, G. Mechanical behavior of DLC coatings under various scratch conditions. In Proceedings of the 3rd Internation Conference on Fracture Fatigue and Wear, Kitakyushu, Japan, 1–3 September 2014. [Google Scholar]
- Merel, P.; Tabbal, M.; Chaker, M.; Moisa, S.; Margot, J. Direct evaluation of the sp3 content in diamond-like-carbon films by XPS. Appl. Surf. Sci. 1998, 136, 105–110. [Google Scholar] [CrossRef]
- Yang, M.; Marino, M.J.; Bojan, V.J.; Eryilmaz, O.L.; Erdemir, A.; Kim, S.H. Quantification of oxygenated species on a diamond-like carbon (DLC) surface. Appl. Surf. Sci. 2011, 257, 7633–7638. [Google Scholar] [CrossRef]
- Popov, C.; Kulisch, W.; Bliznakov, S.; Mednikarov, B.; Spasov, G.; Pirov, J.; Jelinek, M.; Kocourek, T.; Zemek, J. Characterization of the bonding structure of nanocrystalline diamond and amorphous carbon films prepared by plasma assisted techniques. Appl. Phys. A 2007, 89, 209–212. [Google Scholar] [CrossRef]
- Robertson, J. The deposition mechanism of diamond-like aC and aC:H. Diam. Relat. Mater. 1994, 3, 361–368. [Google Scholar] [CrossRef]
- Owens, A.G.; Brühl, S.; Simison, S.; Forsich, C.; Heim, D. Comparison of tribological properties of stainless steel with hard and soft DLC coatings. Procedia Mater. Sci. 2015, 9, 246–253. [Google Scholar] [CrossRef]
- Donnet, C. Recent progress on the tribology of doped diamond-like and carbon alloy coatings: A review. Surf. Coat. Technol. 1998, 100, 180–186. [Google Scholar] [CrossRef]
- Kim, H.I.; Lince, J.R.; Eryilmaz, O.L.; Erdemir, A. Environmental effects on the friction of hydrogenated DLC films. Tribol. Lett. 2006, 21, 51–56. [Google Scholar] [CrossRef]
- Li, H.; Xu, T.; Wang, C.; Chen, J.; Zhou, H.; Liu, H. Annealing effect on the structure, mechanical and tribological properties of hydrogenated diamond-like carbon films. Thin Solid Film 2006, 515, 2153–2160. [Google Scholar] [CrossRef]
- Burnett, P.J.; Rickerby, D.S. The relationship between hardness and scratch adhession. Thin Solid Film 1987, 154, 403–416. [Google Scholar] [CrossRef]
- Perry, A.J. Scratch adhesion testing of hard coatings. Thin Solid Film 1983, 107, 167–180. [Google Scholar] [CrossRef]
- Kato, K. Wear in relation to friction—A review. Wear 2000, 241, 151–157. [Google Scholar] [CrossRef]
- Bandorf, R.; Lüthje, H.; Wortmann, A.; Staedler, T.; Wittorf, R. Influence of substrate material and topography on the tribological behaviour of submicron coatings. Surf. Coat. Technol. 2003, 174, 461–464. [Google Scholar] [CrossRef]
- Bhargava, G.; Gouzman, I.; Chun, C.M.; Ramanarayanan, T.A.; Bernasek, S.L. Characterization of the “native” surface thin film on pure polycrystalline iron: A high resolution XPS and TEM study. Appl. Surf. Sci. 2007, 253, 4322–4329. [Google Scholar] [CrossRef]
- Lin, T.C.; Seshadri, G.; Kelber, J.A. A consistent method for quantitative XPS peak analysis of thin oxide films on clean polycrystalline iron surfaces. Appl. Surf. Sci. 1997, 119, 83–92. [Google Scholar] [CrossRef]
- Papakonstantinou, P.; Zhao, J.F.; Richardot, A.; McAdams, E.T.; McLaughlin, J.A. Evaluation of corrosion performance of ultra-thin Si-DLC overcoats with electrochemical impedance spectroscopy. Diam. Relat. Mater. 2002, 11, 1124–1129. [Google Scholar] [CrossRef]
- Choi, J.; Nakao, S.; Kim, J.; Ikeyama, M.; Kato, T. Corrosion protection of DLC coatings on magnesium alloy. Diam. Relat. Mater. 2007, 16, 1361–1364. [Google Scholar] [CrossRef]
- Kim, H.G.; Ahn, S.H.; Kim, J.G.; Park, S.J.; Lee, K.R. Corrosion performance of diamond-like carbon (DLC)-coated Ti alloy in the simulated body fluid environment. Diam. Relat. Mater. 2005, 14, 35–41. [Google Scholar] [CrossRef]
- Robertson, J. Diamond-like amorphous carbon. Mater. Sci. Eng. 2002, 37, 129–281. [Google Scholar] [CrossRef]
- Ferrari, A.C. Determination of bonding in diamond-like carbon by Raman Spectroscopy. Diam. Relat. Mater. 2002, 11, 1053–1061. [Google Scholar] [CrossRef]
- Cui, W.G.; Lai, Q.B.; Zhang, L.; Wang, F.M. Quantitative measurements of sp3 content in DLC films with Raman spectroscopy. Surf. Coat. Technol. 2010, 205, 1995–1999. [Google Scholar] [CrossRef]
© 2019 by the authors. Licensee MDPI, Basel, Switzerland. This article is an open access article distributed under the terms and conditions of the Creative Commons Attribution (CC BY) license (http://creativecommons.org/licenses/by/4.0/).

