Simple Summary
Insects have been considered as an alternative to fishmeal in animal feed formulations. Current methods for mass producing them remain expensive and, although cost is not the current market driver for insect products, they remain off the main stream. One way to reduce production costs is to lower the cost of insect diets. This could be accomplished by using agricultural by-products as ingredients to formulate insect diets. In this study 20 ingredients were tested as dietary components for the yellow mealworm. Ingredients included dry potato and cabbage; the bran of wheat and rice; by-product meals from vegetable oil production; spent distiller’s grains from brewery and ethanol production; and hulls of different grains. A method called self-selection was used to approach the optimal proportion of these ingredients in mealworm diets by measuring their relative consumption. Nine combinations of eight ingredients were presented to groups of mealworms while carefully measuring the relative consumption of each ingredient. Results showed that the most suitable ingredients for mealworm production were dry cabbage and potato, the bran of wheat and rice, the meals of canola and sunflower, and distilled grains from corn and barley. This information will be used to formulate and evaluate diet formulations for the yellow mealworm in future research.
Abstract
Nutrient self-selection was used to determine optimal intake ratios of macro-nutrients by Tenebrio molitor L. larvae. Self-selection experiments consisted of 9 combinations (treatments) of 8 ingredients, from a total of 20 choices, radially distributed in a multiple-choice arena presented to groups of 100 T. molitor larvae (12th–13th instar). Larvae freely selected and feed on the pelletized ingredients for a period of 21 days at 27 °C, 75% RH, and dark conditions. Consumption (g) of each ingredient, larval live weight gained (mg), and frass production were recorded and used to calculate food assimilation and efficiency of conversion of ingested food. The macro-nutrient intake ratios were 0.06 ± 0.03, 0.23 ± 0.01, and 0.71 ± 0.03 for lipid, protein, and carbohydrate, respectively on the best performing treatments. The intake of neutral detergent fiber negatively impacted food assimilation, food conversion and biomass gain. Food assimilation, food conversion, and biomass gain were significantly impacted by the intake of carbohydrate in a positive way. Cabbage, potato, wheat bran, rice bran (whole and defatted), corn dry distillers’ grain, spent brewery dry grain, canola meal and sunflower meal were considered suitable as T. molitor diets ingredients based on their relative consumption percentages (over 10%) within treatment.
1. Introduction
In recent years, the yellow mealworm, Tenebrio molitor L. (Coleoptera: Tenebrionidae) has been considered as a potential source of animal protein in feeds for fish [1,2,3,4,5,6] and livestock [7,8,9,10,11,12,13,14]. An increasing number of companies have been founded every year since 2013 that focus on insect mass production as animal feed [15]. One of the most important aspects of mass production involves the formulation of inexpensive yet effective diets that maximize biomass productivity over time. Recent research has focused on the potential use of agricultural by-products as insect food to reduce production costs of insect biomass [16,17,18,19]. However, current studies on T. molitor have focused on the effects of single ingredients on biological and food utilization parameters. No attempts have been made to evaluate combinations of multiple by-products as ingredients with the aim to develop diets for T. molitor. Self-selection studies incorporating by-products have been used to develop complete diets for the house cricket, Acheta domesticus L. [20].
Developing adequate diet formulations for insects using multiple undefined (oligidic) ingredients is a complex procedure and can take multiple years of research, particularly in insect species with long life cycles such as T. molitor. Optimal diets can be obtained from multiple oligidic ingredients by allowing insects to select the optimal ratios of each ingredient in a multiple-choice experimental setting. This method is known as self-selection and was first proposed by Waldbauer and Friedman (1991) [21]. The objectives of this study were to (1) determine the ingredients with the highest potential for formulation of insect diets using the self-selection method, (2) establish the optimal macro-nutrient intake ratios of T. molitor based on the self-selected intake of 20 ingredients, and (3) explore the impact of intake of macro-nutrients, neutral detergent fiber (NDF), phytosterol, and minerals including Fe, Mg, Ca, Zn, Cu, and Mn on the biomass gain, food assimilation and efficiency of conversion of ingested food (ECI).
2. Materials and Methods
2.1. Experimental Design
The colony stock, the rearing procedures and rearing hardware used in this study were as described by Morales-Ramos et al. [22]. Larvae of T. molitor used in the experiments were separated by size from the stock colony using sifters of standard numbers 10 and 12, which selected larvae with head capsule width measuring between 1.4 to 2 mm. According to estimates by Morales-Ramos et al. [23] these head capsule measurements correspond to larvae between 3 and 5 instars prior to pupation, which could include instars 11 to 14. However, because the stock used in this study has been selected for larger size, the experimental group of larvae could have included earlier instars.
Experimental units consisted of groups of 100 larvae maintained in multiple-choice arenas designed to provide equal access to 8 different food choices. Groups of larvae from each experimental unit were weighed at the beginning and end of the experiment and their weight was recorded for each of the units of each treatment. The multiple-choice arenas consisted of breathable round plastic dishes (120 × 25 mm, Pioneer Plastics 53C, Pioneer Plastics, North Dixon, KY, USA) modified by the addition of 8 sample plastic vials 20 mL (72 mm height × 25 mm diameter) (Product # 73400, Kartell s. p. a., Noviglio, Milan, Italy). The sample vials were cut to a height of 35 mm to fit inside the dishes and assembled perpendicularly to the dish in a radial pattern (45° apart) with equal distance to the center of the dish (Figure 1A). A 5 mm diameter opening was drilled into one side of each of the vials pointing perpendicularly to the center of the dish, to allow larvae to enter the vials (Figure 1B, a). A depression (90 × 2 mm) was constructed at the center of the dish with screened bottom (0.5 mm screen openings) to allow the collection of frass in a second dish located under the arena (Figure 1).
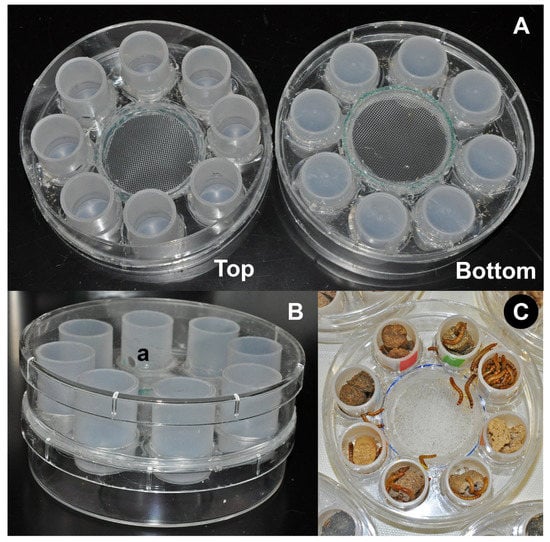
Figure 1.
Multiple-choice arenas for self-selection experiments: (A) top and bottom views; (B) assembled arena with cover and bottom dish; (C) experimental unit with food choices and larvae, (a) opening into modified vial as food-choice compartment.
2.2. Food-Choice Treatments
Food choices consisted of 20 food products and agricultural by-products, which included dry white cabbage, potato flour, alfalfa pellets, wheat bran, rice bran (whole and solvent defatted), spelt screenings; meals from canola, soybean, olive, sunflower, cotton, and kelp; hulls from rice, oat, and peanut, and coffee chaff; and dry distilled grains from corn, wheat, and barley from ethanol production and brewery. Nine treatments of eight different combinations of these food choices were selected for the study (Table 1). The criterium of selection for the combination treatments was based on the relative content of each of the macro-nutrients (protein, lipid, and carbohydrate) and dietary fiber as neutral detergent fiber (NDF). Combinations should contain at least one food choice with high content of each of the macro-nutrients and dietary fiber to allow the mealworm larvae to select a complete diet. For instance, diet 1 contains canola meal as high protein ingredient, potato flour as high carbohydrate, corn distilled grain and dry cabbage for lipids and hulls from peanuts and rice as high fiber ingredients (Table 1).

Table 1.
Combination of eight food choices presented to Tenebrio molitor larvae groups in nine self-selection treatments.
Food ingredients were ground into a fine powder using a high-speed food processor. Powdered food ingredients were individually mixed with reverse osmosis (RO) water at 50% to 70% ratio to obtain a consistency of dough. The food ingredients were then formed into sticks using a cut 10 mL syringe. These sticks were dried in a vacuum oven at 50 °C for a period of 48 h. This procedure resulted in stable dry sticks of each of the food ingredients listed in Table 1 with dimensions that allowed them to be introduced in the compartments of the multiple-choice arenas (Figure 1C).
Food combination treatments consisted of 10 repetitions each (=10 experimental units totaling 1000 larvae). Food ingredients were randomly distributed in the arena compartments to minimize the proximity effects among the different ingredients. At the beginning of the experiment, a measured amount of each of the corresponding food ingredients was added to the corresponding arena compartment in each of the experimental units. The initial amount of each food ingredient provided was recorded for each of the experimental units from each of the combination treatments. Experimental units were maintained in environmental chambers at 27 °C, 75% RH (relative humidity) and dark conditions for a period of three weeks. Experimental units were monitored daily to observe the consumption of each of the ingredients. Food ingredients that were depleted by consumption, were replenished with a measured amount of the corresponding food ingredient, which was recorded for each of the experimental units.
2.3. Data Collection and Analysis
At the end of a three-week period, larvae from each experimental unit were counted and weighed alive as a group. The remaining food was collected separately by ingredient, separated from frass, dried in a vacuum oven, and weighed. Frass was separated from food by sifting the remains using a standard No. 35 sieve (0.5 mm openings). The frass was collected, dried, and weighed using the same drying procedure. To collect the remaining food, all the vials in the arena were capped, the arena was inverted, and the contents of each vial were emptied, one by one, into a standard number 35 sieve by removing the cap to separate food from frass. The consumption of each ingredient (Ii) was calculated as total weight added of ingredient ‘i’—remaining weight of ingredient ‘i’, were i = 1 to 8. The total food consumption (FC) was calculated as the sum of the consumption of all the eight ingredients. Assimilated food (AF) was calculated as AF = FC − frass weight. The percent consumption of each ingredient was calculated as (Ii/FC) × 100. The weight of live mealworm biomass gained (LWG) was calculated as ending group weight—initial group weight. Mortality was extremely low (0.32 ± 0.21%) and dead larvae were cannibalized by surviving larvae (no cadavers were found), therefore, the ending live biomass measure per group included the loss of biomass due to mortality. Because the initial biomass dry weight could not be directly determined, the dry weight biomass gained (DWG) was calculated as LWG × the proportion of dry matter of mealworm larvae. The proportion of dry weight of mealworm larvae was previously determined from 25 groups of 10 larvae, which were weighed live, then frozen at −25 °C, dried in a vacuum oven at 50 °C, and weighed dry. The dry weight proportion of T. molitor late instar larvae was 0.38. The efficiency of conversion of ingested food (ECI) was calculated based on Waldbauer [24] as ECI = (DWG/FC) × 100 for each experimental unit.
Nutrient intake by T. molitor larvae was estimated from the self-selected consumption of the choice ingredients using the nutrient matrix calculation described by Morales-Ramos et al. [20,25]. The macro nutrient (lipid, protein and carbohydrate) content of the ingredients used in this study was obtained from data published in multiple sources [26,27,28,29,30,31,32,33,34,35,36,37]. The nutrient intake data was used to calculate the 3-way ratios of macro nutrient intake as described by Morales-Ramos et al. [25] and calculated as protein intake ratio = Pi/MNi, lipid intake ratio = Li/MNi, and carbohydrate intake ratio = Ci/MNi, where Pi, Li, and Ci are intakes of protein lipid and carbohydrate, respectively and MNi is the total intake of all three macronutrients and the sum of all three ratios is always = 1. The intake of other nutrients including neutral detergent fiber (NDF) and minerals including iron, magnesium, manganese, calcium, and zinc was also estimated.
Data consisting of live biomass gained, total food consumption, percent food assimilation, and efficiency of conversion of ingested food were compared among treatments using general linear mixed model (GLMM) and the Tukey–Kramer HSD (honestly significant difference) test for least square means of JMP software version 14.1 [38]. The effect of nutrient intake on food assimilation and efficiency of food conversion (ECI) was analyzed using multiple regression. The stepwise followed by backwards elimination methods were used to determine the optimal number of independent variables required in the model to explain food assimilation and ECI using the Cp statistic as the criterion to include or exclude variables [38,39,40].
3. Results
The means of consumption of each of the ingredients within each of the combination treatments are presented in Table 2. The relative consumption of each ingredient within combination treatments is illustrated as percentages in Figure 2. The ingredients that were consumed in higher proportion were dry potato in treatment 8 (41.01%); crude rice bran in treatments 3, 4, 5, 6, and 7 (40.47%, 34.87%, 30.37%, 32.27% and 33.18%, respectively); wheat bran in treatments 1 and 9 (30.49% and 37.1%, respectively); and corn dry distiller’s grain with solubles (DDGS)in treatment 2 (34.63%). The least consumed ingredients were rice hulls in treatments 1 and 2 (0.31% and 0.13%, respectively); coffee chaff in treatment 8 (1.48%); peanut hulls in treatments 3, 6 and 7 (1.66%, 2.77%, and 3.19%, respectively); soybean meal in treatment 9 (2.06%); olive meal in treatment 4 (2.27%); and sunflower meal in treatment 5 (2.58%) (Figure 2). In general, highly consumed ingredients had a high carbohydrate content. The ingredients consumed in low percentages generally contained high amounts of fiber at the expense of other nutrients, such as rice hulls, coffee chaff and peanut hulls or have a combination of high fiber and high protein contents like meals of olive, soybean and sunflower.
Table 2.
Dry-weight consumption (g) of food ingredients by T. molitor larvae in nine self-selection treatment combinations of eight choices during a three-week period.
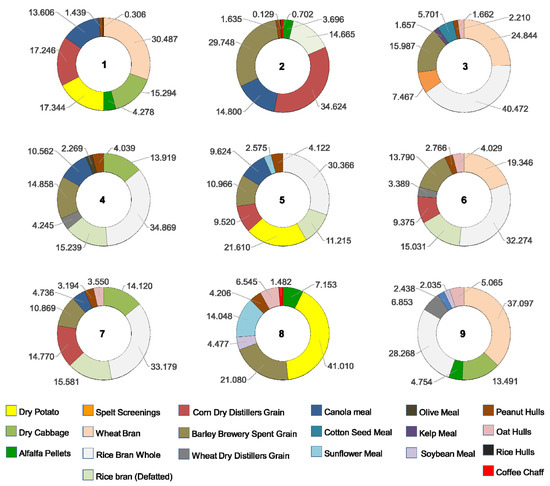
Figure 2.
Proportional consumption of food ingredients by T. molitor larvae in nine treatments of different combinations of eight ingredients.
Despite the great diversity observed in the relative consumption of ingredients between treatments, the intake ratios of macro nutrients (lipid + protein + carbohydrate = 1) tended to converge close to a set of ranges between 0.03 to 0.16 of lipid, 0.21 to 0.25 of protein and 0.62 to 0.74 of carbohydrate (Table 3, Figure 3) with overall means of 0.1 ± 0.04, 0.24 ± 0.04, and 0.66 ± 0.06 for lipid, protein, and carbohydrate, respectively. The only exception was treatment 2 which showed significantly higher protein (0.36) (F = 379.1; df 8, 81; p < 0.0001) and lower carbohydrate (0.55) (F = 460.8; df 8, 81; p < 0.0001) intake ratio than all the other treatments (Table 3) outlying visibly in the graph of Figure 3. However, the rest of the treatments showed some significant differences among them in the macro nutrient intake ratios (F = 304, 379.1, and 460.8 for lipid, protein and carbohydrate, respectively; df 8, 81; p < 0.0001) that were less obvious in Figure 3 (Table 3).
Table 3.
Macro nutrient intake ratios of T. molitor larvae in nine self-selection treatments with different combinations of eight food ingredients.
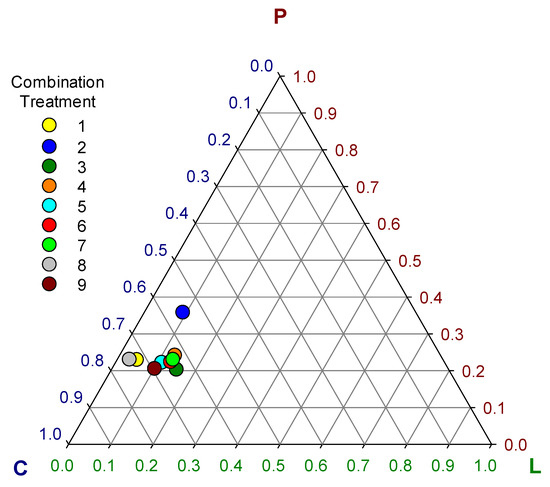
Figure 3.
Ternary plot of self-selected macro-nutrient intake ratios (L = lipid, P = protein, C = carbohydrate) in nine combination treatments of eight ingredients.
These differences in the intake ratios of macro nutrients resulted in significant differences in group live biomass gain (F = 10.15; df = 8, 81; p < 0.0001), overall dry-weight food consumption (F = 10.91; df = 8, 81; p < 0.0001), food assimilation (F = 29.13; df = 8, 81; p < 0.0001), and ECI (F = 28.41; df = 8, 81; p < 0.0001) among choice treatments (Figure 4). The highest live biomass gain was observed in treatment 5 (7.3 ± 0.28 g), followed by treatments 1 (6.91 ± 0.41 g) and 7 (6.83 ± 0.74 g). The highest assimilation was observed in treatment 8 (55.25 ± 2.03%) followed by treatment 5 (50.86 ± 1.86%). The highest ECI was observed in treatment 5 (9.87 ± 0.45%) followed by treatment 8 (9.48 ± 0.64%). In general, the best performing treatments were 5, 8, and 1 (Figure 4). Treatment 2 was the worst performer among choice treatments, showing the lowest live biomass gain (5.45 ± 0.49 g), the lowest food assimilation (39.19 ± 2.11%), and the lowest ECI (7.18 ± 0.5%) (Figure 4). The low performance of larvae groups of treatment 2 may be associated with the significant deviations in macronutrient intake ratios observed in this treatment (Figure 3). The optimal macro-nutrient ratios for T. molitor may be closer to those observed in average for treatments 1, 5, and 8, which were 0.06 ± 0.03, 0.23 ± 0.01, and 0.71 ± 0.03 for lipid, protein, and carbohydrate, respectively.
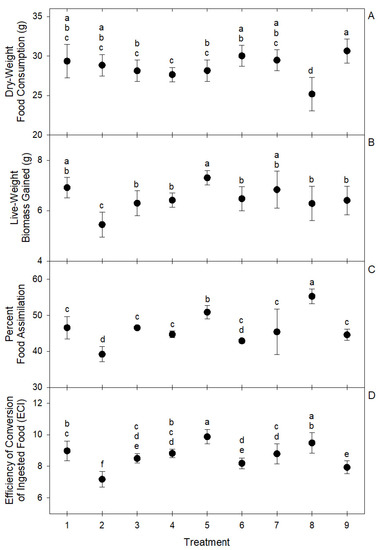
Figure 4.
Circles represent means and brackets represent standard deviation of (A) dry-weight food consumption, (B) live biomass gain, (C) percent food assimilation, and (D) efficiency of conversion of ingested food (ECI) by groups of 100 T. molitor larvae in nine self-selection treatments of eight ingredients. Means with the same letter are not significantly different at α = 0.05 after Tukey–Kramer HSD test.
Live biomass gain was significantly impacted by efficiency of food conversion (ECI) (R2 = 0.53; F = 100.74; df = 1, 88; p < 0.0001) and food assimilation (R2 = 0.13; F = 13.35; df = 1, 88; p = 0.0004) in a positive way. Consumption of some ingredients have significant effects on biomass gain, food assimilation and ECI. For instance, consumption of potato had a significant positive effect on food assimilation (β = 0.01; R2 = 0.57; F = 116.64; df = 1, 88; p < 0.0001), but consumption of corn DDGS had the opposite effect on food assimilation (β = −0.007; R2 = 0.21; F = 23.0; df = 1, 88; p < 0.0001).
Ingredients that had a mean consumption percentage of at least 10% in any given choice treatment were considered relevant ingredients (RI). Relevant ingredients included potato, cabbage, wheat bran, crude rice bran, defatted rice bran, corn DDGS, spent brewery DG, canola meal, and sunflower meal. Multiple regression analysis indicated that the consumption of all the relevant ingredients had a significant positive effect on live biomass gain (R2 = 0.7; F = 20.75; df = 9, 80; p < 0.0001). Only consumption of potato, cabbage, rice bran whole, and spent brewery DG had a significant positive effect on food assimilation (partial F Ratios = 49.47, 12.17, 6.62, and 8.55; df = 9, 80; p < 0.0001, = 0.0008, = 0.0119, and = 0.0045, respectively). Significant negative effects on food assimilation were observed with consumption of canola and sunflower meals (partial F Ratios = 6.39 and 4.49; df 9, 80; p = 0.0135 and 0.0371, respectively). The resulting optimized model for assimilation (after stepwise) agreed with the full model analysis including the 6 variables that showed significant effects on food assimilation (R2 = 0.75; p = 42.6; df = 6, 83; p < 0.0001). In the full model (9 independent variables) the efficiency of food conversion (ECI) was only affected significantly by the consumption of potato, and this effect was positive (partial F Ratio = 13.31; df 9, 80; p = 0.0005). However, when this model was analyzed with the stepwise method, an optimized 3-variable model resulted that included potato, rice bran, and canola meal all affecting ECI significantly and positively (R2 = 0.64; p = 49.9; df = 3, 88; p < 0.0001). Significant quadratic effects on live biomass gain were observed from consumption of potato (β1 = 0.146, β2 = −0.023; R2 = 0.18; F = 9.47; df = 2, 87; p = 0.0002), corn DDGS (β1 = 0.077, β2 = −034; R2 = 0.38; F = 26.2; df = 2, 87; p < 0.0001) and spent brewery DG (β1 = −0.105, β2 = −0.024; R2 = 0.27; F = 16.02; df 2, 87; p < 0.0001). Biomass gain was maximized at an intermediate level of consumption of these three ingredients.
Intake ratios of some nutrients had a significant impact on food assimilation and efficiency of food conversion (ECI). The optimal multiple regression models obtained after stepwise and backwards elimination procedures consisted of only 2 dependent variables explaining food assimilation and 4 variables explaining ECI. Models are valid only within the ranges observed for these variables, presented in Table 4. Food assimilation was impacted significantly by carbohydrate and neural detergent fiber (R2 = 0.73; F = 117.93; df = 2, 87; p < 0.0001) (Table 5). These two variables also impacted ECI in addition to the minerals Mg and Mn (R2 = 0.73; F = 57.48; df = 4, 85; p < 0.0001) (Table 6).
Table 4.
Summarized estimated nutrient intake means and ranges in 90 self-selection observations from 9 different 8-choice combination treatments (in mg/100 mg).
Table 5.
Model from stepwise on percent assimilation.
Table 6.
Model from Stepwise and backwards elimination on ECI.
4. Discussion
It is apparent by the results presented in this study that T. molitor larvae tend to balance their intake of macro nutrients by selecting among a variety of ingredients when feeding. This agrees with previous studies confirming the ability of T. molitor to self-select for optimal macro-nutrient intake ratios [41,42,43,44]. The intake ratios of macro nutrients by T. molitor larvae converged within a narrow range of values among eight of the nine combination treatments of different food ingredients. Treatment 2 was the exception showing excess intake of protein and reduced intake of carbohydrate. Deviation of macro-nutrient intake ratios observed in treatment 2 coincided with a low performance of growth and food utilization of the larvae grown in this treatment. The reason for the deviations in macro-nutrient intake ratios observed in treatment 2 may have been the absence of an additional ingredient with low protein content besides defatted rice bran. There was an unusually high consumption of corn DDGS (34.66 ± 4.13%) and spent brewery DG (29.75 ± 1.46%) in this treatment resulting in a combined mean consumption of 64.41% of these two ingredients from the mean total food consumption in treatment 2. In the other three treatments where these two ingredients were present together (treatments 5, 6, and 7), their combined consumption did not exceed 26% of the total food consumed. Additionally, consumption of corn DDGS and spent brewery DG did not exceed 21.5% when presented alone within the food choices (treatments 1, 3, 4, and 8). The high consumption of these two distilled grain ingredients in treatment 2 is itself an anomaly and may have been driven by the need for lipid intake, which was extremely low (lower than 3.6%) in the rest of the ingredients presented in treatment 2: two defatted ingredients (canola meal and rice bran defatted), alfalfa pellets, the hulls of peanut and rice, and coffee chaff [26,27,33,34]. The lipid content of corn DDGS and spent brewery DG is reported to be higher than 8% [26,27,30,34,35,37].
The optimal macro nutrient ratios for T. molitor may be those observed in the best performing treatments (1, 5, and 8): 0.06 ± 0.03 (max 0.12 min 0.03), 0.23 ± 0.01 (max 0.25 min 0.2), and 0.71 ± 0.03 (max 0.75 min 0.65) for lipid, protein, and carbohydrate, respectively. Rho and Lee (2016) [45] determined that an equal ratio of protein and carbohydrate was the best for T. molitor based on adult fecundity and longevity. However, this study is not comparable with ours because both studies were done on different life stages and measured different life cycle parameters.
Ingredients that were considered relevant based on relative consumption percentage (over 10%) included potato, cabbage, wheat bran, crude rice bran, defatted rice bran, corn DDGS, spent brewery DG, canola meal, and sunflower meal. Multiple regression analyses of consumption of relevant ingredients versus live biomass gain showed significant positive effects. These results can be interpreted as evidence that such ingredients are suitable for inclusion in diets for T. molitor, especially when biomass production is one of the main priorities. However, consumption of relevant ingredients did not always have positive effects on food assimilation. For instance, canola and sunflower meals had significant negative effects on assimilation. Food assimilation is not necessarily critical for biomass production when the food provided has a low cost, as in this case where agricultural by-products are used. Analysis of nutrient intake ratios showed that intake of fiber negatively affects food assimilation. This may explain the negative effects of canola and sunflower meals on assimilation, since both meals have a relatively high fiber content. Food conversion efficiency (ECI) was impacted positively by the consumption of potato, rice bran and canola meal. Because both food assimilation and ECI significantly impacted biomass gain in a positive way, we may consider the ingredients that impact both parameters in a positive way as highly suitable for inclusion in insect diets. Potato, rice bran, cabbage, spent brewery DG, and canola meal seem to be highly suitable as ingredients in T. molitor diets, but defatted rice bran, corn DDGS, and sunflower meal are promising if provided in the correct proportions. Wheat bran, potato, and cabbage have been used and are currently used regularly in T. molitor diets for mass production [46]. The rest of the ingredients are not currently used in commercial production, but some studies have assessed their potential, such as on spent brewery DG [32].
Macro-nutrient intake ratios were an important factor affecting live biomass gain, food assimilation and ECI. Macro-nutrient ratios were optimal for T. molitor within ranges of 0.06 ± 0.03, 0.23 ± 0.01, and 0.71 ± 0.03 for lipid, protein, and carbohydrate, respectively. Nutrient intake analyses showed that the intake of carbohydrate significantly and positively impacted live biomass gain, food assimilation and ECI. The intake of protein did not impact these three parameters within the ranges observed in this study. It appears that protein intake was strongly regulated by self-selection in most treatments, with the only exception of treatment 2. Other studies have reported that high protein intake reduce development time and pupal size [42] and increased adult longevity and fecundity [43]. In this study the impact of high intake of protein on biomass productivity and food utilization was negative. High intake levels of fiber also had a negative impact on food assimilation and ECI. Li et al. (2015) [47] reported that the optimal intake levels of crude fiber for T. molitor is within a range of 5 to 10%. In this study we did not compare intakes of crude fiber, but the self-selected percentages of ND fiber were between 22.52 ± 0.62% in treatment 5 and 34.94 ± 0.94% in treatment 9.
5. Conclusions
The macro-nutrient intake ratios resulting from ingredient self-selection by T. molitor fell within narrow margins: Lipid intake was between 0.12 and 0.03, protein between 0.25 and 0.2, and carbohydrate between 0.75 and 0.65. Deviations from these ranges of macro nutrient intake ratios resulted in a diminished performance in larval growth and food utilization.
The relevant ingredients, based on their relative consumption by T. molitor larvae included potato, cabbage, wheat bran, crude rice bran, defatted rice bran, corn DDGS, spent brewery DG, canola meal, and sunflower meal. Consumption of relevant ingredients significantly affected live biomass production in a positive way in T. molitor larvae.
Both food assimilation and efficiency of conversion of ingested food were positively impacted by ingestion of carbohydrate and negatively impacted by ingestion of fiber. Ingredients that enhanced both of these parameters had relatively high carbohydrate and low fiber content such as potato. However, levels of carbohydrate and fiber should not depart from the self-selected ranges observed, because excessive or deficient intake of those nutrients can have a detrimental impact on growth and food utilization in T. molitor larvae.
Author Contributions
Conceptualization, J.A.M.-R., M.G.R. and H.C.K.; methodology, J.A.M.-R., M.G.R. and H.C.K.; software, J.A.M.-R.; validation, J.A.M.-R. and H.C.K.; formal analysis, J.A.M.-R.; investigation, J.A.M.-R. and M.G.R.; resources, J.A.M.-R., M.G.R., H.C.K. and V.E.; data curation, J.A.M.-R.; writing—J.A.M.-R. and M.G.R.; writing—review and editing, J.A.M.-R., M.G.R., H.C.K. and V.E.; visualization, J.A.M.-R.; supervision, J.A.M.-R.; project administration, M.G.R. and V.E.; funding acquisition, V.E. All authors have read and agreed to the published version of the manuscript.
Funding
This research was funded in part by USDD-DARPA, SBIR Grant No. SB172-002, D2-2236.
Acknowledgments
We thank Damian Tweedy for his assistance in mixing and forming ingredient pellets.
Conflicts of Interest
The authors declare no conflict of interest. The funders had no role in the design of the study; in the collection, analyses, or interpretation of data; in the writing of the manuscript, or in the decision to publish the results.
Disclaimers
Mention of companies or product brand names does not constitute an endorsement by the U. S. Department of Agriculture or the U. S. Government. The views, opinions and/or findings expressed are those of the authors and should not be interpreted as representing the official views or policies of the Department of Defense or the U.S. Government.
References
- Ng, W.-K.; Liew, F.-L.; Ang, L.-P.; Wong, K.-W. Potential of mealworm (Tenebrio molitor) as an alternative protein source in practical diets for African catfish, Clarias gariepinus. Aquac. Res. 2001, 32, 272–280. [Google Scholar] [CrossRef]
- Barroso, F.G.; de Haro, C.; Sánchez-Muros, M.J.; Venegas, E.; Martínez-Sánchez, A.; Pérez-Bañon, C. The potential of various insect species for use as food for fish. Aquaculture 2014, 422–423, 193–201. [Google Scholar] [CrossRef]
- Gasco, L.; Henry, M.; Piccolo, G.; Marono, S.; Gai, F.; Renna, M.; Lussiana, C.; Antonopoulou, E.; Mola, P.; Chatzifotis, S. Tenebrio molitor meal in diets for European sea bass (Dicentrarchus labrax L.) juveniles: Growth performance, whole body composition and in vivo apparent digestibility. Anim. Feed Sci. Technol. 2016, 220, 34–45. [Google Scholar] [CrossRef]
- Gasco, L.; Gai, F.; Maricchiolo, G.; Genovese, L.; Ragonese, S.; Bottari, T.; Caruso, G. Fishmeal alternative protein sources for aquaculture. In Feeds for the Aquaculture Sector; Gasco, L., Gai, F., Maricchiolo, G., Genovese, L., Ragonese, S., Bottari, T., Caruso, G., Eds.; Springer Briefs in Molecular Science; Springer: Cham, Switzerland, 2018; pp. 1–28. [Google Scholar]
- Lock, E.J.; Biancarosa, I.; Gasco, L. Insects as raw materials in compound feed for aquaculture. In Edible Insects in Sustainable Food Systems; Halloran, A., Flore, R., Vantomme, P., Roos, N., Eds.; Springer: Cham, Switzerland, 2018; pp. 263–276. [Google Scholar]
- Ferrer, L.P.; Kallas, Z.; de Amores Gea, D. The use of insect meal as a sustainable feeding alternative in aquaculture: Current situation, Spanish consumers’ perceptions and willingness to pay. J. Clean. Prod. 2019, 229, 10–21. [Google Scholar] [CrossRef]
- Ramos-Elorduy, J.; Avila Gonzalez, E.; Rocha Hernandez, A.; Pino, J.M. Use of Tenebrio molitor (Coleoptera, Tenebrionidae) to recycle organic wastes and as feed for broiler chickens. J. Econ. Entomol. 2002, 95, 214–220. [Google Scholar] [CrossRef] [PubMed]
- van Huis, A.; Van Itterbeeck, J.; Klunder, H.; Mertens, E.; Halloran, A.; Muir, G.; Vantomme, P. Edible Insects, Future Prospects for Food and Feed Security; FAO, ONU: Rome, Italy, 2013. [Google Scholar]
- Makkar, H.P.S.; Tran, G.; Heuzé, V.; Ankers, P. State-of-the-art on use of insects as animal feed. Anim. Feed Sci. Technol. 2014, 197, 1–33. [Google Scholar] [CrossRef]
- De Marco, M.; Martínez, S.; Hernandez, F.; Madrid, J.; Gai, F.; Rotolo, L.; Belforti, M.; Bergero, D.; Katz, H.; Dabbou, S.; et al. Nutritional value of two insect larval meals (Tenebrio molitor and Hermetia illucens) for broiler chickens: Apparent nutrient digestibility, apparent ileal amino acid digestibility and apparent metabolizable energy. Anim. Feed Sci. Technol. 2015, 209, 211–218. [Google Scholar] [CrossRef]
- Sánchez-Muros, M.J.; Barroso, F.G.; Manzano-Agugliaro, F. Insect meal as renewable source of food for animal feeding: A review. J. Clean. Prod. 2014, 65, 16–27. [Google Scholar] [CrossRef]
- Sánchez-Muros, M.J.; Barroso, F.G.; de Haro, C. Brief summary of insect usage as an industrial animal feed/feed ingredient. In Insects as Sustainable Food Ingredients–Production, Processing and Food Applications; Dossey, A.T., Morales-Ramos, J.A., Rojas, M.G., Eds.; Academic Press: San Diego, CA, USA, 2016; pp. 273–309. [Google Scholar]
- Benzertiha, A.; Kierończyk, B.; Rawski, M.; Józefiak, A.; Kozłowski, K.; Jankowski, J.; Józefiak, D. Tenebrio molitor and Zophobas morio full-fat meals in broiler chicken diets: Effects on nutrients digestibility, digestive enzyme activities, and cecal microbiome. Animals 2019, 9, 1128. [Google Scholar] [CrossRef]
- Gasco, L.; Biasato, I.; Dabbou, S.; Schiavone, A.; Gai, F. Animals fed insect-based diets: State-of-the-art on digestibility, performance and product quality. Animals 2019, 9, 170. [Google Scholar] [CrossRef]
- Dossey, A.T.; Tatum, J.T.; McGill, W.L. Modern insect-based food industry: Current status, insect processing technology, and recommendations moving forward. In Insects as Sustainable Food Ingredients–Production, Processing and Food Applications; Dossey, A.T., Morales-Ramos, J.A., Rojas, M.G., Eds.; Academic Press: San Diego, CA, USA, 2016; pp. 113–152. [Google Scholar]
- van Broekhoven, S.; Oonincx, D.G.A.B.; van Huis, A.; van Loon, J.J.A. Growth performance and feed conversion efficiency of three edible mealworm species (Coleoptera: Tenebrionidae) on diets composed of organic by-products. J. Ins. Physiol. 2015, 73, 1–10. [Google Scholar] [CrossRef] [PubMed]
- Kim, S.Y.; Kim, H.G.; Lee, K.Y.; Yoon, H.J.; Kim, N.J. Effects of brewer’s spent grain (BSG) on larval growth of mealworms, Tenebrio molitor (Coleoptera: Tenebrionidae). Int. J. Ind. Entomol. 2016, 32, 41–48. [Google Scholar] [CrossRef]
- Zhang, X.; Tang, H.; Chen, G.; Qiao, L.; Li, J.; Liu, B.; Liu, Z.; Li, M.; Liu, X. Growth performance and nutritional profile of mealworms reared on corn stover, soybean meal, and distillers’ grains. Eur. Food Res. Technol. 2019, 245, 2631–2640. [Google Scholar] [CrossRef]
- Li, T.-H.; Che, P.-F.; Zhang, C.-R.; Zhang, B.; Ali, A.; Zang, L.-S. Recycling of spent mushroom substrate: Utilization as feed material for the larvae of the yellow mealworm Tenebrio molitor (Coleoptera: Tenebrionidae). PLoS ONE 2020, 15, e0237259. [Google Scholar] [CrossRef] [PubMed]
- Morales-Ramos, J.A.; Rojas, M.G.; Dossey, A.T.; Berhow, M. Self-selection of food ingredients and agricultural by-products by the house cricket, Acheta domesticus (Orthoptera: Gryllidae): A Holistic approach to develop optimized diets. PLoS ONE 2020, 15, e0227400. [Google Scholar] [CrossRef] [PubMed]
- Waldbauer, G.P.; Friedman, S. Self-selection of optimal diets by insects. Annu Rev. Entomol. 1991, 36, 43–63. [Google Scholar] [CrossRef]
- Morales-Ramos, J.A.; Kelstrup, H.C.; Rojas, M.G.; Emery, V. Body mass increase induced by eight years of artificial selection in the yellow mealworm (Coleoptera: Tenebrionidae) and life history trade-offs. J. Ins. Sci. 2019, 19, 1–9. [Google Scholar] [CrossRef]
- Morales-Ramos, J.A.; Kay, S.; Rojas, M.G.; Shapiro-Ilan, D.I.; Tedders, W.L. Morphometric analysis of instar variation in Tenebrio molitor (Coleoptera: Tenebrionidae). Ann. Entomol. Soc. Am. 2015, 108, 146–158. [Google Scholar] [CrossRef]
- Waldbauer, G.P. The consumption and utilization of food by insects. Adv. Ins. Physiol. 1968, 5, 229–288. [Google Scholar]
- Morales-Ramos, J.A.; Rojas, M.G.; Coudron, T.A. Artificial diet development for entomophagous arthropods. In Mass Production of Beneficial Organisms: Invertebrates and Entomopathogens; Morales-Ramos, J.A., Rojas, M.G., Shapiro-Ilan, D.I., Eds.; Academic Press: San Diego, CA, USA, 2014; pp. 203–240. [Google Scholar]
- National Research Council (NRC). United States-Canadian Tables of Feed Composition: Nutritional Data for United States and Canadian Feeds, 3rd ed.; National Academy Press: Washington, DC, USA, 1982; Available online: http://nap.edu/1713 (accessed on 29 August 2019).
- National Research Council (NRC). Nutrient Requirements of Poultry, 9th ed.; National Academy Press: Washington, DC, USA, 1994; Available online: http://nap.edu/2114 (accessed on 30 August 2019).
- Wu, Y.V.; Stringfellow, A.C. Corn distillers’ dried grains with solubles and corn distillers’ dried grains: Dry fraction and composition. J. Food Sci. 1982, 47, 1155–1157. [Google Scholar] [CrossRef]
- Batajoo, K.K.; Shaver, K.D. In Situ dry matter, crude protein, and starch degradabilities of selected grains and by-products. Anim. Feed Sci Technol. 1998, 71, 165–176. [Google Scholar] [CrossRef]
- Spiehs, M.J.; Whitney, M.H.; Shurson, G.C. Nutrient database for distiller’s dried grains with solubles produced from new ethanol plants in Minnesota and South Dakota. J. Anim. Sci. 2002, 80, 2639–2645. [Google Scholar] [PubMed]
- Huzá, S.; Várhegyi, J.; Lehel, L.; Rózsa, L.; Kádár, M. Mineral content of grains, seeds and industrial by products. Állattenyésztés Takarm. 2003, 52, 277–283. [Google Scholar]
- Kim, Y.; Moiser, N.S.; Hendrickson, R.; Ezeji, T.; Blaschek, H.; Dien, B.; Cotta, M.; Dale, B.; Ladisch, M.R. Composition of corn dry-grain ethanol by-products: DDGS, wet cake, and thin stillage. Bioresour. Technol. 2008, 99, 5165–5176. [Google Scholar] [CrossRef] [PubMed]
- Kahlon, T.S. Rice bran: Production, composition, functionality and food applications, physiological benefits. In Fiber Ingredients: Food Applications and Health Benefits; Cho, S.S., Samuel, P., Eds.; CRC Press Taylor & Francis Group: Boca Raton, FL, USA, 2009; pp. 305–321. [Google Scholar]
- Newkirk, R. Canola Meal Feed Industry Guide, 4th ed.; Canadian International Grains Institute, Canola Council of Canada: Winnipeg, MB, Canada, 2009. [Google Scholar]
- U. S. Grains Council. A guide to Distiller’s Dried Grains with Solubles (DDGS), 3rd ed.; U. S. Grains Council: Washington, DC, USA, 2012. [Google Scholar]
- US Department of Agriculture (USDA). USDA National Nutrient Database for Standard Reference; US Department of Agriculture: Beltsville, MD, USA, 2015. Available online: http://www.ars.usda.gov/ba/bhnrc/ndl (accessed on 13 October 2015).
- Amorim, M.; Pereira, J.O.; Gomes, D.; Pereira, C.D.; Pinheiro, H.; Pintado, M. Nutritional ingredients from spent brewer’s yeast obtained by hydrolysis and selective membrane filtration integrated in a pilot process. J. Food Eng. 2016, 185, 42–47. [Google Scholar] [CrossRef]
- SAS Institute. JMP Statistical Discovery from SAS, Version 14: Fitting Linear Models; SAS Institute: Cary, NC, USA, 2018. [Google Scholar]
- Myers, R.H. Classical and Modern Regression with Applications; Duxbury Press: Boston, MA, USA, 1986. [Google Scholar]
- Freund, R.; Littell, R.; Creighton, L. Regression Using JMP®; SAS Institute Inc.: Cary, NC, USA, 2003. [Google Scholar]
- Morales-Ramos, J.A.; Rojas, M.G.; Shapiro-Ilan, D.I.; Tedders, W.L. Self-selection of two diet components by Tenebrio molitor (Coleoptera: Tenebrionidae) larvae and its impact on fitness. Environ. Entomol. 2011, 40, 1285–1294. [Google Scholar] [CrossRef]
- Morales-Ramos, J.A.; Rojas, M.G.; Shapiro Ilan, D.I.; Tedders, W.L. Use of nutrient self-selection as a diet refining tool in Tenebrio molitor (Coleoptera: Tenebrionidae). J. Entomol. Sci. 2013, 48, 206–221. [Google Scholar] [CrossRef]
- Rho, M.S.; Lee, P. Geometric analysis of nutrient balancing in the mealworm beetle, Tenebrio molitor L. (Coleoptera: Tenebrionidae). J. Ins. Physiol. 2014, 71, 37–45. [Google Scholar] [CrossRef]
- Rho, M.S.; Lee, P. Nutrient-specific food selection buffers the effect of nutritional imbalance in the mealworm beetle, Tenebrio molitor (Coleoptera: Tenebrionidae). Eur. J. Entomol. 2015, 112, 251–258. [Google Scholar] [CrossRef]
- Rho, M.S.; Lee, P. Balanced intake of protein and carbohydrate maximizes lifetime reproductive success in the mealworm beetle, Tenebrio molitor (Coleoptera: Tenebrionidae). J. Ins. Physiol. 2016, 91–92, 93–99. [Google Scholar] [CrossRef]
- Cortes Ortiz, J.A.; Ruiz, A.T.; Morales-Ramos, J.A.; Thomas, M.; Rojas, M.G.; Tomberlin, J.K.; Yi, L.; Han, R.; Giroud, L.; Jullien, R.L. Insect mass production technologies. In Insects as Sustainable Food Ingredients–Production, Processing and Food Applications; Dossey, A.T., Morales-Ramos, J.A., Rojas, M.G., Eds.; Academic Press: San Diego, CA, USA, 2016; pp. 154–201. [Google Scholar]
- Li, L.; Stasiak, M.; Li, L.; Xie, B.; Fu, Y.; Gidzinski, D.; Dixon, M.; Liu, H. Rearing Tenebrio molitor in BLSS: Dietary fiber affects larval growth, development, and respiration characteristics. Acta Astronaut. 2015, 118, 130–136. [Google Scholar] [CrossRef]


Publisher’s Note: MDPI stays neutral with regard to jurisdictional claims in published maps and institutional affiliations. |
© 2020 by the authors. Licensee MDPI, Basel, Switzerland. This article is an open access article distributed under the terms and conditions of the Creative Commons Attribution (CC BY) license (http://creativecommons.org/licenses/by/4.0/).