Article

A Comparative Analysis of Mitogenomes in Species of the Tapinoma nigerrimum Complex and Other Species of the Genus Tapinoma (Formicidae, Dolichoderinae)

1
Department of Experimental Biology, Genetics Area, University of Jaén, Paraje las Lagunillas s/n, 23071 Jaen, Spain
2
Department of General and Applied Biology, Institute of Biosciences/IB, UNESP—São Paulo State University, Rio Claro 13506-900, SP, Brazil
3
ENTPE, LEHNA, UMR 5023 CNRS, Université Claude Bernard Lyon 1, 69622 Villeurbanne, France
4
Department of Entomology, Senckenberg Museum of Natural History, 02826 Görlitz, Germany
*
Author to whom correspondence should be addressed.
Insects 2024, 15(12), 957; https://doi.org/10.3390/insects15120957
Submission received: 14 October 2024 / Revised: 25 November 2024 / Accepted: 29 November 2024 / Published: 2 December 2024
(This article belongs to the Section Insect Molecular Biology and Genomics)

Simple Summary

This study focuses on the Tapinoma nigerrimum complex, a group of five ant species, three of which have the potential to become invasive and disrupt ecosystems. Mitogenome analyses have been used to study the taxonomy, biogeography, and genetics of species. So far, only the mitogenome of one of the T. nigerrimum complex species has been described. In this study, we assembled and analyzed the mitogenome of the remaining T. nigerrimum complex species as well as two other species of the genus Tapinoma, which allowed a comparative study within this genus and with other species of Dolichoderinae subfamily.

Abstract

Using next-generation sequencing data, the complete mitogenomes of six species from the genus Tapinoma were assembled. This study explores the mitochondrial genomes of Tapinoma species, among them the five species from the Tapinoma nigerrimum complex, comparing them with each other and with other species from Dolichoderinae subfamily to understand their evolutionary relationships and evolution. Tapinoma mitochondrial genomes contain the typical set of 13 protein-coding genes, two ribosomal RNA genes, 22 transfer RNAs, and the A + T-rich control region. A phylogenetic analysis using the protein-coding gene sequences from available Dolichoderinae mitogenomes supports the monophyletic nature of the genus Tapinoma, with the T. nigerrimum complex forming a well-supported clade. Key findings include genetic traits unique to the T. nigerrimum complex, such as a start codon in the atp8 gene and a complete stop codon in cox1, distinguishing them from other Tapinoma species. Additionally, a gene rearrangement involving tRNA-Trp, tRNA-Cys, and tRNA-Tyr was found exclusively in the Tapinoma species, suggesting a potential phylogenetic marker for the genus.

1. Introduction

Among eusocial insects, ants, belonging to the family Formicidae (Hymenoptera), hold a remarkable place due to their higher species richness and ecological influence [1,2]. Renowned as ecosystem engineers, ants play pivotal roles in soil aeration, seed dispersal, and predation, exerting profound impacts on ecological processes. With over 14,200 described species worldwide [3], ants represent a substantial portion of terrestrial animal biomass, underscoring their ecological significance [4]. Certain ant species are recognized for their high degree of invasiveness, enabling them to proliferate globally and exacerbate the ongoing biodiversity crisis [5]. These organisms have effectively established populations outside their native habitats, resulting in significant economic and environmental repercussions in the invaded areas [6]. Species included within the genus Tapinoma are noteworthy in this regard. Tapinoma melanocephalum stands out as one of the most invasive species of ants in both hemispheres. It poses significant challenges to global biodiversity by disrupting ecosystems outside its native ranges [7]. The genus Tapinoma, encompassing species like T. ibericum or T. magnum, further exemplifies the invasive potential within this taxon, with implications for ecosystem health and conservation efforts [8,9].
The Tapinoma nigerrimum taxon actually represents a species complex. Seifert et al. [9,10] used NUMOBAT (numeric morphology-based alpha-taxonomy) to help distinguish between morphologically similar species within this group, combining morphological traits with data on nuclear DNA (nuDNA), specifically microsatellites. They identified five distinct species: T. darioi, T. ibericum, T. magnum, T. hispanicum, and T. nigerrimum. Similar results were achieved using microsatellite markers alone [11]. All species are native to the Mediterranean region, though the precise native ranges need further investigation, except for T. ibericum and T. hispanicum, which are only found in southern and central Spain, and T. nigerrimum, which is restricted to southern France and northern Spain [10]. T. ibericum, T. magnum, and T. darioi exhibit supercolonial behavior, with invasive potential, posing risks as potential pests [10,12]. High-resolution mapping in southern France revealed that the distribution of supercolonial and monodomous species within the T. nigerrimum complex (TNC) is linked to their sensitivity to urbanization [11]. The TNC is particularly significant due to its ability to control the spread of the invasive Argentine ant Linepithema humile [13,14]. In competition assays, the Tapinoma species demonstrated superior efficiency in both interference and exploitative competition, securing food within an hour and invading Argentine ant nests—behavior not observed in the latter [13]. This highlights their critical role in mitigating other invasive species’ impacts on their ecosystem [10].
Mitochondrial sequences have become valuable resources for elucidating the taxonomy, biogeography, and genetic diversity of ants, aiding in the development of strategies to mitigate their invasive spread [8,15,16,17]. Hybridization events, detectable through a mitochondrial DNA analysis when combined with morphological or nuclear DNA data, highlight the dynamic evolutionary processes shaping ant populations [9,18]. The advent of next-generation sequencing (NGS) technologies has revolutionized the acquisition of complete mitogenome sequences, enabling comprehensive investigations into ant’s evolutionary biology [12]. However, the availability of complete mitogenomes within the Dolichoderinae subfamily, particularly within the Tapinoma genus, and specifically the TNC, remains limited, although the mitogenome of T. ibericum has been recently described [16]. To address this knowledge gap, we assembled the mitogenomes of six Tapinoma species using NGS data, some of which are included in the TNC: T. darioi, T. nigerrimum, T. hispanicum, and T. magnum, as well as T. madeirense and T. simrothi, which do not belong to the TNC. We compared the mitogenomic characteristics of Tapinoma with previously sequenced Dolichoderinae mitogenomes, including other Tapinoma species. Gene rearrangements are common in the evolution of the mitochondrial genomes [19,20]. The comparative analysis of mitochondrial gene order is a useful tool for phylogenetic analysis because it is uncommon that the same re-arrangement occurs convergently [21]. Mitochondrial genome data have been used to analyze phylogenetic relationships at very different levels, ranging from population-level studies to phylum-level analyses [22]. By collectively analyzing these species, we aim to gain a comprehensive understanding of the genetic diversity and potential relationships within the Tapinoma genus, particularly focusing on the TNC, which includes several species exhibiting supercolonial behavior and the potential to become invasive [9,10]. Our approach will significantly advance knowledge of this ecologically important genus.

2. Materials and Methods

2.1. Sample Collection and Determination of Species Identity of Focal Samples

Specimens of worker ants from different species were collected in France and Spain between 2004 and 2019. Detailed information is found in Table 1. None of the species used in this study are endangered or protected, thus specific permission for their collection was not required. The workers were preserved in absolute ethanol at −20 °C until DNA extraction. The species identity of six focal samples was established using numeric morphology-based alpha-taxonomy (NUMOBAT) following the methodology described in Seifert et al. [10].

2.2. DNA Extraction, Mitogenomic Sequencing, and Assembly Strategies

About 4–5 μg of genomic DNA was isolated from a pull of 10–20 workers of each species using the NucleoSpin Tissue kit (Macherey-Nagel GmbH & Co., Düren, Germany). These DNA samples were submitted to the Novogen Company Ltd. (Cambridge, UK) for sequencing on the Illumina® Hiseq™ 2000 platform (San Diego, CA, USA). A 350 bp fragment library and 151 bp paired-end sequencing reads were obtained, providing about 2.6 Gb of sequencing data for each species. To ensure high data quality, the low-quality sequences were filtered with Trimmomatic v.0.36 [23]. The mitogenomes were assembled de novo using NOVOPlasty v4.3.1 [24], which constructs organelle genomes from NGS data by extending a seed sequence.
For the assembly of all mitogenomes in this study, the published T. ibericum cox1 gene (GenBank accession number NC_065783) was used as the seed. This sequence was aligned with Illumina paired-end reads using bbmap (available at sourceforge.net/projects/bbmap/, accessed on 1 September 2024) and UGENE [25]. A consensus sequence was then generated and employed to initiate the assembly. Various K-mer lengths were tested, with 33 yielding the best results in terms of mitogenome completeness.

2.3. Mitogenome Annotation and Sequence Analysis

The mitogenomes of all the studied Tapinoma species were annotated following the procedure outlined by Cameron [26], using the MITOS2 web server [27,28] based on the Galaxy platform (available online: https://usegalaxy.eu/?tool_id=toolshed.g2.bx.psu.edu%2Frepos%2Fiuc%2Fmitos2%2Fmitos2%2F2.1.9%2Bgalaxy0&version=latest, accessed on 27 September 2024). The annotation of protein-coding genes (PCGs) was manually refined ensuring consistent start/stop codons and open reading frames and comparing with other Dolichoderinae mitogenomes using Geneious R11.1.5 (Biomatters Ltd., Auckland, New Zealand). Additionally, base composition estimation, the generation of circularized plots of the mitogenome, and the secondary structure analysis were conducted using Geneious R11.1.5. Codon usage analysis was performed using MEGA v.11.0.13 [29]. The resultant assemblies and annotations were deposited in GenBank under accession number (PQ459328 to PQ459333).
The final dataset of Dolichoderinae comprises 23 sequences from 18 species (Table 2). Multiple sequences of the same species were included to account for different origins and sizes. Notably, four selected mitogenomes lacked annotations and were available only as sequences (Dolichoderus lamellosus, D. pustulatus, Leptomyrmex erythrocephalus, and Tapinoma sessile). To facilitate comparisons, these mitogenomes were also annotated using the same methodology employed for the Tapinoma species [16].

2.4. Comparative Phylogenetics

Following the methodology established in the description of the T. ibericum mitogenome [16] for phylogenetic analysis, the complete set of PCGs from the mitogenomes of the Dolichoderinae species was used. According to the most recent ant phylogeny, published by Borowiec et al. [39], the ant subfamily most closely related to Dolichoderinae is Aneuretinae, which includes only the species Aneuretus simoni (Emery, 1893). Unfortunately, the mitogenome sequence for this species is not available. Therefore, we selected sequences from species of the subfamily Pseudomyrmecinae as outgroups, as it is another subfamily closely related to Dolichoderinae. These included Tetraponera aethiops Smith, 1877 (BK010476), and Pseudomyrmex gracilis (Fabricius, 1804) (BK010472). As an external outgroup, the sequence of the PCGs of Apis mellifera mellifera (Linnaeus, 1758) (KY926884), from Apidae family was used.
The alignment of the concatenated PCGs was performed using MAFFT v7.453 software [40]. The phylogenetic relationships were then reconstructed using the maximum likelihood (ML) method implemented in MEGA v.11.0.13 [29] employing the GTR + G + I model (model with the lowest Bayesian information criterion) with 1000 bootstrap replicates.
The genetic distances for the PCGs were estimated using the R package ape_5.4-1 [41] and graphically plotted as a heatmap using the R package ggplot2 [42]. Only a single sequence of L. humile (KX146468) was considered, as it is the most central sequence in the phylogenetic tree and sufficient for this purpose. There are four D. sibiricus mitogenome sequences deposited in GenBank. The phylogenetic analysis indicates that these sequences do not form a single cluster; instead, they appear in well-supported, distinct clades, with two sequences grouped in one clade and the other two in a separate clade. As we are uncertain whether these represent different species, we selected one sequence from each clade for further analysis of the PCGs’ genetic distances (MT919976 and MK801110).

3. Results and Discussion

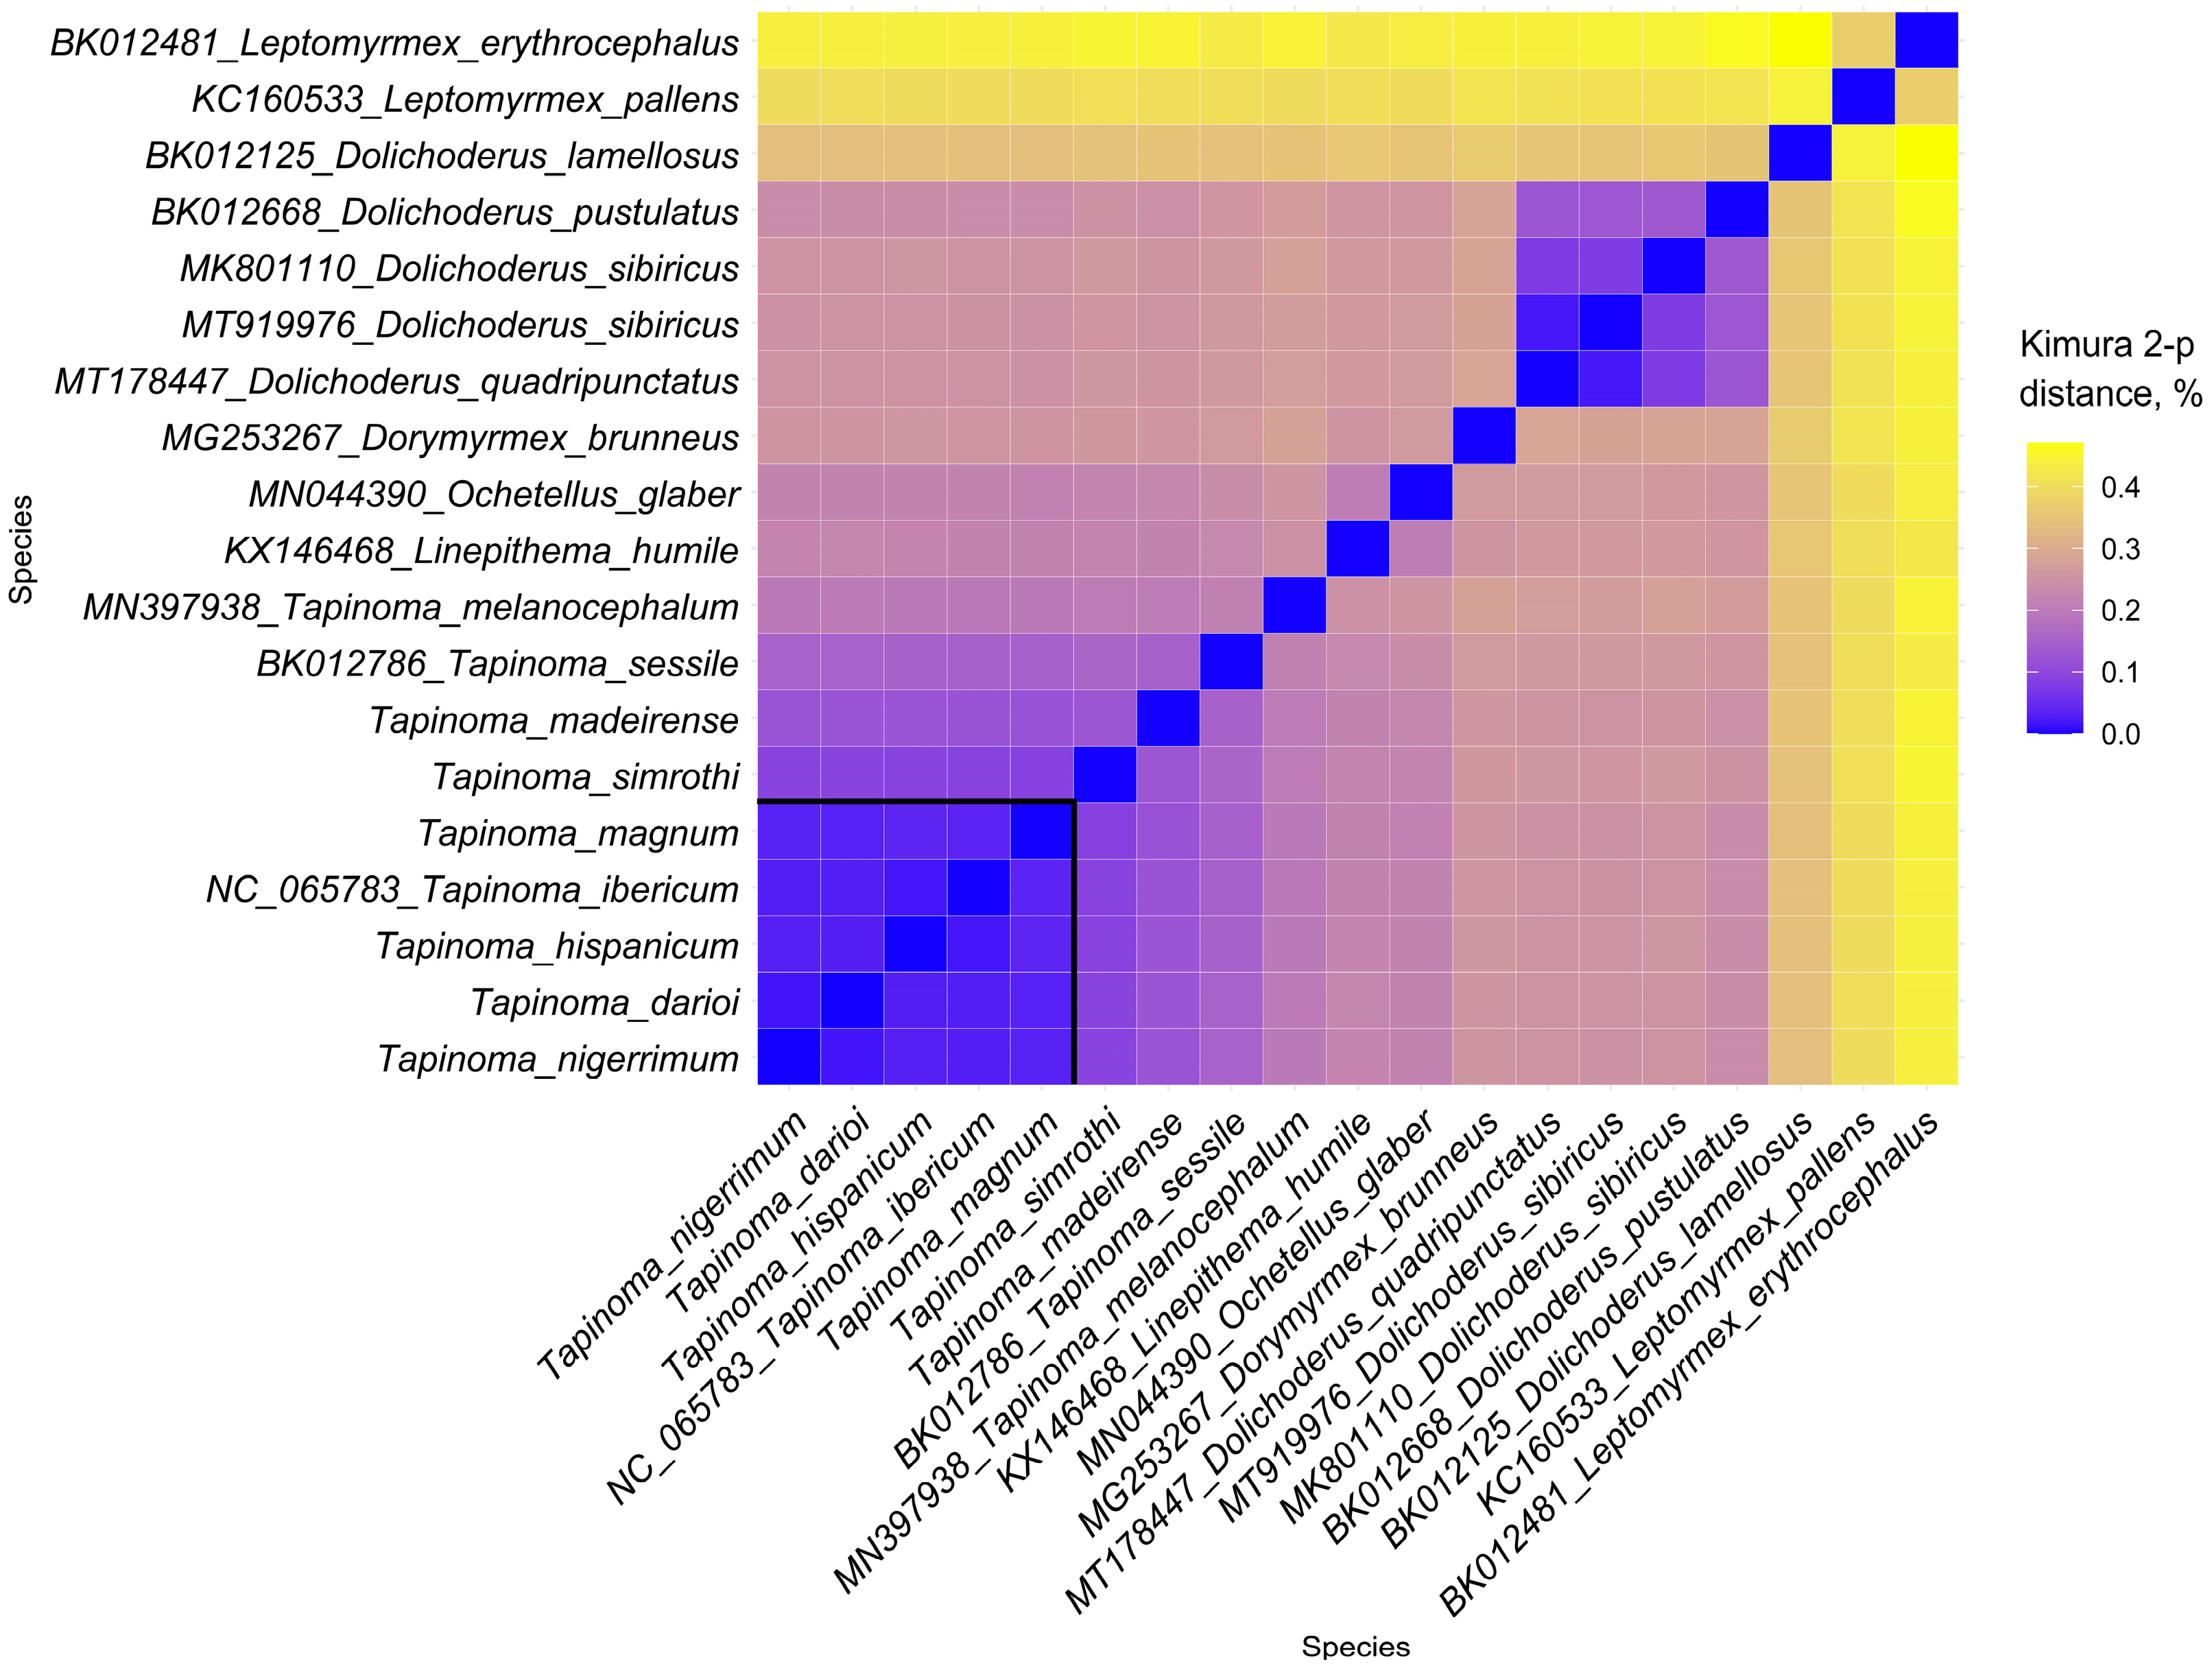
3.1. General Features and Phylogenetic Analysis

The complete mitogenomes of T. darioi, T. nigerrimum, T. hispanicum, T. magnum, T. madeirense, and T. simrothi were assembled and annotated (Figure 1, Supplementary Table S1). The new mitogenome sequences ranged in size from 15,487 bp (T. simrothi) to 15,817 bp (T. nigerrimum). These sizes are comparable to those found in previous studies for T. ibericum (15,715 bp), T. melanocephalum (15,499 bp), or T. sessile (15,287 bp), as well as other sequenced Dolichoderinae mitogenomes, in which the mitogenome sizes vary between 15,287 and 16,259 bp (Table 2). The determined sequences are the typical double-stranded circular molecules that, like most eukaryotic mitogenomes, encode a total of 37 genes (13 PCGs, 22 tRNAs, 2 rRNAs) and include an A + T-rich control region.
Concatenated sequences of the PCGs were used for phylogenetic analyses. This analysis includes all sequenced mitogenomes from species of Dolichoderinae and the six mitogenomes sequenced and annotated in this study. The maximum likelihood tree (Figure 2) showed that all species from the genus Tapinoma are grouped into a well-supported clade with a high bootstrap value (100%), corroborating that the genus is monophyletic, as was observed in previous analyses [16,43,44]. Among the included Tapinoma species, T. melanocephalum exhibits a basal position, potentially reflecting earlier divergent evolution within the genus.
Species of the TNC are grouped in a well-supported clade. This species complex includes T. nigerrimum, T. darioi, T. hispanicum, T. ibericum, and T. magnum. Seifert et al. [9,10] and Centanni et al. [11], through NUMOBAT and molecular analyses involving cox1 and microsatellite markers, concluded that this species complex comprised five species. The results obtained with complete mitogenomes are strongly consistent with previous studies, identifying T. ibericum and T. hispanicum as sister species, as are T. darioi and T. nigerrimum. Additionally, T. magnum is confirmed as the most distantly related species, consistent with previous studies. When compared to the phylogeny in Seifert et al. [9], which did not feature T. hispanicum, our results are broadly similar, already showing a sibling species relationship between T. darioi and T. nigerrimum. Analysis of the genetic variability using PCG pairwise genetic distances, measured with the Kimura two-parameter model, reveals genetic distance values lower than 0.1% among all species in the TNC (Figure 3), suggesting that the species within this complex are genetically closely related, possibly due to recent evolutionary divergence. For this analysis, only one of the available sequences was used for each species, as in the case of L. humile, a species for which three different sequences have been deposited in GenBank (Table 2). The case of D. sibiricus is different. The phylogenetic analysis shows that the four mitogenome sequences of this species cluster into two different clades with high bootstrap values. We cannot determine whether there is an issue with species misidentification or whether D. sibiricus includes cryptic species. In any case, one sequence from each clade was selected. Species identities can be established using adequate markers of nuclear DNA or expression products of nuclear DNA that are least influenced by environmental modification [45]. The exchange of matrilines between species, mostly by ancient or current hybridization but also by incomplete lineage sorting, is a frequent event in ants [46]. This poses a risk for using mitochondrial genomes in phylogenetic studies. Tapinoma ants are among the ant genera in which the transfer of mtDNA between lineages defined by nuclear DNA or its expression products is comparatively rare—found in 6% of samples [9]. The low rate in Tapinoma is probably due to well-differentiated male genitalia or intranidal mating in the supercolonial species [9]. This reduces the frequency of interspecific hybridization. We established the identity of the focal Tapinoma samples (Table 2) by the use of NUMOBAT, which showed a 98.3% agreement with classification by nuclear DNA in both the nigerrimum and simrothi groups [10]. We consider the risk of transfer of matrilines between lineages defined by the nuclear genome as low in the cases presented here. We are aware that whole-genome sequencing of nuclear DNA would answer this question.

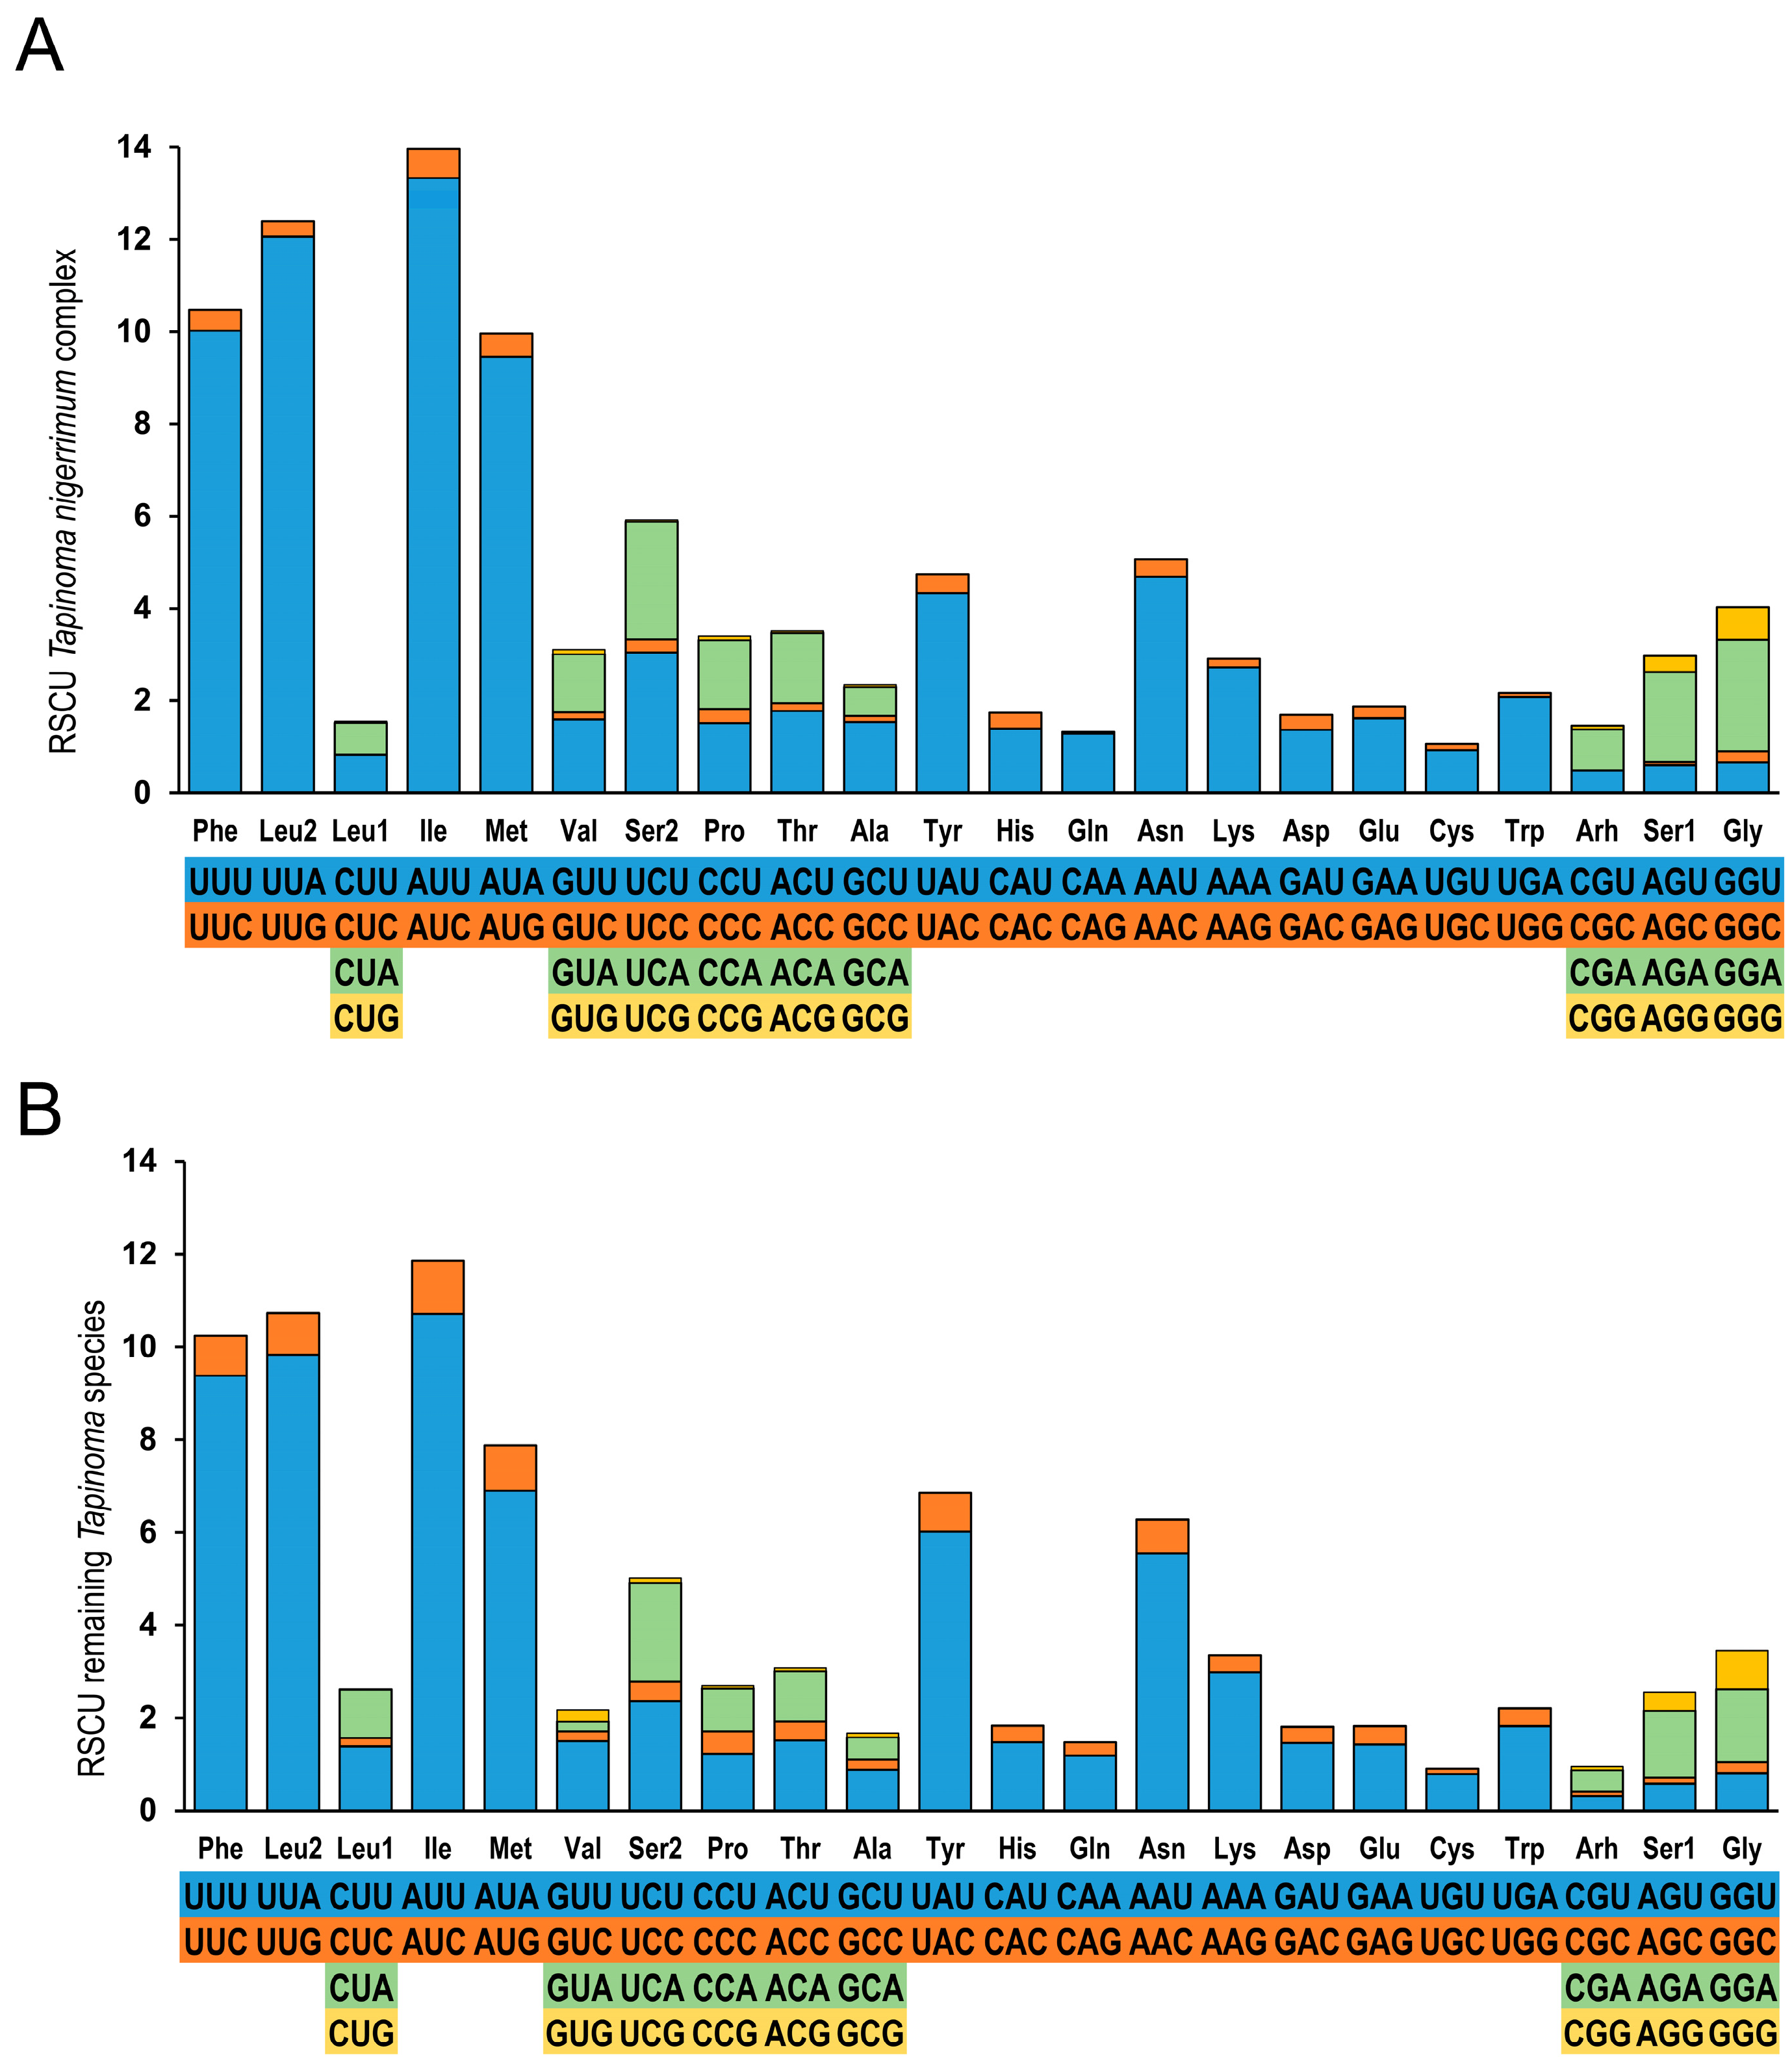
3.2. Gene Organization and Sequence Analysis

The comparative analysis of the mitogenomes in arthropods has enabled the identification of an ancestral mitogenome for this group of organisms [47]. The gene order of this ancestral mitogenome is also considered ancestral in insects [48]. In Formicidae, the main change with respect to the ancestral insect mitogenome affects the region located between the control region and the nad2 gene, which includes the tRNA-Ile, tRNA-Gln, and tRNA-Met genes (CR-IQM-nad2) (Figure 2). In most of the ant mitogenomes analyzed, including the species of Dolichoderinae, the order of these transfer RNAs has changed to MIQ [16], which could be considered an ancestral or plesiomorphic character in ants. In addition to this change, three other rearrangements have been detected in Dolichoderinae species in relation to the ancestral mitogenome (Figure 2). The first affects D. pustulatus, in which a second change occurs in the same transfer RNAs, showing the order QMI. In D. lamellosus, a translocation of the tRNA-Gln gene has occurred, placing it between the srRNA gene and the control region. The third change appeared in species of the genus Tapinoma, affecting the tRNAs located downstream of the nad2 gene, which in Tapinoma shows the order WYC (tRNA-Trp, tRNA-Tyr, tRNA-Cys), unlike other ants that present the ancestral order WCY [16]. This difference is maintained in all TNC species as well as in the remaining Tapinoma species. The new data support the hypothesis of Ruiz-Mena et al. [16] that this change could be considered a synapomorphic trait of the genus Tapinoma and that it could potentially be used as a molecular marker to establish the boundaries of the genus.
Like typical eukaryotic mitogenomes, the Tapinoma mitogenomes encode 13 PCGs (Figure 1, Supplementary Table S1). Most PCGs are encoded by the heavy strand (H-strand), while the nd4, nd4l, nd5, and nd1 genes are located on the light strand (L-strand). All Tapinoma PCGs initiate with the standard ATN codon. The main difference between species of the TNC species and other Tapinoma species was found in the start codon for the atp8 gene (Table 3). Outside of the TNC, this gene has ATA or ATT as the start codon. However, in four of the TNC species, the start codon is ATC. Within the TNC, only T. magnum has ATT as the start codon. The phylogenetic analysis shows that T. magnum occupies a basal position in the clade of TNC species. It is plausible to assume that the acquisition of the ATC codon is a synapomorphic trait that appeared in the common ancestor of the other four TNC species.
In the TNC species, all PCGs present the TAA stop codon. However, incomplete stop codons were observed in non-TNC species, specifically in the nad2, cox1, and nad5 genes (Table 3). Incomplete stop codons (TA- or T--) occur when the coding sequence ends within the 5′ end of the adjacent tRNA, with a functional stop codon generated by the addition of a poly(A) tail at the 3′ end prior to transcription [49,50]. The existence of complete stop codons in all genes in the TNC suggests a potential evolutionary shift toward a more stable and efficient genomic architecture. The main difference was found in the cox1 gene, which presents an incomplete stop codon in all species outside the TNC. Hence, the presence of the complete stop codon for this gene seems to be a synapomorphic trait in all TNC species.
Mitogenomes exhibit two distinct non-coding sequences: the control region (CR) and the intergenic spacers (IGSs). The size variations observed among the mitogenomes of different Tapinoma species were primarily attributed to differences in the IGS regions and, most notably, the CR. In the mitogenomes of Tapinoma species included in this study, the length of the CR ranges from 318 bp in T. simrothi to 356 bp in T. madeirense. Additionally, 27 IGSs were identified (Supplementary Table S1). These IGSs vary in length from 1 to 102 bp, with the longest intergenic spacer found between the tRNA-Gln and nad2 genes in all the species, ranging from 69 to 102 bp. When comparing Tapinoma species to other ants for which IGSs have been described, the total number of IGSs in the Tapinoma species is comparable to that found in other Dolichoderinae ants [16]. In species within the TNC, the cumulative size of all IGSs ranges from 571 bp to 697 bp, consistent with the size found in T. ibericum (719 bp). In contrast, in species outside the TNC, the size of the IGSs ranges from 423 bp (T. madeirense) to 455 bp (T. simrothi). This is notably smaller than what is found in other ant species, such as Solenopsis invicta (Buren, 1972) (519 bp) and up to nearly 4 kb in Atta laevigata (Smith, 1858) [51,52].
Gene overlaps in the Tapinoma species were observed at two gene junctions. The first one was found between the tRNA-Ile and tRNA-Gln genes in all TNC species. In all TNC species, this overlap is three bp in length. T. simrothi also exhibits a three bp overlap, but this overlap was not found in T. madeirense, T. sessile, or T. melanocephalum (Supplementary Table S1). In T. sessile and T. madeirense there is an IGS between the tRNA-Ile and tRNA-Gln genes with one or two bp, respectively. However, this region in T. melanocephalum is 67 bp in length and contains a tandem repeat sequence (TAACTAACT). The second gene overlap, measuring seven bp (ATGATAA), occurs between the atp8 and atp6 genes, appears in all Tapinoma species and is fully conserved across the Dolichoderinae mitogenomes [16]. Indeed, the atp8/ atp6 gene junction is highly conserved among arthropods [26,53], but in other hymenopteran species it was also possible to find an IGS in the atp8/atp6 junction such as in the wasp Evania appendigaster (Linnaeus, 1758), in which the atp6 and atp8 genes are separated by an IGS of 244 bp [54].
Overall, the A + T nucleotide content in these mitogenomes is significantly higher than that of G + C and is a characteristic shared by Hymenoptera mitogenomes [55]. The A + T content in the TNC is notably high, reaching approximately 84%, and this pattern is also observed in species not included in the TNC described in this article, with A + T percentages varying within a narrow range. The lowest percentage was found in T. madeirense, with an A + T content of 83.6%, and the highest value was found in T. nigerrimum, with a percentage of 84.3%. Codon usage also reflects this bias toward A + T-rich codons (Figure 4, Supplementary Table S2). This bias in the utilization of codons for the same amino acids can be quantified through relative synonymous codon usage (RSCU) values in the mitogenome PCGs. RSCU indicates the observed frequency of a codon in a gene relative to the expected frequency under equal codon usage. For all synonymous codons, the RSCU value is higher in codons ending in A or T (NNA or NNT). The most frequently used codons are A + T-rich: ATT (Ile), TTA (Leu), TTT (Phe), and ATA (Met). Synonymous codons ending in A or U are more prevalent than those ending in G or C. For example, UUU (RSCU = 9.9) is more common than UUC (RSCU = 0.1) for Phe. The preference for codons ending in A or T appears to be a general characteristic in insects and has been observed across several insect groups [56,57,58,59].
The amino acid compositions of the Tapinoma PCGs are similar within the TNC as well in the remaining Tapinoma species, probably because of evolutionary conservation, optimization of translation efficiency, and similar selective pressures that maintain functional integrity. However, we found that their proportions are not exactly the same: Ile was observed as the most commonly represented amino acid, followed by Leu, Phe, and Met, and therefore, the codons corresponding to these common amino acids also have relatively high proportions. The A + T bias in usage can also be seen in the stop codons. In all Tapinoma mitogenomes, all the used stop codons are TAA (13 times), which, in some cases, is incomplete as mentioned above, while the TAG stop codon is not used at all. The TAG stop codon is also not present in the PCGs of the other Tapinoma species (Supplementary Table S1). Most of the PCGs described in the mitogenomes of Dolichoderinae use the TAA stop codon or its incomplete variants. The exceptions to this are the nad3 and nad4l genes in L. erythrocephalus and the nad1 gene in L. humile, in which the TAG stop codon is present.
All the mitogenomes described in this article exhibit the typical 22 tRNAs, as is usual in insects [20], although the existence of additional tRNAs has been described in some Poneroid ants, likely originated from duplications [60]. In the TNC, the size of the tRNAs range from 58 bp (tRNA-Ser1 gene in T. madeirense) to 75 bp in the tRNA-Arg gene of T. ibericum (Supplementary Figure S1). These values are similar to those reported in other Dolichoderinae species [32]. Figure 5 displays the 22 tRNAs found in T. ibericum [16] and the changes found among TNC species. All tRNAs can fold into the typical secondary structure, except for tRNA-Ser1 (AGN), which lacks the stable sequence in the DHU arm, which is a common feature among insects and other metazoans [61,62,63]. The sequence of 8 out of the 22 tRNAs is identical across all species within the TNC (Figure 5). However, changes can be observed when comparing the sequences of these eight tRNAs to those found in other Tapinoma species that are not part of the TNC (Supplementary Figure S1). Among TNC species, T. magnum exhibits the greatest variability compared to the other four species, likely due to its more distant phylogenetic relationship. The variable positions in the tRNAs are mainly found in the DHU and TΨC arms, likely because they are less constrained by structural requirements, allowing for evolutionary flexibility. The anticodon arm is identical in 21 of the 22 tRNAs across the TNC species (Figure 5). This arm contains the anticodon triplet, which is crucial for pairing with complementary mRNA codons in the ribosome. Mutations in this region could have severe effects, as they might directly impact the tRNA’s ability to recognize its corresponding codon. The only change observed in the anticodon arm occurs in the tRNA-Cys of T. hispanicum, in which an adenine is replaced by a guanine. This change results in an A-U to G-U pairing in the stem of this arm, which theoretically would not affect the secondary structure of the arm. Although variation occurs primarily in the DHU and TΨC arms, most changes are observed in the loops, while the stems are more conserved, as has been observed in other ant subfamilies as well as in other insect groups [17,64]. The stem regions form double-stranded structures that are critical for the stability of the tRNA’s secondary structure, which is why they tend to be more conserved. In fact, the observed changes in these regions do not affect the stem formation. When substitutions do occur, they lead to A-U to G-U pairings or vice versa, as seen in the TΨC arms of tRNA-Met and tRNA-Gly (Figure 5). Small insertions or deletions have also been observed in the stems of these two arms, yet the secondary structure of the tRNAs does not appear to be affected (Supplementary Figure S1).
The mitogenomes of Tapinoma show the placement of the large ribosomal RNA subunit gene (lrRNA) between the tRNA-Leu and tRNA-Val genes. It is assumed that the bases between these two genes comprise the lrRNA gene. According to this, the 3′ end of the small ribosomal RNA subunit gene (srRNA) would be delimited by the presence of the tRNA-Val gene. However, no tRNA gene flanks the 5′ end of the srRNA gene. To determine the location of the srRNA gene, we used the annotation provided by the MITOS2 software, which considers the secondary structure for the annotation [26], along with comparisons to previously described Tapinoma mitogenomes and those of other Dolichoderinae species. In agreement with the obtained results, the lengths of the lrRNA and srRNA genes in the TNC mitogenomes described in this study are very similar to those in the T. ibericum mitogenome (1345 and 791 bp, respectively) (Supplementary Table S1). The lrRNA lengths range from 1344 bp in T. darioi to 1347 bp in T. hispanicum, and the length of the srRNA gene ranges from 791 bp in T. darioi to 798 bp in T. nigerrimum. Furthermore, the mitogenomes of species outside this complex are also comparable, with T. simrothi showing lengths of 1343 and 795 bp, respectively, and T. madeirense displaying slightly higher values of 1356 and 799 bp, respectively. Regarding the total A + T content in these genes, all mitogenomes exhibit a similar average, 88%, for the lrRNA gene and 89% for the srRNA gene, consistent with the genome of T. ibericum [16].
Among the non-coding fragments in the mitogenome, the CR is crucial since it is responsible for the initiation of mtDNA transcription and replication. In analyzed insect mitogenomes, certain patterns related to the CR have been observed: it is the largest non-coding sequence, highly variable, with the possible presence of tandem internal repeats and extraordinarily high A + T content [65]. Similarly, a wide diversity in the CR has been described in different ant species, suggesting that it may be associated with adaptive evolution to the heterogeneous habitats of this group of insects [17,66]. The CR is one of the most difficult regions to identify using both traditional methods and NGS, primarily due to the high sequence variability and the presence of internal repeats [57,67]. The CRs of the Tapinoma mitogenomes described in this study exhibit an A + T richness of approximately 99% in all cases and lack internal repeats. Despite the heterogeneity in the size and organization of the CRs, the existence of conserved sequences that could form a stem–loop configuration necessary for the initiation of the mitogenome replication has been suggested [68]. The analysis of the potential secondary structure of the CRs in the analyzed Tapinoma mitogenomes shows the presence of inverted repeats in all of them (Supplementary Figure S2), which could lead to the formation of these stem–loop secondary structures, some of which could act as possible replication origins.
The results of this study, based on the analysis of the mitogenome of Tapinoma species, confirm the previously established relationships based on morphological character and microsatellite data, highlighting the utility of mitochondrial DNA sequences in such research. Its maternal inheritance, high mutation rate, and the presence of conserved regions allow for the precise resolution of evolutionary relationships at both intraspecific and interspecific levels. Additionally, its non-recombinant nature provides a complementary and reliable tool to validate and strengthen evolutionary hypotheses, demonstrating its value in comparative phylogenetic studies, especially when used in conjunction with other molecular markers such as those derived from nuclear sequences.

Supplementary Materials

The following supporting information can be downloaded at https://www.mdpi.com/article/10.3390/insects15120957/s1: Figure S1: Alignment of tRNA sequences from the mitogenomes of Tapinoma species and secondary structure. Figure S2: Alignment of the control regions in Tapinoma species and potential secondary structure. Table S1: Mitogenome annotations in Tapinoma species. Table S2: Codon usage in Tapinoma species.

Author Contributions

Conceptualization, A.R.-M., P.M., T.P. and P.L.; methodology, A.R.-M., P.M. and P.L.; investigation, A.R.-M., P.M., J.M.R.-P., T.P. and P.L.; resources, B.K. and B.S.; funding acquisition, T.P. and P.L.; writing—original draft preparation, A.R.-M., P.M. and P.L.; writing—review and editing, A.R.-M., P.M., J.M.R.-P., B.K., B.S., T.P. and P.L. All authors have read and agreed to the published version of the manuscript.

Funding

This work was supported by Universidad de Jaén (through the program “Plan de Apoyo a la Investigación 2023–2024, Acción 1”).

Data Availability Statement

The Tapinoma mitogenome sequences have been submitted to the NCBI database (acc. Numbers PQ459328- PQ459333).

Conflicts of Interest

The authors declare no conflicts of interest.

References

  1. Hölldobler, B.; Wilson, E.O. The Ants; Harvard University Press: Cambridge, MA, USA, 1990. [Google Scholar]
  2. Lach, L.; Parr, C.; Abbott, K. Ant Ecology; Oxford University Press: Oxford, UK, 2010. [Google Scholar]
  3. Bolton, B. An Online Catalog of the Ants of the World. Available online: http://antcat.org (accessed on 15 April 2024).
  4. Schultz, T.R. In search of ant ancestors. Proc. Natl. Acad. Sci. USA 2000, 97, 14028–14029. [Google Scholar] [CrossRef] [PubMed]
  5. Bertelsmeier, C.; Luque, G.M.; Hoffmann, B.D.; Courchamp, F. Worldwide ant invasions under climate change. Biodiver. Conserv. 2015, 24, 117–128. [Google Scholar] [CrossRef]
  6. Siddiqui, J.A.; Bamisile, B.S.; Khan, M.M.; Islam, W.; Hafeez, M.; Bodlah, I.; Xu, Y. Impact of invasive ant species on native fauna across similar habitats under global environmental changes. Environ. Sci. Pollut. Res. 2021, 28, 54362–54382. [Google Scholar] [CrossRef] [PubMed]
  7. Klimeš, P.; Okrouhlík, J. Invasive ant Tapinoma melanocephalum (Hymenoptera: Formicidae): A rare guest or increasingly common indoor pest in Europe? Eur. J. Entomol. 2015, 112, 705–712. [Google Scholar] [CrossRef]
  8. Smith, M.A.; Fisher, B.L. Invasions, DNA barcodes, and rapid biodiversity assessment using ants of Mauritius. Front. Zool. 2009, 6, 31. [Google Scholar] [CrossRef]
  9. Seifert, B.; D’Eustacchio, D.; Kaufmann, B.; Centorame, M.; Lorite, P.; Modica, M.V. Four species within the supercolonial ants of the Tapinoma nigerrimum complex revealed by integrative taxonomy (Hymenoptera: Formicidae). Myrmecol. News 2017, 24, 123–144. [Google Scholar] [CrossRef]
  10. Seifert, B.; Kaufmann, B.; Fraysse, L. A taxonomic revision of the Palaearctic species of the ant genus Tapinoma Mayr 1861 (Hymenoptera: Formicidae). Zootaxa 2024, 5435, 1–74. [Google Scholar] [CrossRef]
  11. Centanni, J.; Kaufmann, B.; Blatrix, R.; Blight, O.; Dumet, A.; Jay-Robert, P.; Vergnes, A. High resolution mapping in Southern France reveals that distributions of supercolonial and monodomous species in the Tapinoma nigerrimum complex (Hymenoptera: Formicidae) are related to sensitivity to urbanization. Myrmecol. News 2022, 32, 41–50. [Google Scholar] [CrossRef]
  12. Flucher, S.M.; Krapf, P.; Arthofer, W.; Suarez, A.V.; Crozier, R.H.; Steiner, F.M.; Schlick-Steiner, B.C. Effect of social structure and introduction history on genetic diversity and differentiation. Mol. Ecol. 2021, 30, 2511–2527. [Google Scholar] [CrossRef]
  13. Blight, O.; Provost, E.; Renucci, M.; Tirard, A.; Orgeas, J. A native ant armed to limit the spread of the Argentine ant. Biol. Invasions 2010, 12, 3785–3793. [Google Scholar] [CrossRef]
  14. Zina, V.; Conde, S.; Branco, M.; Franco, J.C. Do dominant native ants outcompete the invasive Argentine ant in Mediterranean citrus ecosystems? A laboratory test. Insects 2024, 15, 333. [Google Scholar] [CrossRef] [PubMed]
  15. Seifert, B. Hybridization in the European carpenter ants Camponotus herculeanus and C. ligniperda (Hymenoptera: Formicidae). Insect. Soc. 2019, 66, 365–374. [Google Scholar] [CrossRef]
  16. Ruiz-Mena, A.; Mora, P.; Montiel, E.E.; Palomeque, T.; Lorite, P. Complete nucleotide sequence of the mitogenome of Tapinoma ibericum (Hymenoptera: Formicidae: Dolichoderinae), gene organization and phylogenetic implications for the Dolichoderinae subfamily. Genes 2022, 13, 1325. [Google Scholar] [CrossRef] [PubMed]
  17. Liu, M.; Hu, S.Y.; Li, M.; Sun, H.; Yuan, M.L. Comparative mitogenomic analysis provides evolutionary insights into Formica (Hymenoptera: Formicidae). PLoS ONE 2024, 19, e0302371. [Google Scholar] [CrossRef] [PubMed]
  18. Seifert, B.; Kulmuni, J.; Pamilo, P. Independent hybrid populations of Formica polyctena X rufa wood ants (Hymenoptera: Formicidae) abound under conditions of forest fragmentation. Evol. Ecol. 2010, 24, 1219–1237. [Google Scholar] [CrossRef]
  19. Boore, J.L.; Brown, W.M. Big trees from little genomes: Mitochondrial gene order as a phylogenetic tool. Curr. Opin. Genet. Dev. 1998, 8, 668–674. [Google Scholar] [CrossRef]
  20. Cameron, S.L. Insect mitochondrial genomics: A decade of progress. Annu. Rev. Entomol, 2024; advance online publication. [Google Scholar] [CrossRef]
  21. Bernt, M.; Bleidorn, C.; Braband, A.; Dambach, J.; Donath, A.; Fritzsch, G.; Golombek, A.; Hadrys, H.; Jühling, F.; Meusemann, K.; et al. A comprehensive analysis of bilaterian mitochondrial genomes and phylogeny. Mol. Phylogenetics Evol. 2013, 69, 352–364. [Google Scholar] [CrossRef]
  22. Avise, J.C. Phylogeography: The History and Formation of Species; Harvard University Press: Cambridge, MA, USA, 2000. [Google Scholar]
  23. Bolger, A.M.; Lohse, M.; Usadel, B. Trimmomatic: A flexible trimmer for Illumina sequence data. Bioinformatics 2014, 30, 2114–2120. [Google Scholar] [CrossRef]
  24. Dierckxsens, N.; Mardulyn, P.; Smits, G. NOVOPlasty: De novo assembly of organelle genomes from whole genome data. Nucleic Acids Res. 2017, 45, e18. [Google Scholar] [CrossRef]
  25. Okonechnikov, K.; Golosova, O.; Fursov, M.; UGENE Team. Unipro UGENE: A unified bioinformatics toolkit. Bioinformatics 2012, 28, 1166–1167. [Google Scholar] [CrossRef]
  26. Cameron, S.L. How to sequence and annotate insect mitochondrial genomes for systematic and comparative genomics research. Syst. Entomol. 2014, 39, 400–411. [Google Scholar] [CrossRef]
  27. Bernt, M.; Donath, A.; Jühling, F.; Externbrink, F.; Florentz, C.; Fritzsch, G.; Pütz, J.; Middendorf, M.; Stadler, P.F. MITOS: Improved de novo metazoan mitochondrial genome annotation. Mol. Phylogenetics Evol. 2013, 69, 313–319. [Google Scholar] [CrossRef] [PubMed]
  28. Donath, A.; Jühling, F.; Al-Arab, M.; Bernhart, S.H.; Reinhardt, F.; Stadler, P.F.; Middendorf, M.; Bernt, M. Improved annotation of protein-coding genes boundaries in metazoan mitochondrial genomes. Nucleic Acids Res. 2019, 47, 10543–10552. [Google Scholar] [CrossRef] [PubMed]
  29. Tamura, K.; Stecher, G.; Kumar, S. MEGA11: Molecular Evolutionary Genetics Analysis version 11. Mol. Biol. Evol. 2021, 38, 3022–3027. [Google Scholar] [CrossRef]
  30. Allio, R.; Schomaker-Bastos, A.; Romiguier, J.; Prosdocimi, F.; Nabholz, B.; Delsuc, F. MitoFinder: Efficient automated large-scale extraction of mitogenomic data in target enrichment phylogenomics. Mol. Ecol. Resour. 2020, 20, 892–905. [Google Scholar] [CrossRef]
  31. Park, J.; Xi, H.; Park, J. Comparative analysis on Palaearctic Dolichoderus quadripunctatus species group with the proposal of a novel species (Formicidae). In Proceedings of the 2020 Spring International Conference of Korean Society of Applied Entomology, Online Academic Presentation (Society’s Website), 25–29 May 2020. [Google Scholar] [CrossRef]
  32. Park, J.; Kwon, W.; Park, J. The complete mitochondrial genome of Siberian odorous ant, Dolichoderus sibiricus Emery, 1889 (Hymenoptera: Formicidae). Mitochondrial DNA Part B 2019, 4, 525–526. [Google Scholar] [CrossRef]
  33. Berman, M.; Austin, C.M.; Miller, A.D. Characterisation of the complete mitochondrial genome and 13 microsatellite loci through next-generation sequencing for the New Caledonian spider-ant Leptomyrmex pallens. Mol. Biol. Rep. 2014, 41, 1179–1187. [Google Scholar] [CrossRef]
  34. Zhao, E.; Bi, G.; Yang, J.; Zhang, Z.; Liu, G.; Du, Q.; Shang, E. Complete mitochondrial genome of the Argentine ant, Linepithema humile (Hymenoptera: Formicidae). Mitochondrial DNA Part A 2017, 28, 210–211. [Google Scholar] [CrossRef]
  35. Duan, X.Y.; Peng, X.Y.; Qian, Z.Q. The complete mitochondrial genomes of two globally invasive ants, the Argentine ant Linepithema humile and the little fire ant Wasmannia auropunctata. Conserv. Genet. Resour. 2016, 8, 275–277. [Google Scholar] [CrossRef]
  36. Park, J.; Park, C.H.; Park, J. Complete mitochondrial genome of the H3 haplotype Argentine ant Linepithema humile (Mayr, 1868) (Formicidae; Hymenoptera). Mitochondrial DNA Part B 2021, 6, 786–788. [Google Scholar] [CrossRef]
  37. Park, J.; Xi, H.; Park, J. The complete mitochondrial genome of Ochetellus glaber (Mayr, 1862) (Hymenoptera: Formicidae). Mitochondrial DNA Part B 2020, 5, 147–149. [Google Scholar] [CrossRef] [PubMed]
  38. Du, Y.; Song, X.; Yu, H.; Lu, Z. Complete mitochondrial genome sequence of Tapinoma melanocephalum (Hymenoptera: Formicidae). Mitochondrial DNA Part B 2019, 4, 3448–3449. [Google Scholar] [CrossRef] [PubMed]
  39. Borowiec, M.L.; Zhang, Y.M.; Neves, K.; Ramalho, M.O.; Fisher, B.L.; Lucky, A.; Moreau, C.S. Evaluating UCE data adequacy and integrating uncertainty in a comprehensive phylogeny of ants. bioRxiv 2024. [Google Scholar] [CrossRef]
  40. Katoh, K.; Standley, D.M. MAFFT multiple sequence alignment software version 7: Improvements in performance and usability. Mol. Biol. Evol. 2013, 30, 772–780. [Google Scholar] [CrossRef] [PubMed]
  41. Paradis, E.; Schliep, K. ape 5.0: An environment for modern phylogenetics and evolutionary analyses in R. Bioinformatics 2019, 35, 526–528. [Google Scholar] [CrossRef]
  42. Wickham, H. ggplot2: Elegant Graphics for Data Analysis; Springer: New York, NY, USA, 2016. [Google Scholar] [CrossRef]
  43. Ward, P.S.; Brady, S.G.; Fisher, B.L.; Schultz, T.R. Phylogeny and biogeography of dolichoderine ants: Effects of data partitioning and relict taxa on historical inference. Syst. Biol. 2010, 59, 342–362. [Google Scholar] [CrossRef]
  44. Moreau, C.S.; Bell, C.D. Testing the museum versus cradle tropical biological diversity hypothesis: Phylogeny, diversification, and ancestral biogeographic range evolution of the ants. Evolution 2013, 67, 2240–2257. [Google Scholar] [CrossRef]
  45. Seifert, B. The Gene and Gene Expression (GAGE) species concept: An universal approach for all eukaryotic organisms. Syst. Biol. 2020, 69, 1033–1038. [Google Scholar] [CrossRef]
  46. Seifert, B. Frequent misclassification by mtDNA barcoding as revealed by nuDNA and/or testable analysis of its expression products. Biodivers. J. 2024, 15, 129–133. [Google Scholar] [CrossRef]
  47. Boore, J.; Lavrov, D.; Brown, W. Gene translocation links insects and crustaceans. Nature 1998, 392, 667–668. [Google Scholar] [CrossRef]
  48. Sterling-Montealegre, R.A.; Prada, C.F. Variability and evolution of gene order rearrangement in mitochondrial genomes of arthropods (except Hexapoda). Gene 2023, 892, 147906. [Google Scholar] [CrossRef] [PubMed]
  49. Ojala, D.; Montoya, J.; Attardi, G. tRNA punctuation model of RNA processing in human mitochondria. Nature 1981, 290, 470–474. [Google Scholar] [CrossRef] [PubMed]
  50. Ghosh, A.; Tyagi, K.; Dubey, A.K. Purifying selection drove the adaptation of mitochondrial genes along with correlation of gene rearrangements and evolutionary rates in two subfamilies of whitefly (Insecta: Hemiptera). Funct. Integr. Genom. 2024, 24, 121. [Google Scholar] [CrossRef] [PubMed]
  51. Gotzek, D.; Clarke, J.; Shoemaker, D. Mitochondrial genome evolution in fire ants (Hymenoptera: Formicidae). BMC Evol. Biol. 2010, 10, 300. [Google Scholar] [CrossRef]
  52. Rodovalho, C.d.M.; Lyra, M.L.; Ferro, M.; Bacci, M., Jr. The mitochondrial genome of the leaf-cutter ant Atta laevigata: A mitogenome with a large number of intergenic spacers. PLoS ONE 2014, 9, e97117. [Google Scholar] [CrossRef]
  53. Beckenbach, A.T.; Stewart, J.B. Insect mitochondrial genomics 3: The complete mitochondrial genome sequences of representatives from two neuropteroid orders: A dobsonfly (order Megaloptera) and a giant lacewing and an owlfly (order Neuroptera). Genome 2009, 52, 31–38. [Google Scholar] [CrossRef]
  54. Wei, S.J.; Tang, P.; Zheng, L.H.; Shi, M.; Chen, X.X. The complete mitochondrial genome of Evania appendigaster (Hymenoptera: Evaniidae) has low A+T content and a long intergenic spacer between atp8 and atp6. Mol. Biol. Rep. 2010, 37, 1931–1942. [Google Scholar] [CrossRef]
  55. Zheng, B.Y.; Cao, L.J.; Tang, P.; van Achterberg, K.; Hoffmann, A.A.; Chen, H.Y.; Chen, X.X.; Wei, S.J. Gene arrangement and sequence of mitochondrial genomes yield insights into the phylogeny and evolution of bees and sphecid wasps (Hymenoptera: Apoidea). Mol. Phylogenetics Evol. 2018, 124, 1–9. [Google Scholar] [CrossRef]
  56. Sun, Z.; Wan, D.G.; Murphy, R.W.; Ma, L.; Zhang, X.S.; Huang, D.W. Comparison of base composition and codon usage in insect mitochondrial genomes. Genes Genom. 2009, 31, 65–71. [Google Scholar] [CrossRef]
  57. Pita, S.; Panzera, F.; Vela, J.; Mora, P.; Palomeque, T.; Lorite, P. Complete mitochondrial genome of Triatoma infestans (Hemiptera, Reduviidae, Triatominae), main vector of Chagas disease. Infect. Genet. Evol. 2017, 54, 158–163. [Google Scholar] [CrossRef]
  58. Singh, D.; Kabiraj, D.; Sharma, P.; Chetia, H.; Mosahari, P.V.; Neog, K.; Bora, U. The mitochondrial genome of Muga silkworm (Antheraea assamensis) and its comparative analysis with other lepidopteran insects. PLoS ONE 2017, 12, e0188077. [Google Scholar] [CrossRef] [PubMed]
  59. Xu, K.K.; Chen, Q.P.; Ayivi, S.P.G.; Guan, J.Y.; Storey, K.B.; Yu, D.N.; Zhang, J.Y. Three complete mitochondrial genomes of Orestes guangxiensis, Peruphasma schultei, and Phryganistria guangxiensis (Insecta: Phasmatodea) and their phylogeny. Insects 2021, 12, 779. [Google Scholar] [CrossRef] [PubMed]
  60. Xiong, Z.; He, D.; Guang, X.; Li, Q. Novel tRNA gene rearrangements in the mitochondrial genomes of Poneroid ants and phylogenetic implication of Paraponerinae (Hymenoptera: Formicidae). Life 2023, 13, 2068. [Google Scholar] [CrossRef] [PubMed]
  61. Wolstenholme, D.R. Animal mitochondrial DNA: Structure and evolution. Int. Rev. Cytol. 1992, 141, 173–216. [Google Scholar] [CrossRef]
  62. Pons, J.; Bover, P.; Bidegaray-Batista, L.; Arnedo, M.A. Armless mitochondrial tRNAs conserved for over 30 million years in spiders. BMC Genom. 2019, 20, 665. [Google Scholar] [CrossRef]
  63. Lin, X.; Song, N. The first complete mitochondrial genome of the genus Pachycondyla (Formicidae, Ponerinae) and insights into the phylogeny of ants. Genes 2023, 14, 1528. [Google Scholar] [CrossRef]
  64. Zhao, W.; Zhao, Q.; Li, M.; Wei, J.; Zhang, X.; Zhang, H. Comparative mitogenomic analysis of the Eurydema genus in the context of representative Pentatomidae (Hemiptera: Heteroptera) taxa. J. Insect Sci. 2019, 19, 20. [Google Scholar] [CrossRef]
  65. Li, K.; Liang, A.-P. Hemiptera mitochondrial control region: New sights into the structural organization, phylogenetic utility, and roles of tandem repetitions of the noncoding segment. Int. J. Mol. Sci. 2018, 19, 1292. [Google Scholar] [CrossRef]
  66. Zhang, X.M.; Li, T.; Liu, X.; Xu, Z.H. Characterization and phylogenetic implication of complete mitochondrial genome of the medicinal ant Formica sinae (Hymenoptera: Formicidae): Genomic comparisons in Formicidae. J. Med. Entomol. 2022, 59, 1971–1979. [Google Scholar] [CrossRef]
  67. Bronstein, O.; Kroh, A.; Haring, E. Mind the gap! The mitochondrial control region and its power as a phylogenetic marker in echinoids. BMC Evol. Biol. 2018, 18, 80. [Google Scholar] [CrossRef]
  68. Zhang, D.X.; Szymura, J.M.; Hewitt, G.M. Evolution and structural conservation of the control region of insect mitochondrial DNA. J. Mol. Evol. 1995, 40, 382–391. [Google Scholar] [CrossRef]
Figure 1. Graphical maps of the mitogenomes for four species from the T. nigerrimum complex (T. nigerrimum, T. hispanicum, T. magnum, T. darioi), as well as for T. simrothi and T. madeirense.
Insects 15 00957 g001
Figure 2. Phylogenetic tree based on Dolichoderinae mitogenomes using the ML method. Bootstrap values above 70 are shown next to the branches. Species from the T. nigerrimum complex are shaded in blue, while the remaining species from the Tapinoma genus are shaded in yellow. T. aethiops and P. gracilis, from the Pseudomyrmecinae subfamily, were also included. The tree was rooted using A. mellifera mellifera as an outgroup. Mitochondrial gene rearrangements found in Dolichoderinae in relation to the ancestral insect mitogenome are also depicted. tRNAs clusters which are different from the ancestral insect mitogenome are highlighted in green, red, and yellow squares.
Insects 15 00957 g002
Figure 3. Heatmap summarizing the genetic distance values of PCGs in Dolichoderinae mitogenomes, calculated using the Kimura 2-parameter model. The genetic distances within species of the T. nigerrimum complex are highlighted with a black square.
Insects 15 00957 g003
Figure 4. The codon usage in PCGs of Tapinoma mitogenomes. (A) RSCU in mitogenomes of species from the T. nigerrimum complex genus. (B) RSCU in mitogenomes of the remaining Tapinoma species.
Insects 15 00957 g004
Figure 5. Putative secondary structures of the 22 tRNA genes in the T. nigerrimum complex. Sites that are fully conserved among species are indicated with black nucleotides. Red circles indicate positions in which nucleotide substitution has taken place in relation to the T. ibericum tRNA. Hollow arrows indicate sites with deletions, while solid arrows indicate sites with insertions.
Insects 15 00957 g005
Table 1. Samples of the Tapinoma species whose mitogenomes were sequenced and annotated in this study.
Species NameCoordinatesLocality NestCollection Date
T. darioi40.65401° N, 0.411551° EBenicarló (Spain)20 September 2019
T. magnum46.20167° N, 4.828° ELyon (France)2011
T. hispanicum37.7718° N, 3.4972° WTorres (Spain)31 October 2014
T. nigerrimum43.684254° N, 3.876259° EPrades-le-Lez (France)30 April 2012
T. simrothi37.714281° N, 3.904023° WJamilena (Spain)23 April 2014
T. madeirense37.259167° N, 3.487777° WSierra de Huetor (Spain)19 April 2004
Table 2. Available mitochondrial genome sequences so far for Dolichoderinae.
SpeciesMitogenome
Size (bp)
Country of OriginAccession
Number
Reference
Tribe Dolichoderini
Dolichoderus lamellosus (Mayr, 1870)16,234Costa RicaBK012125[30]
Dolichoderus pustulatus (Mayr, 1886)16,224CanadaBK012668[30]
Dolichoderus quadripunctatus (Linnaeus, 1771)16,017PolandMT178447[31]
Dolichoderus sibiricus (Emery, 1889)16,086South KoreaMH719017[32]
16,044South KoreaMK801110[31]
16,067RussiaMT919976unpublished
16,110TaiwanMW160468unpublished
Tribe Leptomyrmecini
Dorymyrmex brunneus (Forel, 1908)15,848-MG253267unpublished
Leptomyrmex erythrocephalus (Fabricius, 1775)15,546AustraliaBK012481[30]
Leptomyrmex pallens (Emery, 1883)15,591New CalcedoniaKC160533[33]
Linepithema humile (Mayr, 1868)16,098USAKT428891[34]
15,929-KX146468[35]
15,934South KoreaMT890564[36]
Ochetellus glaber (Mayr, 1862)16,259South KoreaMN044390[37]
Tribe Tapinomini
Tapinoma darioi (Seifert et al., 2017)15,680SpainPQ459328This study
Tapinoma hispanicum (Seifert et al., 2024)15,665SpainPQ459329This study
Tapinoma ibericum (Santschi, 1925)15,715SpainNC_065783[16]
Tapinoma madeirense (Forel, 1895)15,507SpainPQ459330This study
Tapinoma magnum (Mayr, 1861)15,694FrancePQ459331This study
Tapinoma melanocephalum (Fabricius, 1793)15,499ChinaMN397938[38]
Tapinoma nigerrimum (Nylander, 1856)15,817FrancePQ459332This study
Tapinoma sessile (Say, 1836)15,287USABK012786[30]
Tapinoma simrothi (Krausse, 1911)15,487SpainPQ459333This study
Table 3. Start and stop codons in each PCG in the mitogenomes of Tapinoma species. Same start codons share the blue (ATA), green (ATG), brown (ATT), and yellow (ATC) background. Incomplete stop codons share the green (TA-), and blue (T--) background.
Start codons
nad2cox1cox2atp8atp6cox3nad3nad5nad4nad4lnad6cobnad1
T. nigerrimumATAATGATTATCATGATGATAATAATGATTATGATGATT
T. darioiATAATGATTATCATGATGATAATAATGATTATGATGATT
T. hispanicumATAATGATTATCATGATGATAATAATGATTATGATGATT
T. ibericumATAATGATTATCATGATGATAATAATGATTATGATGATT
T. magnumATAATGATTATTATGATGATAATAATGATTATGATGATT
T. simrothiATAATGATTATAATGATGATAATAATGATTATGATGATT
T. madeirenseATAATGATTATAATGATGATTATTATGATTATGATGATA
T. sessileATAATGATTATAATGATGATTATTATGATTATGATGATT
T. melanocephalumATAATGATTATTATGATGATAATAATGATTATTATGATT
Stop codons
nad2cox1cox2atp8atp6cox3nad3nad5nad4nad4lnad6cobnad1
T. nigerrimumTAATAATAATAATAATAATAATAATAATAATAATAATAA
T. darioiTAATAATAATAATAATAATAATAATAATAATAATAATAA
T. hispanicumTAATAATAATAATAATAATAATAATAATAATAATAATAA
T. ibericumTAATAATAATAATAATAATAATAATAATAATAATAATAA
T. magnumTAATAATAATAATAATAATAATAATAATAATAATAATAA
T. simrothiTA-TA-TAATAATAATAATAATA-TAATAATAATAATAA
T. madeirenseTAATA-TAATAATAATAATAATAATAATAATAATAATAA
T. sessileTAATA-TAATAATAATAATAATA-TAATAATAATAATAA
T. melanocephalumT--TA-TAATAATAATAATAAT-TAATAATAATAATAA
Disclaimer/Publisher’s Note: The statements, opinions and data contained in all publications are solely those of the individual author(s) and contributor(s) and not of MDPI and/or the editor(s). MDPI and/or the editor(s) disclaim responsibility for any injury to people or property resulting from any ideas, methods, instructions or products referred to in the content.

