
Comparative Study of the Effect of Pollen Substitute Diets on Honey Bees during Early Spring

 ,
,  , and
, and
Abstract
:Simple Summary
Abstract
1. Introduction
2. Materials and Method
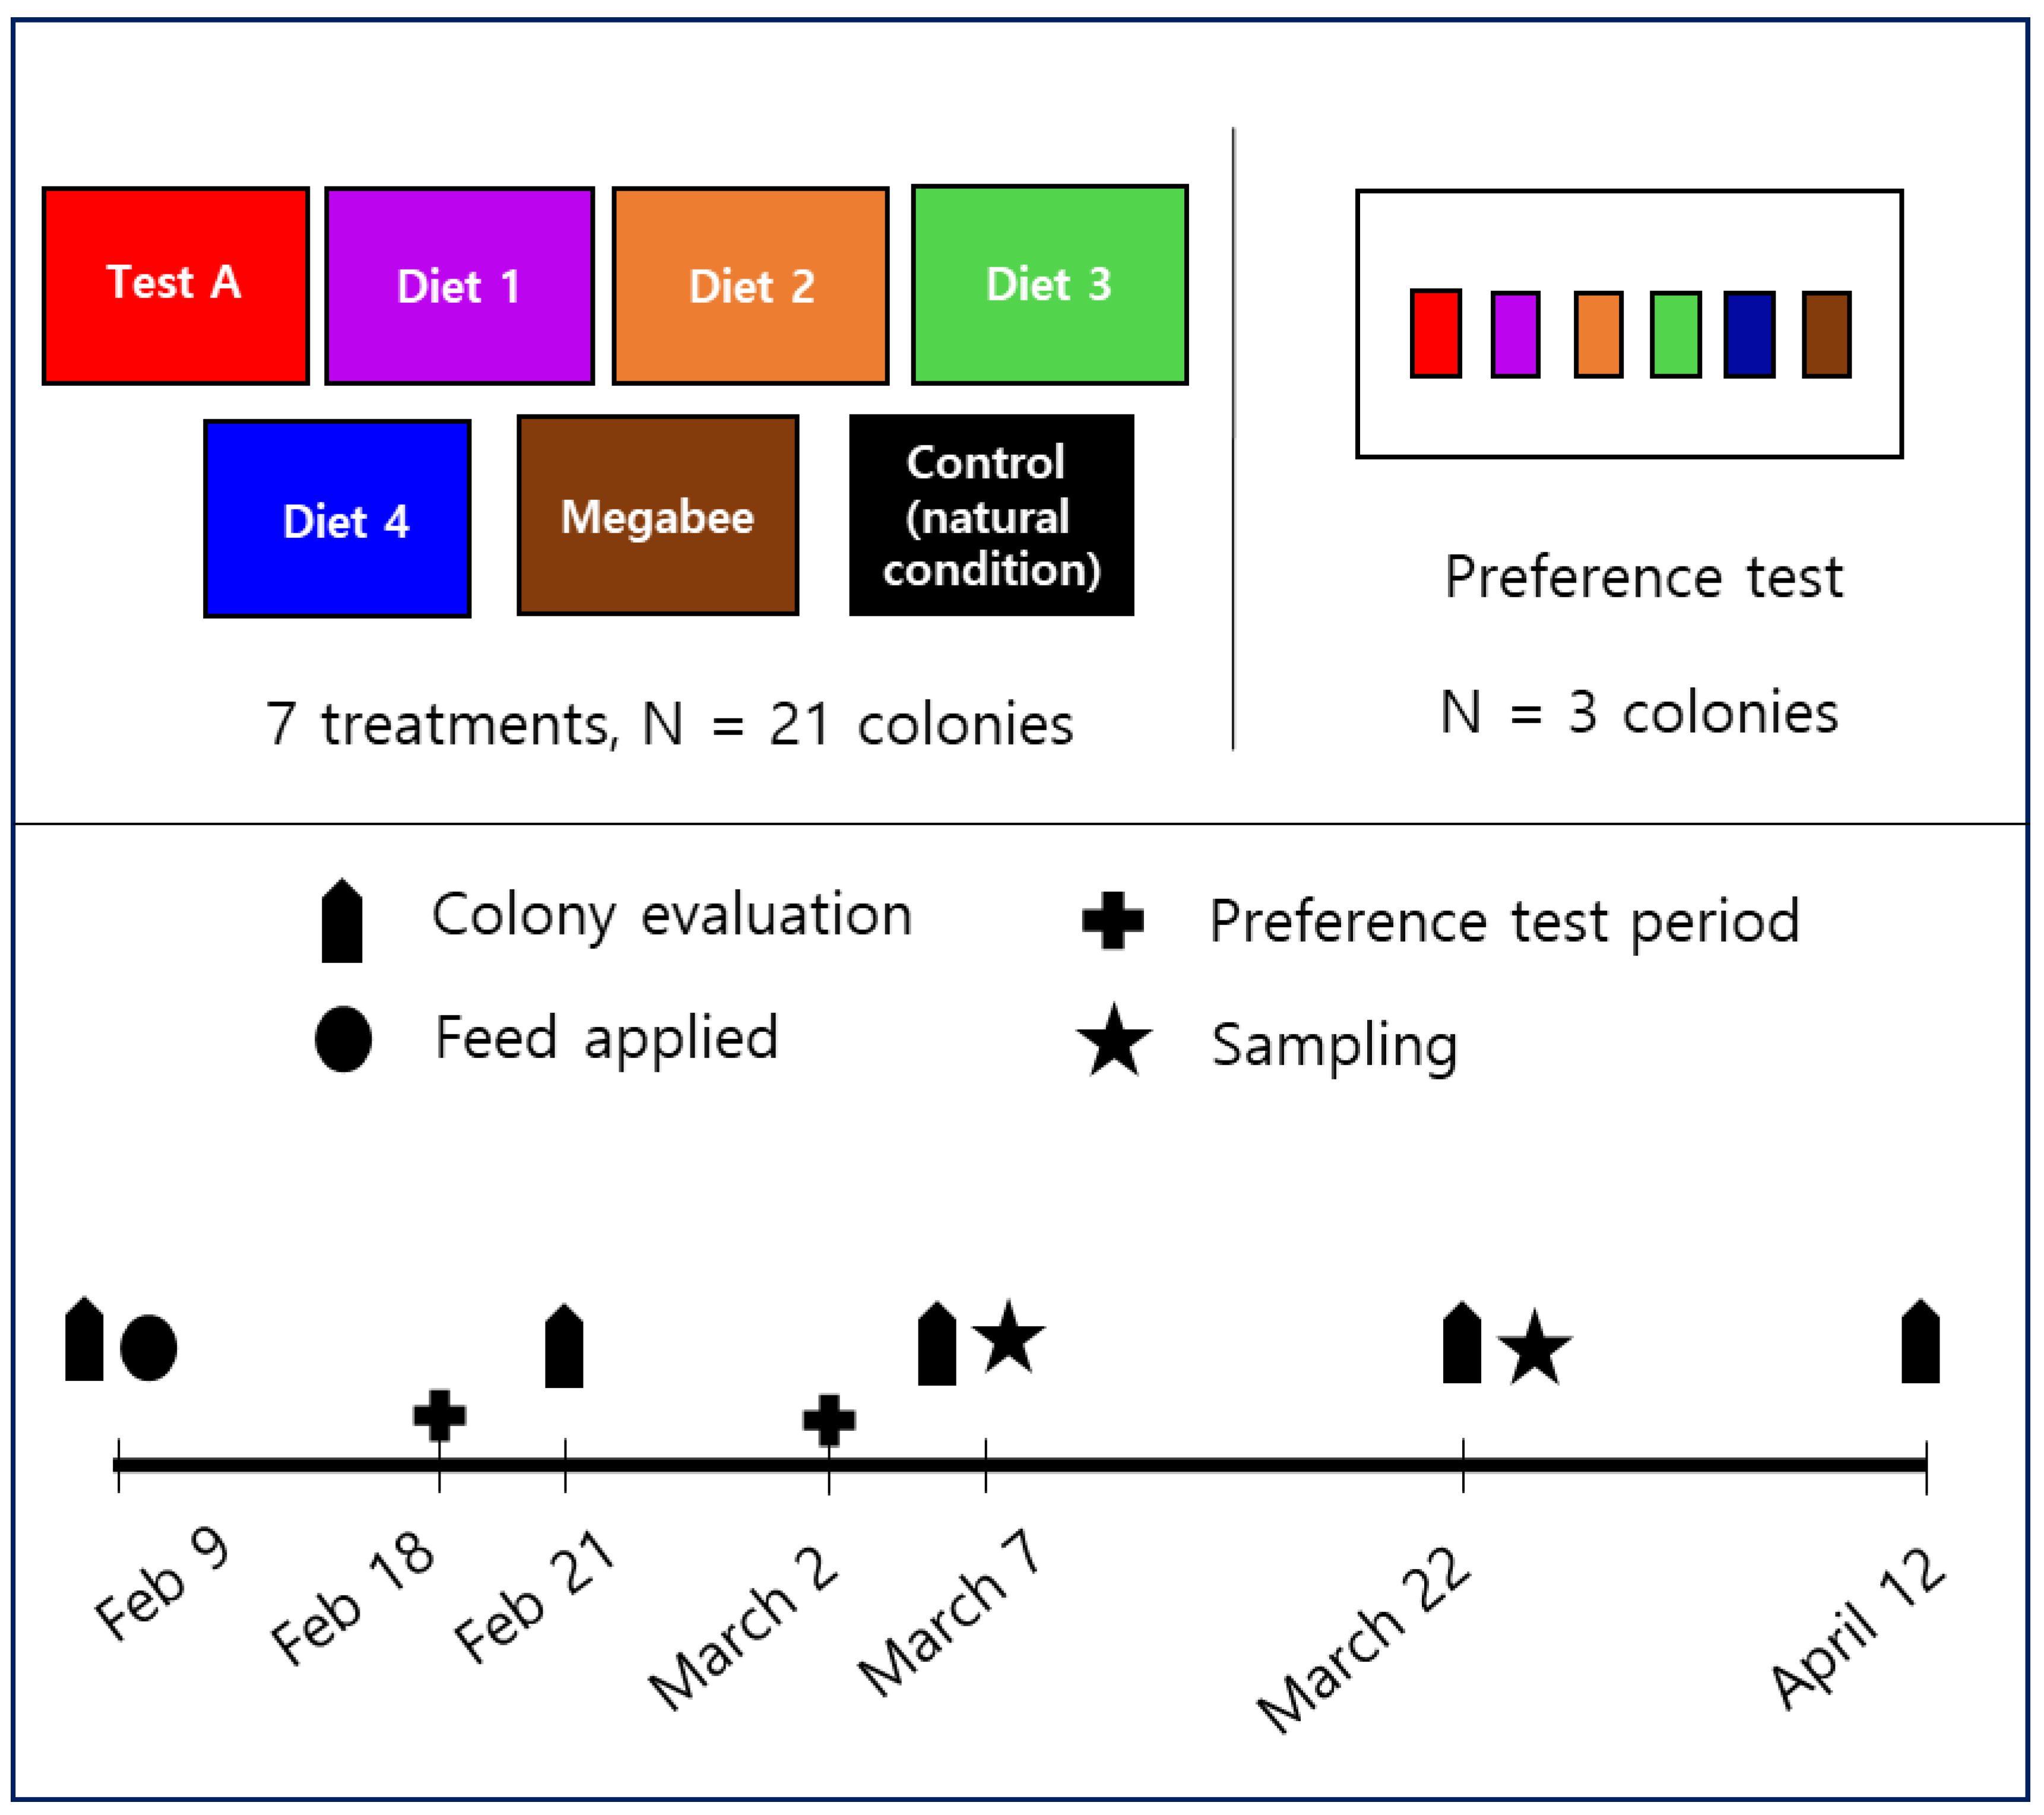
2.1. Preparation of the Pollen Substitute Diet and Experimental Design
2.2. Consumption
2.3. Preference
2.4. Honey Bee Population
2.5. The Capped Brood Area
2.6. Colony Weight
2.7. Honey Bees’ Weight Measurements
2.8. RNA Extraction and Quantitative PCR (qPCR)
2.9. Statistical Analyses
3. Results
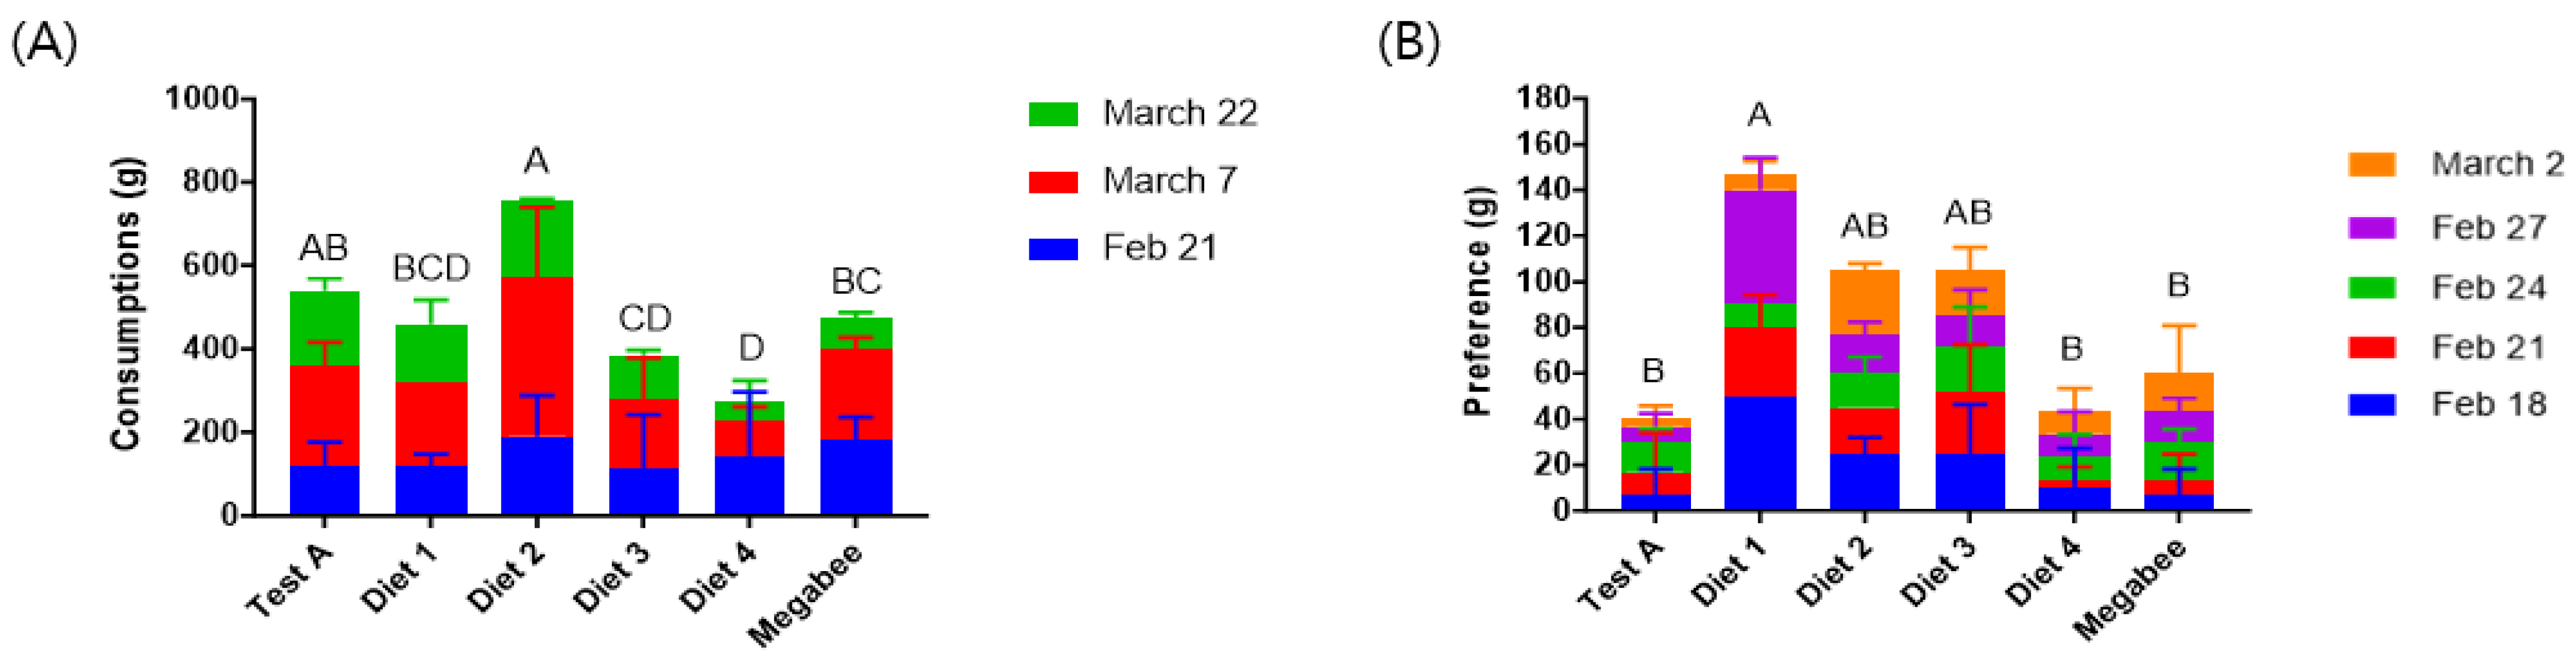
3.1. Consumption and Preference
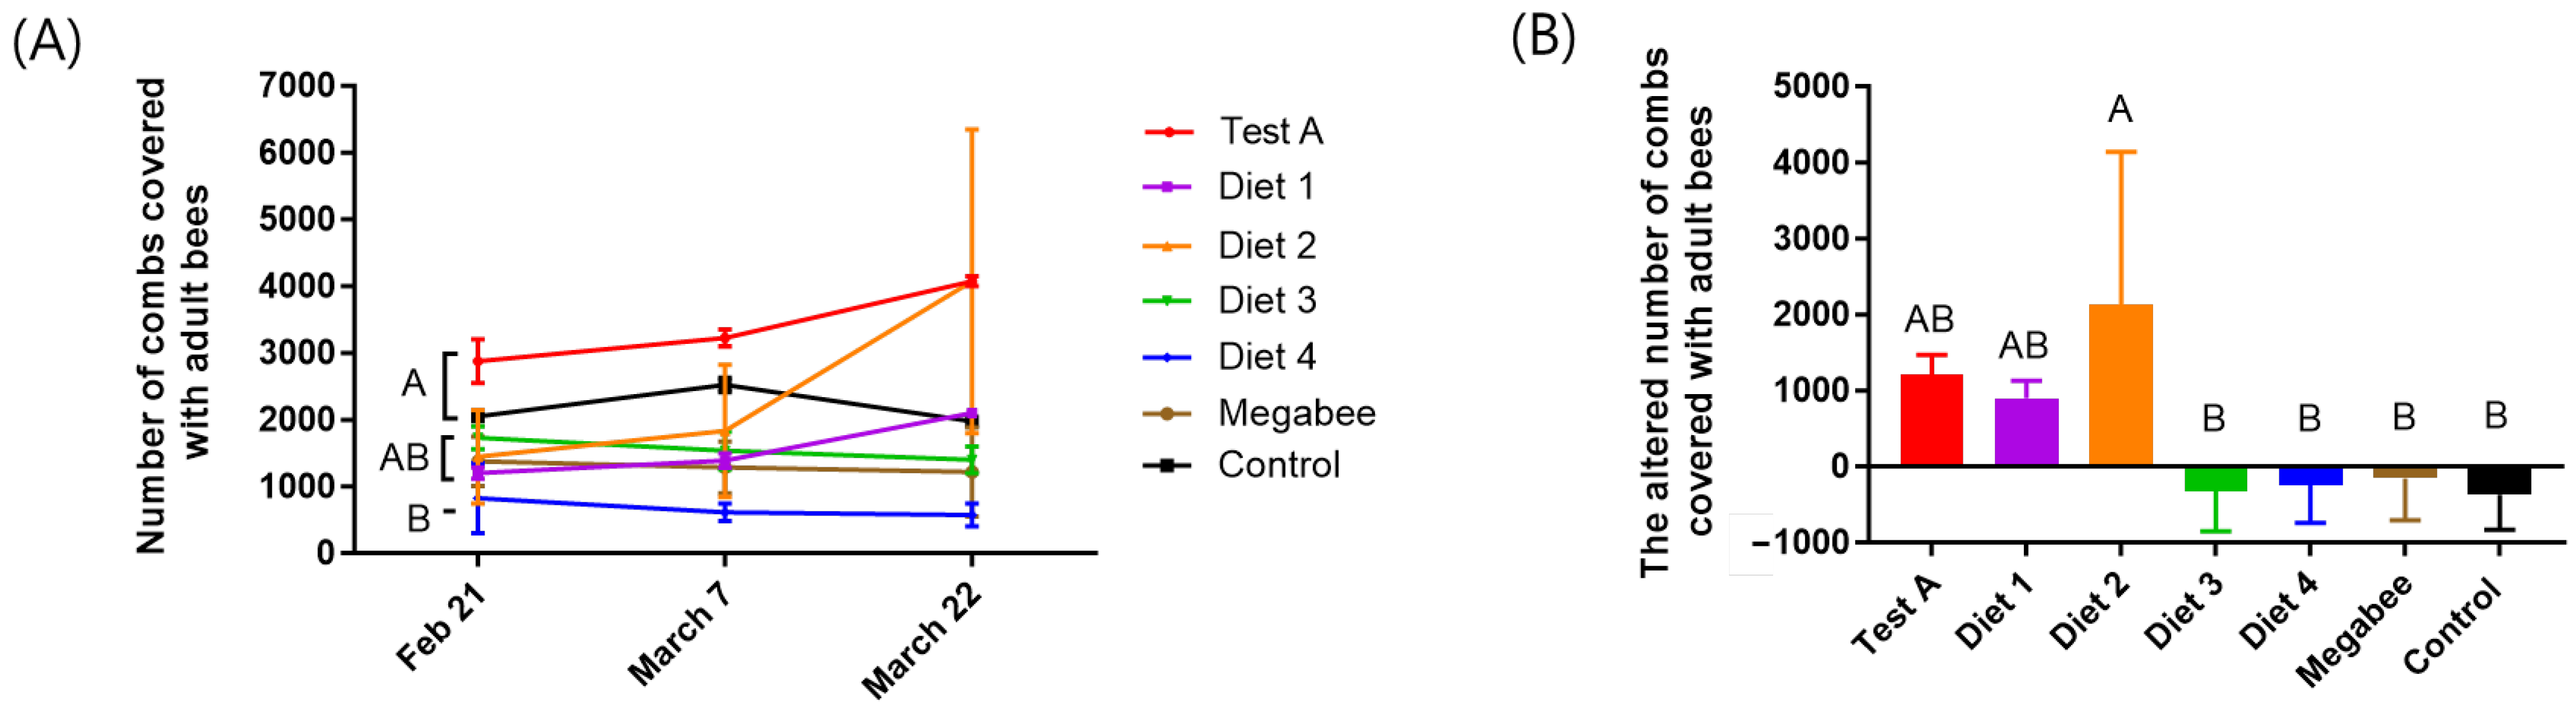
3.2. Colony Population
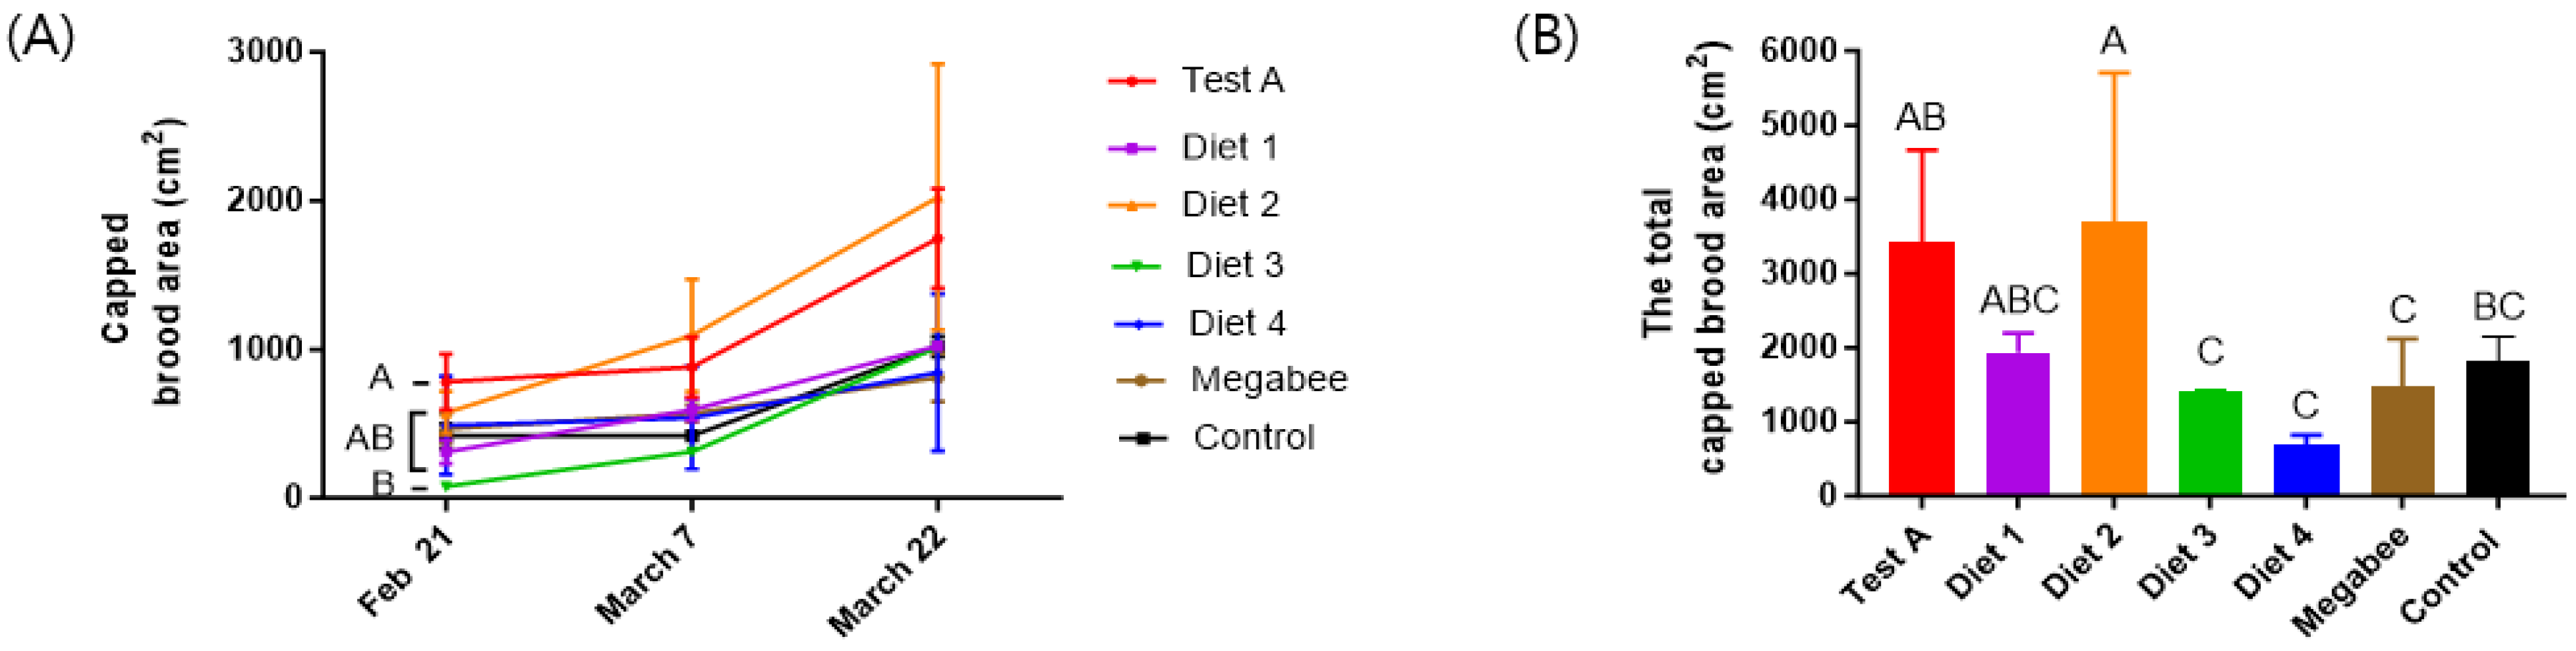
3.3. Capped Brood Area
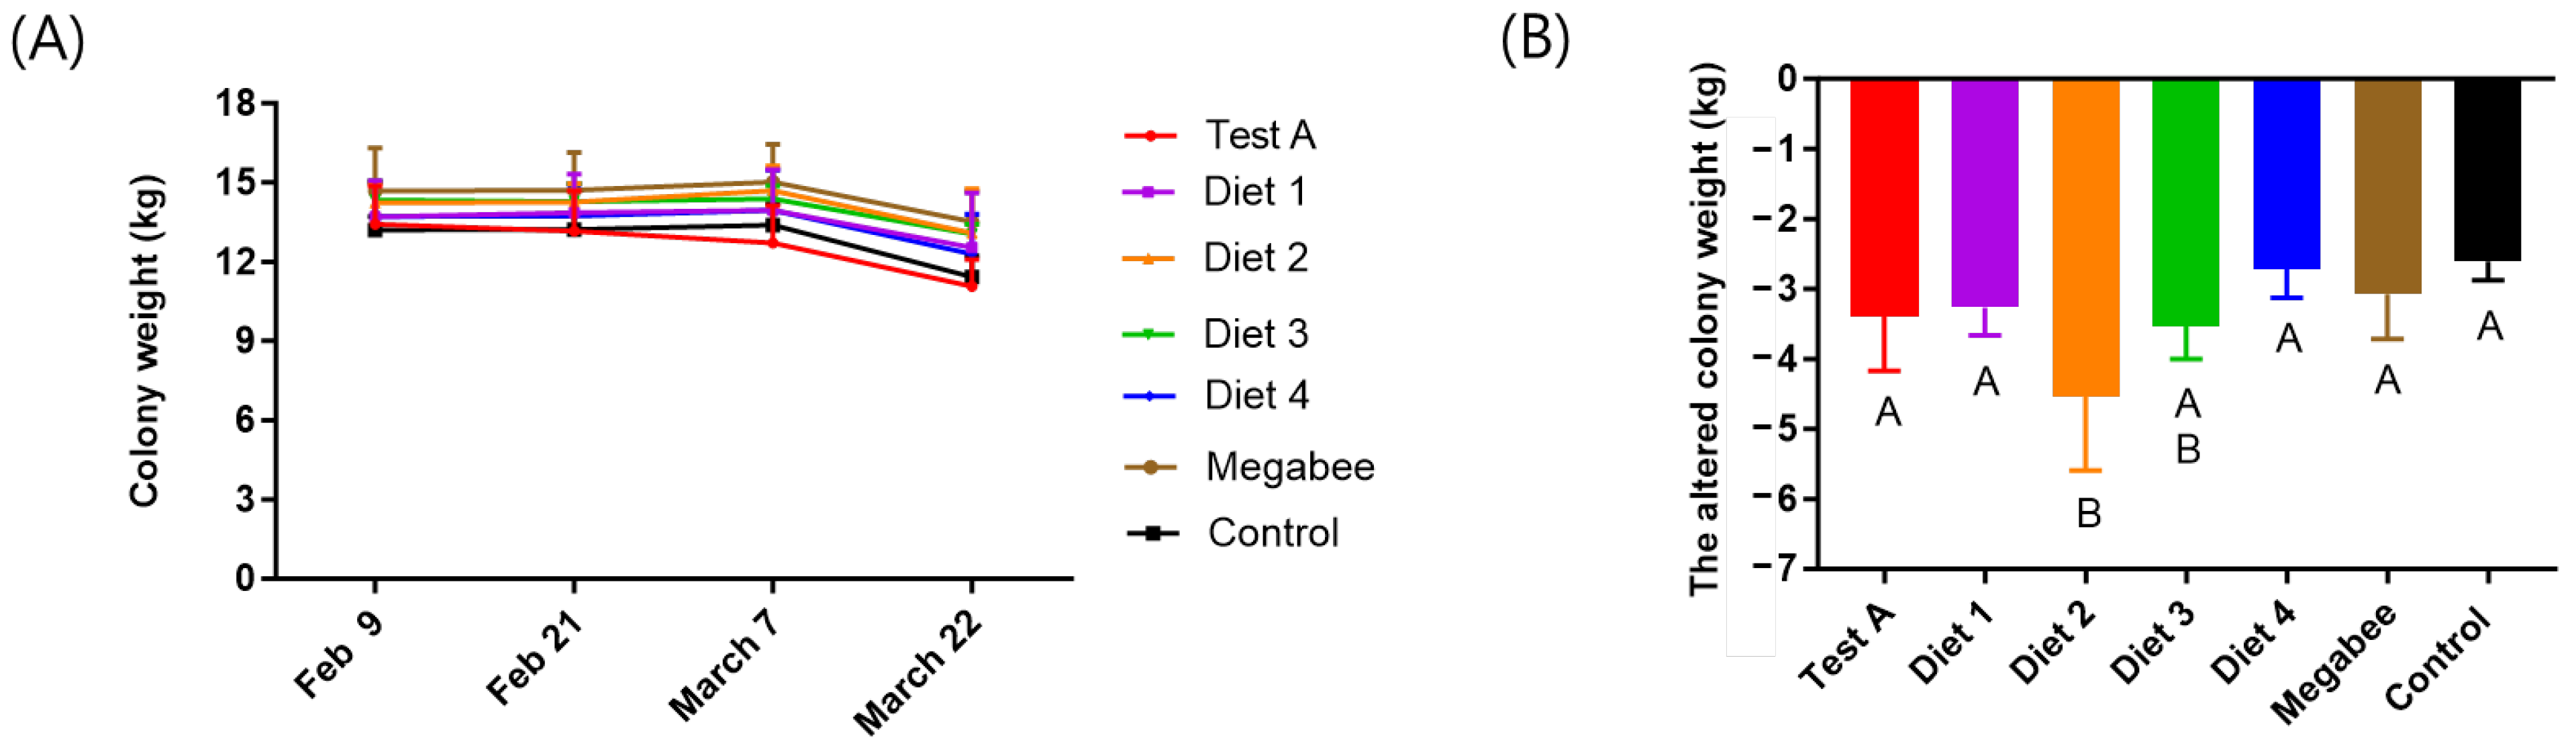
3.4. Colony Weight
3.5. Honey Bees’ Weight
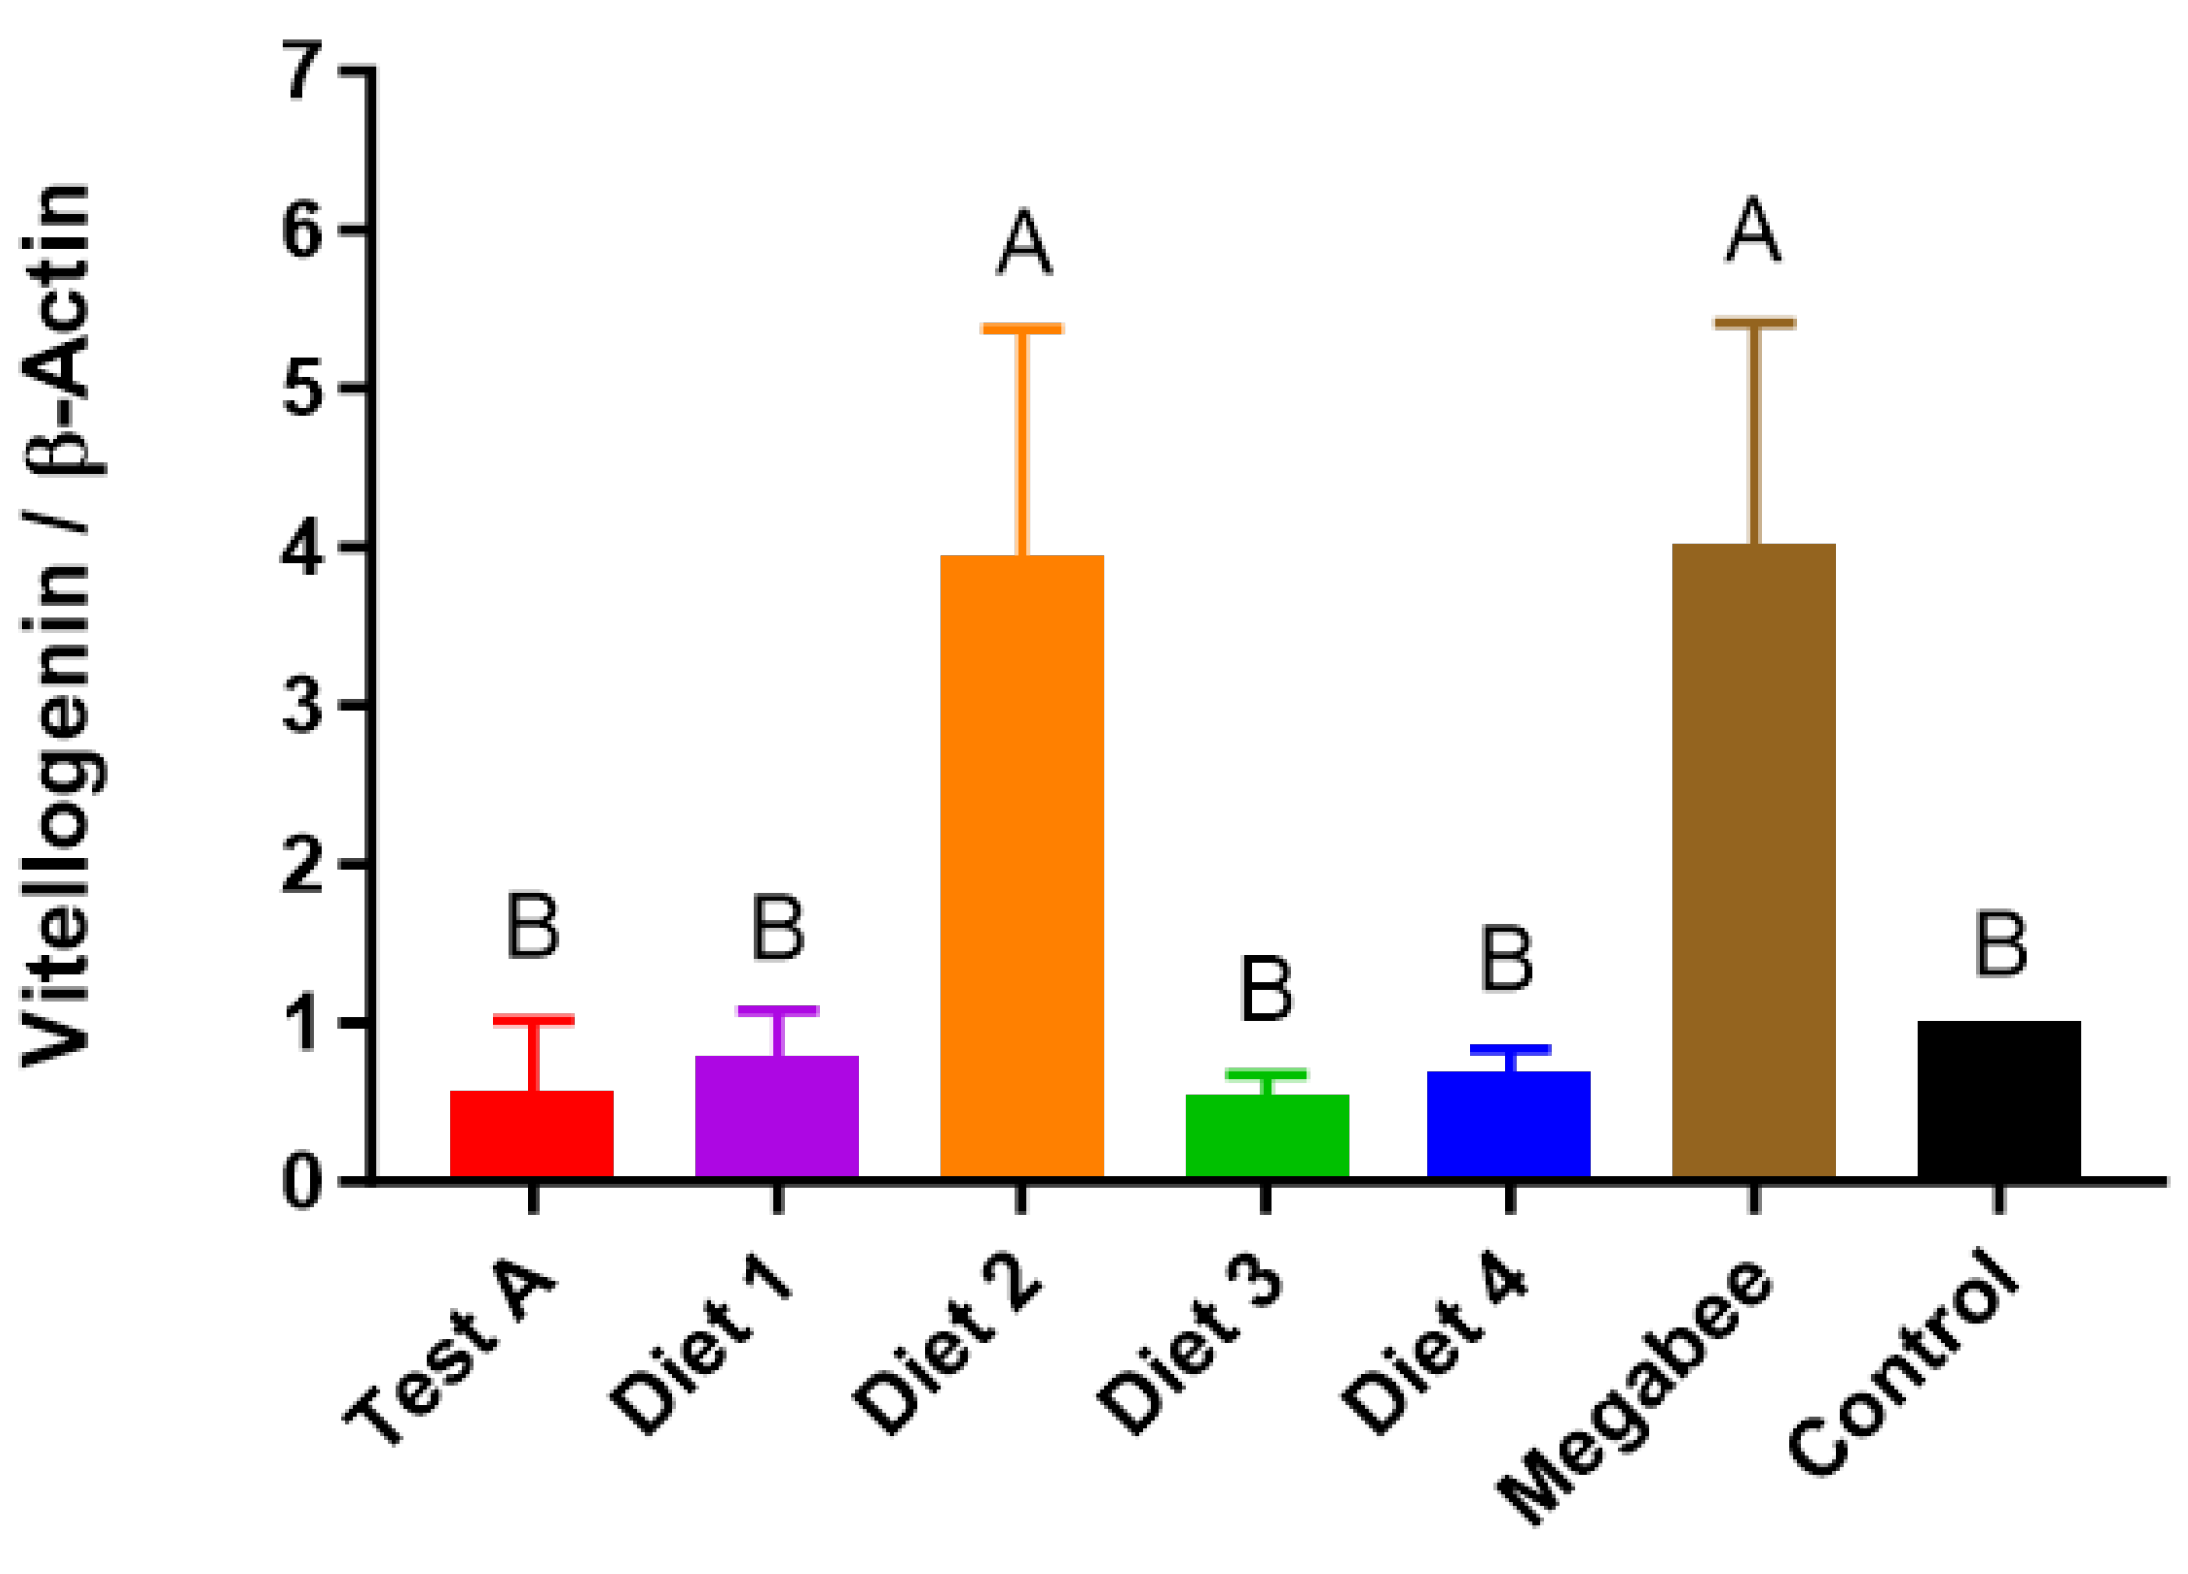
3.6. Vitellogenin
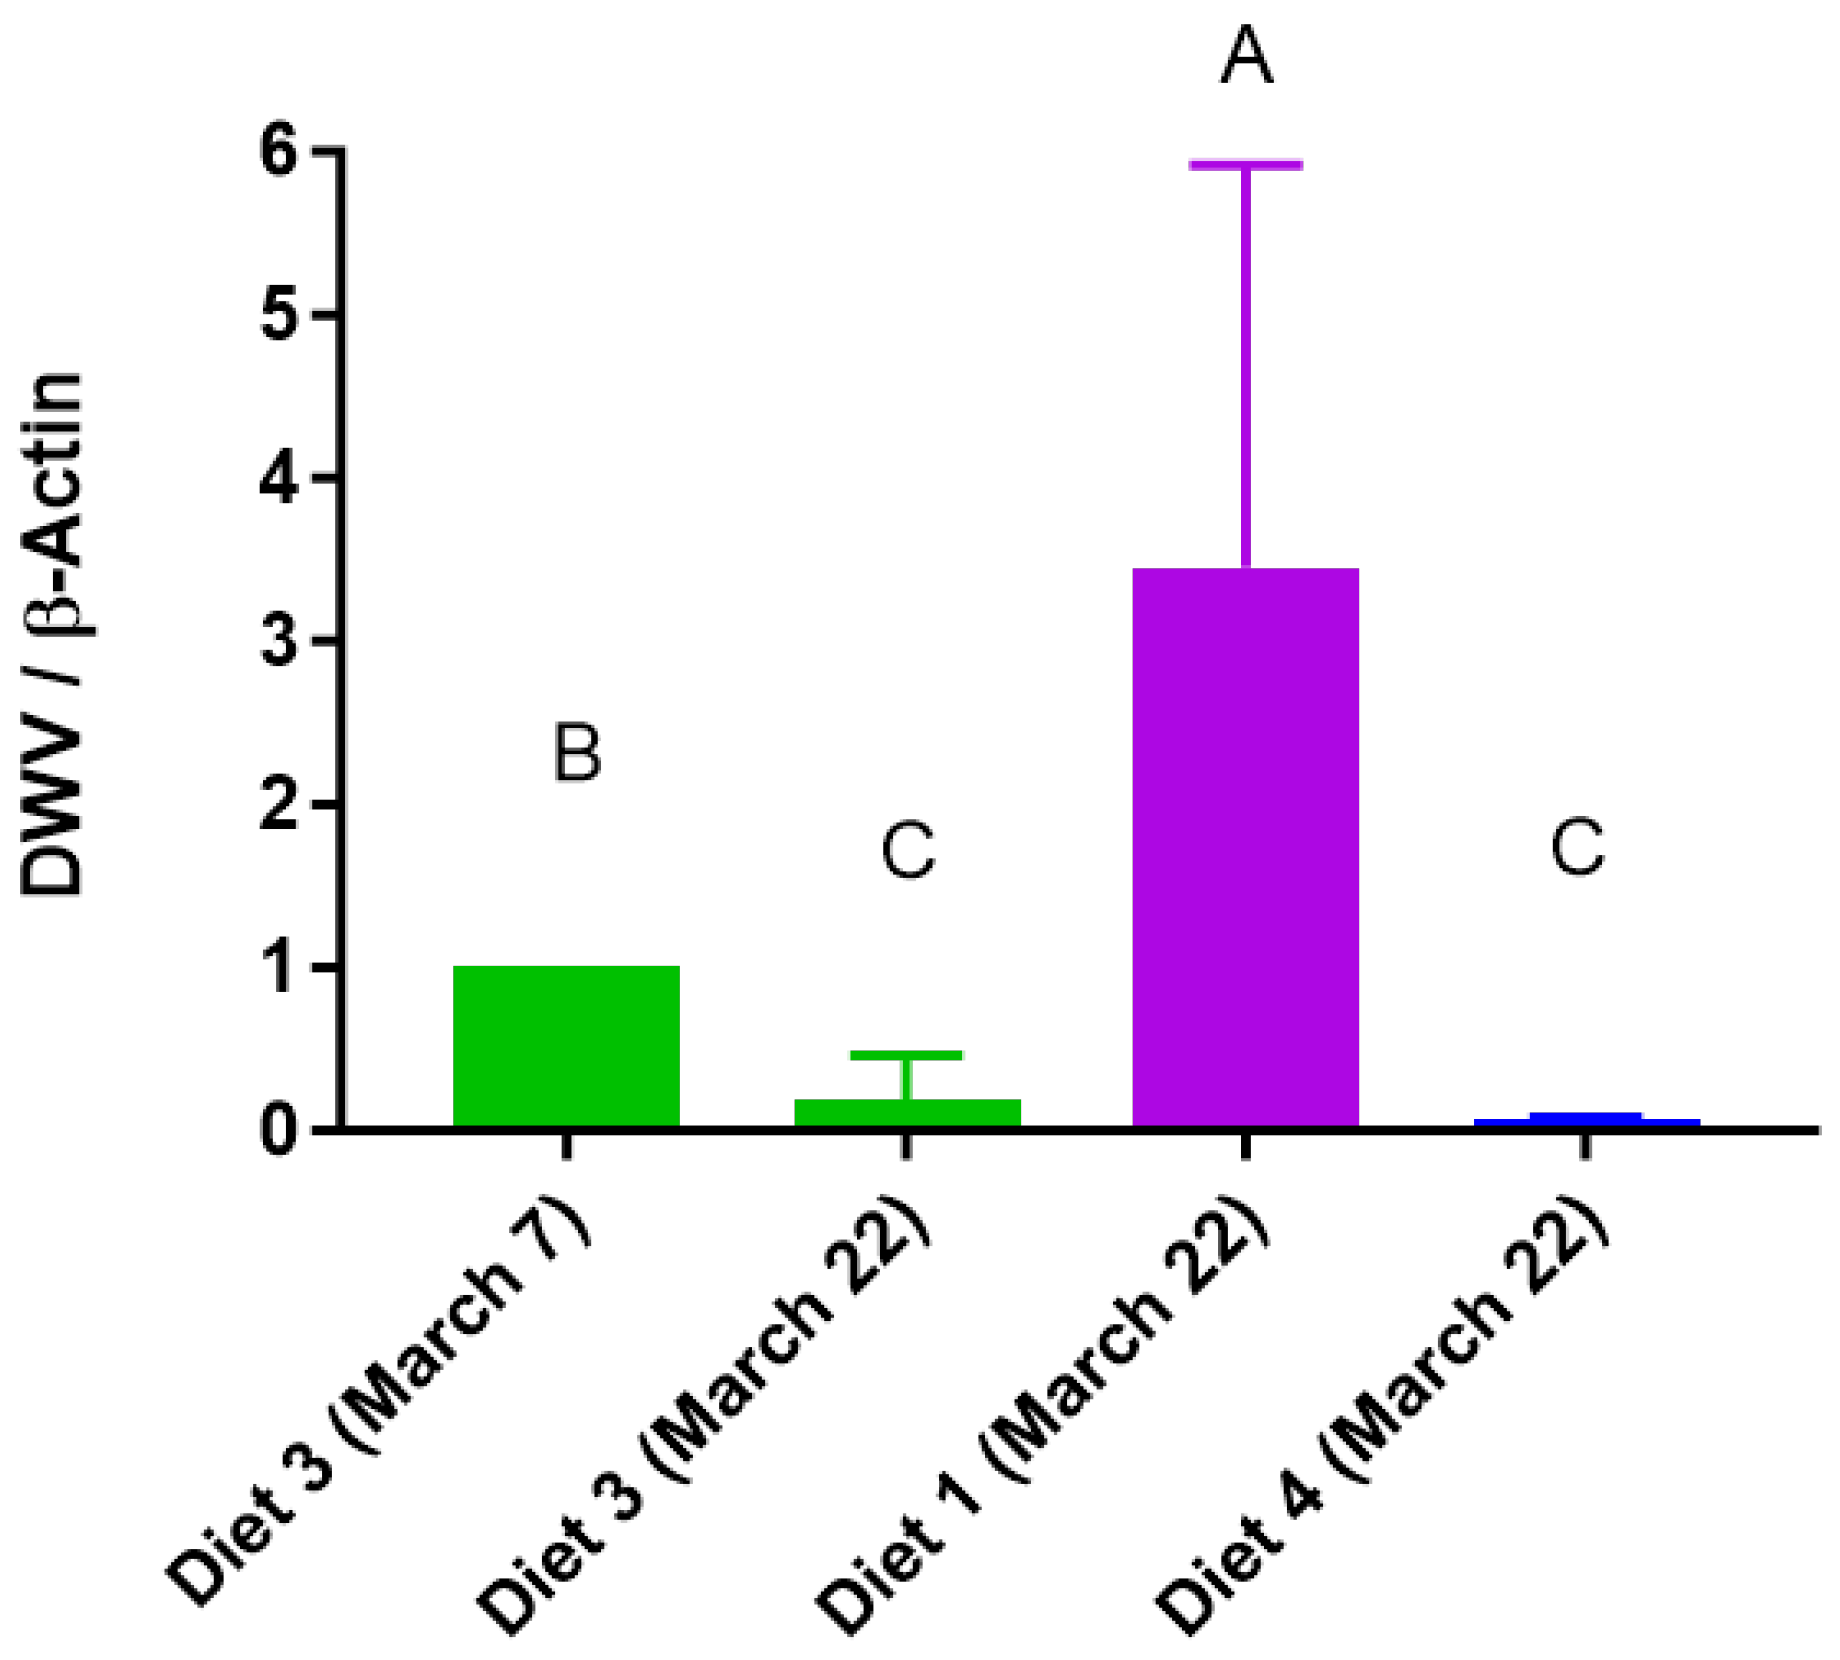
3.7. DWV
4. Discussion
5. Conclusions
6. Patents
Supplementary Materials
Author Contributions
Funding
Data Availability Statement
Acknowledgments
Conflicts of Interest
References
- Brodschneider, R.; Crailsheim, K. Nutrition and health in honey bees. Apidologie 2010, 41, 278–294. [Google Scholar] [CrossRef]
- Standifer, L.N.; Moeller, F.E.; Kauffeld, N.M.; Herbert, E.W., Jr.; Shimanuki, H. Supplemental feeding of honey bees colonies. Ann. Entomol. Soc. Am. 1977, 70, 691–693. [Google Scholar] [CrossRef]
- Ricigliano, V.A.; Williams, S.T.; Oliver, R. Effects of different artificial diets on commercial honey bees colony performance, health biomarkers, and gut microbiota. BMC Vet. Res. 2022, 18, 52. [Google Scholar] [CrossRef] [PubMed]
- Glavinic, U.; Stankovic, B.; Draakovj, V.; Stevanovj, J.; Petrovj, T.; Lakic, N.; Stanimirovi, Z. Dietary amino acid and vitamin complex protects honey bees from immunosuppression caused by Nosema ceranae. PLoS ONE 2017, 12, e0187726. [Google Scholar] [CrossRef] [PubMed]
- Groot, A.P.d. Protein and amino acid requirements of the honeybee (Apis mellifica L.). Physiol. Comp. Et Oecologia 1953, 3, 1–83. [Google Scholar]
- Donkersley, P.; Rhodes, G.; Pickup, R.W.; Jones, K.C.; Wilson, K. Honeybee nutrition is linked to landscape composition. Ecol. Evol. 2014, 4, 4195–4206. [Google Scholar] [CrossRef] [PubMed]
- Morais, M.M.; Turcatto, A.P.; Pereira, R.A.; Francoy, T.M.; Guidugli-Lazzarini, K.R.; Goncalves, L.S.; De Almeida, J.; Ellis, J.; De Jong, D. Protein levels and colony development of africanized and european honey bees fed natural and artificial diets. Genet. Mol. Res. 2013, 12, 6915–6922. [Google Scholar] [CrossRef]
- Saffari, A.; Kevan, P.G.; Atkinson, J.L. Palatability and consumption of patty-formulated pollen and pollen substitutes and their effects on honeybee colony performance. J. Apic. Sci. 2010, 54, 63–71. [Google Scholar]
- Noordyke, E.R.; van Santen, E.; Ellis, J.D. Tracing the fate of pollen substitute patties in western honey bees (Hymenoptera: Apidae) colonies. J. Econ. Entomol. 2021, 114, 1421–1430. [Google Scholar] [CrossRef]
- Raikhel, A.S.; Dhadialla, T. Accumulation of yolk proteins in insect oocytes. Annu. Rev. Entomol. 1992, 37, 217–251. [Google Scholar] [CrossRef]
- Kim, Y.H.; Kim, B.Y.; Kim, J.M.; Choi, Y.S.; Lee, M.Y.; Lee, K.S.; Jin, B.R. Differential Expression of Major Royal Jelly Proteins in the Hypopharyngeal Glands of the Honeybee Apis mellifera Upon Bacterial Ingestion. Insects 2022, 13, 334. [Google Scholar] [CrossRef]
- Sarioğlu-Bozkurt, A.; Topal, E.; Güneş, N.; Üçeş, E.; Cornea-Cipcigan, M.; Coşkun, İ.; Cuibus, L.; Mărgăoan, R. Changes in vitellogenin (vg) and stress protein (hsp 70) in honey bees (Apis mellifera anatoliaca) groups under different diets linked with physico-chemical, antioxidant and fatty and amino acid profiles. Insects 2022, 13, 985. [Google Scholar] [CrossRef] [PubMed]
- Li, J.; Heerman, M.C.; Evans, J.D.; Rose, R.; Li, W.; Rodríguez-García, C.; De Grandi-Hoffman, G.; Zhao, Y.; Huang, S.; Li, Z.; et al. Pollen reverses decreased lifespan, altered nutritional metabolism and suppressed immunity in honey bees (Apis mellifera) treated with antibiotics. J. Exp. Biol. 2019, 222, jeb.202077. [Google Scholar] [CrossRef] [PubMed]
- Ellis, J.D.; Munn, P.A. The worldwide health status of honey bees. Bee World 2005, 86, 88–101. [Google Scholar] [CrossRef]
- Bowen-Walker, P.L.; Gunn, A. Inter-host transfer and survival of Varroa jacobsoni under simulated and natural winter conditions. J. Apic. Res. 1998, 37, 199–204. [Google Scholar] [CrossRef]
- Highfield, A.C.; El Nagar, A.; Mackinder, L.C.; Noël, L.M.; Hall, M.J.; Martin, S.J.; Schroeder, D.C. Deformed wing virus implicated in overwintering honeybee colony losses. Appl. Environ. Microbiol. 2009, 75, 7212–7220. [Google Scholar] [CrossRef] [PubMed]
- Kim, H.J.; Hwang, J.; Ullah, Z.; Mustafa, B.; Kwon, H.W. Comparison of physicochemical properties of pollen substitute diet for honey bees (Apis mellifera). J. Asia-Pac. Entomol. 2022, 25, 101967. [Google Scholar] [CrossRef]
- Knoll, S.; Pinna, W.; Varcasia, A.; Scala, A.; Cappai, M.G. The honey bees (Apis mellifera L.; 1758) and the seasonal adaptation of productions. Highlights on summer to winter transition and back to summer metabolic activity. A review. Livest. Sci. 2020, 235, 104011. [Google Scholar] [CrossRef]
- Requier, F.; Odoux, J.F.; Henry, M.; Bretagnolle, V. The carry-over effects of pollen shortage decrease the survival of honeybee colonies in farmlands. J. Appl. Ecol. 2017, 54, 1161–1170. [Google Scholar] [CrossRef]
- Roh, S.G.; Carroll, J.A.; Kim, S.W. Effects of fermented soybean meal on innate immunity-related gene expressions in nursery pigs acutely challenged with lipopolysaccharides. Anim. Sci. J. 2015, 86, 508–516. [Google Scholar] [CrossRef]
- Wenninger, E.J.; Landolt, P.J. Apple and sugar feeding in adult codling moths, cydia pomonella: Effects on longevity, fecundity, and egg fertility. J. Insect Sci. 2011, 11, 161. [Google Scholar] [CrossRef] [PubMed]
- Jehlík, T.; Kodrík, D.; Krištůfek, V.; Koubová, J.; Sábová, M.; Danihlík, J.; Tomčala, A.; Čapková Frydrychová, R. Effects of chlorella sp. On biological characteristics of the honey bees Apis mellifera. Apidologie 2019, 50, 564–577. [Google Scholar] [CrossRef]
- Asadi, N.; Husseini, S.D.; Tohidian, M.-T.; Abdali, N.; Mimandipoure, A.; Rafieian-Kopaei, M.; Bahmani, M. Performance of broilers supplemented with peppermint (Mentha piperita L.) powder. J. Evid.-Based Complement. Altern. Med. 2017, 22, 703–706. [Google Scholar] [CrossRef] [PubMed]
- De Grandi-Hoffman, G.; Wardell, G.; Ahumada-Segura, F.; Rinderer, T.; Danka, R.; Pettis, J. Comparisons of pollen substitute diets for honey bees: Consumption rates by colonies and effects on brood and adult populations. J. Apic. Res. 2008, 47, 265–270. [Google Scholar] [CrossRef]
- Topal, E.; Mărgăoan, R.; Bay, V.; Takma, Ç.; Yücel, B.; Oskay, D.; Düz, G.; Acar, S.; Kösoğlu, M. The Effect of Supplementary Feeding with Different Pollens in Autumn on Colony Development under Natural Environment and In Vitro Lifespan of Honey Bees. Insects 2022, 13, 588. [Google Scholar] [CrossRef] [PubMed]
- Akyol, E.; Unalan, A.; Yeninar, H.; Ozkok, D.; Ozturk, C. Comparison of colony performances of anatolian, caucasian and carniolan honeybee (Apis mellifera L.) genotypes in temperate climate conditions. Ital. J. Anim. Sci. 2014, 13, 3409. [Google Scholar] [CrossRef]
- El-Wahab, T.E.A.; Ghania, A.; Zidan, E.W. Assessment a new pollen supplement diet for honey beess colonies and their effects on some biological activities. Int. J. Agric. Technol. 2016, 12, 55–62. [Google Scholar]
- Radev, Z.; Liolios, V.; Tananaki, C.; Thrasyvoulou, A. The impact of the nutritive value of pollen on the development, reproduction and productivity of honey bees (Apis mellifera L.). Bulg. Agric. J. Sci. 2014, 20, 685–689. [Google Scholar]
- Ghosh, S.; Jeon, H.; Jung, C. Foraging behavior and preference of pollen sources by honey bees (Apis mellifera) relative to protein contents. Ecol. J. Environ. 2020, 44, 4. [Google Scholar] [CrossRef]
- Lozovskaya, M.V.; Hossain, A.; Likhter, A.M.; Velikorodov, A.V.; Pirogovsky, M.I. Study the Nectars’ Chemical Composition of Apple, Cherry and Pumpkin. Thai J. Agric. Sci. 2013, 46, 75–84. [Google Scholar]
- Akšić, M.F.; Nešović, M.; Cirić, I.; Tešić, Ž.; Pezo, L.; Tosti, T.; Gašić, U.; Dojcinović, B.; Loncar, B.; Meland, M. Polyphenolics and chemical profiles of domestic norwegian apple (Malus × domestica Borkh.) Cultivars. Front. Nutr. 2022, 9, 941487. [Google Scholar] [CrossRef]
- Sharma, H.K.; Devi, M.; Thakur, P.; Sharma, R.; Rana, K.; Thakur, M. Apis mellifera L. stock varied in apple pollen foraging preference. Indian J. Entomol. 2023, 85, 84–87. [Google Scholar] [CrossRef]
- Borkakati, R.N.; Venkatesh, M.R.; Saikia, D.K.; Sasanka, S.B. A brief review on food recognition by insects: Use of sensory and behavioral mechanisms. J. Entomol. Zool. Stud. 2019, 7, 574–579. [Google Scholar]
- Jung, J.; Park, K.; Ahn, Y.; Kwon, H. Functional characterization of sugar receptors in the Western honeybee, Apis mellifera. J. Asia-Pacific Entomol. 2015, 18, 19–26. [Google Scholar] [CrossRef]
- Vaudo, A.D.; Patch, H.M.; Mortensen, D.A.; Tooker, J.F.; Grozinger, C.M. Macronutrient ratios in pollen shape bumble bee (Bombus impatiens) foraging strategies and floral preferences. Proc. Natl. Acad. Sci. USA 2016, 113, E4035–E4042. [Google Scholar] [CrossRef]
- Gemeda, T.K. Testing the effect of dearth period supplementary feeding of honeybee (Apis mellifera) on brood development and honey production. Int. Adv. J. Res. 2014, 2, 319–324. [Google Scholar]
- Sihag, R.C.; Gupta, M. Development of an artificial pollen substitute/supplement diet to help tide the colonies of honeybee (Apis mellifera L.) over the dearth season. J. Apic. Sci. 2011, 55, 15–28. [Google Scholar]
- Meikle, W.G.; Rector, B.G.; Mercadier, G.; Holst, N. Within-day variation in continuous hive weight data as a measure of honey bees colony activity. Apidologie 2008, 39, 694–707. [Google Scholar] [CrossRef]
- Eishchen, F.A.; Rothenbuhler, W.C.; Kulinčević, J.M. Length of life and dry weight of worker honeybees reared in colonies with different worker-larva ratios. J. Apic. Res. 1982, 21, 19–25. [Google Scholar] [CrossRef]
- Wang, Y.; Mutti, N.S.; Ihle, K.E.; Siegel, A.; Dolezal, A.G.; Kaftanoglu, O.; Amdam, G.V. Down-regulation of honey bee irs gene biases behavior toward food rich in protein. PLoS Genet. 2010, 6, e1000896. [Google Scholar] [CrossRef]
- Aurori, C.M.; Buttstedt, A.; Dezmirean, D.S.; Mărghitaş, L.A.; Moritz, R.F.; Erler, S. What is the main driver of aging in long-lived winter honeybees: Antioxidant enzymes, innate immunity, or vitellogenin? J. Gerontol. A Biol. Sci. Med. Sci. 2014, 69, 633–639. [Google Scholar] [CrossRef]
- Wang, H.; Zhang, S.W.; Zeng, Z.J.; Yan, W.Y. Nutrition affects longevity and gene expression in honey bees (Apis mellifera) workers. Apidologie 2014, 45, 618–625. [Google Scholar] [CrossRef]
- Bitondi, M.; Simoes, Z.P. The relationship between level of pollen in the diet, vitellogenin and juvenile hormone titers in africanized Apis mellifera workers. J. Apic. Res. 1996, 35, 27–36. [Google Scholar] [CrossRef]
- Nilsen, K.A.; Ihle, K.E.; Frederick, K.; Fondrk, M.K.; Smedal, B.; Hartfelder, K.; Amdam, G.V. Insulin-like peptide genes in honey bee fat body respond differently to manipulation of social behavioral physiology. J. Exp. Biol. 2011, 214, 1488–1497. [Google Scholar] [CrossRef]
- Di Pasquale, G.; Alaux, C.; Le Conte, Y.; Odoux, J.-F.; Pioz, M.; Vaissière, B.E.; Belzunces, L.P.; Decourtye, A. Variations in the availability of pollen resources affect honey bee health. PLoS ONE 2016, 11, e0162818. [Google Scholar] [CrossRef]
- Foley, K.; Fazio, G.; Jensen, A.B.; Hughes, W.O.H. Nutritional limitation and resistance to opportunistic aspergillus parasites in honey bee larvae. J. Invertebr. Pathol. 2012, 111, 68–73. [Google Scholar] [CrossRef] [PubMed]


| Ingredients | Test A | Diet 1 | Diet 2 | Diet 3 | Diet 4 |
|---|---|---|---|---|---|
| Brewer’s yeast | 39.69 | 39.69 | 39.69 | 39.69 | 39.69 |
| Egg yolk | 2.21 | 2.21 | 2.21 | 2.21 | 2.21 |
| Defatted soybean powder | 2.21 | - | 2.21 | 2.21 | 2.21 |
| Sugar | 35.36 | 35.36 | 35.36 | 35.36 | 33.86 |
| Boiled water | 15.16 | 5.16 | 7.16 | 5.16 | 5.16 |
| Canola oil | 1.01 | 1.01 | 1.01 | 1.01 | 1.01 |
| Cellulose | 0.88 | 0.88 | 0.88 | 0.88 | 0.88 |
| Wheat bran powder | 0.88 | 0.88 | 0.88 | 0.88 | 0.88 |
| Multiple vitamins | 0.44 | 0.44 | 0.44 | 0.44 | 0.44 |
| L-methionine | 0.10 | 0.10 | 0.10 | 0.10 | 0.10 |
| L-lysine | 0.24 | 0.24 | 0.24 | 0.24 | 0.24 |
| Citric acid | 1.85 | 1.85 | 1.85 | 1.85 | 1.85 |
| IMP | - | 0.00 | 0.00 | 0.00 | 0.00 |
| GMP | - | 0.00 | 0.00 | 0.00 | 0.00 |
| Tangerine juice | - | 10.00 | 4.00 | 10.00 | 10.00 |
| Soytide powder | - | 2.21 | - | - | - |
| Apple juice | - | - | 4.00 | - | - |
| Chlorella powder | - | - | - | 0.08 | - |
| Mint powder | - | - | - | - | 3.00 |
| Diets | Consumptions (g/Colony) | Preference (g/Colony) | Populations (Bees/Colony) | Total Capped Brood Area (cm2) | The Altered Colony Weight (kg) |
|---|---|---|---|---|---|
| Test A | 539.50 ± 28.99 ab | 40.00 ± 26.46 b | 1216.67 ± 251.66 ab | 3416 ± 1245.64 ab | −3.39 ± 0.78 a |
| Diet 1 | 459.67 ± 2.12 bcd | 145.00 ± 7.07 a | 900.00 ± 233.02 ab | 1931 ± 265.62 abc | −3.27 ± 0.40 a |
| Diet 2 | 758.00 ± 270.00 a | 100.00 ± 0.00 ab | 2135.00 ± 2001.11 a | 3699 ± 2003.83 a | −4.50 ± 1.06 b |
| Diet 3 | 385.33 ± 214.50 cd | 96.67 ± 66.58 ab | −330.00 ± 523.26 b | 1411 ± 4.44 c | −3.53 ± 0.47 ab |
| Diet 4 | 276.50 ± 2.12 d | 53.33 ± 20.82 b | −250.00 ± 494.97 b | 683 ± 131.55 c | −2.72 ± 0.41 a |
| Megabee | 475.67 ± 45.96 bc | 60.00 ± 34.64 b | −160.00 ± 545.25 b | 1483 ± 637.01 c | −3.07 ± 0.64 a |
| Control | - | - | −375.00 ± 459.62 b | 1812 ± 339.15 bc | −2.61 ± 0.27 a |
Disclaimer/Publisher’s Note: The statements, opinions and data contained in all publications are solely those of the individual author(s) and contributor(s) and not of MDPI and/or the editor(s). MDPI and/or the editor(s) disclaim responsibility for any injury to people or property resulting from any ideas, methods, instructions or products referred to in the content. |
© 2024 by the authors. Licensee MDPI, Basel, Switzerland. This article is an open access article distributed under the terms and conditions of the Creative Commons Attribution (CC BY) license (https://creativecommons.org/licenses/by/4.0/).
Share and Cite
Kim, H.; Frunze, O.; Maigoro, A.Y.; Lee, M.-L.; Lee, J.-H.; Kwon, H.-W. Comparative Study of the Effect of Pollen Substitute Diets on Honey Bees during Early Spring. Insects 2024, 15, 101. https://doi.org/10.3390/insects15020101
Kim H, Frunze O, Maigoro AY, Lee M-L, Lee J-H, Kwon H-W. Comparative Study of the Effect of Pollen Substitute Diets on Honey Bees during Early Spring. Insects. 2024; 15(2):101. https://doi.org/10.3390/insects15020101
Chicago/Turabian StyleKim, Hyunjee, Olga Frunze, Abdulkadir Yusif Maigoro, Myeong-Lyeol Lee, Jeong-Hyeon Lee, and Hyung-Wook Kwon. 2024. "Comparative Study of the Effect of Pollen Substitute Diets on Honey Bees during Early Spring" Insects 15, no. 2: 101. https://doi.org/10.3390/insects15020101
APA StyleKim, H., Frunze, O., Maigoro, A. Y., Lee, M.-L., Lee, J.-H., & Kwon, H.-W. (2024). Comparative Study of the Effect of Pollen Substitute Diets on Honey Bees during Early Spring. Insects, 15(2), 101. https://doi.org/10.3390/insects15020101