
Prediction of Potential Distribution of Carposina coreana in China under the Current and Future Climate Change

Abstract
:Simple Summary
Abstract
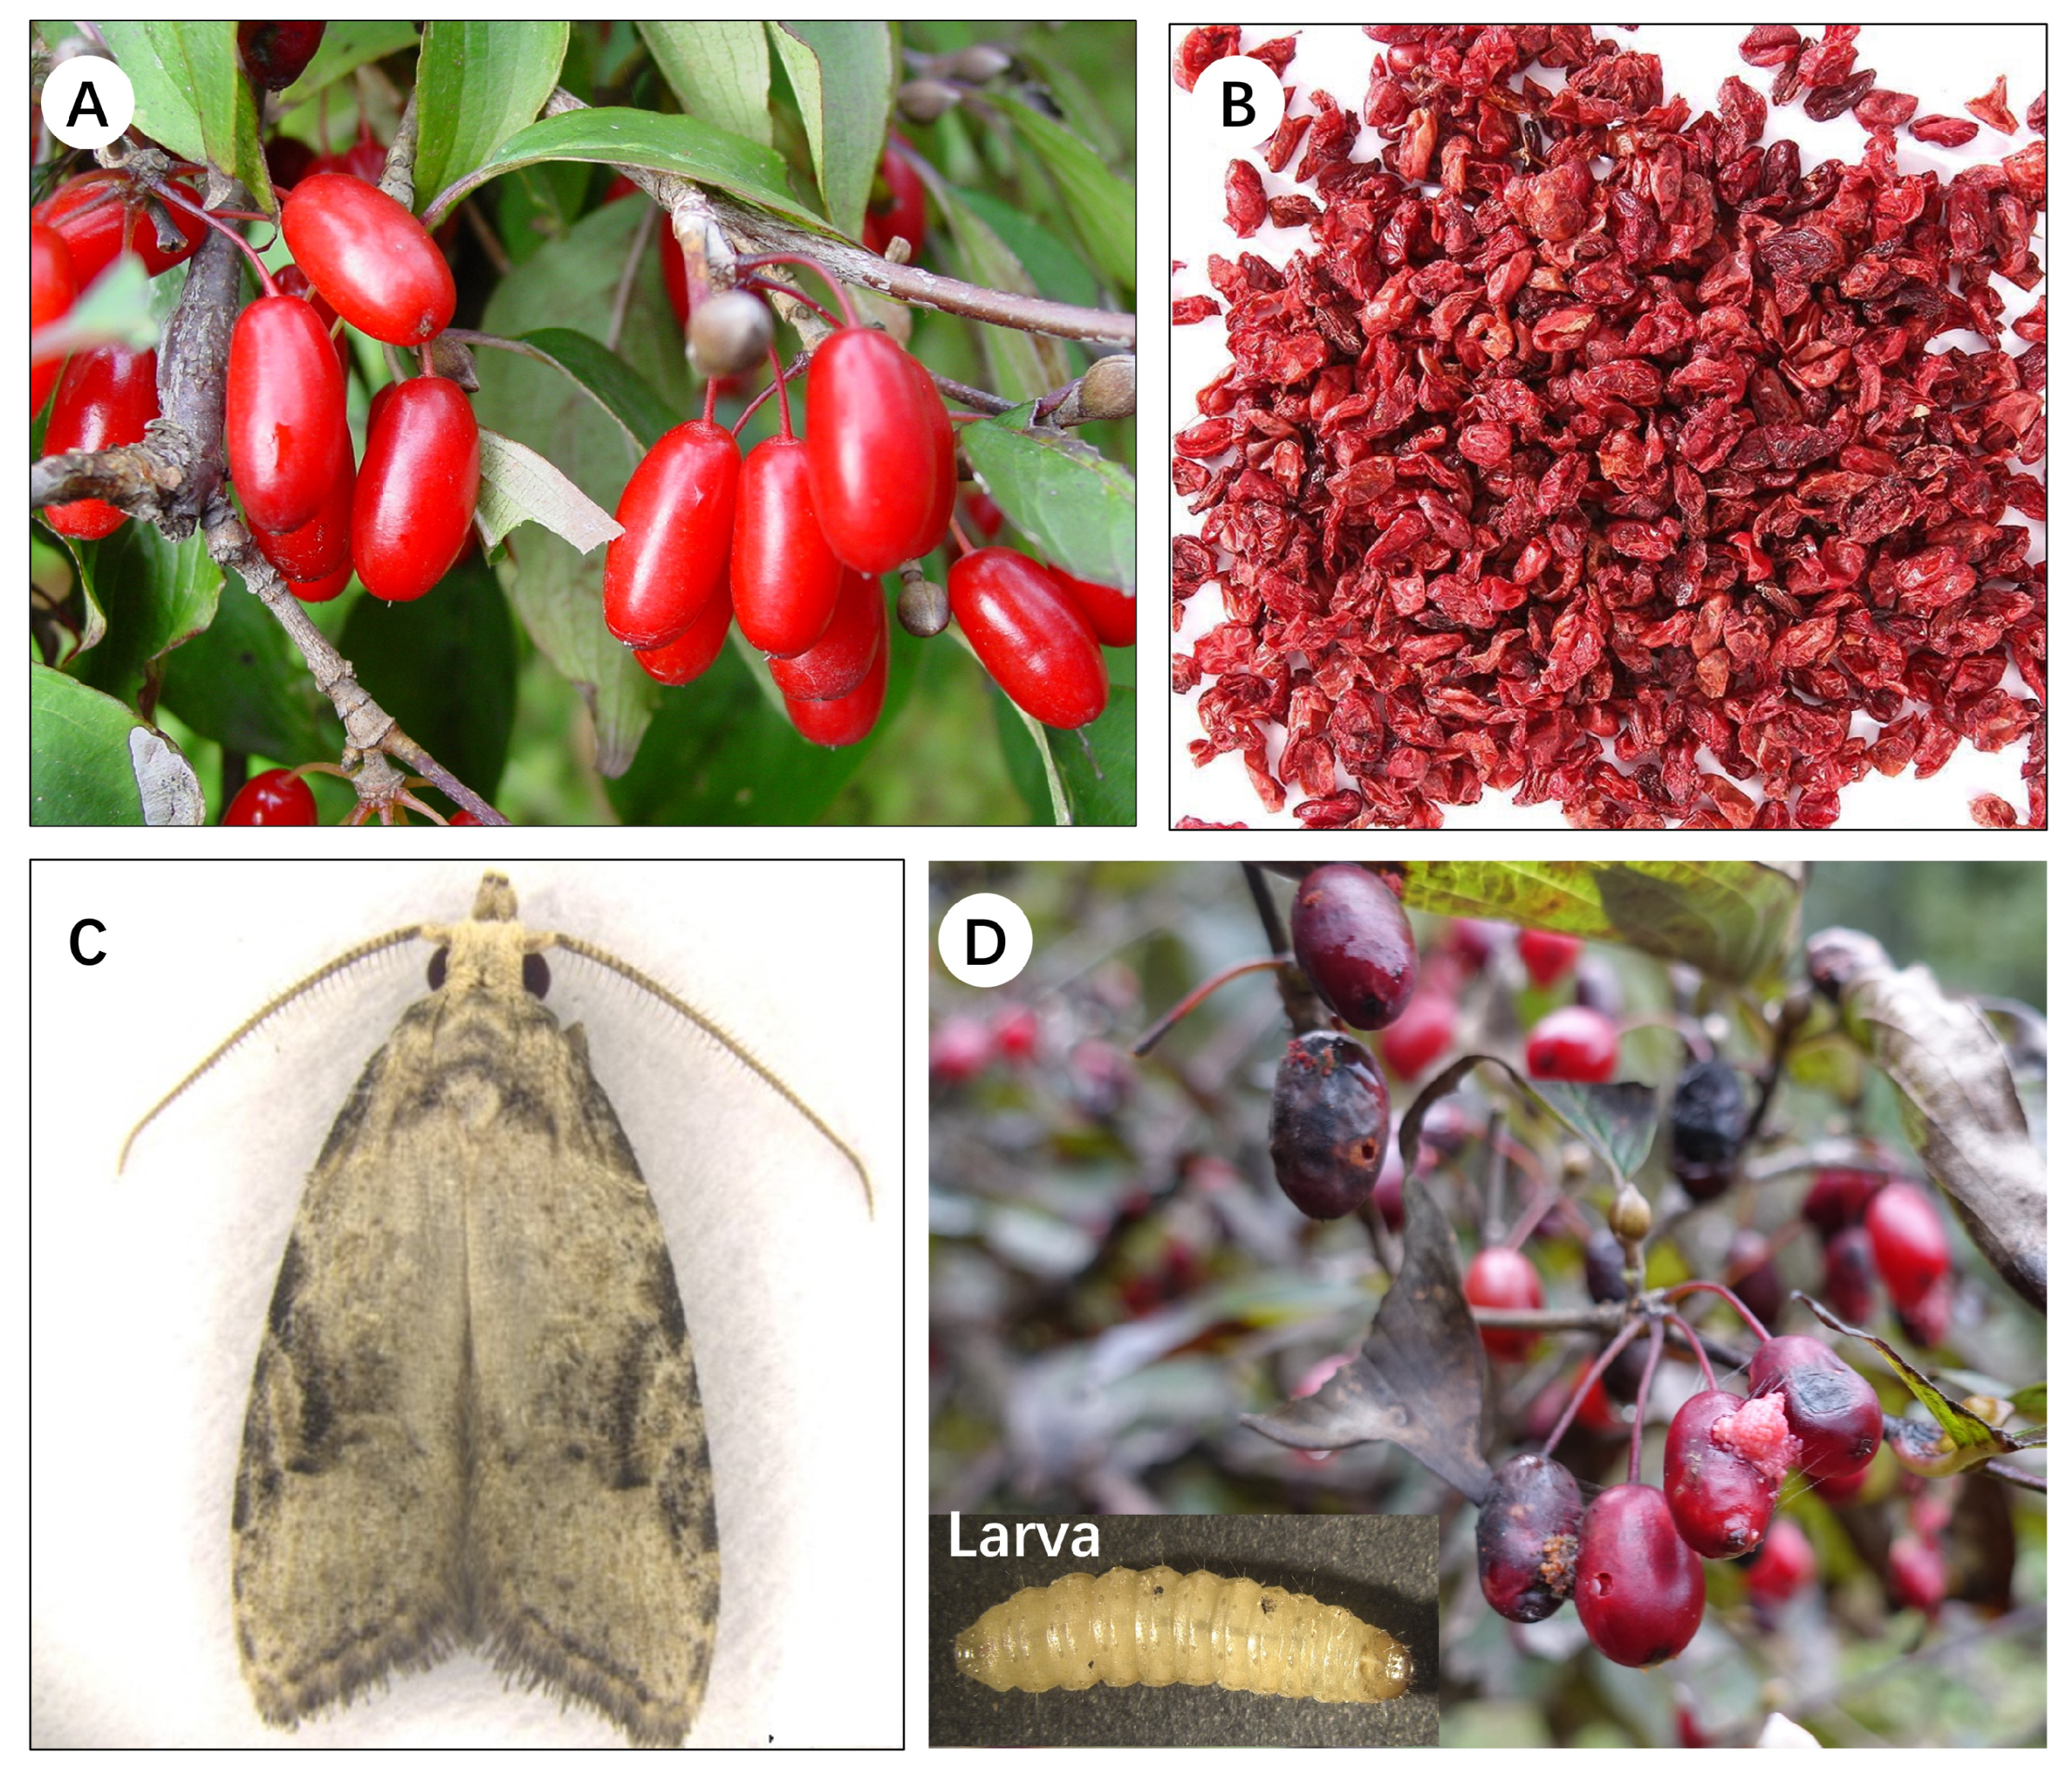
1. Introduction
2. Materials and Methods
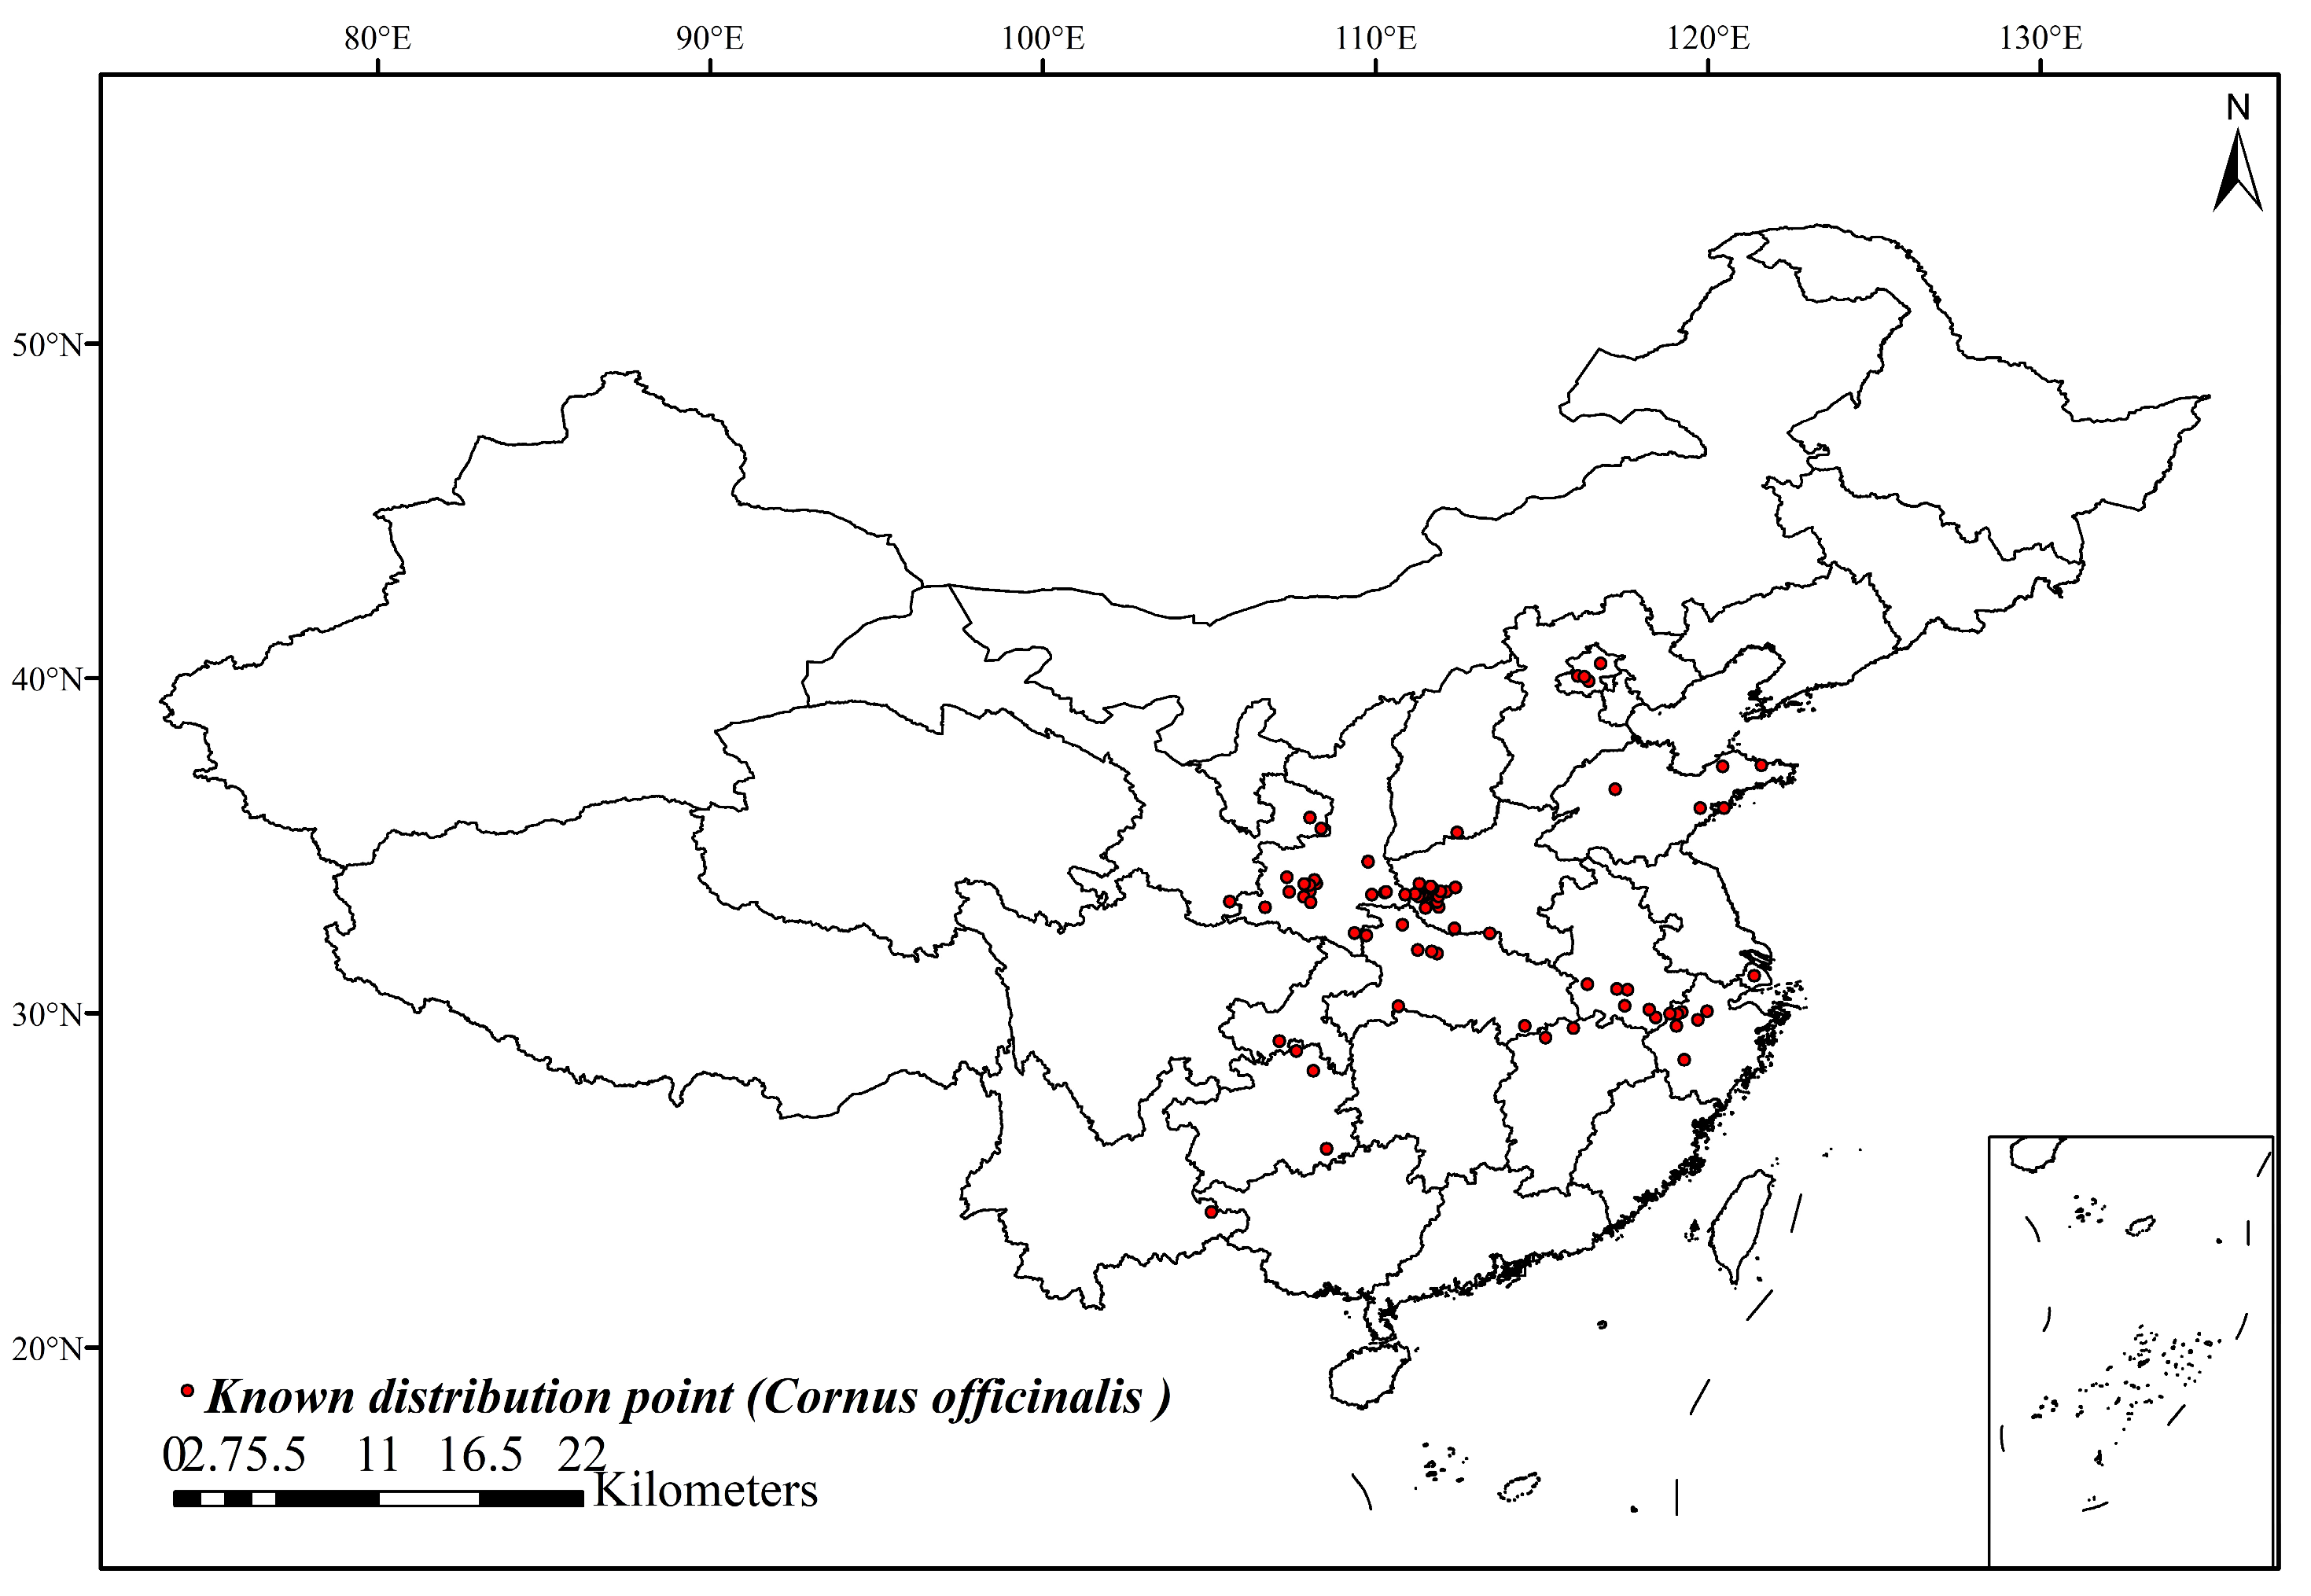
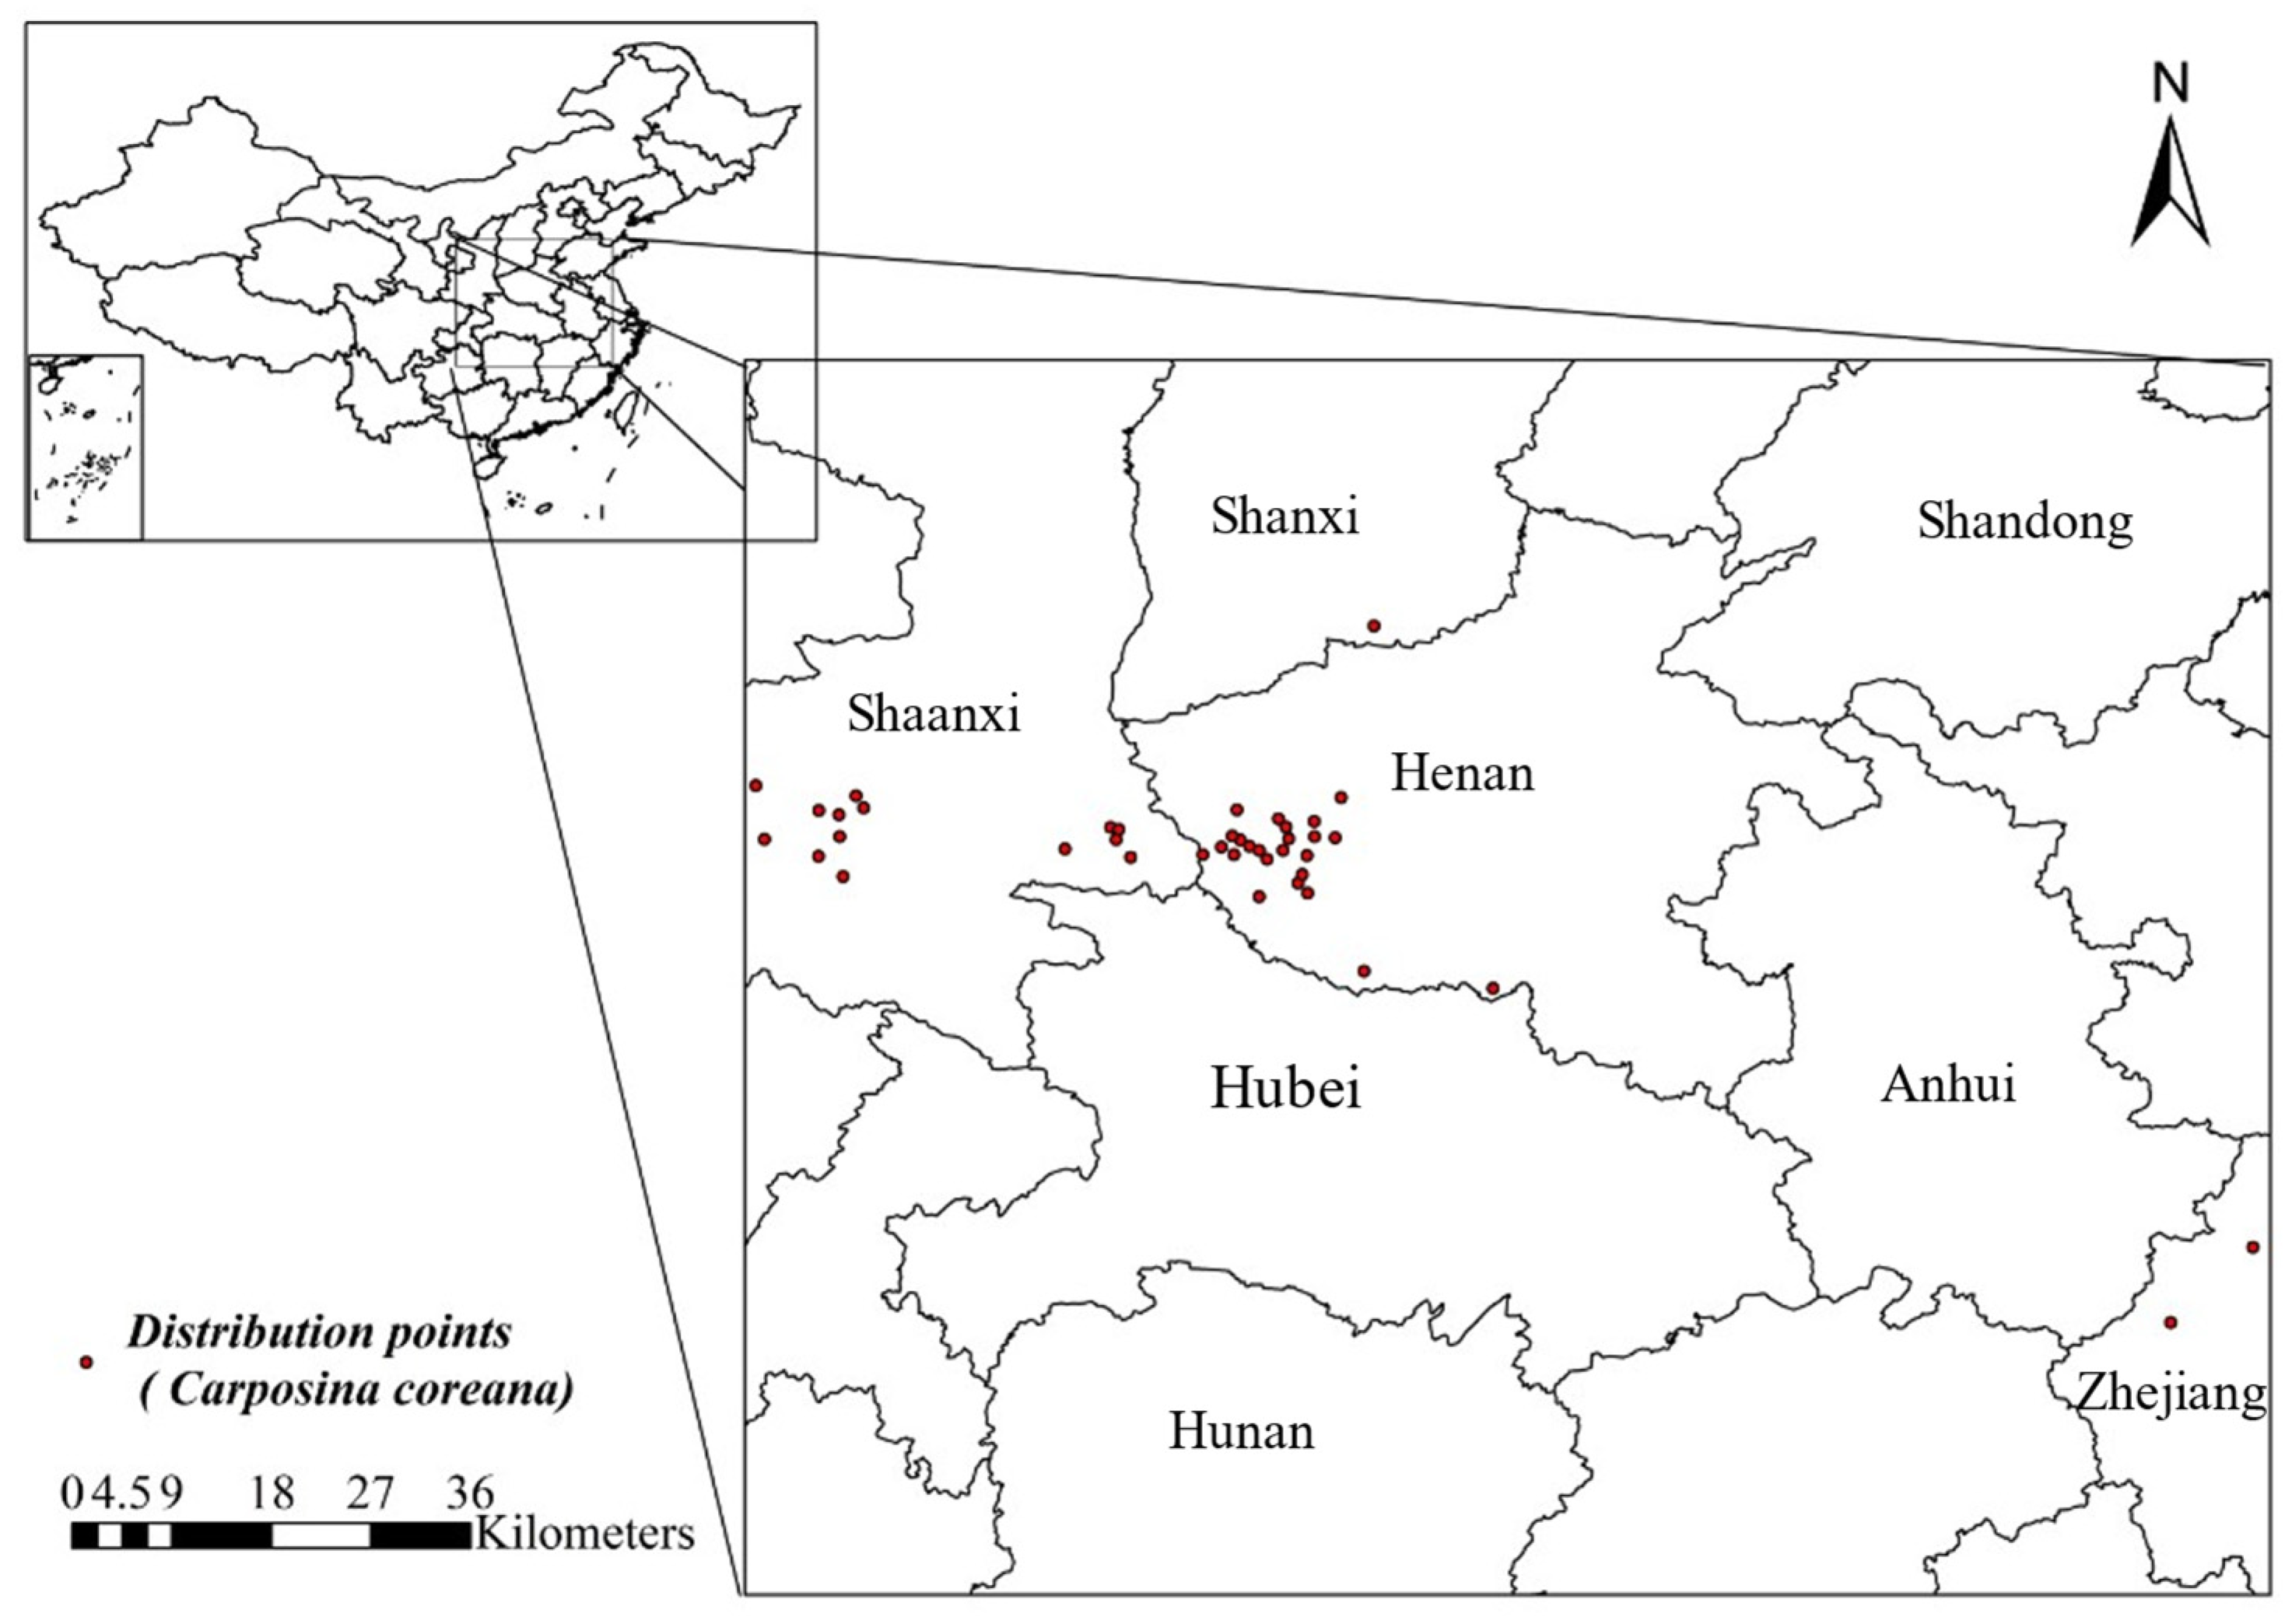
2.1. Collection and Processing of Distribution Data
2.2. Obtaining and Filtering Environment Variables
2.3. Software and Map Data
2.4. Predicting Suitable Areas for C. coreana Using MaxEnt Model
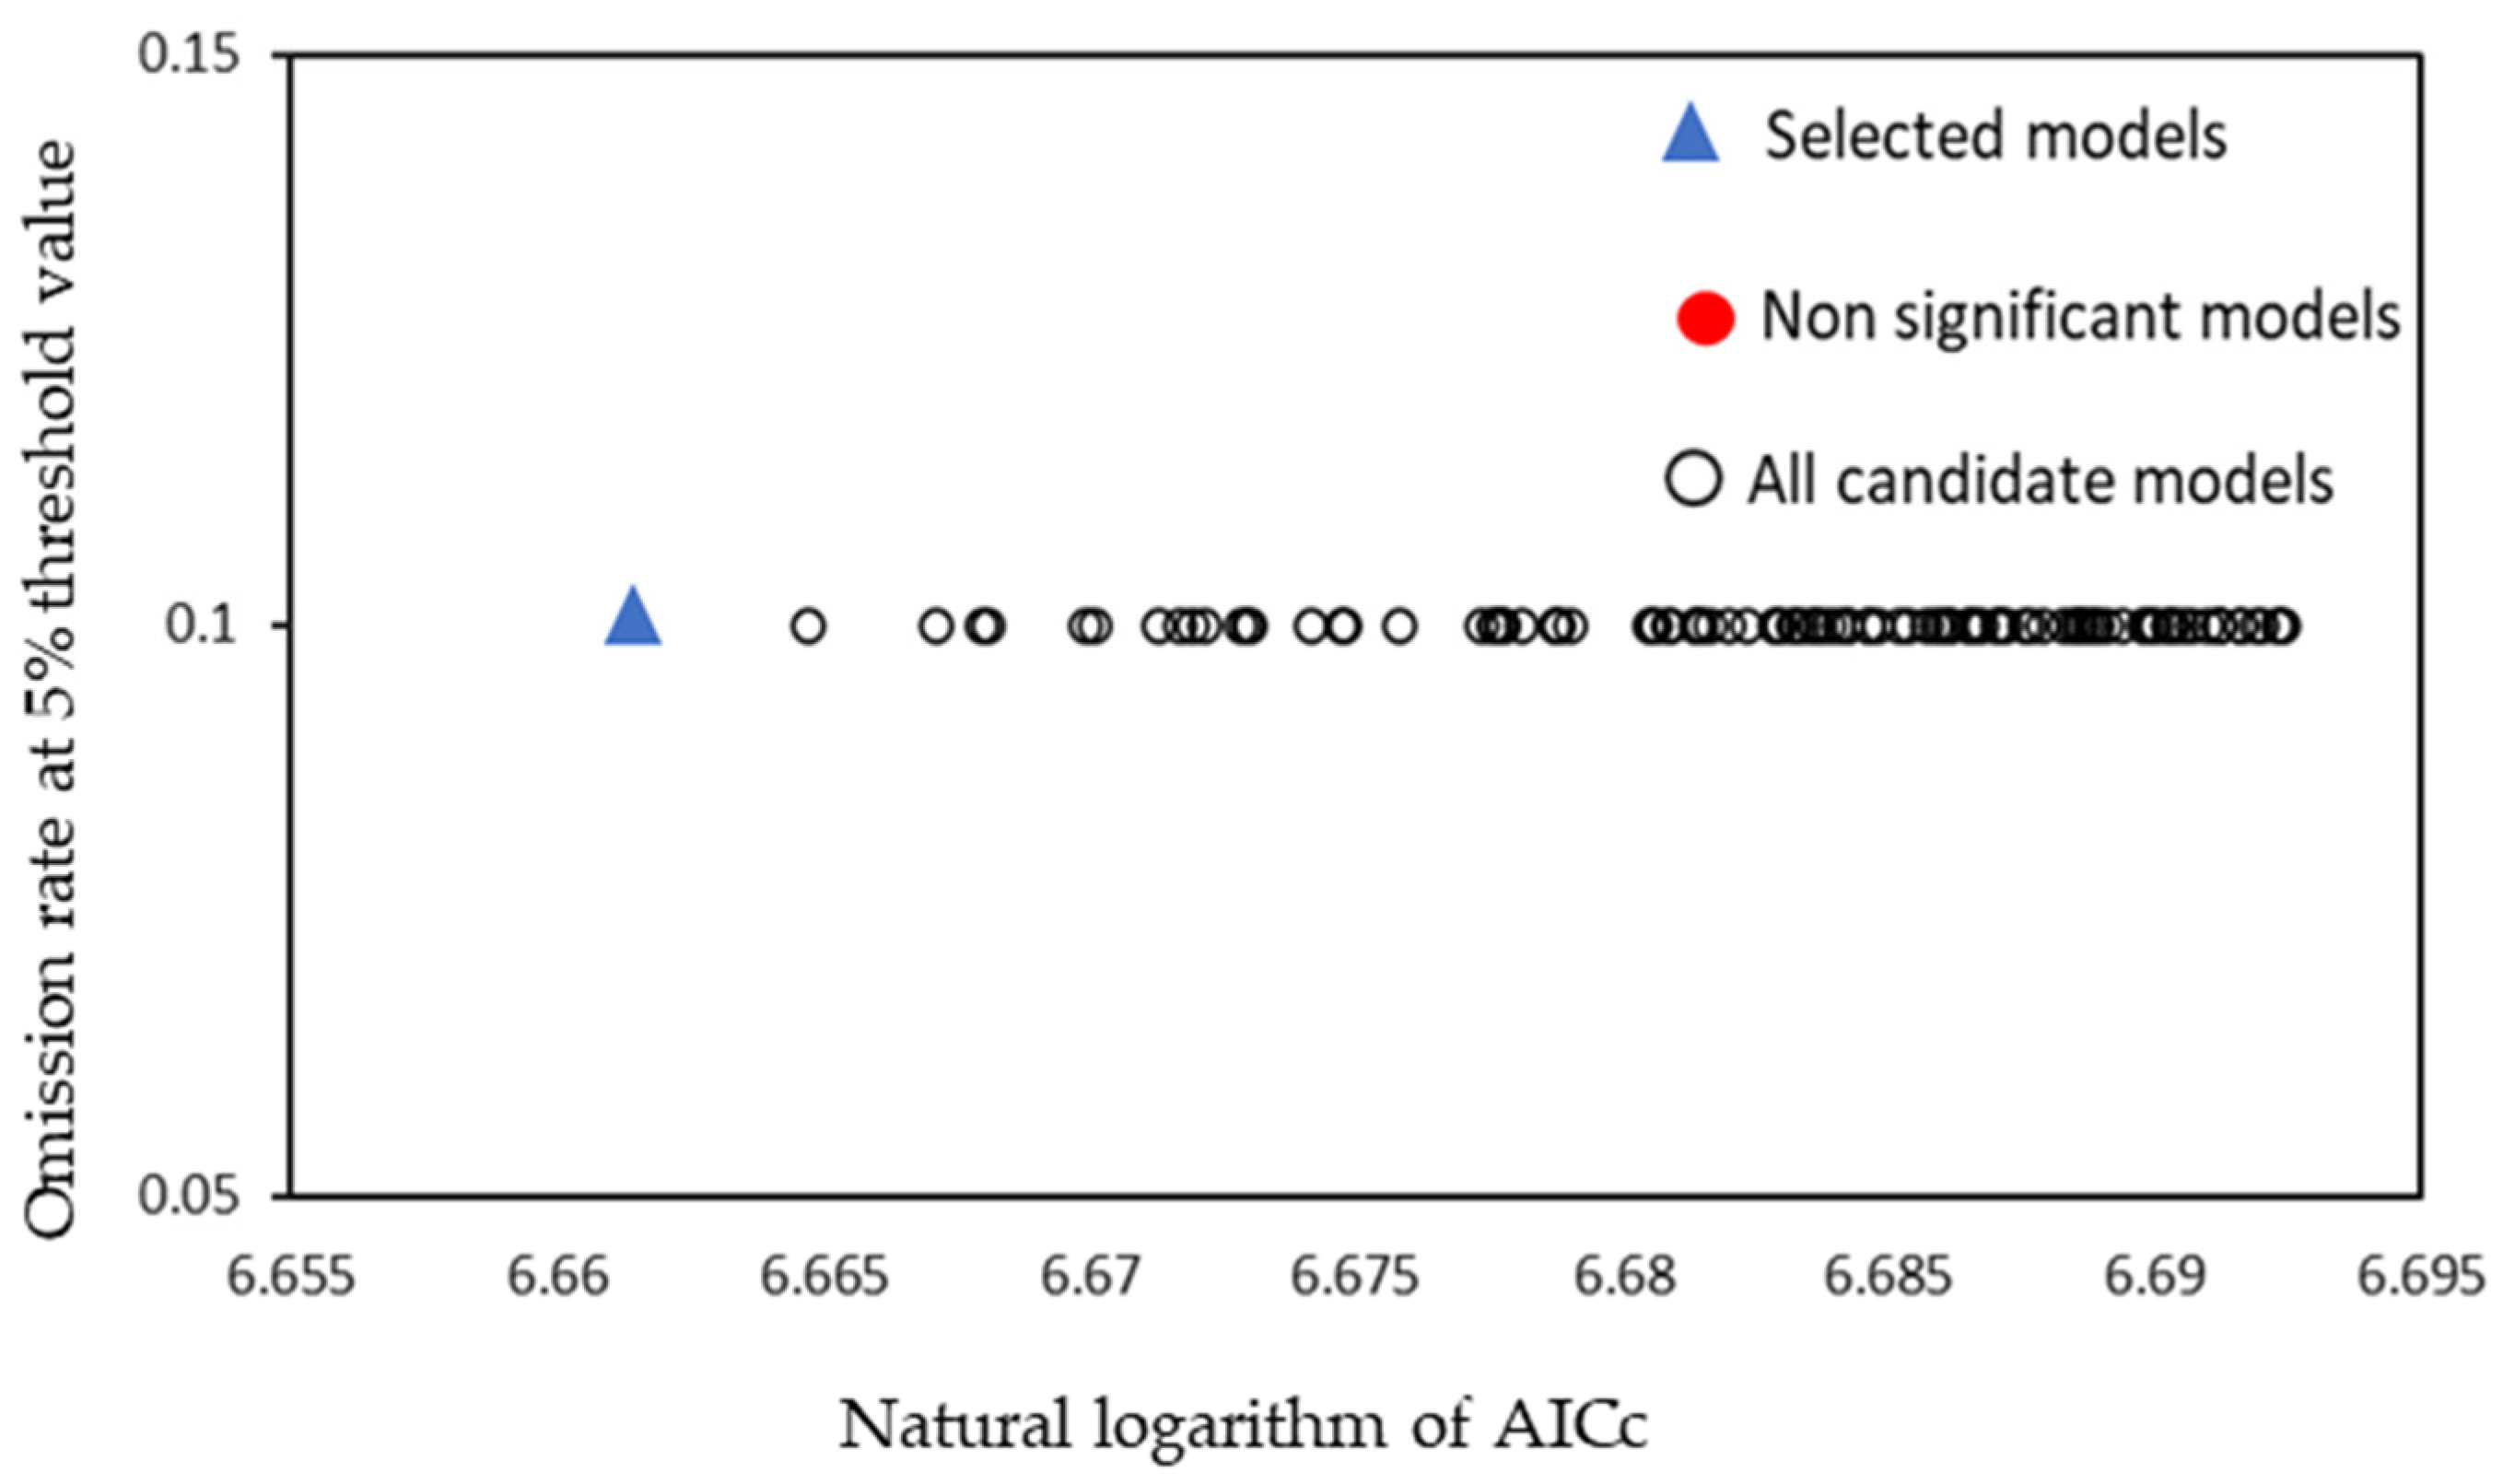
2.4.1. Setting and Optimization of MaxEnt Model Parameters
2.4.2. Evaluation Criteria for MaxEnt Model Accuracy
2.4.3. The Division of the Hierarchy of Suitable Areas
3. Results
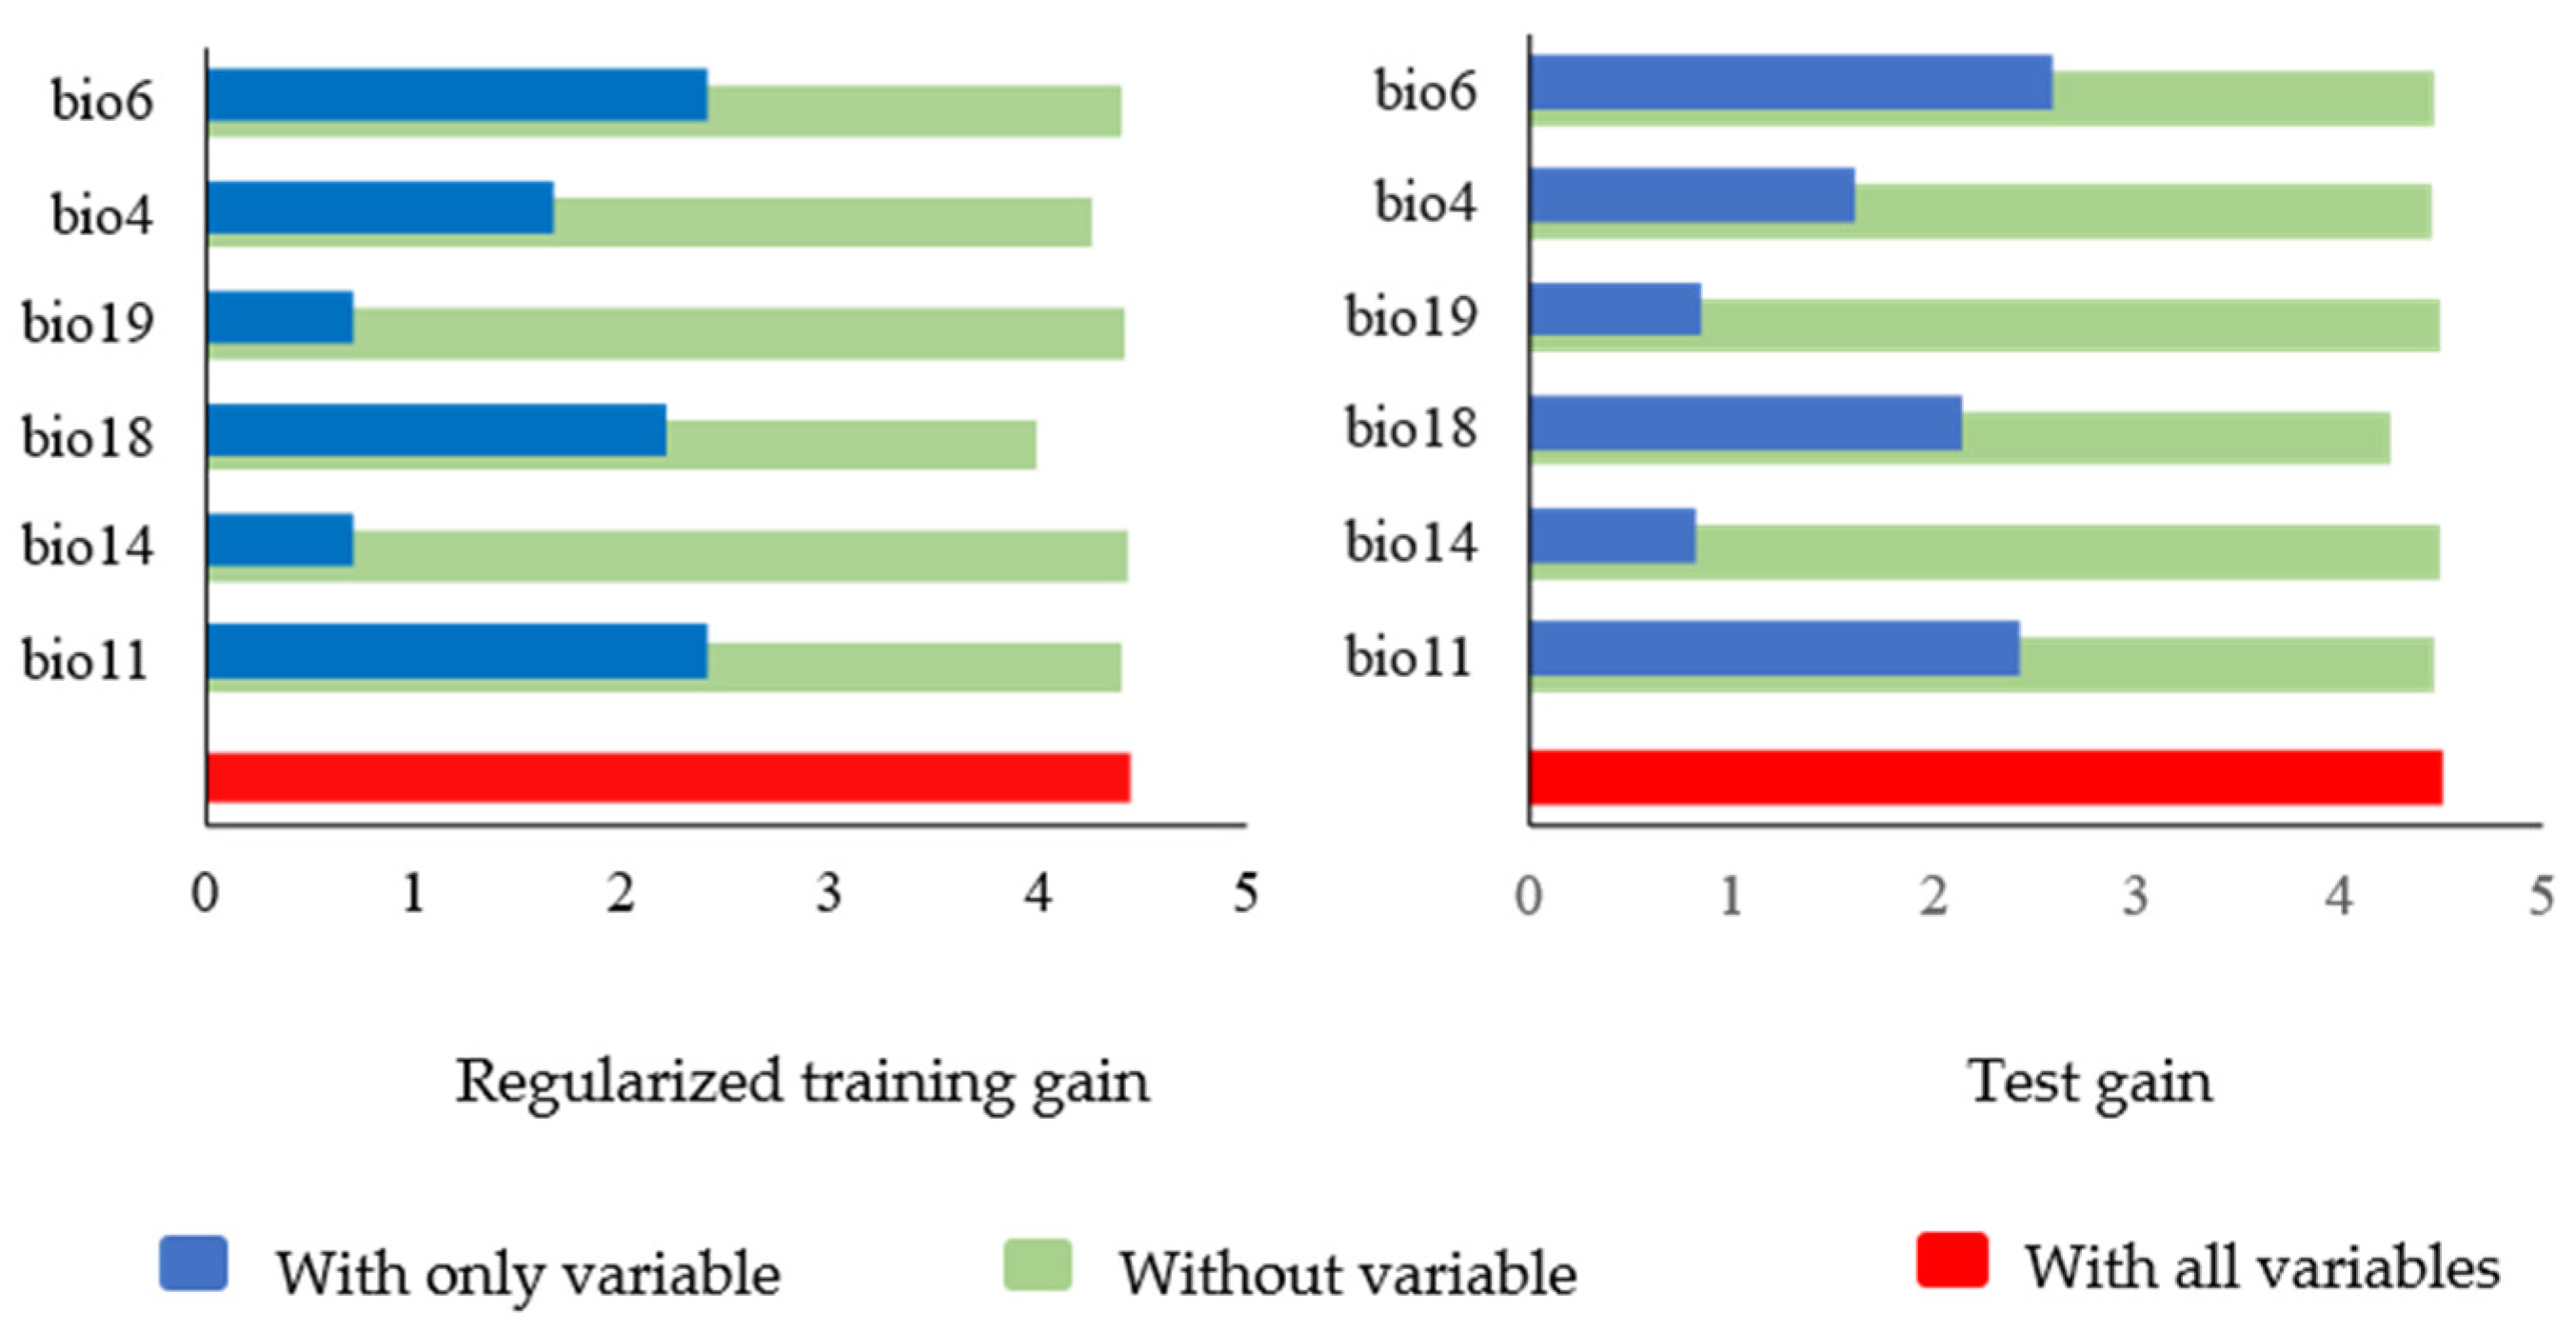
3.1. Screening of Distribution Point Data and Identification of Dominant Environmental Factors
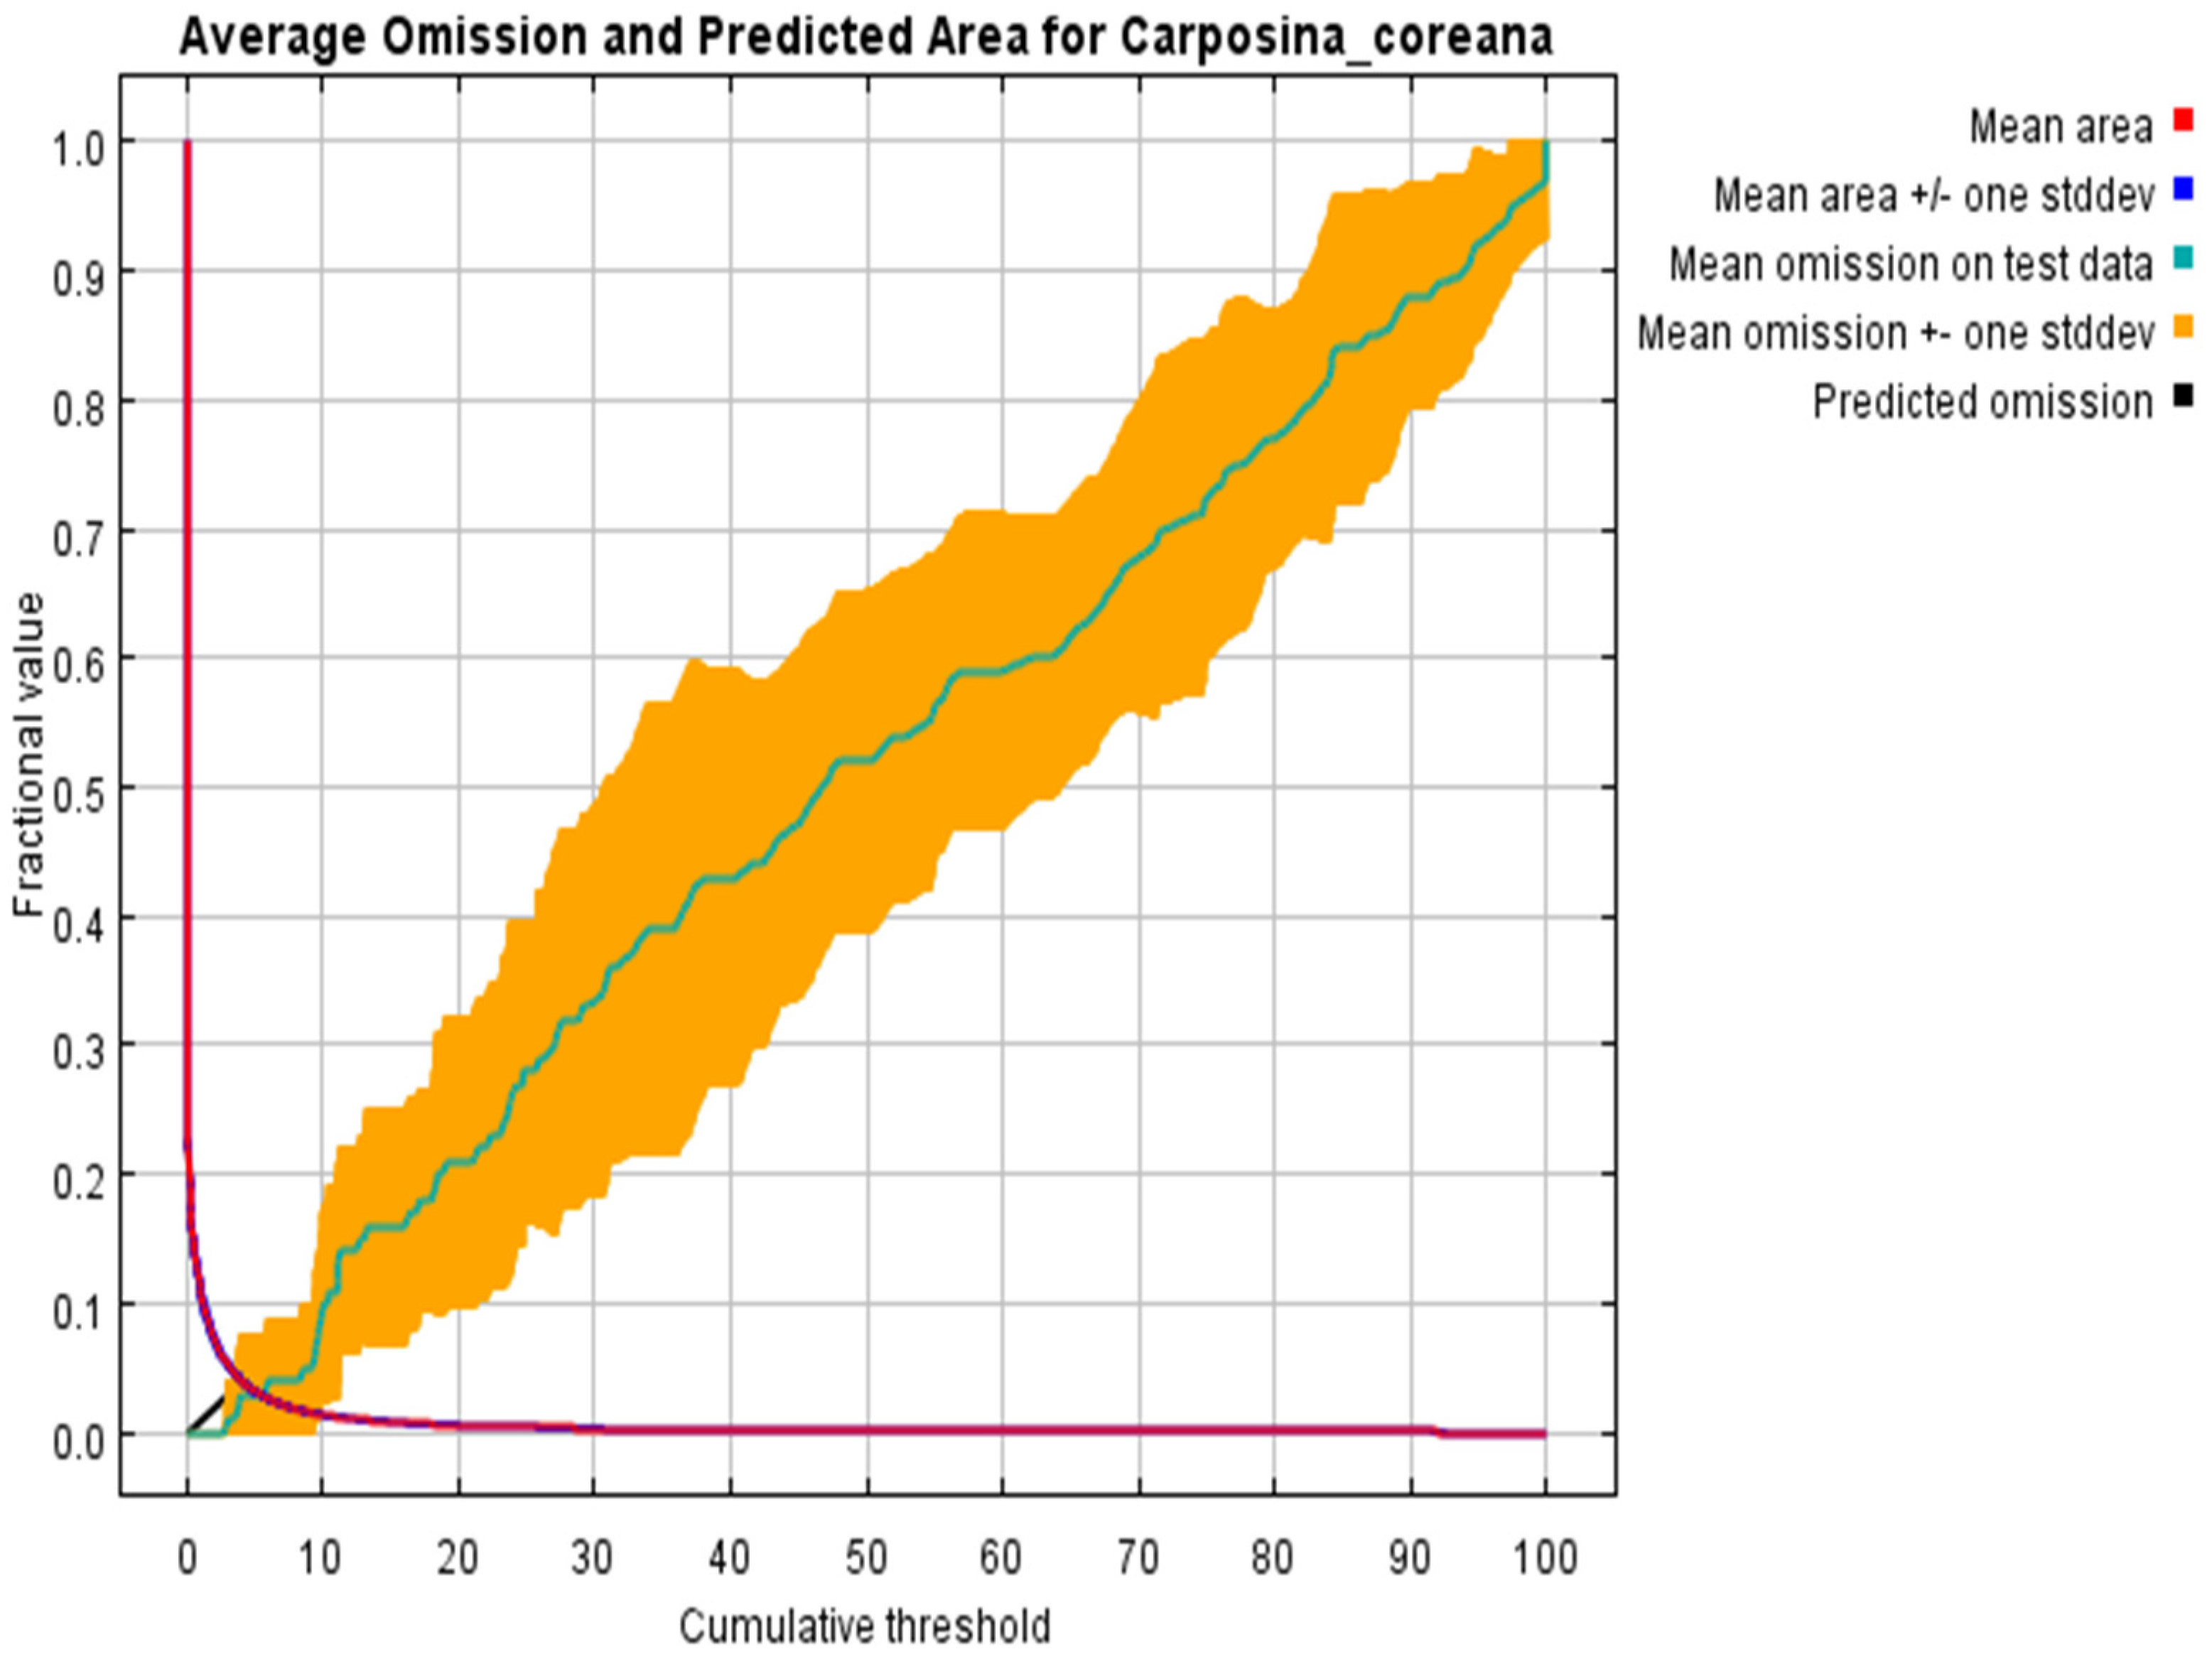
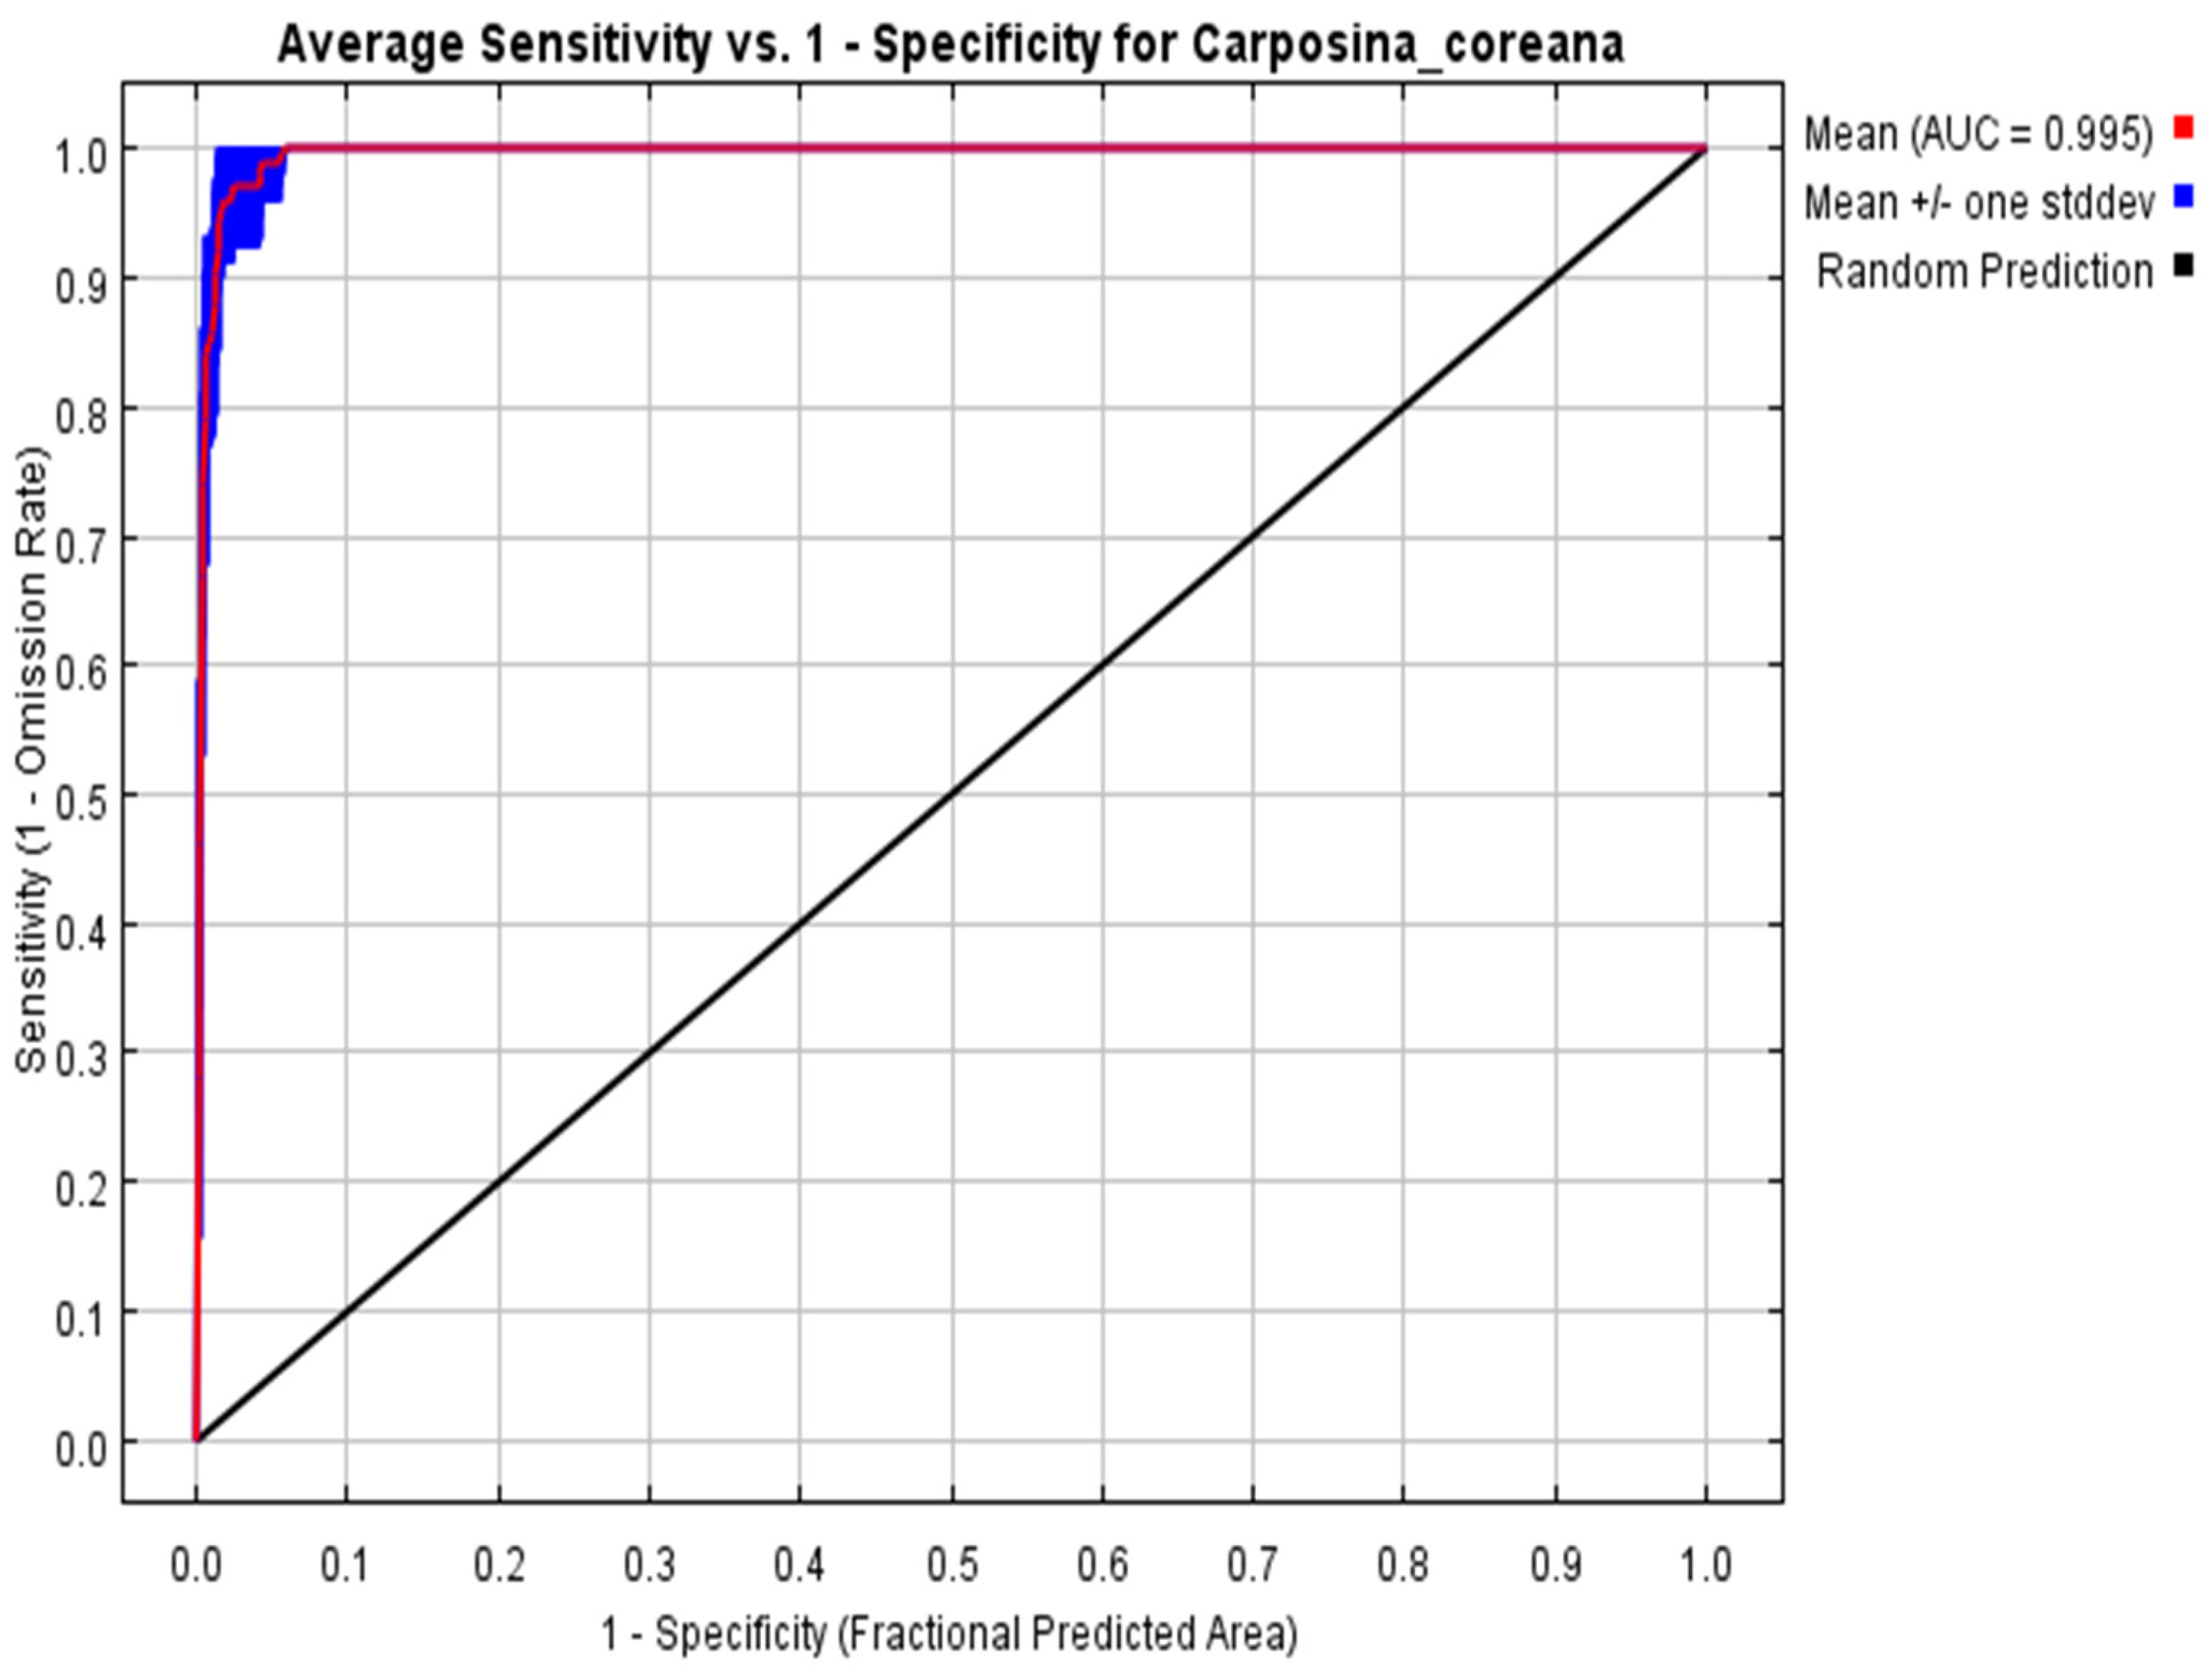
3.2. Verification of Model Accuracy
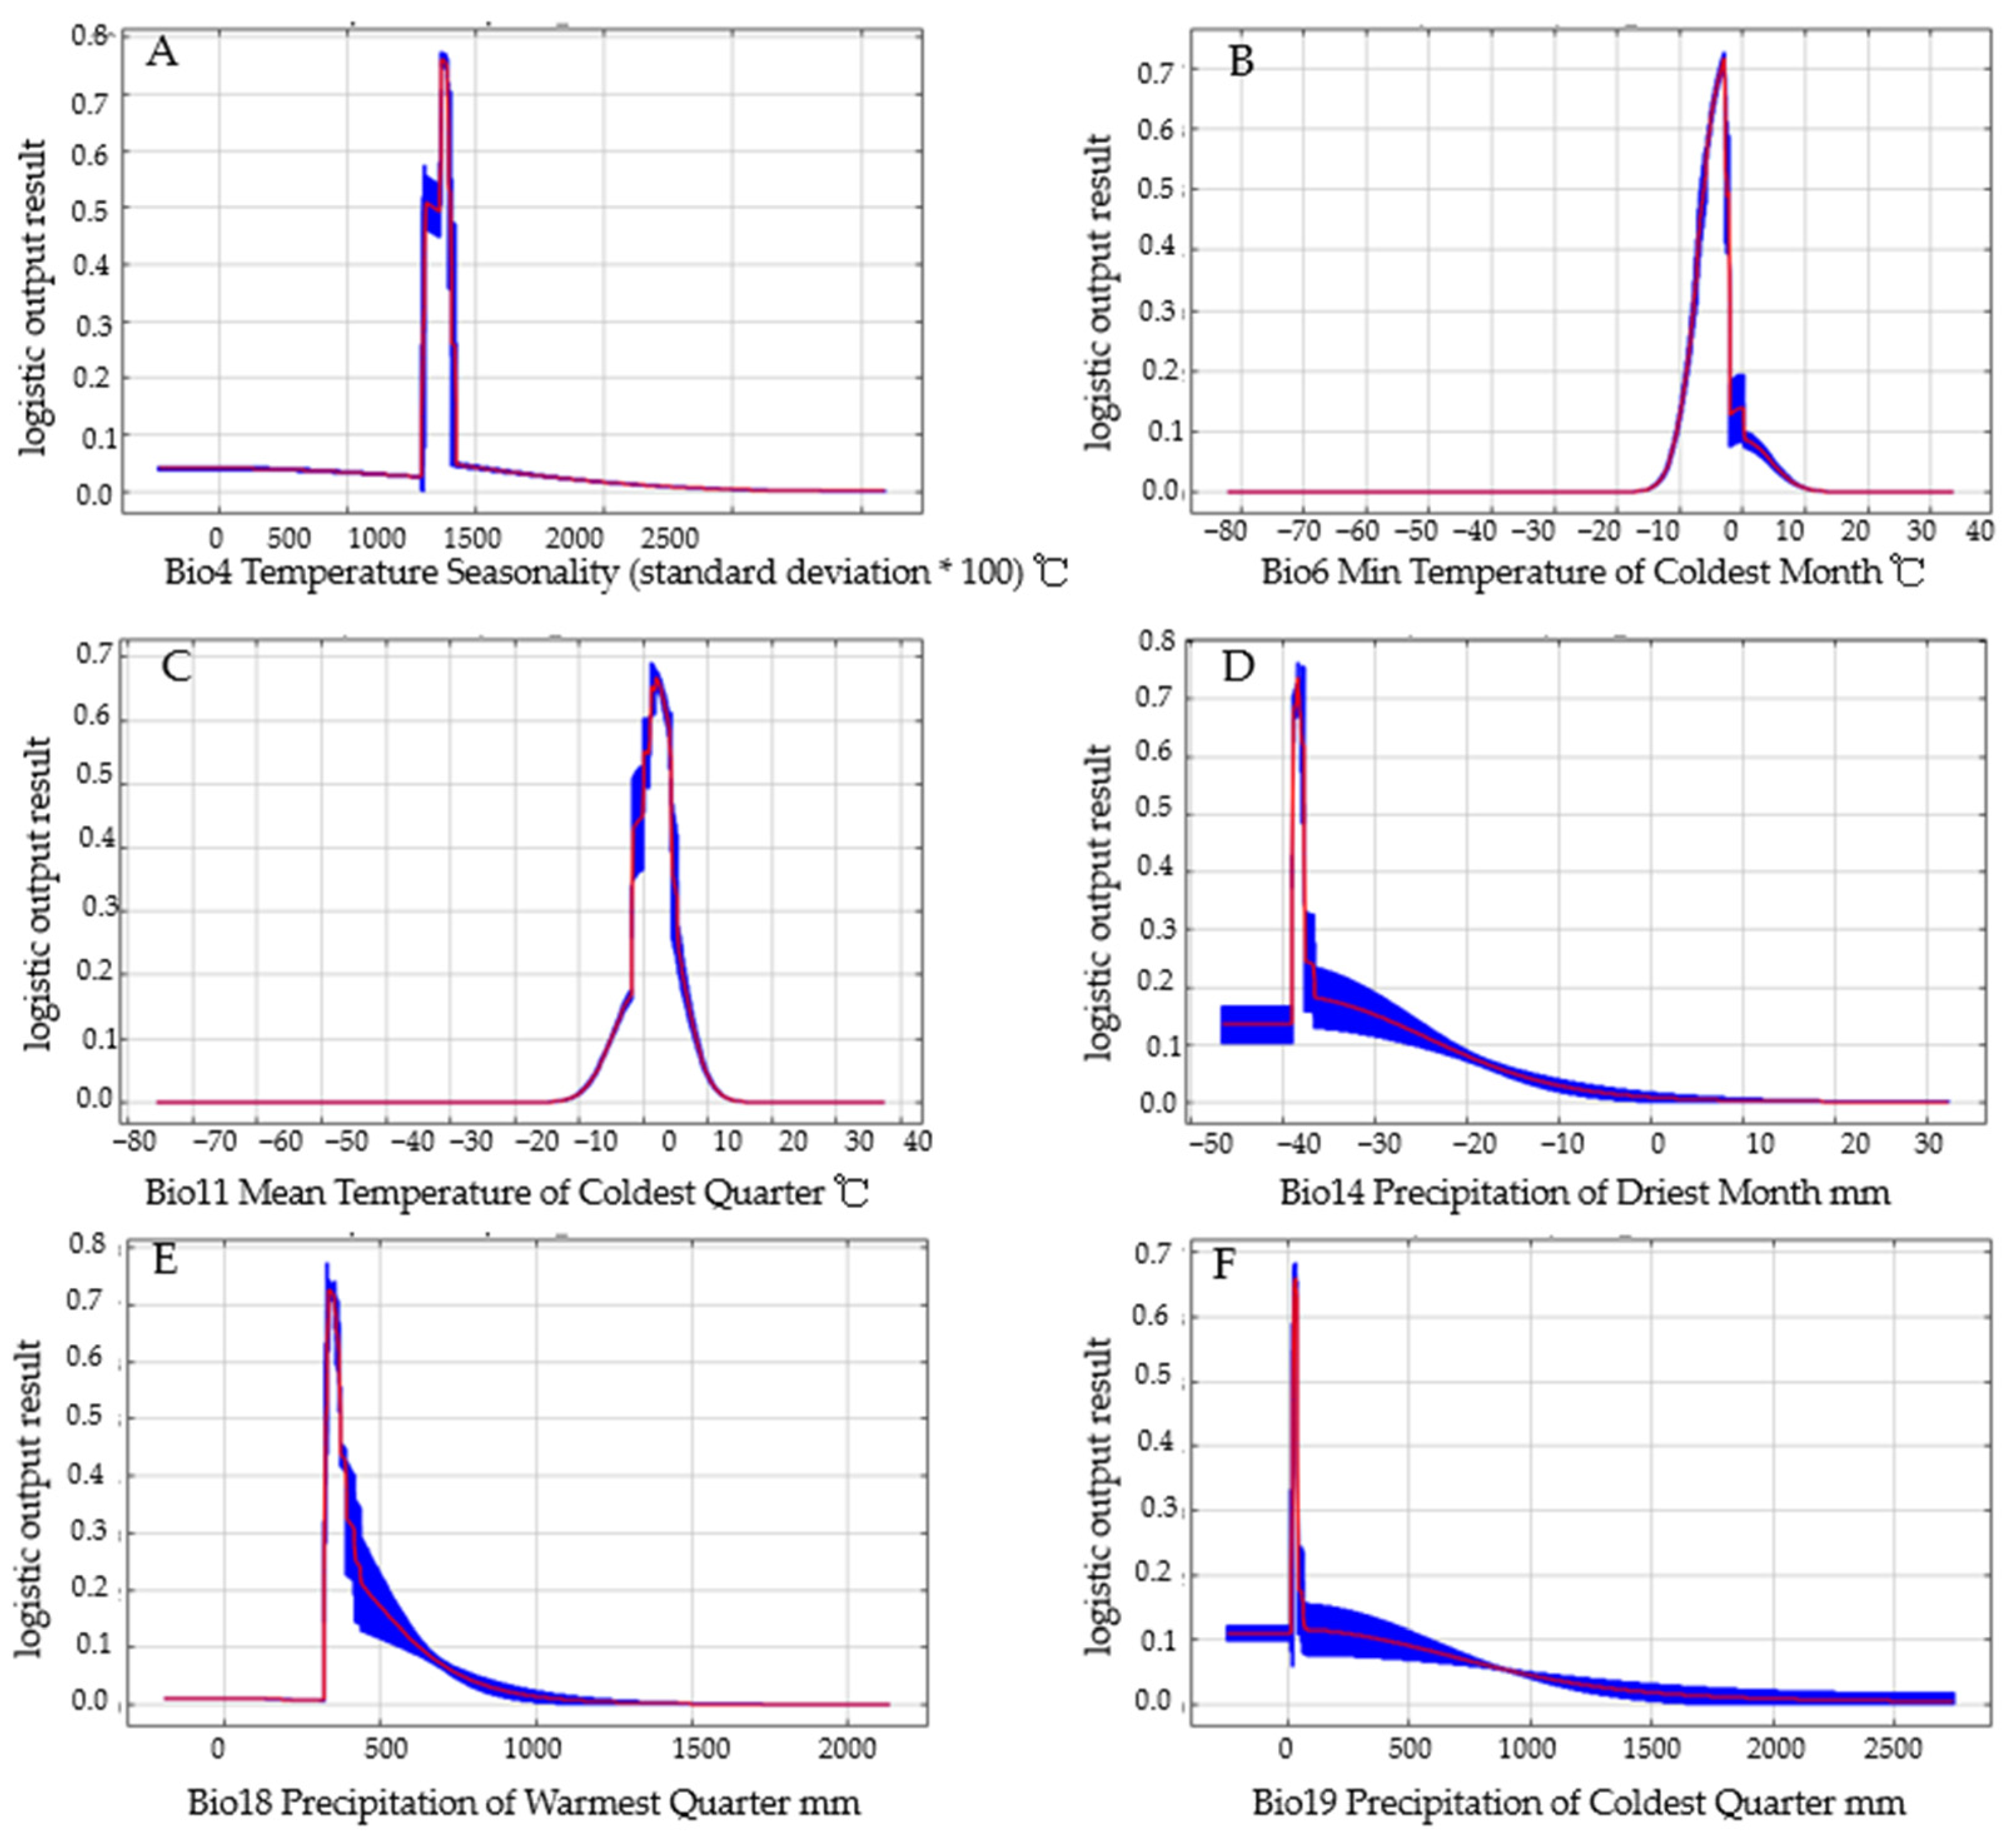
3.3. Relationship between the Distribution of Carposina Coreana and Environmental Variables
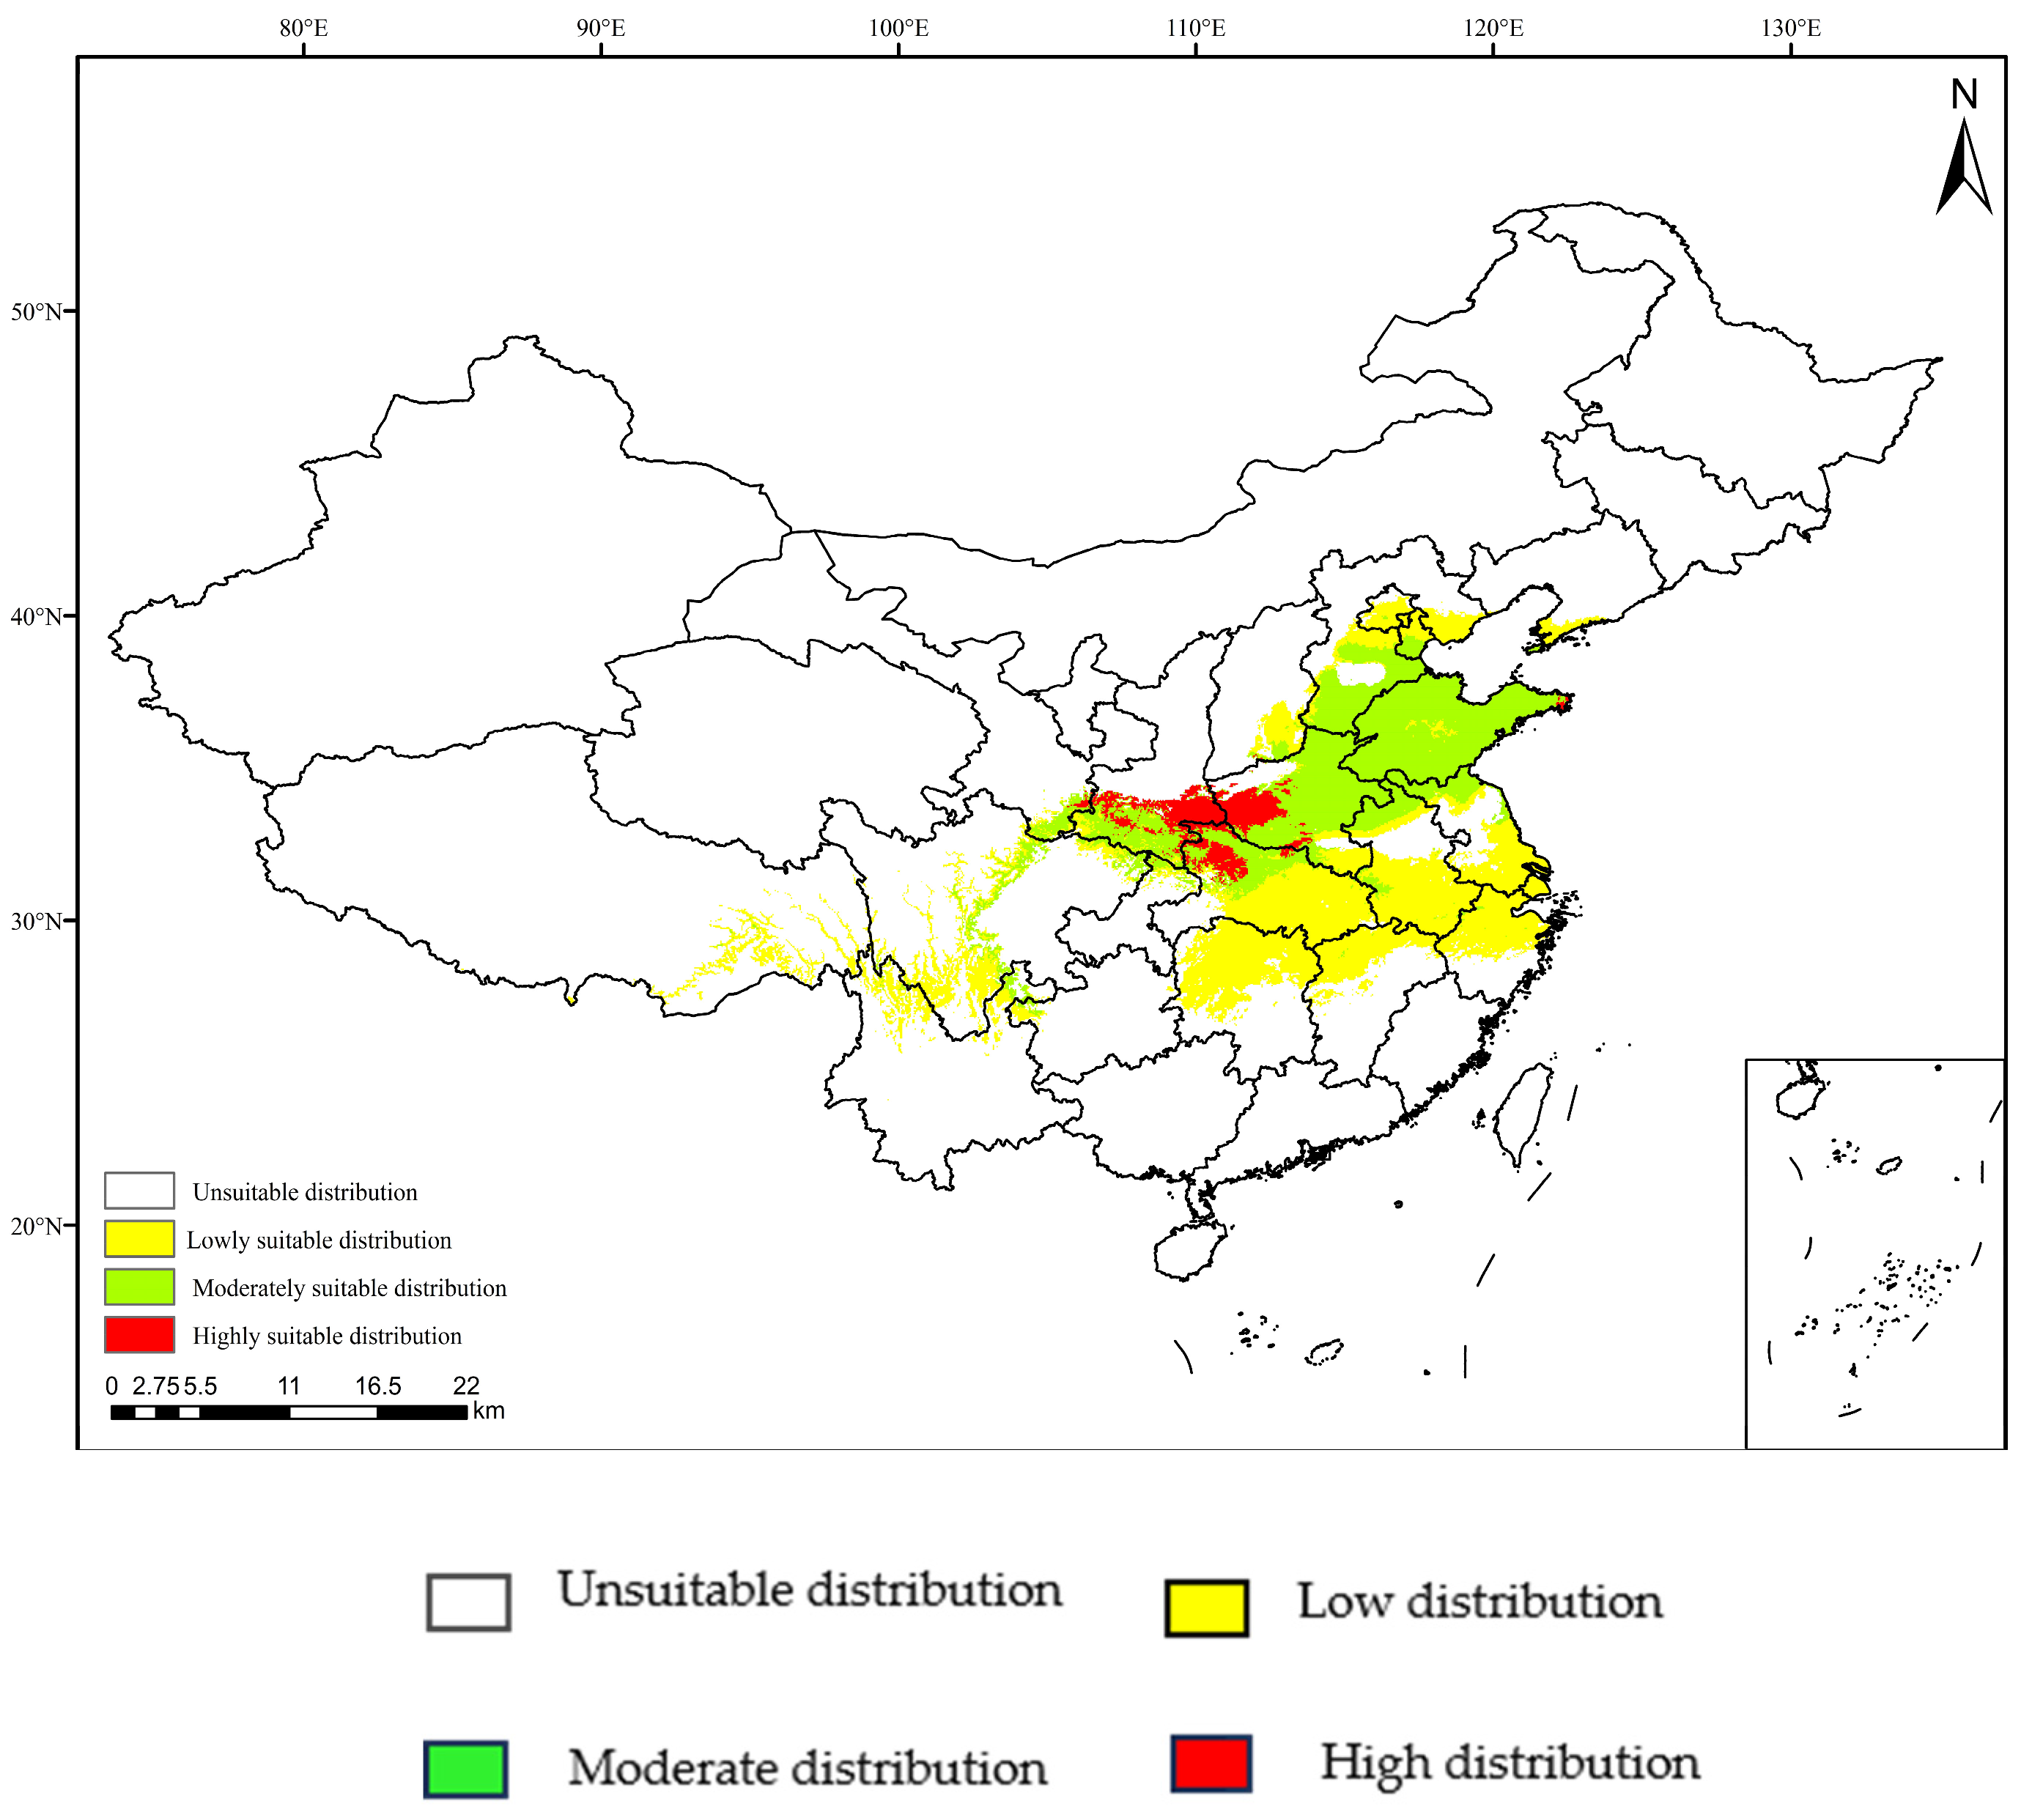
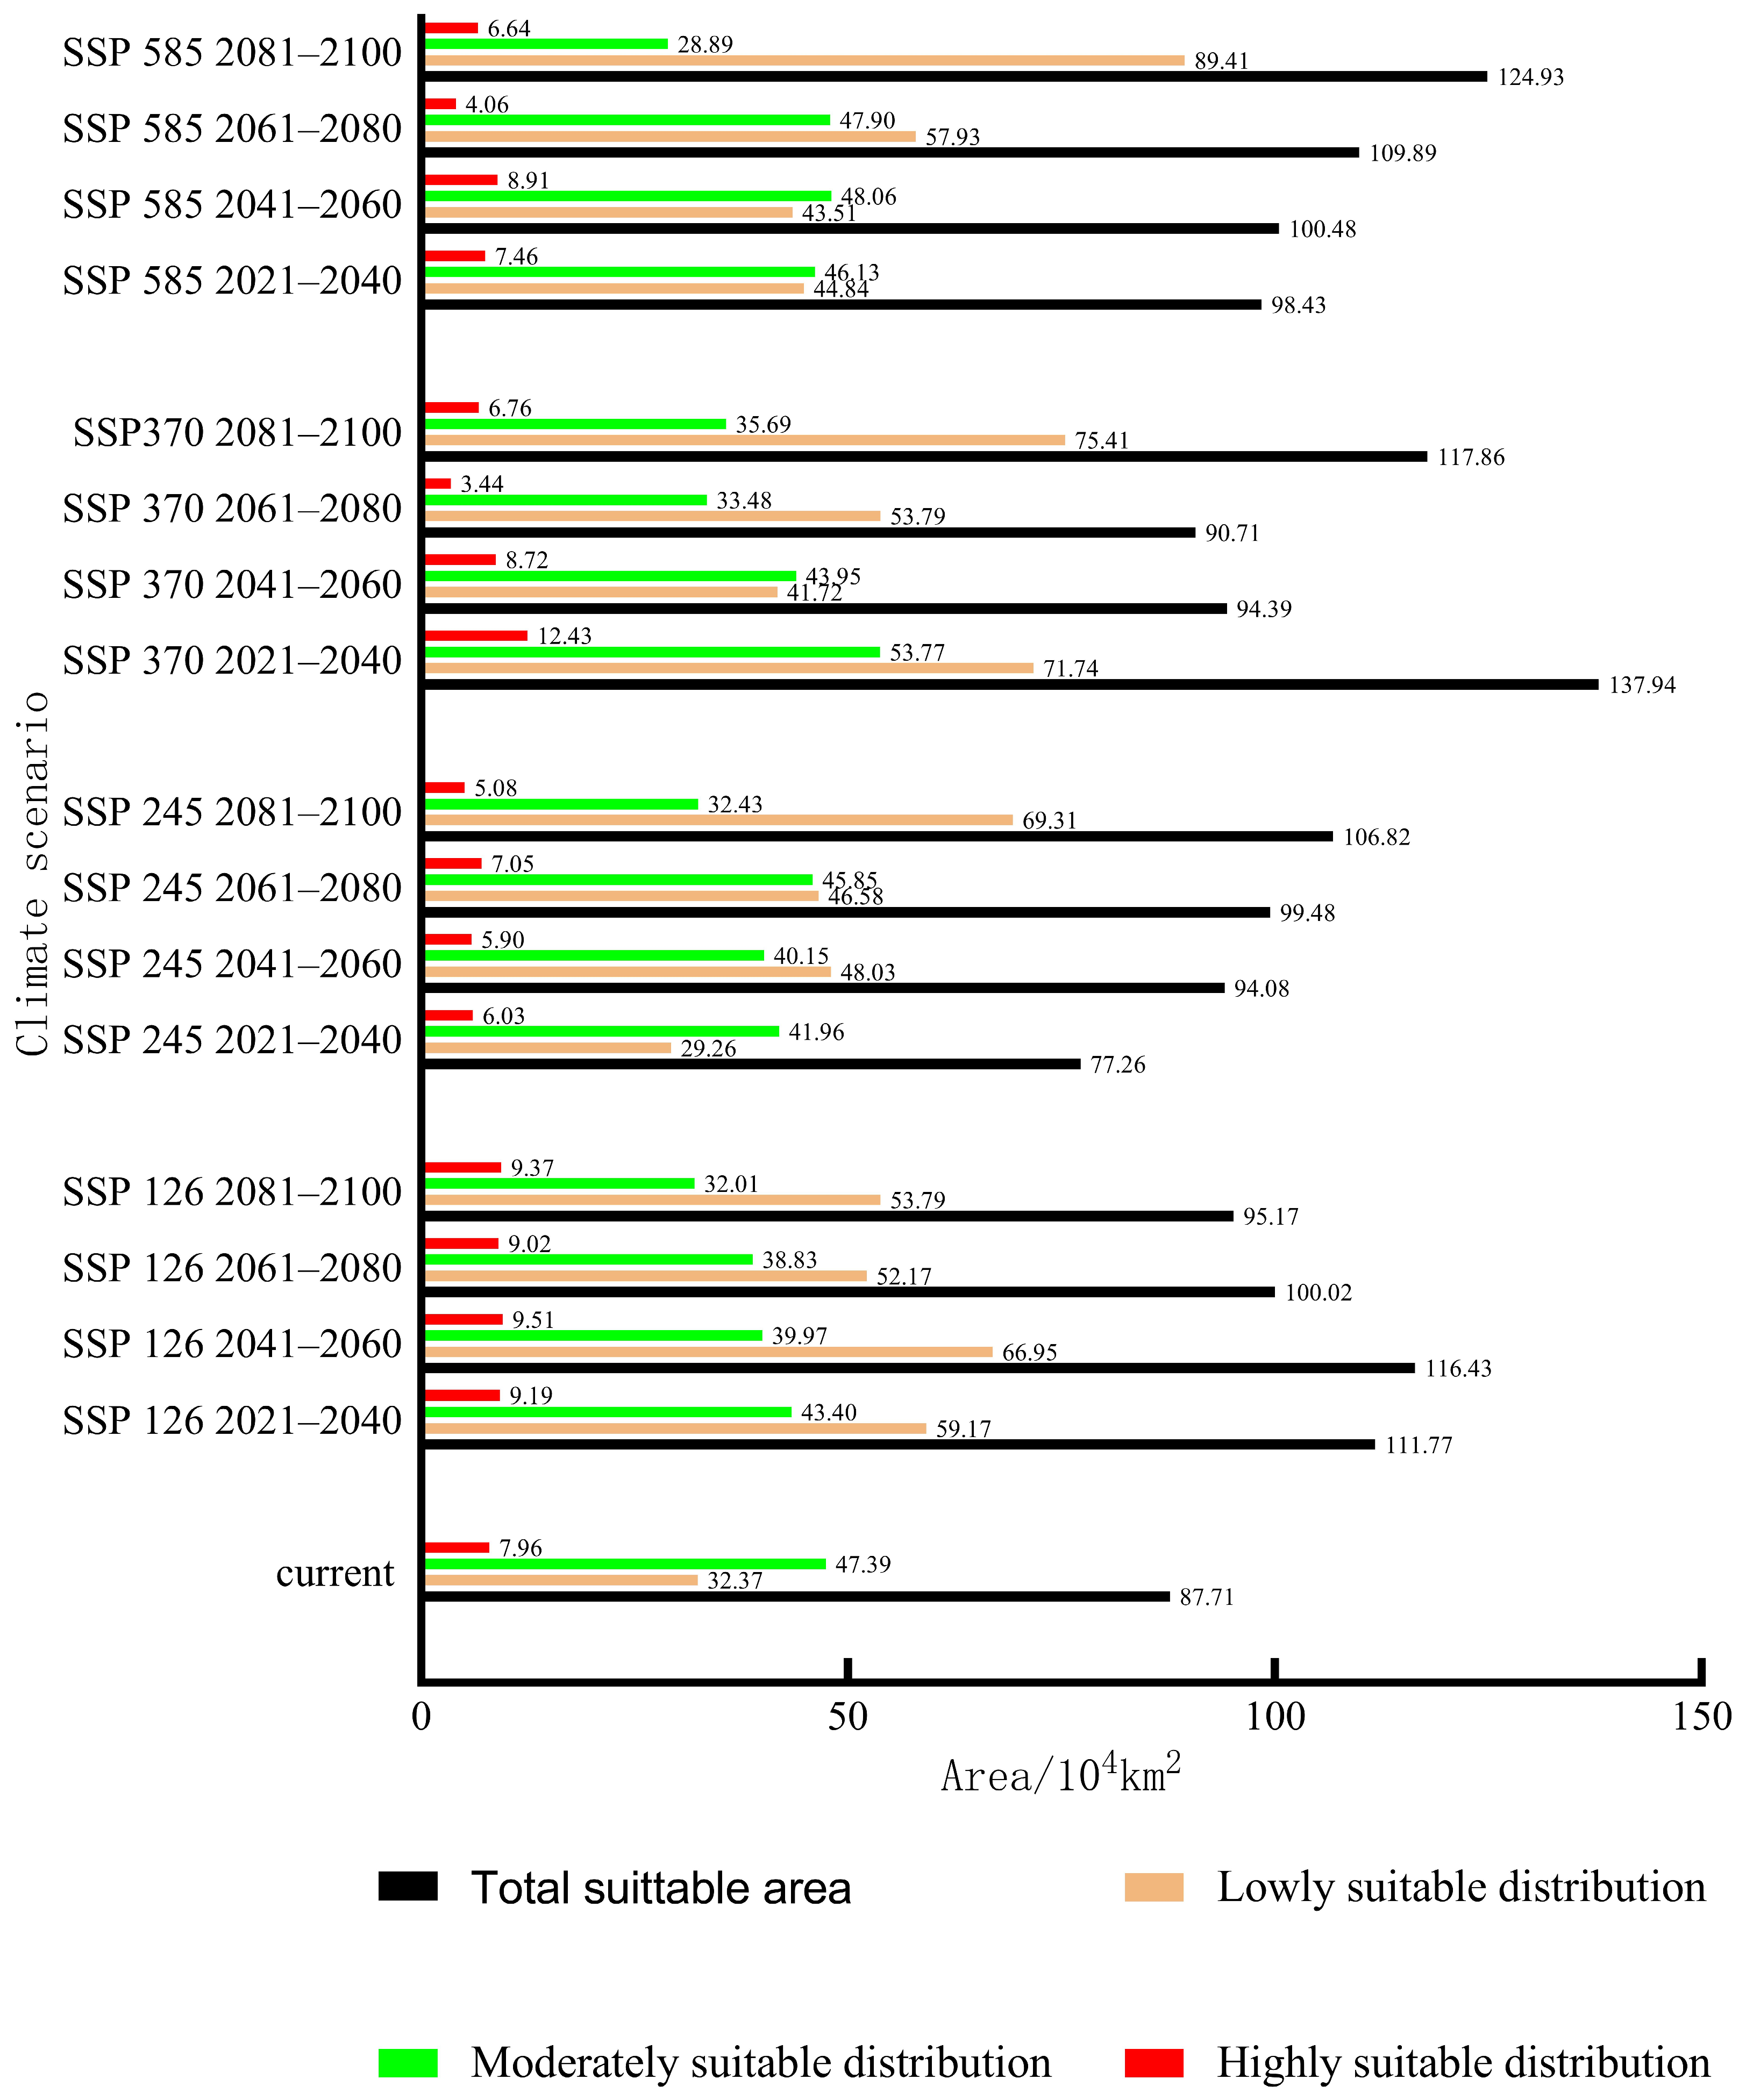
3.4. Projections under Current Climate Scenarios
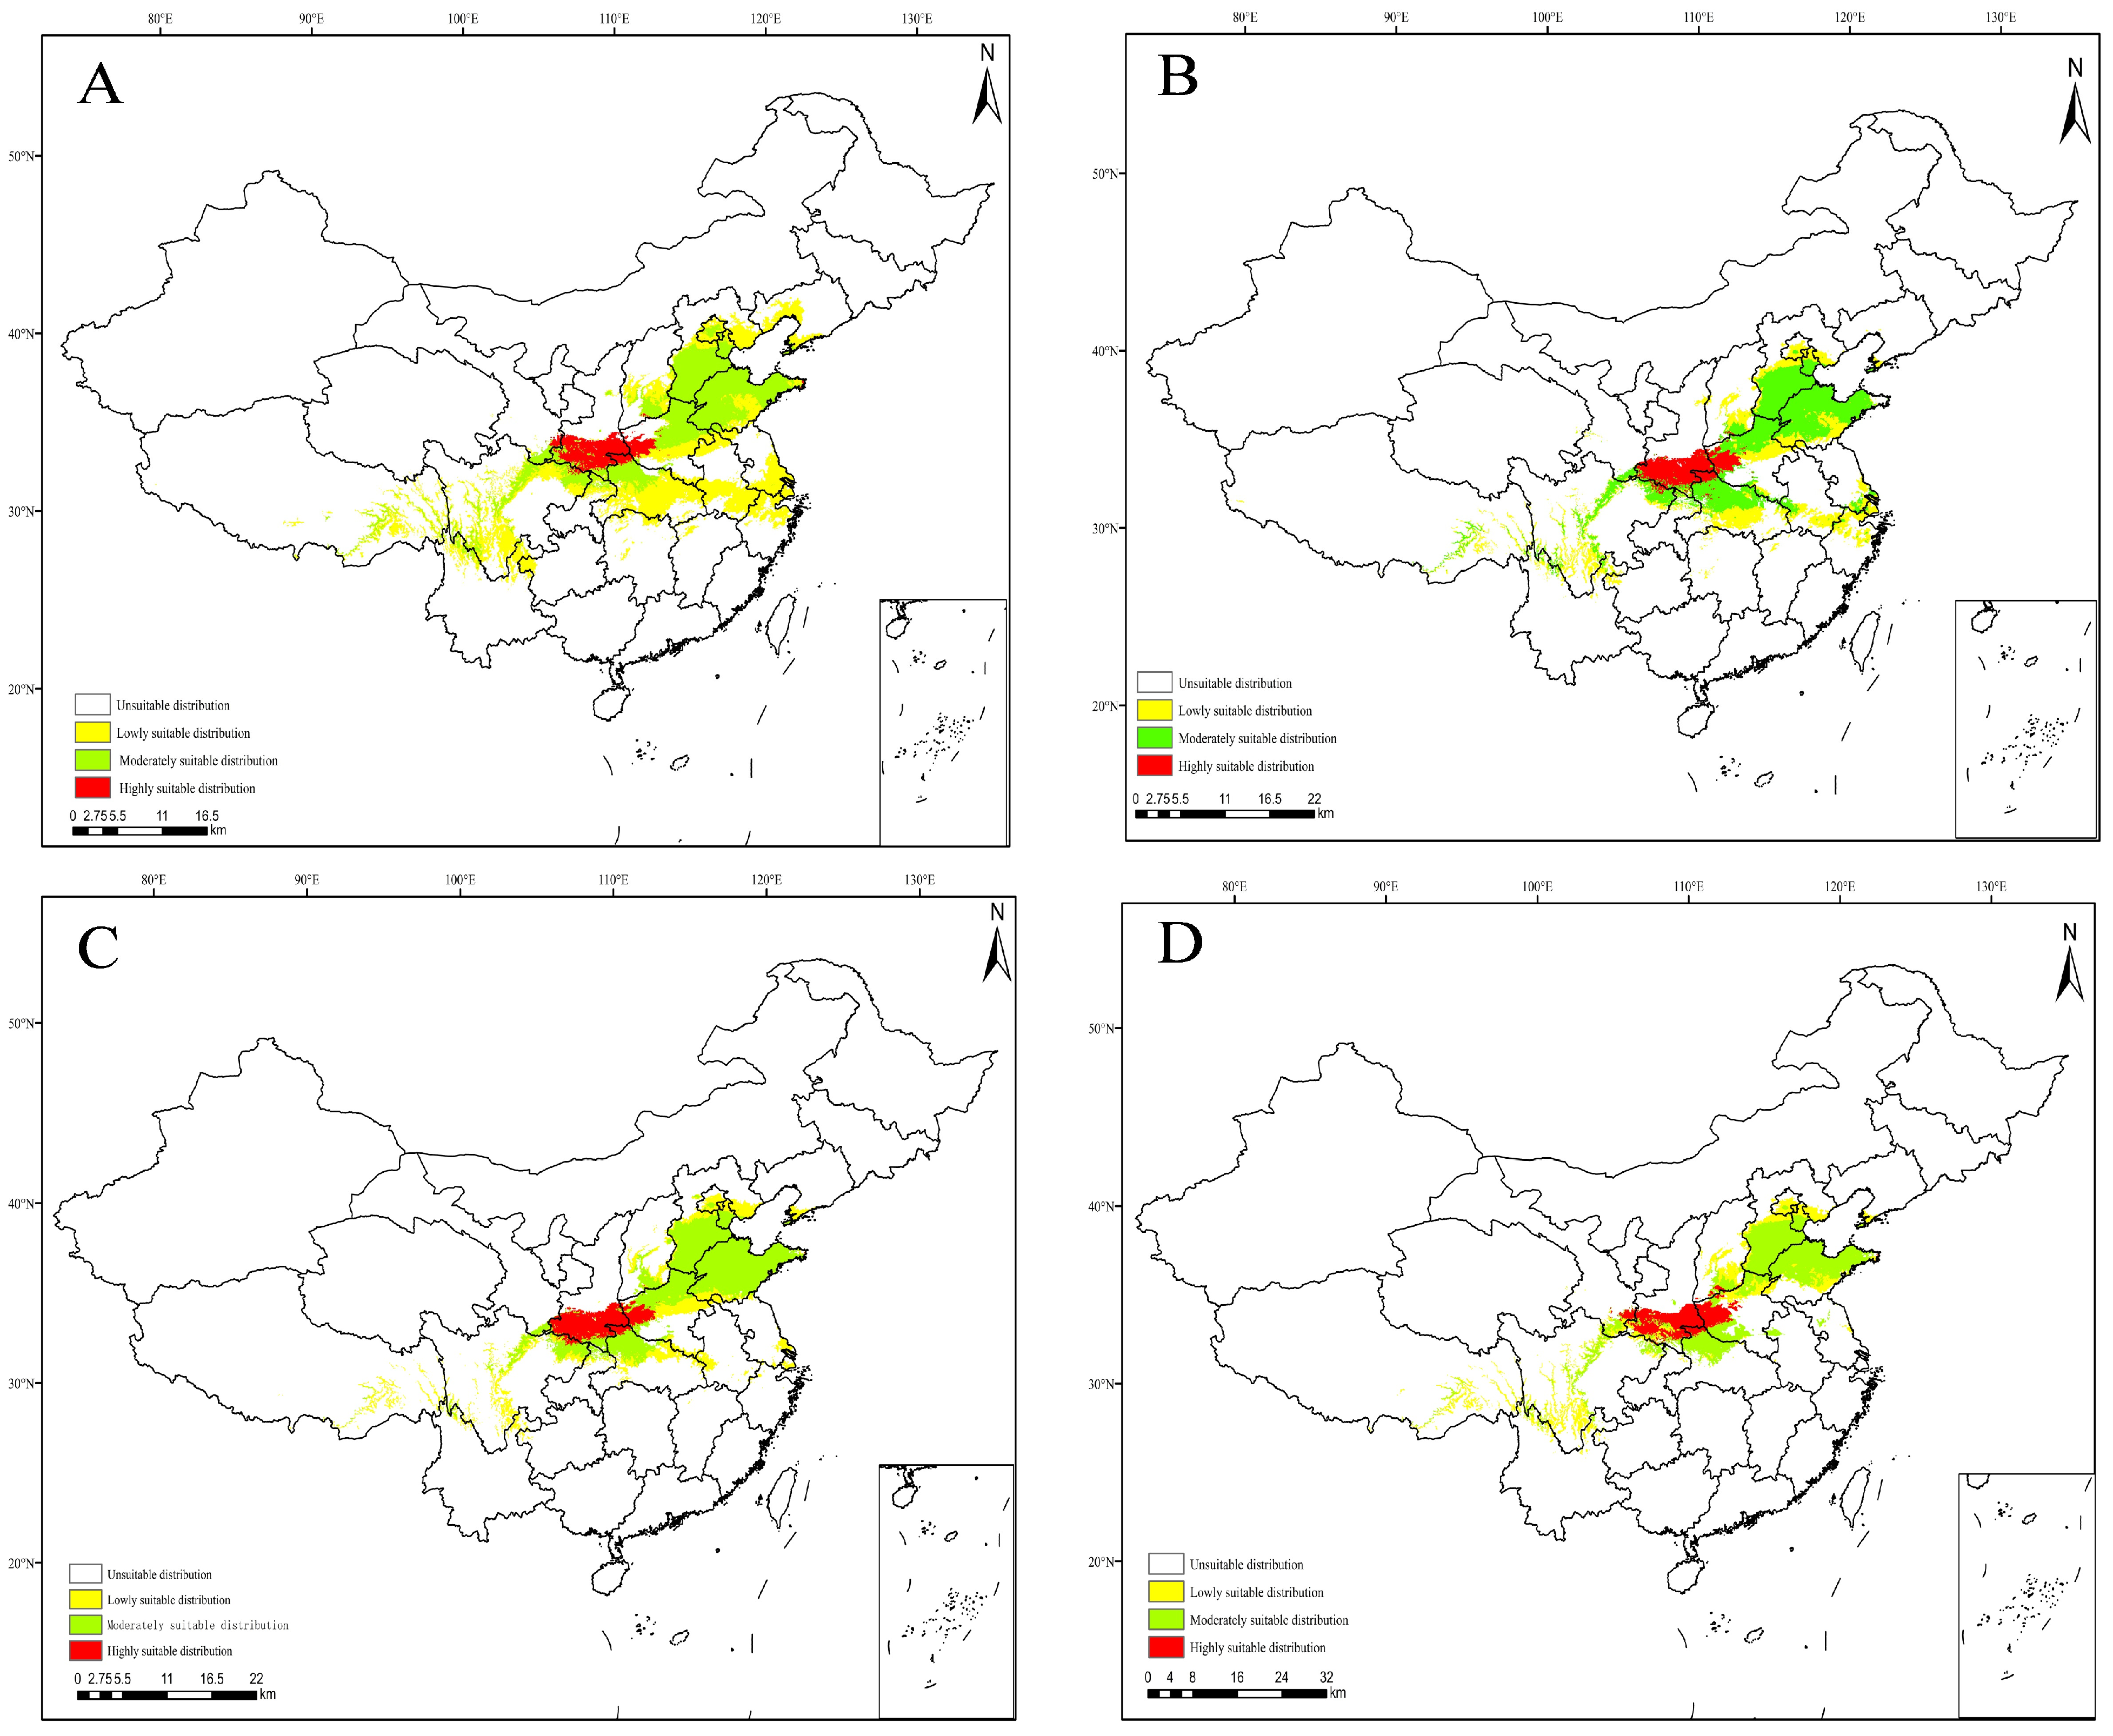
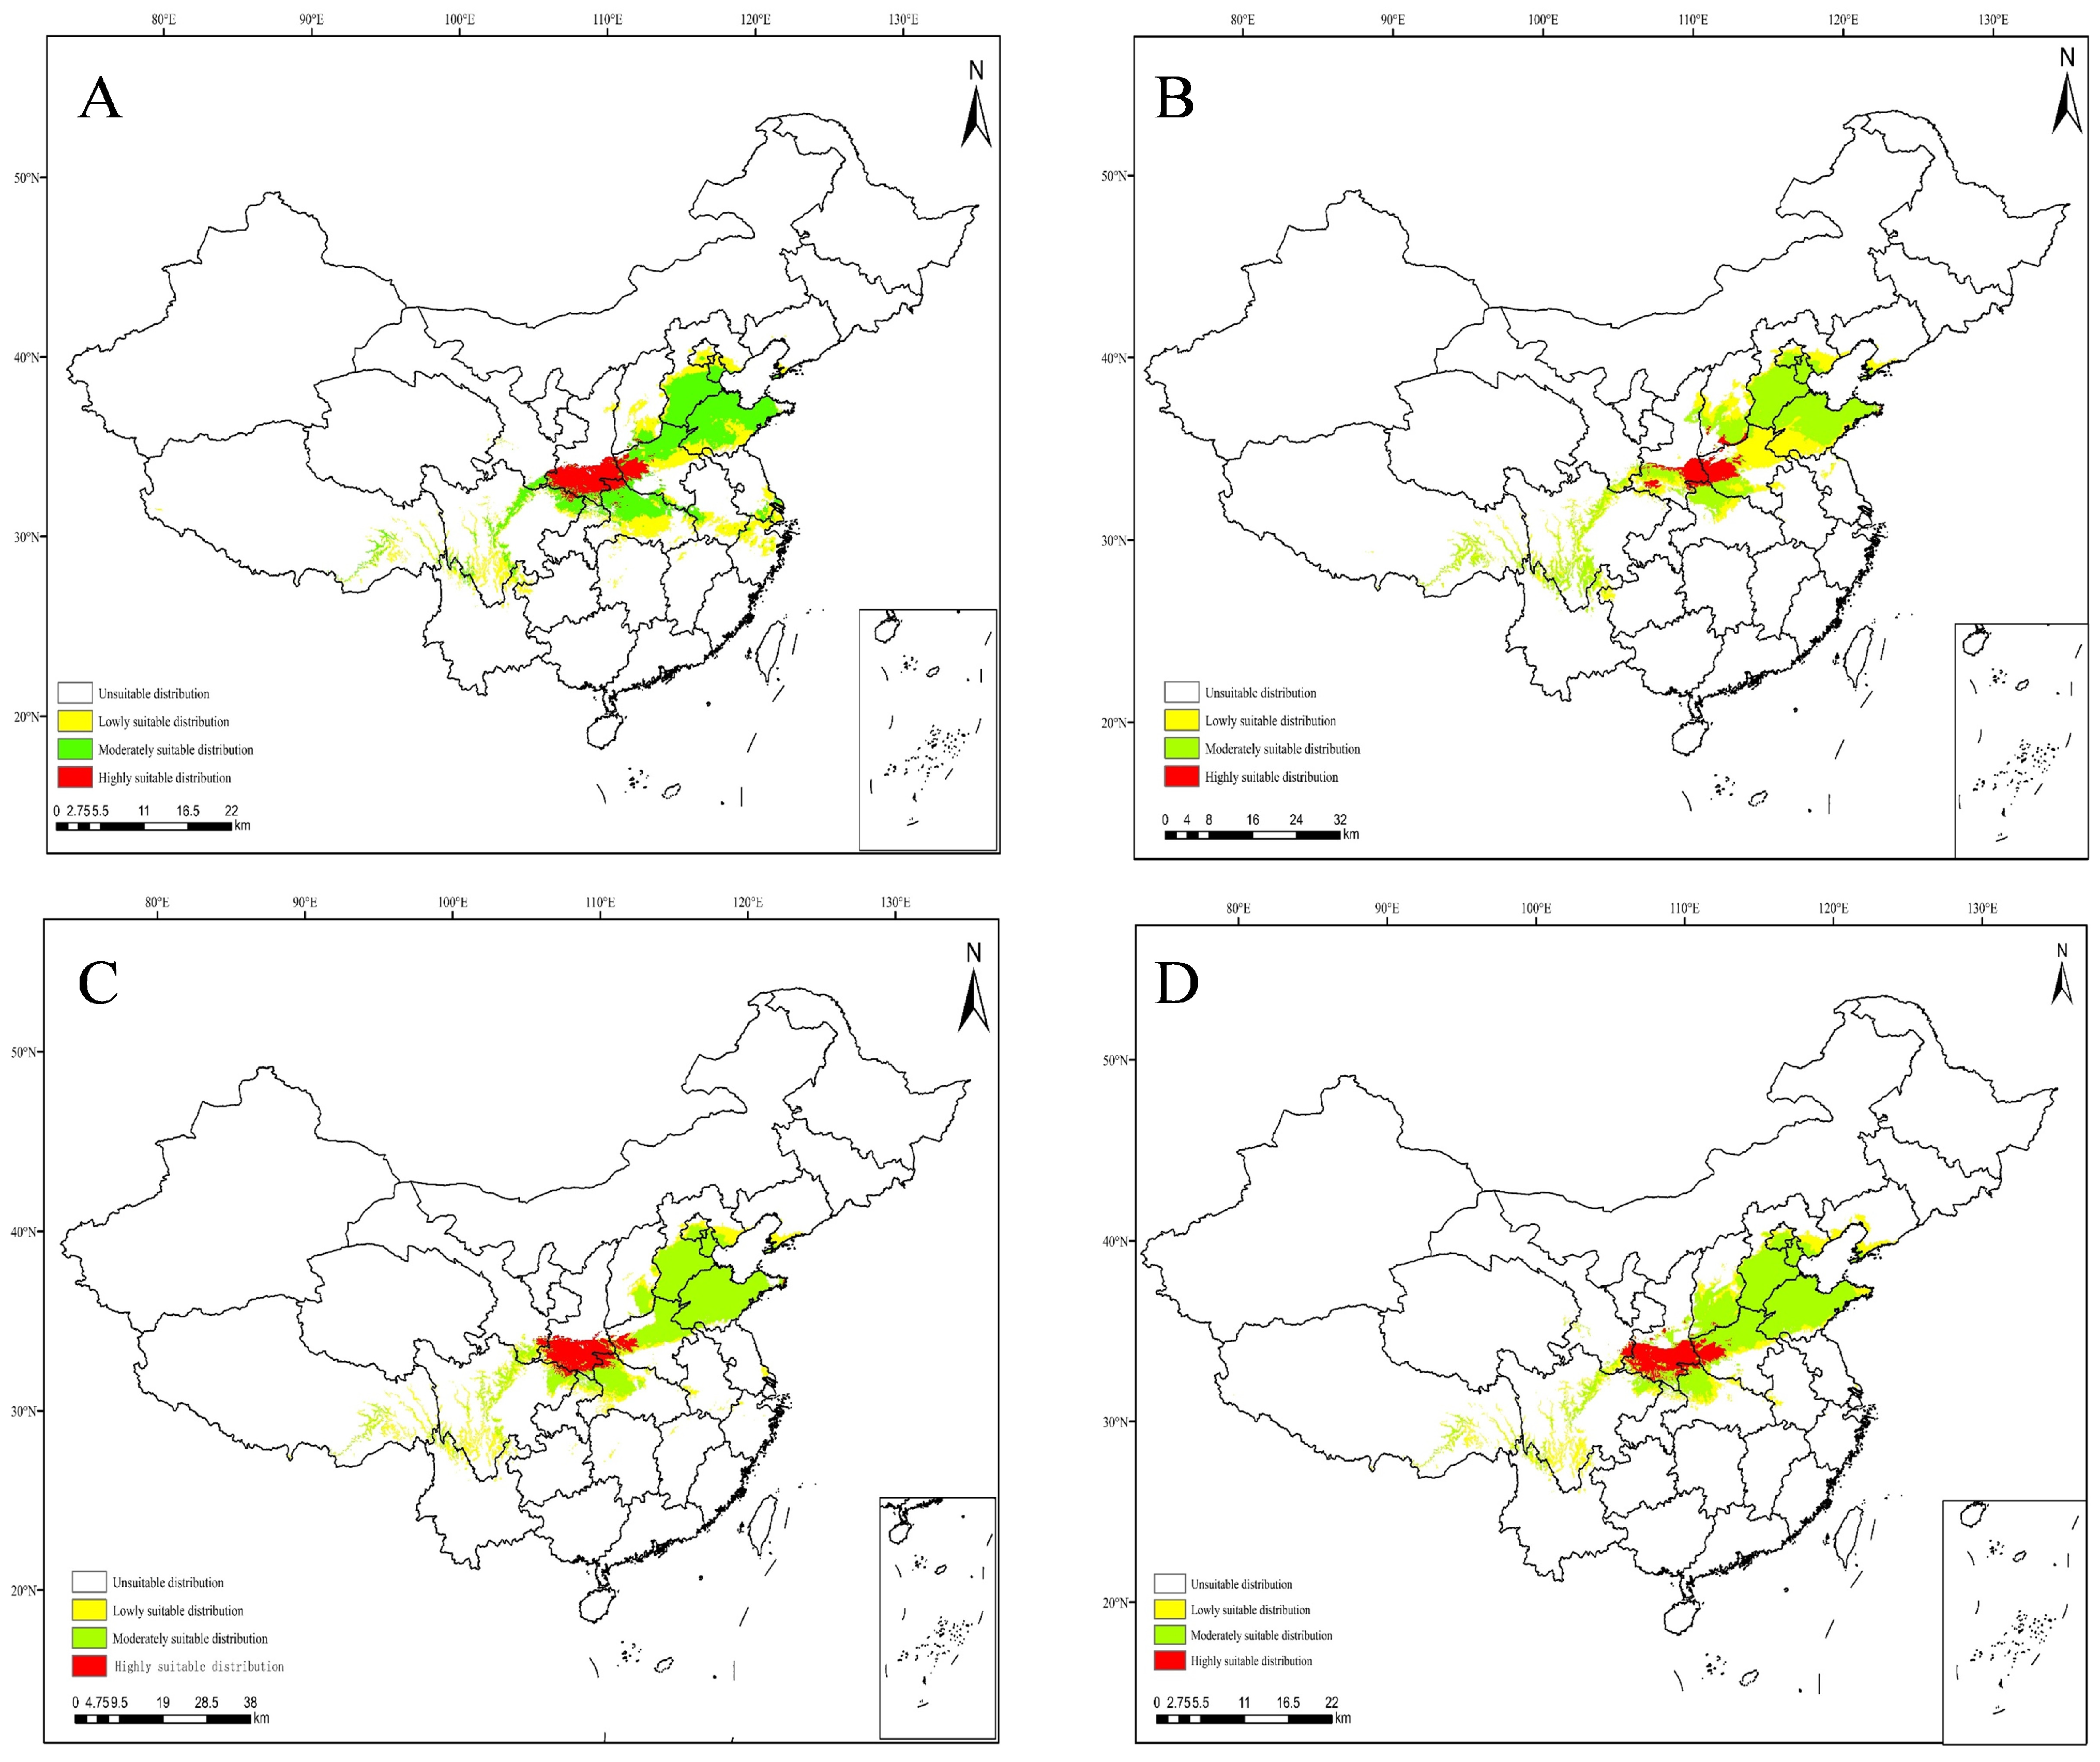
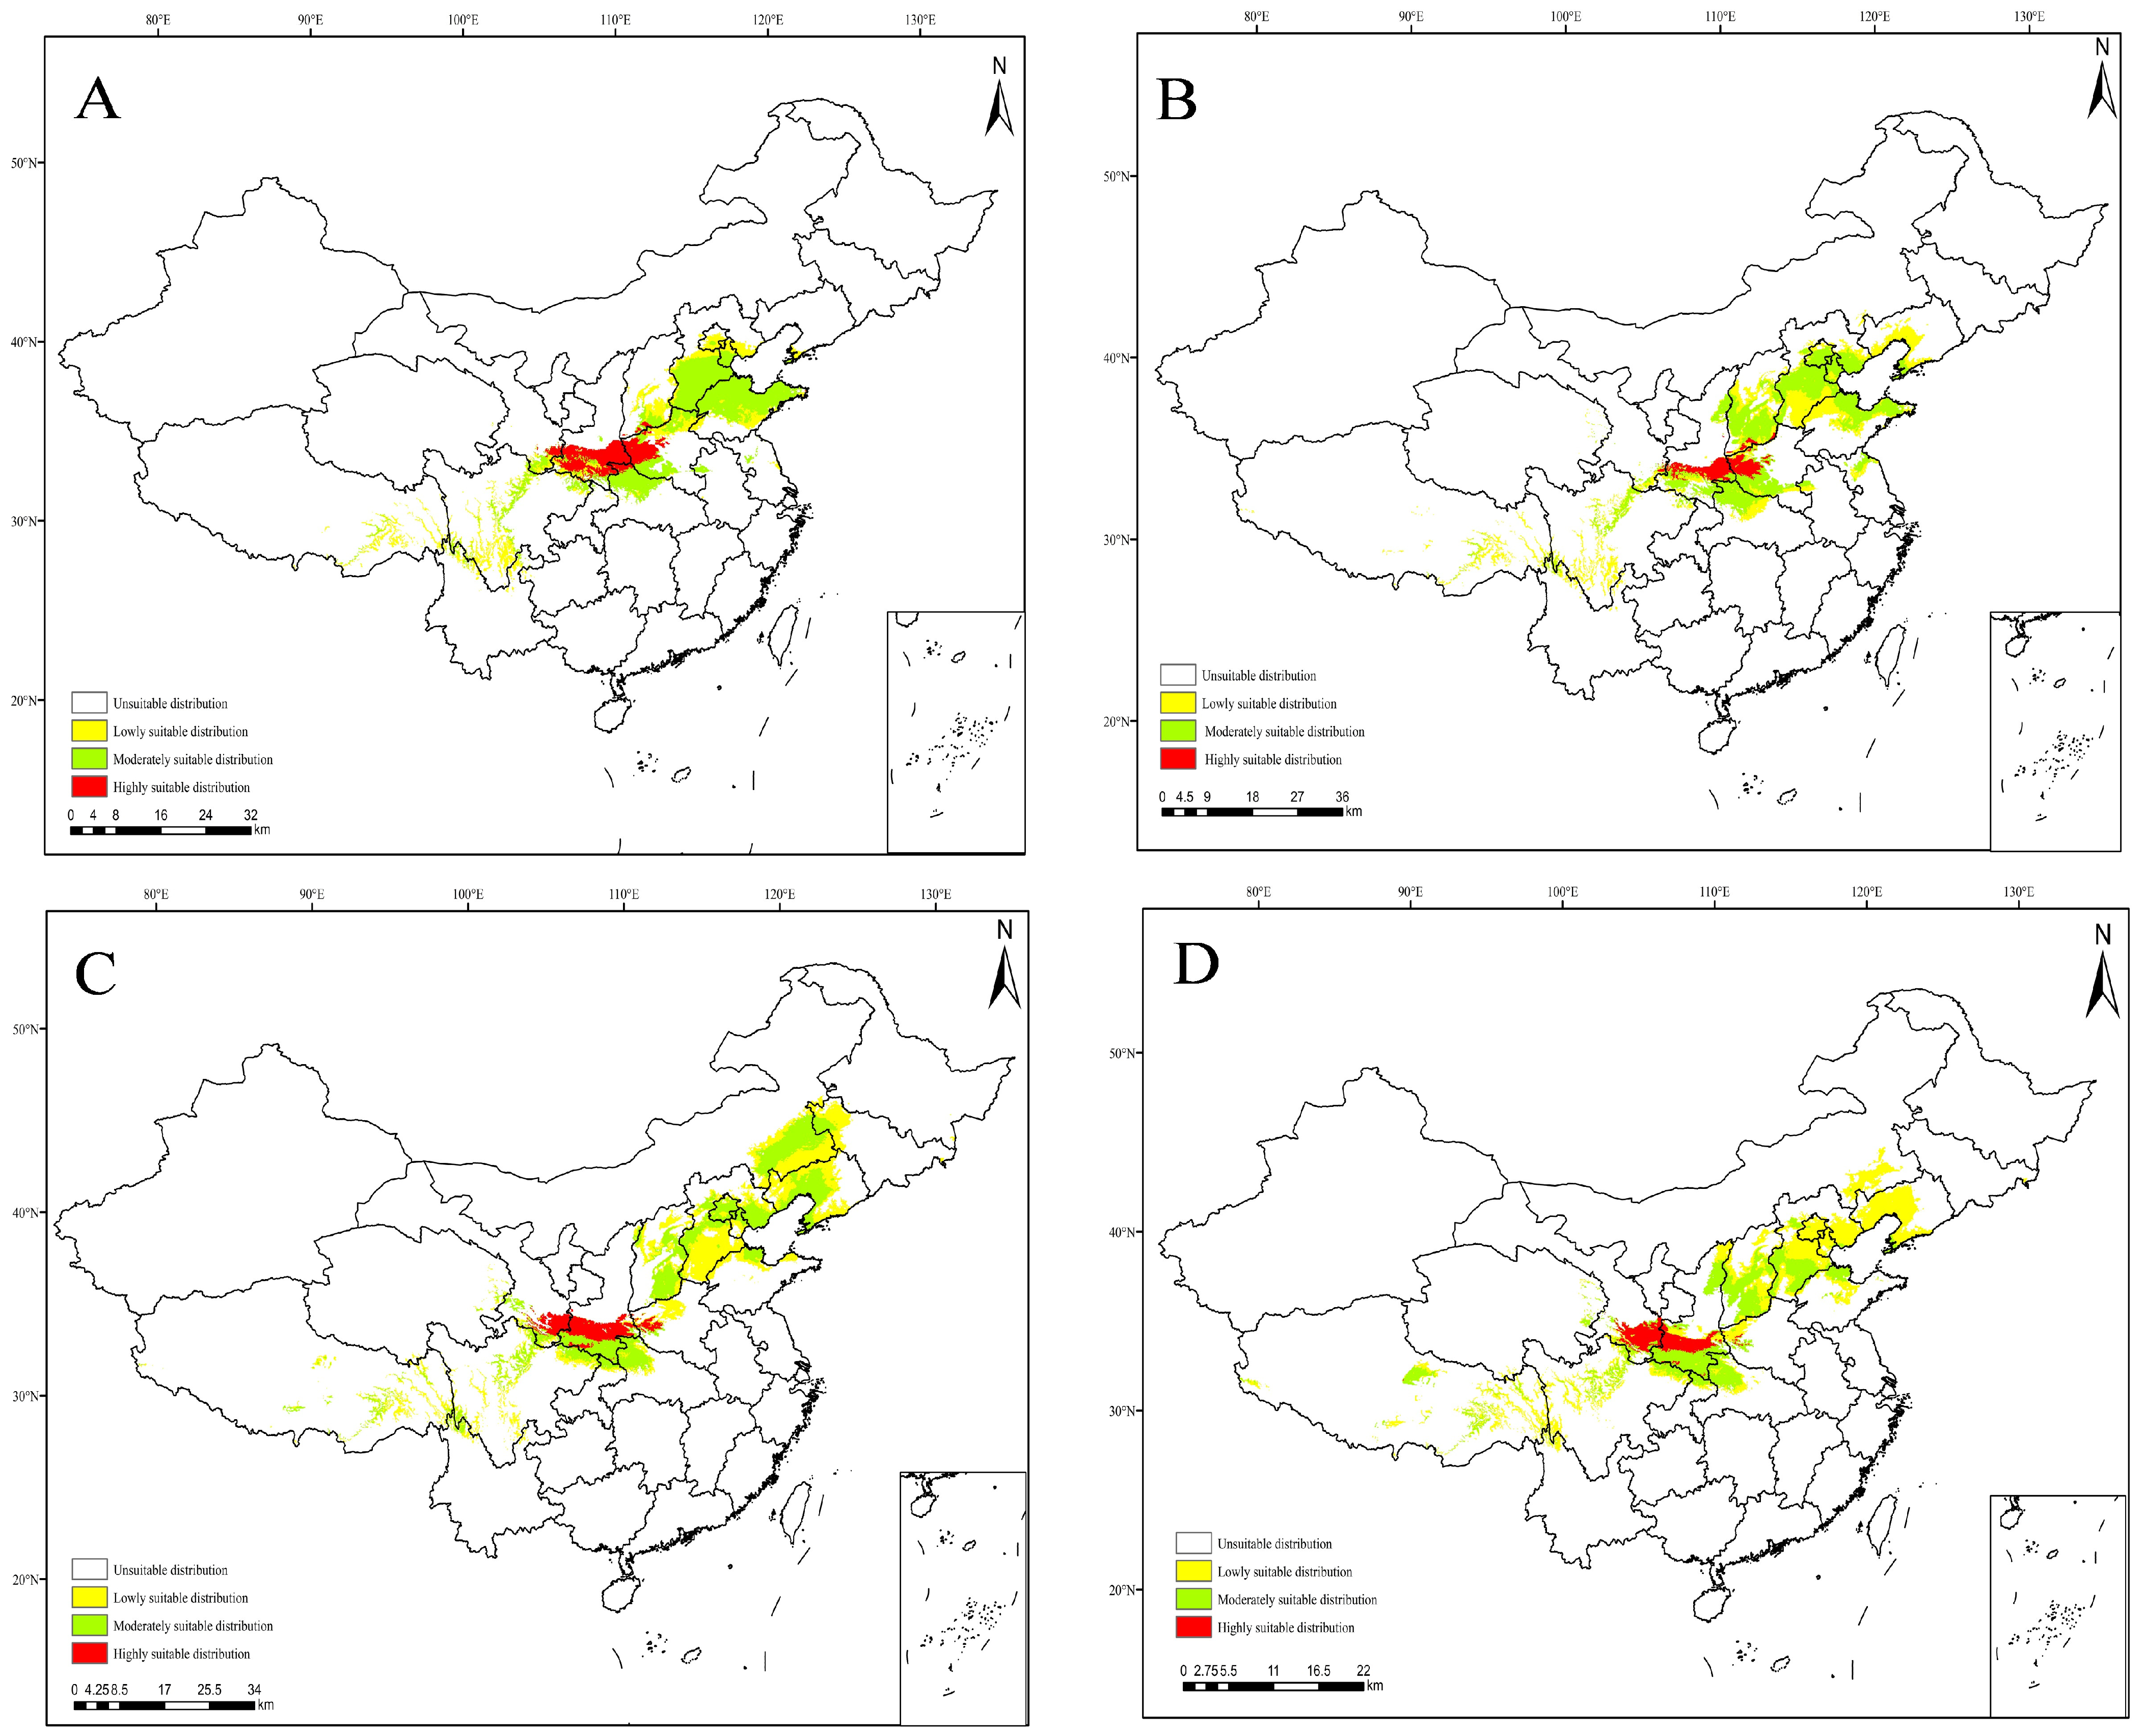
3.5. Projections under Future Climate Scenarios
4. Discussion
5. Conclusions
Author Contributions
Funding
Data Availability Statement
Conflicts of Interest
References
- Czerwinska, M.E.; Melzig, M.F. Cornus mas and Cornus officinalis—Analogies and differences of two medicinal plants traditionally used. Front. Pharmacol. 2018, 9, 894. [Google Scholar] [CrossRef]
- Li, J.; Pu, X.H.; Zong, L.L.; Yuan, Q.; Yang, H. Determination of the Morroniside and Loganin in Cornus officinalis by HPLC. J. Henan Univ. (Med. Sci.) 2016, 35, 249–251. [Google Scholar]
- Huang, L. Cultivar Selection, Propagation and the GAP Cultivation Techniques of Dogwood (Cornus officinalis) in Funiu Mountains; Henan Agricultural University: Zhengzhou, China, 2011. [Google Scholar]
- Yang, J.K. A new genus and species of carposinidae (Lepidoptera). Entomotaxonomia 1982, 4, 253–257. [Google Scholar]
- Zhang, H.Y.; Zhang, G.L.; Zhang, Y.Q.; Xu, C.Q.; Liu, S.; Qiao, H.L.; Lu, P.F. Tunnelling and cocooning behaviour of Carposina coreana larvae. Chin. J. Appl. Entomol. 2023, 60, 1–13. [Google Scholar]
- Dong, J.W.; Liu, S.L.; Ge, S.X.; Wang, X.G.; Fu, Z.F.; Yu, Z.Q. Study of Carposina coreana occurrence and integrated control technology. J. Henan For. Sci. Technol. 2014, 34, 13–15. [Google Scholar]
- Hervé, C.; Brent, J.S.; Philippe, V.; David, R. Insects in fluctuating thermal environments. Annu. Rev. Entomol. 2015, 60, 123–140. [Google Scholar]
- Deutsch, C.A.; Tewksbury, J.J.; Tigchelaar, M.; Battisti, D.S.; Merrill, S.C.; Huey, R.B.; Naylor, R.L. Increase in crop losses to insect pests in a warming climate. Science 2018, 361, 916–919. [Google Scholar] [CrossRef] [PubMed]
- Fisher, J.J.; Rijal, J.P.; Zalom, F.G. Temperature and humidity Interact to Influence brown marmorated stink bug (Hemiptera: Pentatomidae), Survival. Environ. Entomol. 2021, 50, 390–398. [Google Scholar] [CrossRef] [PubMed]
- Lantschner, M.V.; Villacide, J.M.; Garnas, J.R.; Croft, P.; Corley, J.C. Temperature explains variable spread rates of the invasive woodwasp Sirex noctilio in the Southern Hemisphere. Biol. Invasions 2014, 16, 329–339. [Google Scholar] [CrossRef]
- Yang, H.X.; Jiang, N.Z.Y.; Li, C.; Li, J. Prediction of the current and future distribution of tomato leafminer in China using the MaxEnt model. Insects 2023, 14, 531. [Google Scholar] [CrossRef]
- Bai, Y.L.; Zhou, W.W.; Zhu, Z.R. Effects of global warming on insect natural enemies. J. Zhejiang Univ. (Agric. Life Sci.) 2022, 48, 269–278. [Google Scholar]
- Bai, Y.L. Effects of high temperature on two predatory mirid species and the genome analysis of Cyrtorhinus lividipennis. Ph.D. Thesis, Zhejiang University, Hangzhou, China, 2021. [Google Scholar]
- Zhang, P.L.; Leeuwen, C.A.; Bogers, D.; Poelma, M.; Xu, J.; Bakker, E. Ectothermic omnivores increase herbivory in response to rising temperature. Oikos A J. Ecol. 2020, 129, 1028–1039. [Google Scholar] [CrossRef]
- Taylor, R.; Daniel, H.; John, C.; Richard, M. Climate change and pest management: Unanticipated consequences of trophic dislocation. Agronomy 2018, 8, 7. [Google Scholar] [CrossRef]
- Zhu, G.P.; Liu, G.Q.; Bu, W.J.; Gao, Y.B. Ecological niche modeling and its applications in biodiversity conservation. Biodivers. Sci. 2013, 21, 90–98. [Google Scholar]
- Dai, X.S.; Wu, W.; Ji, L.; Tian, S.; Yang, B.; Guan, B.C.; Wu, D. MaxEnt model-based prediction of potential distributions of Parnassia wightiana (Celastraceae) in China. Biodivers. Data J. 2022, 10, e81073. [Google Scholar] [CrossRef] [PubMed]
- Phillips, S.J.; Anderson, R.P.; Schapire, R.E. Maximum entropy modeling of species geographic distributions. Ecol. Model. 2006, 190, 231–259. [Google Scholar] [CrossRef]
- Stockwell, D. The GARP modelling system: Problems and solutions to automated spatial prediction. Int. J. Geogr. Inf. Sci. 1999, 13, 143–158. [Google Scholar] [CrossRef]
- Thuiller, W.; Gueguen, M.; Georges, D.; Bonet, R.; Chalmandrier, L.; Garraud, L.; Renaud, J.; Roquet, C.; Van Es, J.; Zimmermann, N.E.; et al. Are different facets of plant diversity well protected against climate and land cover changes? A test study in the French Alps. Ecography 2014, 37, 1254–1266. [Google Scholar] [CrossRef]
- Zhang, Y.; Qin, Y.J.; Zhao, Z.H.; Tu, X.B.; Zhang, Z.H.; Li, Z.H. The potential geographical distribution of desert locust in China. J. Plant Prot. 2021, 48, 90–95. [Google Scholar]
- Shabani, F.; Kumar, L.; Ahmadi, M. A comparison of absolute performance of different correlative and mechanistic species distribution models in an independent area. Ecol. Evol. 2016, 6, 5973–5986. [Google Scholar] [CrossRef]
- Zhang, Y.; Tang, J.S.; Ren, G.; Zhao, K.X.; Wang, X.F. Global potential distribution prediction of Xanthium italicum based on Maxent model. Sci. Rep. 2021, 11, 16545. [Google Scholar] [CrossRef] [PubMed]
- Wang, S.Y.; Lu, Y.Y.; Han, M.Y.; Li, L.L.; He, P.; Shi, A.; Bai, M. Using MaxEnt model to predict the potential distribution of three potentially invasive scarab beetles in China. Insects 2023, 14, 239. [Google Scholar] [CrossRef] [PubMed]
- Mao, M.F.; Chen, S.Q.; Ke, Z.Y.; Qian, Z.Q.; Xu, Y.J. Using MaxEnt to predict the potential distribution of the little fire ant (Wasmannia auropunctata) in China. Insects 2022, 13, 1008. [Google Scholar] [CrossRef] [PubMed]
- Ma, B.B.; Sun, J. Predicting the distribution of Stipa purpurea across the Tibetan Plateau via the MaxEnt model. BMC Ecol. 2018, 18, 10. [Google Scholar] [CrossRef] [PubMed]
- Adnan, Y.; Rana, H.; Nasreen, K.; Farzana, I.; Hina, M.; Sharmeen, R.; Majid, H. Identification of suitable habitat for Taxus wallichiana and Abies pindrow in moist temperate forest using maxent modelling technique. Saudi J. Biol. Sci. 2022, 29, 103459. [Google Scholar]
- Xu, Y.D.; Zhu, R.F.; Gao, L.F.; Huang, D.J.; Fan, Y.; Liu, C.; Chen, J.S. Predicting the current and future distributions of Pennisetum alopecuroides (L.) in China under climate change based on the MaxEnt model. PLoS ONE 2023, 18, e0281254. [Google Scholar] [CrossRef] [PubMed]
- Cheng, C.X.; Jiang, M.X.; Gao, Y.L.; Hu, H.Q.; Lin, N.F.; Dai, Y.S.; Lv, B.Q.; Chen, L.L. Prediction of global suitable area for Ceratothripoides claratris under the background of climate change. Plant Quar. 2022, 36, 72–79. [Google Scholar]
- Bi, X.Z.; Wang, X.B. Biological characteristics and control of Carposina coreana. Anhui For. 2003, 23, 29. [Google Scholar]
- Ji, W.; Gao, G.; Wei, J.F. Potential global distribution of Daktulosphaira vitifoliae under climate change based on MaxEnt. Insects 2021, 12, 347. [Google Scholar] [CrossRef]
- Hijmans, R.J.; Cameron, S.E.; Parra, J.L.; Jones, P.G.; Jarvis, A. Very high resolution interpolated climate surfaces for global land areas. Int. J. Climatol. 2005, 25, 1965–1978. [Google Scholar] [CrossRef]
- Zhou, R.B.; Gao, Y.; Chang, N.; Gao, T.; Ma, D.L.; Li, C.; Liu, Q.Y. Projecting the potential distribution of Glossina morsitans (Diptera: Glossinidae) under climate change using the MaxEnt Model. Biology 2021, 10, 1150. [Google Scholar] [CrossRef] [PubMed]
- O’neill, B.C.; Tebaldi, C.; Vuuren, D.; Eyring, V.; Friedlingstein, P.; Hurtt, G.; Knutti, R.; Kriegler, E.; Lamarque, J.; Lowe, J.; et al. The Scenario Model Intercomparison Project (ScenarioMIP) for CMIP6. Geosci. Model. Dev. 2016, 9, 3461–3482. [Google Scholar] [CrossRef]
- Phillips, S.J.; Dudik, M.; Schapire, R.E. A maximum entropy approach to species distribution modeling. In Proceedings of the 21st International Conference on Machine Learning, Virtual, 18–24 July 2004; pp. 655–662. [Google Scholar]
- Phillips, S.J.; Anderson, R.P.; Dudík, M.; Schapire, R.E.; Blair, M.E. Opening the black box: An open-source release of Maxent. Ecography 2017, 40, 887–893. [Google Scholar] [CrossRef]
- Liu, Y.; Shi, J. Prediction of potential geographical distribution of Icerya acegyptiaca in China under climate change. Plant Prot. 2020, 46, 108–117. [Google Scholar]
- Fernandez, I.C.; Morales, N.S. One-class land-cover classification using MaxEnt: The effect of modelling parameterization on classification accuracy. PeerJ 2019, 7, e7016. [Google Scholar] [CrossRef] [PubMed]
- Dan, L.W.; Stephanie, N.S. Ecological niche modeling in Maxent: The importance of model complexity and the performance of model selection criteria. Ecol. Appl. 2011, 21, 335–342. [Google Scholar]
- Cobos, M.E.; Peterson, A.T.; Barve, N.; Osorioolvera, L. kuenm: An R package for detailed development of ecological niche models using Maxent. PeerJ 2019, 7, e6281. [Google Scholar] [CrossRef] [PubMed]
- Peterson, A.; Soberón, J.; Pearson, R.; Anderson, R.; Martínezmeyer, E.; Nakamura, M.; Araújo, M. Ecological Niches and Geographic Distributions; Princeton University Press: Princeton, NJ, USA, 2011. [Google Scholar]
- Shcheglovitova, M.; Anderson, R.P. Estimating optimal complexity for ecological niche models: A jackknife approach for species with small sample sizes. Ecol. Modell. 2013, 269, 9–17. [Google Scholar] [CrossRef]
- Qin, Z.; Zhang, J.E.; Ditommaso, A.; Wang, R.L.; Wu, R.S. Predicting invasions of Wedelia trilobata (L.) Hitchc. with Maxent and GARP models. J. Plant Res. 2015, 128, 763–775. [Google Scholar] [CrossRef]
- Aidoo, O.F.; Souza, P.G.C.; Silva, R.S.; Santana, P.A.; Picano, M.C.; Kyerematen, R.; Sètamou, M.; Ekesi, S.; Borgemeister, C. Climate-induced range shifts of invasive species (Diaphorina citri Kuwayama). Pest. Manag. Sci. 2022, 78, 2534–2549. [Google Scholar] [CrossRef]
- Jiméne-valverde, A.; Lobo, J.M.; Hortal, J. Not as good as they seem: The importance of concepts in species distribution modelling. Divers. Distrib. 2008, 14, 885–890. [Google Scholar] [CrossRef]
- Kong, W.; Li, X.; Zou, H. Optimizing MaxEnt model in the prediction of species distribution. Chin. J. Appl. Ecol. 2019, 30, 2116–2128. [Google Scholar]
- Bai, Y.; Wang, Y.; Kang, J.; Wang, Z. Prediction for the distribution of diseases and insect pests in Cornus of ficinalis based on GIS. J. Shaanxi Norm. Univ. (Nat. Sci. Ed.) 2016, 44, 64–68. [Google Scholar]
- Walther1, G.R.; Berger1, S.; Sykes, M.T. An ecological ‘footprint’ of climate change. Proc. R. Soc. B 2005, 272, 1427–1432. [Google Scholar] [CrossRef] [PubMed]
- Fareen, A.G.E.; Mahmood, T.; Bodlah, I.; Rashid, A.; Mahmood, S. Modeling potential distribution of newly recorded ant, Brachyponera nigrita using Maxent under climate change in Pothwar region, Pakistan. PLoS ONE 2022, 17, e0262451. [Google Scholar]
- Wei, X.J.; Xu, D.P.; Liu, Q.W.; Wu, Y.H.; Zhou, Z.H. Predicting the potential distribution range of Batocera horsfieldi under CMIP6 climate change using the MaxEnt model. J. Econ. Entomol. 2024, 117, 187–198. [Google Scholar] [CrossRef] [PubMed]
- Zhang, F.; Chen, S.; Wang, L.; Zhang, Y.; Zhang, X.; Zhu, S. Study on ecological suitability regionalization of Corni Fructus based on Maxent and ArcGIS model. China J. Chin. Mater. Medica 2017, 42, 3078–3083. [Google Scholar]
- Heikkinen, R.K.; Luoto, M.; Araújo, M.; Virkkala, R.; Thuiller, W.; Sykes, M. Methods and uncertainties in bioclimatic envelope modelling under climate change. Prog. Phys. Geogr. 2006, 30, 751–777. [Google Scholar] [CrossRef]
- Sinclair, S.J.; White, M.D.; Newell, G.R.J.E. How useful are species distribution models for managing Biodiversity under future climates. Ecol. Soc. 2010, 15, 299–305. [Google Scholar] [CrossRef]


| No. | Climatic Variable | Contribution Rate % |
|---|---|---|
| Bio4 | Temperature Seasonality (standard deviation * 100) | 26.3 |
| Bio6 | Minimum Temperature in Coldest Month | 14.5 |
| Bio11 | Mean Temperature in Coldest Quarter | 14.1 |
| Bio14 | Precipitation in Driest Month | 0.5 |
| Bio18 | Precipitation in Warmest Quarter | 35.5 |
| Bio19 | Precipitation in Coldest Quarter | 9.1 |
Disclaimer/Publisher’s Note: The statements, opinions and data contained in all publications are solely those of the individual author(s) and contributor(s) and not of MDPI and/or the editor(s). MDPI and/or the editor(s) disclaim responsibility for any injury to people or property resulting from any ideas, methods, instructions or products referred to in the content. |
© 2024 by the authors. Licensee MDPI, Basel, Switzerland. This article is an open access article distributed under the terms and conditions of the Creative Commons Attribution (CC BY) license (https://creativecommons.org/licenses/by/4.0/).
Share and Cite
Zhang, G.; Liu, S.; Xu, C.; Wei, H.; Guo, K.; Xu, R.; Qiao, H.; Lu, P. Prediction of Potential Distribution of Carposina coreana in China under the Current and Future Climate Change. Insects 2024, 15, 411. https://doi.org/10.3390/insects15060411
Zhang G, Liu S, Xu C, Wei H, Guo K, Xu R, Qiao H, Lu P. Prediction of Potential Distribution of Carposina coreana in China under the Current and Future Climate Change. Insects. 2024; 15(6):411. https://doi.org/10.3390/insects15060411
Chicago/Turabian StyleZhang, Guolei, Sai Liu, Changqing Xu, Hongshuang Wei, Kun Guo, Rong Xu, Haili Qiao, and Pengfei Lu. 2024. "Prediction of Potential Distribution of Carposina coreana in China under the Current and Future Climate Change" Insects 15, no. 6: 411. https://doi.org/10.3390/insects15060411