Article

The Fast Evolution of the Stenobothrini Grasshoppers (Orthoptera, Acrididae, and Gomphocerinae) Revealed by an Analysis of the Control Region of mtDNA, with an Emphasis on the Stenobothrus eurasius Group

by
Svetlana Sorokina
1,
Nikita Sevastianov
2,
Tatiana Tarasova
2 and
Varvara Vedenina
2,*
1
Koltzov Institute of Developmental Biology, Russian Academy of Sciences, 26 Vavilov Street, Moscow 119334, Russia
2
Institute for Information Transmission Problems, Russian Academy of Sciences, 19 Bolshoy Karetny per., Moscow 127051, Russia
*
Author to whom correspondence should be addressed.
Insects 2024, 15(8), 592; https://doi.org/10.3390/insects15080592
Submission received: 20 May 2024 / Revised: 28 July 2024 / Accepted: 31 July 2024 / Published: 3 August 2024
(This article belongs to the Section Insect Systematics, Phylogeny and Evolution)

Abstract

:

Simple Summary

Grasshopper species of the Stenobothrini tribe are known by the wide diversity of their premating traits, such as acoustic behavior and morphological characters. However, the phylogenetic relationships, divergence time, and phylogeography of these species inferred with the mtDNA markers (the control region and the COI gene) did not reflect the species divergence. The analysis of interspecific and intraspecific variability in the control region in two hybridizing species of this genus, S. eurasius and S. hyalosuperficies, supports the hypothesis of putative hybridization between the species and shows the direction of the mtDNA introgression.

Abstract

The two cryptic grasshopper species of the genus Stenobothrus, S. eurasius and S. hyalosuperficies, demonstrate different acoustic behavior despite a strong similarity in morphology. A hybridization between these species is possible in the contact zone; however, there are little molecular data about the relationships of these species. The analysis of the mtDNA control region (CR) reveals that haplotypes of S. hyalosuperficies have more in common with the more distant Stenobothrus species than with the closely related S. eurasius. In the contact zone, S. eurasius has mt-haplotypes shared with S. hyalosuperficies, which might indicate an introgression of mtDNA from S. hyalosuperficies to the S. eurasius gene pool. We also analyze the structure and evolutionary rate of the mtDNA CR for the Stenobothrus genus and estimate the time of divergence of the species within the genus. The phylogenetic tree of the tribe Stenobothrini reconstructed with either the CR or COI gave the same four groups. The phylogenetic tree of the Stenobothrus genus has a star-like topology with each mtDNA haplotype found in any analyzed species, except S. eurasius, which forms a separate branch. The maximum degree of incomplete lineage sorting can demonstrate either ancestral polymorphism or introgression.

1. Introduction

The ways of establishing reproductive isolation between species have traditionally received much attention. Interspecific reproductive barriers can be classified into premating and post-mating (prezygotic and post-zygotic) isolation mechanisms according to the time when they occur during the life cycle [1,2,3]. Intrinsic post-zygotic incompatibilities such as hybrid unviability and sterility have been considered as the classical driving force behind speciation [3]. At the same time, more intriguing processes occur when premating isolation evolves faster than post-zygotic barriers. It is assumed that premating isolation may be achieved by assortative mating evolving as a result of sexual selection, when a parallel change in mate preference and secondary sexual traits takes place [4,5,6].
In many species of animals, acoustic communication is one of the important components of premating isolation. Among animal groups that exhibit acoustic communication, grasshoppers of the subfamily Gomphocerinae are considered to be a good model for the studies of rapid speciation. First, there are many cryptic species that differ only by songs (e.g., [7,8,9,10]). Second, among Orthoptera, acoustic communication in Gomphocerinae is most developed in terms of the complexity of the sound-producing mechanisms, the number of sound elements, and the mating strategies. In particular, the majority of the gomphocerine grasshoppers produce two song types, the calling song and courtship song, and the courtship songs may reach a high degree of complexity and be accompanied by visual signals (e.g., [7,9,11,12]). Finally, many gomphocerine species hybridize in nature (e.g., [13,14,15]), which is indicative of a recent and non-complete divergence of these young species.
The two cryptic species of the genus Stenobothrus, S. eurasius and S. hyalosuperficies, represent an interesting group within Gomphocerinae. Despite a strong similarity in morphology, they are different both in their calling and courtship songs and in their sound-producing mechanisms [10]. S. eurasius generates sound by the common tegminal–femoral stridulation, whereas S. hyalosuperficies generates sound by both common stridulation and wing clapping. The range of S. eurasius extends from south-eastern Europe to southern Siberia, eastward to Transbaikalia; the range of S. hyalosuperficies is smaller, covering the south-eastern part of European Russia, the Orenburg region, Kazakhstan except the northern regions, Kyrgyzstan, and north-western China. Despite the striking differences in songs and sound-producing mechanisms between the two species, they were found to hybridize in the wide contact zone [16]. We also conducted pilot behavioral experiments with the song playback, which showed that the females of S. hyalosuperficies are less selective than the females of S. eurasius [16].
These preliminary results do not allow us to unambiguously determine the phylogenetic relationships between the two species. On one hand, a phylogenetic analysis of Gomphocerinae showed that all extant species with ancient origins produce songs only by means of stridulation (e.g., [11,17]). Another sound-producing mechanism, the crepitation, is known for a relatively small number of species, mainly within the genus Stenobothrus, which is suggested to be a group of young species. The divergence of this genus is estimated from 0.6 mya [18] to 1.9 mya [17]. Thus, we propose that S. eurasius is closer to an ancestral form than S. hyalosuperficies. On the other hand, the lower selectivity of the S. hyalosuperficies females found in the behavioral experiments might indicate that this species is closer to an ancestral form than S. eurasius.
It was shown that interspecific boundaries within the cryptic species complexes can be rarely identified by using a standard set of genetic markers (e.g., [19]). A low mutation rate and an ancestral polymorphism make the molecular differentiation of taxa difficult. The previously obtained phylogenetic reconstructions of Gomphocerinae demonstrate the extremely small genetic distances between haplotypes of closely related species and do not reveal the expected clustering [11,17,20,21]. We compared the values of pairwise interspecific genetic distances for the tribe Stenobothrini for each common mitochondrial marker and found the mtDNA control region (CR) to be the most variable. Unlike the mt-genomes of some other Orthoptera species with a large CR (e.g., Podismini; [22]), the mt-genomes of the Stenobothrini species have a relatively short CR with a length of about 770 bp [23,24]. Moreover, the sequence of the Stenobothrini CR is poorly enriched in A and T compared to the Drosophila sequences [25,26] and does not contain Variable Number Tandem Repeats (VNTRs), which are found in the CR of other groups of Orthoptera species (e.g., Gryllotalpidae; [27]). The CR does not belong to the mt-genome part, which is overrepresented in the nuclear genome as NUMTs [28,29]. All of the above shows the CR of mtDNA to be a promising marker for the study of divergence and the phylogeographic history of the species S. eurasius and S. hyalosuperficies.
In the current study, we analyze the structure and evolutionary rate of the mtDNA CR for the genus Stenobothrus and trace the phylogenetic relationships between species of the Stenobothrini tribe based on the analysis of the CR and the COI gene. We estimate the time of divergence of the species within the genus Stenobothrus and discuss the phylogeography of this genus. In the two closely related species, S. eurasius and S. hyalosuperficies, the interspecific and intraspecific variability in the CR is analyzed. Following up on our results, we test the following three hypotheses: (1) if the phylogenetic tree shows S. eurasius as paraphyletic with regard to S. hyalosuperficies, this would indicate that S. hyalosuperficies diverged from S. eurasius or from a common ancestor; (2) if the phylogenetic tree shows a reciprocal monophyly, this would be evidence of the existence of periods of population decline and the subsequent expansion of both species accompanied by the formation of mt-haplogroups; (3) and finally, a polyphyletic structure of the phylogenetic tree would indicate either the common gene pool of the two species due to ancestral polymorphism or an insufficient resolution of the marker used. A comparative analysis of the haplotypes from allopatric populations and the contact zone between S. eurasius and S. hyalosuperficies would allow us to support putative hybridization and to show the direction of the mtDNA introgression.

2. Material and Methods

2.1. Sample Collection and DNA Extraction

During 2022–2023, 82 specimens of 17 species of the Stenobothrini tribe and the outgroup (Chorthippus pullus) were collected from natural populations (Supplementary Materials Table S1). The specimens were preserved and stored in 96% ethanol at −20 °C for the subsequent molecular genetic investigation. The total DNA was extracted from the hind femora using the AmplySens “DNA-sorb-B” Blood & Tissue kit (InterLabServise, kat. # K1-2-100, Moscow, Russia) according to the manufacturer’s instructions. Each hind femur was cleared of cuticle, dried from the remaining ethanol, and homogenized by a pestle.

2.2. DNA Sequencing

The PCR primers for the CR were selected in “Primer3” web version 4.1.0. by using the sequence of Myrmeleotettix sp. (MK903595). Three primers were used in this study: MyrmF1 (external forward)—5′-ctggcacgaaatatgccaat-3′, MyrmF800 (inner forward)—5′-cctttttttaactatatggtaaag-3′, and MyrmR2 (external reverse)—5′-gcctctataaacggggtatgaacc-3′. MyrmF1 and MyrmR2 gave a fragment 1076 nucleotides long and it was used for the sequencing of the complete CR. The PCR product of MyrmF800 in combination with MyrmR2 was 691 bp long and contained a partial sequence of the CR and two tRNA genes (trnI and trnQ).
A PCR amplification of the mitochondrial cytochrome C oxidase subunit I (COI) gene was performed with the universal primers HCO2198 and LCO1490 [30]. A polymerase chain reaction was carried out using the BioMaster HS-Taq PCR-Color (2×) (Biolabmix, kat. # MH010-200, Novosibirsk, Russia) in a volume of 25 μL. The target product was obtained by using a Perkin Elmer GeneAmp PCR System 2400 DNA analyzer. The program included a preliminary denaturation step at 95° for 5 min, 35 amplification cycles, and final elongation at 72° for 7 min. The primer annealing was carried out for 30 s at 60°. The elongation time was 1 min for the MyrmF1–MyrmR2 primer pair and 40 s for the MyrmF800–MyrmR2 primer pair. The COI primer annealing was carried out for 30 s at 48° and the elongation time was 1 min. The PCR products were purified from the reaction mixture using the Cleanup Standard DNA purification kit (Evrogen, kat. # BC022L, Moscow, Russia).
The quality of the PCR products was tested by gel electrophoresis. The sequencing was performed from the PCR primers in both directions with the BigDye Terminator v. 3.1 kit (Thermo Scientific, kat. # 4337454, Waltham, MA, USA) on the genetic analyzer “Applied Biosystems 3500” of the Core Centrum of the Institute of Developmental Biology RAS, according to the manufacturer’s protocol.
The sequences generated for this study were deposited in the NCBI nucleotide database (Supplementary Materials Table S1). The data from the BOLD and NCBI nucleotide databases were also used (Supplementary Materials Table S1).

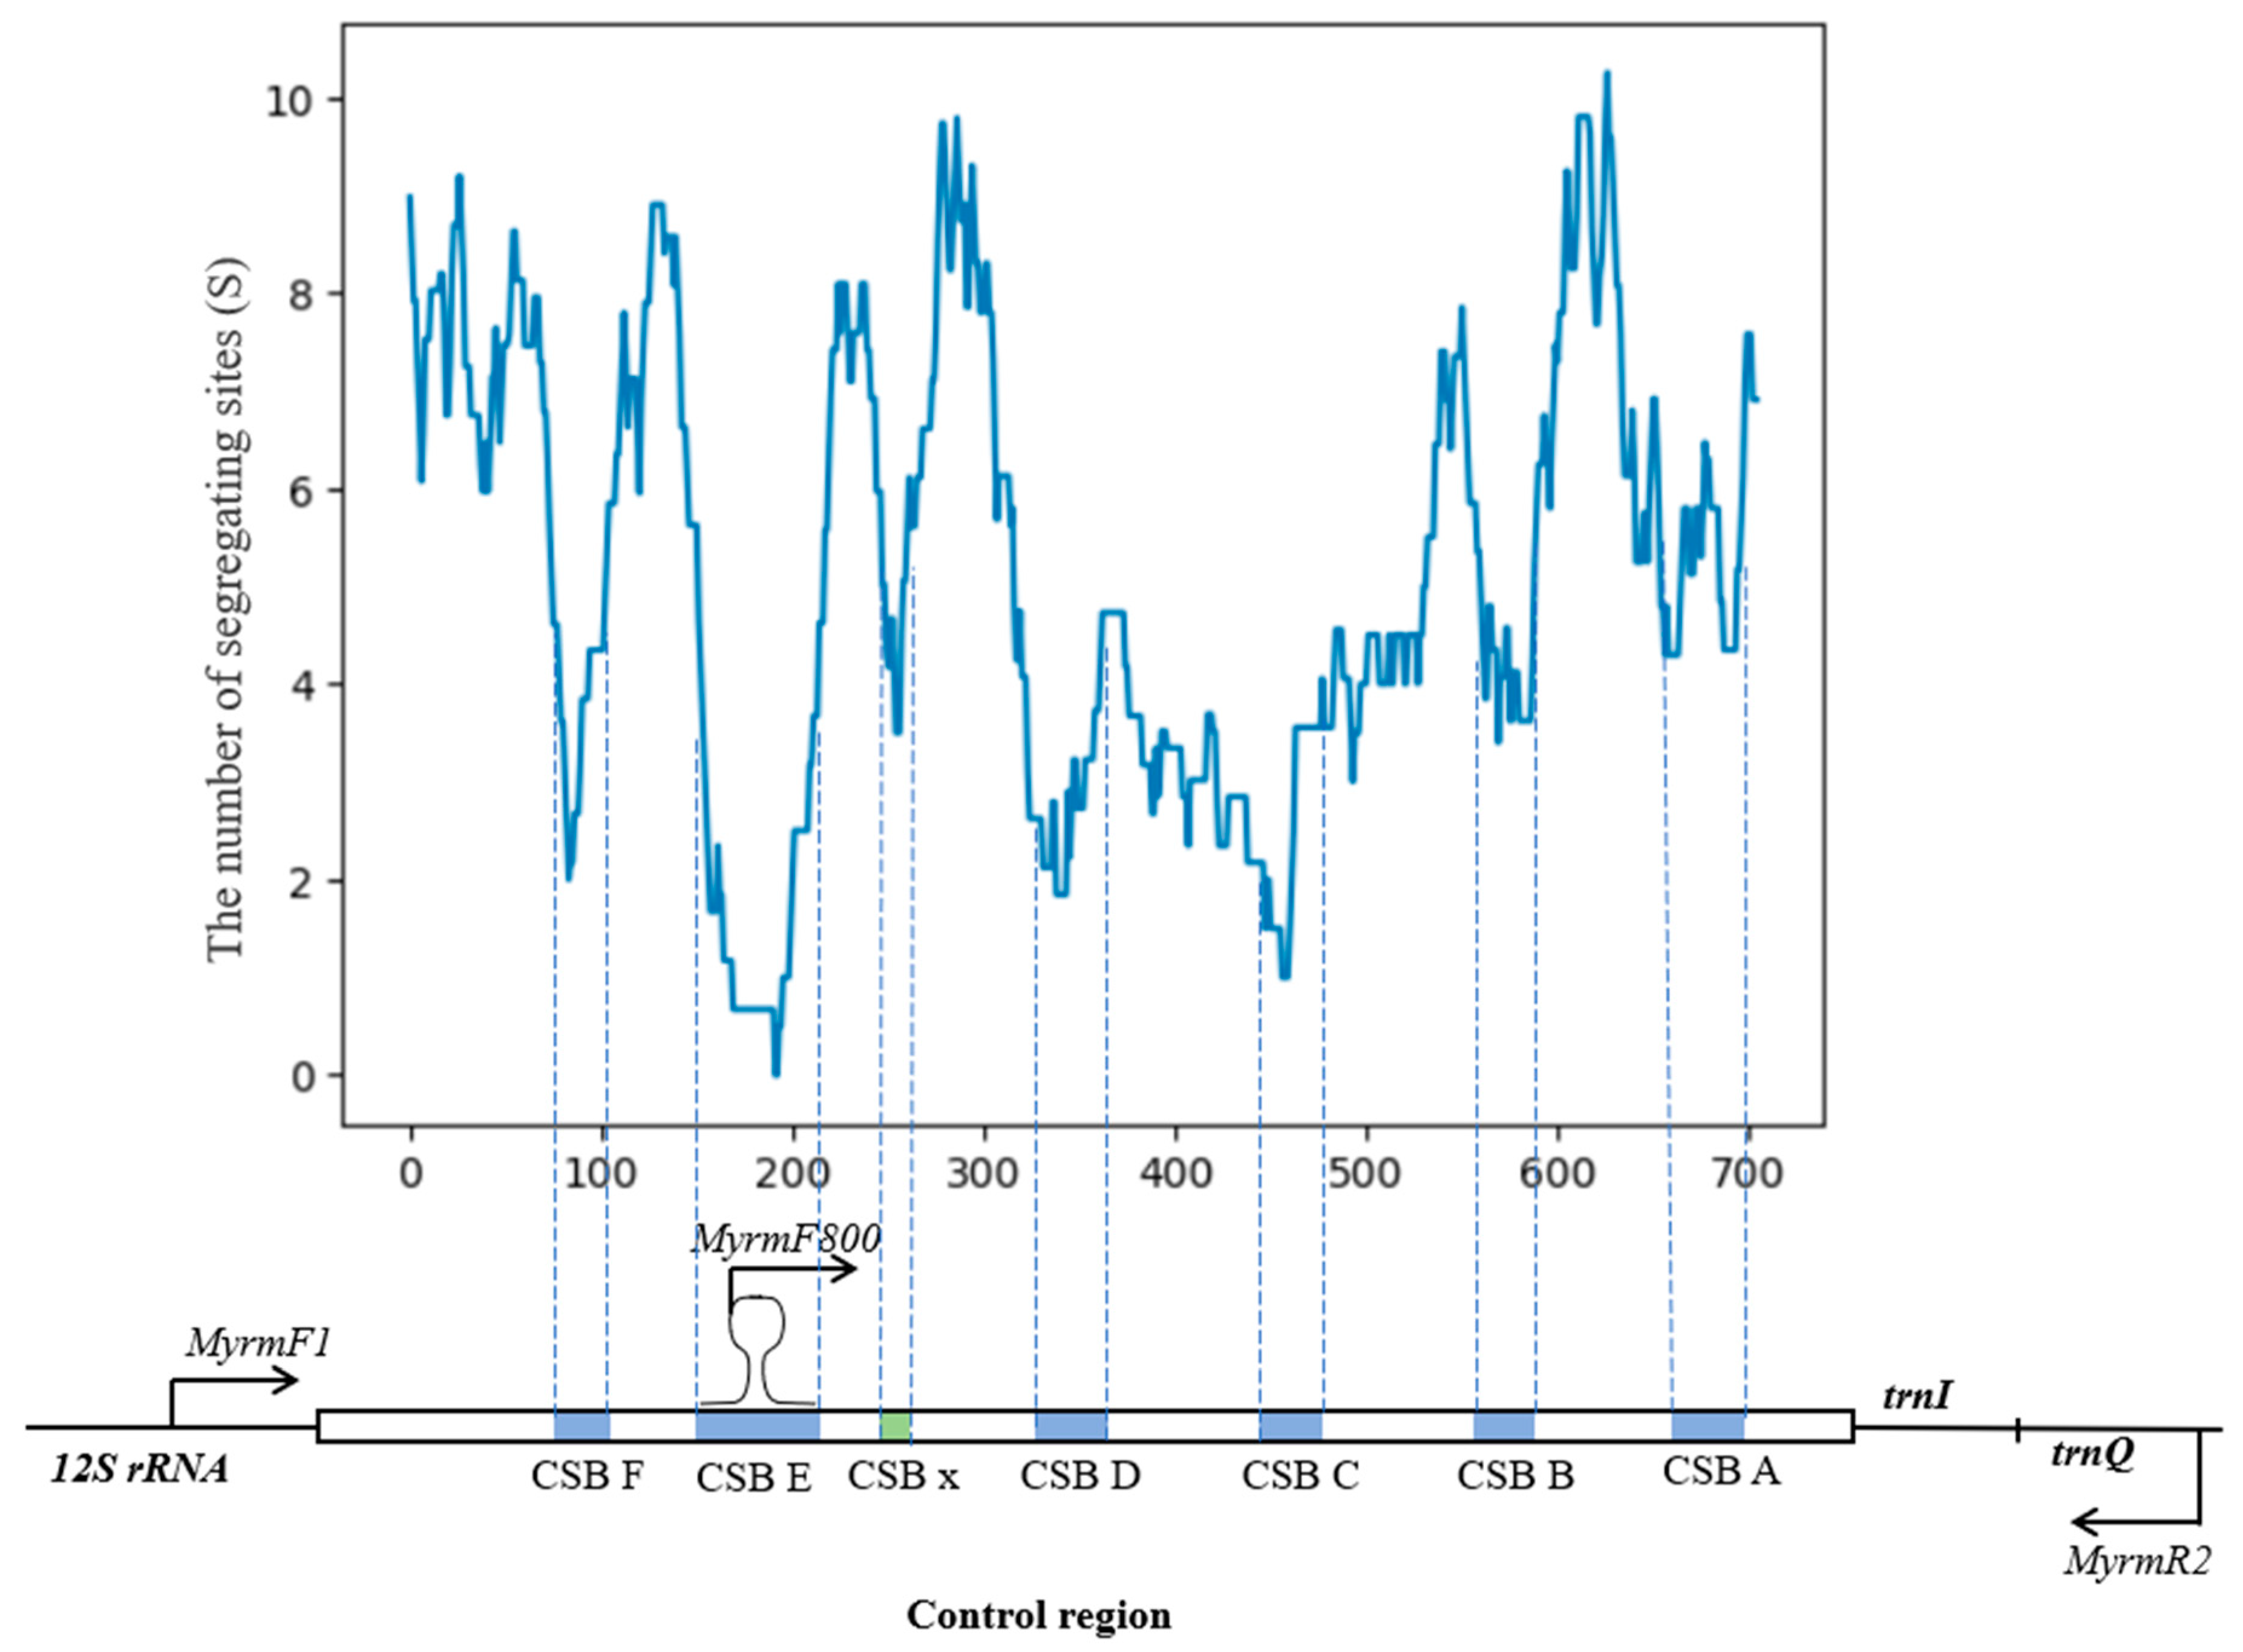
2.3. Sliding Window Analysis

To reveal the conservative sequence blocks (CSBs) of the CR, we conducted a sliding window analysis of the nucleotide sequence variability. An analysis was performed using a custom Python script based on the equation [31] with a window size of 40 bp and a step size of 1 bp. For the analysis, we used the alignment of the full sequences of the CR in four species of different levels of phylogenetic relationships: S. eurasius (PP453567 and PP453568), Myrmeleotettix sp. (MK903595), Pseudochorthippus parallelus (NC056785), and Gomphocerippus rufus (MK903592).

2.4. Phylogenetic Analysis

Sequence alignments and the estimation of sequence variability in the CR were performed using the MEGA11 software [32] using the MUSCLE method. The fragment 637–667 bp long including 152 bp of flanking tRNA genes—trnI and trnQ—was used. In the cases of double peaks caused by the presence of homologous NUMT-derived sequences, we either (1) took the sequences with alternative nucleotide states to analyze if the double peaks did not lead to phylogenetic contradictions, or (2) removed the alternative nucleotide in phylogenetically significant sites if one of the alternative sequences corresponded to a previously identified haplotype, or (3) removed the sequences from the analysis in more complex cases. The degree of divergence within and between the main mitochondrial lineages of Stenobothrini was estimated using a set of unique haplotypes, excluding identical sequences to avoid a decrease in the nucleotide distances between haplotypes. The mean pairwise distances within the groups were estimated for S. eurasius and S. hyalosuperficies, as well as for the entire set of Stenobothrus species. To estimate the degree of divergence between the main mitochondrial lineages, we calculated the mean distances between the groups. The uncorrected p-distances and Tamura’s 3-parameter model distances (T3P) were calculated. Tamura’s 3-parameter model corrects for multiple hits, taking into account the differences in the transitional and transversional rates and G+C-content bias. It also assumes an equality of the substitution rates among sites [33]. The mean values of the distances are presented as percentages. To estimate the distances at different levels of divergence, we added two distant taxa, G. rufus (MK903592) and Euchorthippus unicolor (MK113716).
To estimate the nucleotide diversity (π) within and between S. eurasius and S. hyalosuperficies, we used all the samples studied, including identical haplotypes (S. eurasius from the Altai mountains—23 samples, S. eurasius from the contact zone—9 samples, S. hyalosuperficies from Kazakhstan—8 samples, and S. hyalosuperficies from the contact zone—11 samples) (Supplementary Materials Table S1). The analysis was conducted using MEGA11 software [32]. The following parameters were used: π, the value of the nucleotide diversity, is the average pairwise difference between all the possible pairs of the individuals in the samples; πS, the mean value of the nucleotide diversity within the groups, is calculated using the equation 12.72 [34]; πT, the mean nucleotide diversity of the entire sample, is calculated using the equation 12.73 [34]; δST, the mean interpopulation nucleotide diversity, is estimated as δST = πT − πS; and NST, the coefficient of differentiation, is estimated as NST = δSTT. The standard errors were computed by the bootstrap method. All the values are multiplied by 100.
The phylogenetic trees were reconstructed using the maximum likelihood (ML) method within the phangorn 2.11.1 package (R software 4.2.1). The model of nucleotide evolution was chosen using the “modeltest” function based on the smallest BIC (Bayesian Information Criterion; [35]). The HKY + G(4) + I model was used for the COI reconstruction and TVM + G(4) was used for the CR reconstruction. The bootstrap values were calculated to assess the topology support.
The maximum parsimony (MP) networks of the mitochondrial haplotypes based on the CR sequences were reconstructed in the PopART 1.7 software using the MJN (median joining network) algorithm. If one or several sequences had an ambiguous nucleotide in the parsimony informative position, we changed it to an unambiguous one according to the consensus sequences. Thus, this position was taken into account by the PopART program.

2.5. Distribution Map

To illustrate the distribution of the Stenobothrus species, we made a map based on our data [10,12,16], the available literature data [7,36,37,38,39,40,41], and the open databases (GBIF.org, Inaturalist.org, and the Orthoptera species file). Unfortunately, the distribution data on many species is incomplete. While the ranges of widespread species, such as S. lineatus and S. nigromaculatus, are well studied in Europe, their ranges in Asia are almost unknown. Also, S. carbonarius is suggested to be a problematic species: despite its wide range (from the south-eastern part of European Russia to Mongolia), findings of this species are very rare. In such difficult cases, we focused on the boundaries of the natural climatic zones [42]. We also show the maximum distribution ranges taking into account a smaller or patchy distribution nowadays because of the biotope disturbance, anthropogenic influences, and climate changes.

3. Results

3.1. The Control Region Structure

The CR of S. eurasius is located between the 12S rRNA (rrnS) and tRNAile (trnI) genes (Figure 1), as in most Orthoptera species. The length of the CR in S. eurasius is 728 bp. It consists of 84.6% A and T nucleotides and does not contain VNTRs. On the border with the trnI gene, there is a long polythymine stretch (T-stretch), polymorphic in length and varying from 7 to 11 bp in different species of the genus Stenobothrus. There is another T-stretch found at a distance of 35 bp from the first T-stretch, which is flanked by two purines and is conservative in length (8 bp). To identify CSBs, a sliding window analysis of the nucleotide sequence variability was applied to the alignment of three sequences of the Stenobothrini species (S. eurasius and Myrmeleotettix sp.) and two sequences of the more distant species (P. parallelus and G. rufus). The segregating sites are distributed heterogeneously along the region-forming areas with higher density, which alternate with conservative blocks. There are six areas with a low level of polymorphism, which correspond to six CSBs in Orthoptera [43]. There is also a weakly expressed CSB (CSB x) situated between CSB E and CSB D (Figure 1).

3.2. Phylogenetic Reconstructions and Substitution Rates of the Control Region and the COI Gene

To study the phylogenetic relationships of the tribe Stenobothrini based on mtDNA data, we obtained the sequences of the CR of 14 species including 8 species of the Stenobothrus genus and one sequence of C. pullus (Gomphocerini) as the outgroup. The total number of samples collected in nature is 70. In addition, sequences from the NCBI nucleotide database (Supplementary Materials Table S1) were added to the analysis. The fragment of 691 bp length (full alignment) includes a partial sequence of the CR from CSB E to the T-stretch (about 535 bp) and two tRNA genes (trnI and trnQ) (about 152 bp). The degrees of divergence within and between the main mitochondrial lineages calculated as the mean pairwise distances (p-distance) and Tamura three-parameter (T3P) model distances are shown in Table 1. The values range from 4.89% to 5.34% (p-distance) and from 5.13% to 5.63% (T3P) between Stenobothrus and three clades formed by two sister genera, Myrmeleotettix and Omocestus. These values correspond to the values obtained by the COI gene analysis: from 5.18% to 6.91% (p-distance) and from 5.41% to 7.26% (T3P). A comparison of more distant taxa with Stenobothrus shows that genetic distances increase from 9.00% (between Stenobothrus and C. pullus) to 18.48% (between Stenobothrus and Euchorthippus). At the same time, the distance values for the COI gene are significantly lower (Table 1).
To estimate the substitution rate of the CR and to compare it to the substitution rate of the COI gene, we excluded the tRNA genes from the studied fragment. The distance values of the CR + tRNA genes are slightly lower than that of the CR per se (Table 1). The substitution rates of the CR and COI gene are similar at the level of the Stenobothrus and two sister genera comparison. The rate ratios (k) vary in the range of 0.91–1.22. However, the rate ratio increases to 1.83 (between Stenobothrus and G. rufus) with an increase in the degree of divergence. This indicates that the substitution rate of the COI gene decreases regardless of the linked marker. An independent decrease in the apparent substitution rate of the COI gene with an increase in the divergence degree could be associated with a gradual saturation resulting from multiple substitutions at the same site (homoplasy).
The degree of divergence between haplotypes of the Stenobothrus species (Table 2) corresponds to the intraspecific level for S. eurasius and S. hyalosuperficies (1.03 ± 0.30 for the CR and 1.29 ± 0.28 for the COI gene). Assuming the divergence rate of 3.54% My−1 for the COI gene [44], the divergence time of the Stenobothrus mt-haplogroup varies from 291 ± 85 ka (CR) to 364 ± 79 ka (COI gene).
To evaluate the resolution capability of the CR as a marker on the level of the Stenobothrini tribe, we compared the topology of the phylogenetic trees based on the CR (Figure 2) and the COI gene (Figure 3). The general topology was found to be the same by the COI gene and the CR reconstructions. We use P. parallelus and C. pullus as outgroups. The haplotypes of both species occupy the outgroup position, but the order of their branching is not clear. We suggest that the haplotype of C. pullus is closer to the Stenobothrini tribe than the haplotype of P. parallelus, as is shown by the mean p-distances (Table 1).
The first clade of both trees combines the species of Omocestus, the S. stigmaticus group (S. stigmaticus and S. festivus), and the species of Myrmeleotettix, which corresponds to the previous data [11,17]. Based on the combination of the COI gene and the CR data, five species of Omocestus comprise a well-supported monophyletic clade (bootstrap values 97 and 100). Only one species of Omocestus, O. minutus, is clustered with M. antennatus within the COI reconstruction. The latter reconstruction also shows the S. stigmaticus group to be a sister group to the Myrmeleotettix cluster. The most significant difference between the reconstructions is the topology of M. palpalis. According to the COI reconstruction, this species forms a sister group to the Stenobothrus cluster, while the CR ML reconstruction suggests monophyly of the Myrmeleotettix genus. At the same time, the bootstrap supports of the COI topology of the targeted nodes are higher than within the CR reconstruction.
The main haplogroup (bootstrap values 91 and 92) of both reconstructions included the most Stenobothrus species: 8 species of the CR reconstruction and 11 species of the COI reconstruction. This clade has a “star-like” topology and a few clades could only be selected. S. fischeri is the only distinguishable species within both trees. The other sequences comprise the group without well-supported clustering (“basal Stenobothrus haplogroup”). Some of the S. nigromaculatus COI sequences are clustered together and form a poorly supported “S. nigromaculatus clade”, but some sequences of other species (S. lineatus and S. cotticus) are also nested within this clade. The CR sequences of the S. newskii and S. miramae are clustered together with the low support.
To study the intra- and interspecific variability in S. eurasius and S. hyalosuperficies, we analyzed the CR of 23 samples of S. eurasius from four localities of allopatric populations (Altai), 8 samples of S. hyalosuperficies from allopatric populations (Kazakhstan), and 11 samples of S. hyalosuperficies and 15 samples of S. eurasius from the contact zone (see Supplementary Materials Table S1). Most samples of the allopatric S. eurasius have their own pattern of synapomorphies, consisting of four parsimony informative substitutions (226 A→T; 238 C→T; 428 C→T; and 464 C→T), and are clustered separately from S. hyalosuperficies and S. eurasius from the contact zone. The mt-haplotypes of the allopatric and sympatric S. hyalosuperficies, as well as of S. eurasius from the contact zone, belong to the basal haplogroup of the Stenobothrus genus. The values of nucleotide diversity within the groups (π) for the allopatric and sympatric S. eurasius are 0.17 ± 0.078 and 0.32 ± 0.12, respectively (Table 3), with the mean value of 0.25 ± 0.072 (πS). However, the mean nucleotide diversity of the entire sample of S. eurasius is 0.45 ± 0.13 (πT). Thus, the mean interpopulation nucleotide diversity (δST = 0.21 ± 0.1) and that one within the population diversity make an almost equal contribution to the nucleotide diversity of S. eurasius. The coefficient of differentiation (NST) of the allopatric and sympatric populations, which is the proportion (%) of interpopulational diversity [34], is 45.7 ± 15.6. Thus, the populations are well differentiated. Differentiation between the allopatric and sympatric S. hyalosuperficies is absent or very low, because the NST does not significantly differ from zero. A comparison of the nucleotide diversity of S. eurasius from the contact zone with the diversity of S. hyalosuperficies indicates very low differentiation (Table 3). Thus, the results show that although the allopatric populations of S. eurasius and S. hyalosuperficies are well differentiated, there is almost no differentiation between the sympatric populations of these two species. The relationship of the S. eurasius haplotypes from the contact zone to S. hyalosuperficies indicates a possible asymmetric hybridization between these two species and introgression of the S. hyalosuperficies mtDNA into the S. eurasius gene pool. One of the samples of S. hyalosuperficies (PP239184) from the contact zone still had the haplotype of the Altai S. eurasius, while several samples of S. eurasius from Altai (PP239140, PP239144, PP239145, and PP239154) had the CR haplotype typical for S. hyalosuperficies.

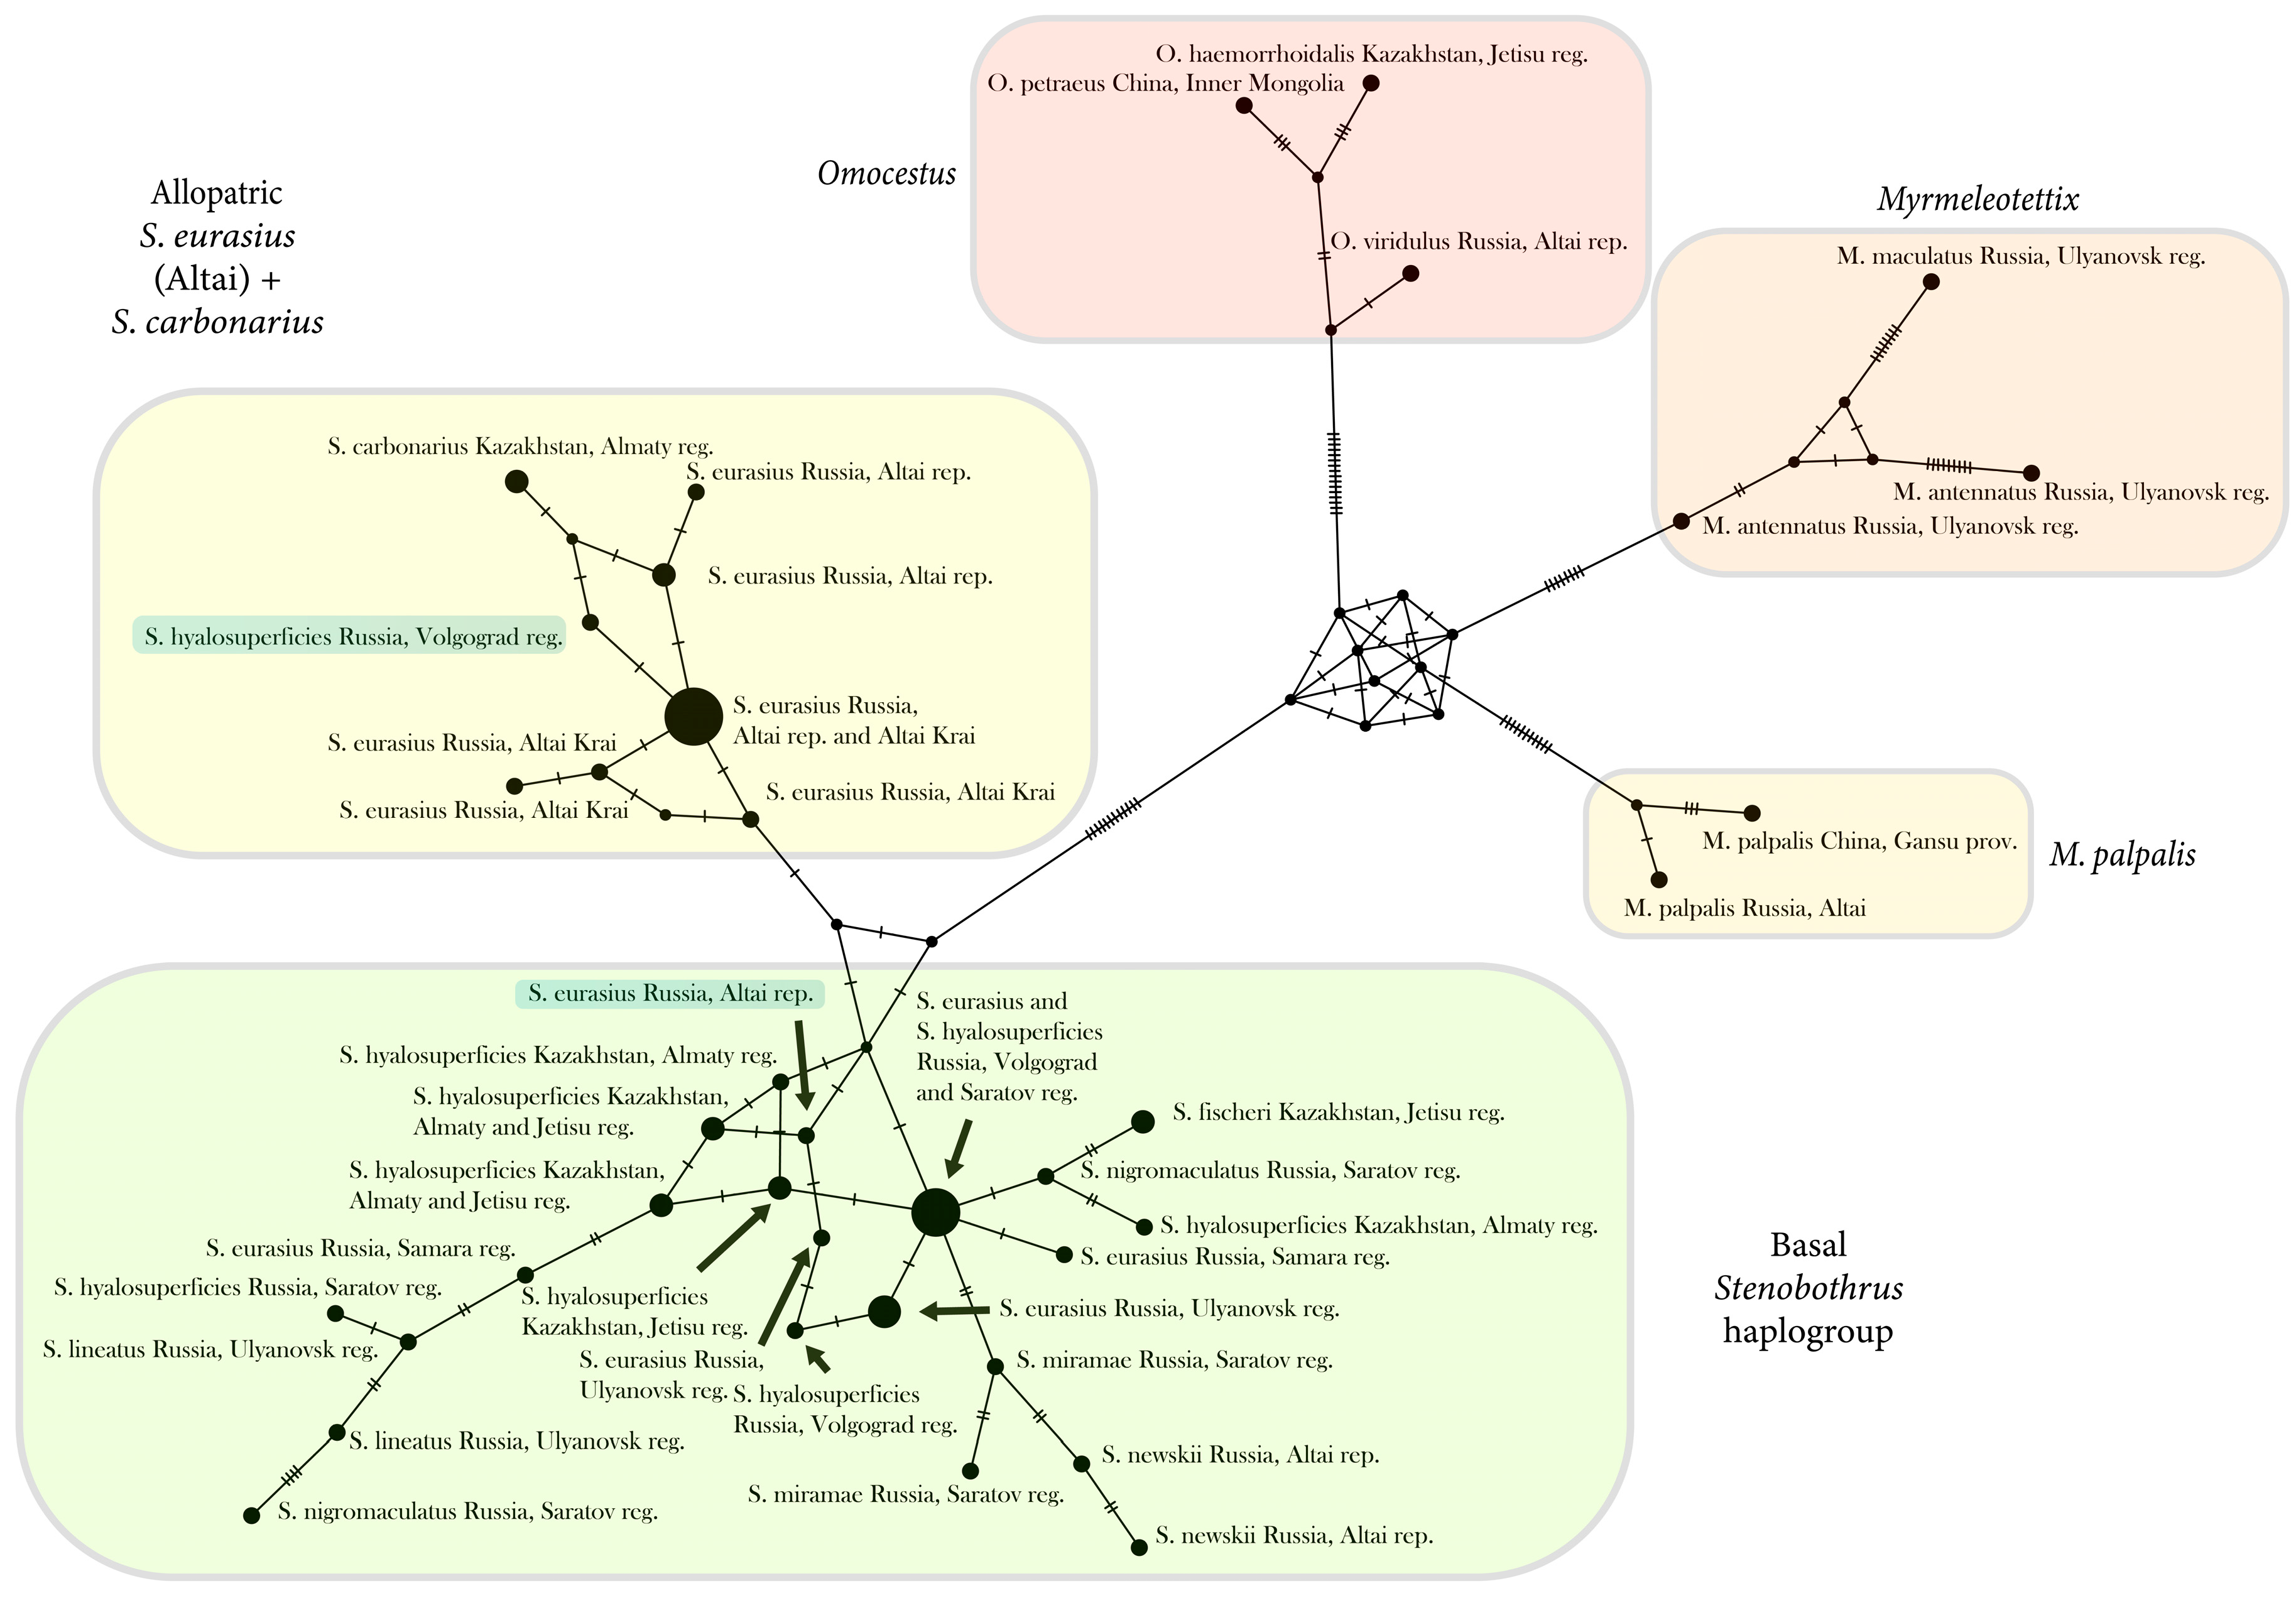
3.3. The Network Based on the Control Region

To demonstrate in detail the relationships and clustering of the mtDNA haplotypes, we obtained the MP network using PopART software and the MJN algorithm with modified alignment used for an ML analysis (Figure 4). The Stenobothrini tribe is divided into four haplogroups. The OmocestusMyrmeleotettix clade is separated from the Stenobothrus clade by 12 phylogenetically significant substitutions. The branching order in the OmocestusMyrmeleotettix clade is unclear because of the presence of several homoplasies. It is subdivided into three haplogroups. The first one, the Omocestus haplogroup, is separated by 14 phylogenetically significant substitutions. The second one, the M. maculatus and M. antennatus haplogroup, is supported by eight substitutions. The M. palpalis haplogroup is supported by 11 substitutions.
The Stenobothrus haplotypes form a separate clade divided into two haplogroups. A “basal Stenobothrus haplogroup” was found to be common for all species. Almost all the samples of S. hyalosuperficies (except for one sample) from the allopatric populations and the contact zone and all the samples of S. eurasius from the contact zone were found to belong to this haplogroup. S. nigromaculatus and S. lineatus also fall into this clade but do not cluster together. The sequences of the endemic species S. newskii (samples from the Altai mountains) and S. fischeri (samples from Kazakhstan) are clustered together.
A set of the S. eurasius samples from the Altai mountains were found to form the unique haplogroup. One of the S. hyalosuperficies samples from the contact zone (PP239184) also belongs to this haplogroup. Surprisingly, the haplotypes of S. carbonarius from Kazakhstan are more closely related to the Altaic S. eurasius haplogroup than to other Stenobothrus species.

4. Discussion

4.1. Structure and Evolutionary Rate of the mtDNA Control Region

Sequences of the CR for the genus Stenobothrus have not been previously published. The structure and localization of the Stenobothrus CR are consistent with those previously described for other Orthoptera [43,45,46]. There are six conservative structural elements: CSB A with a T-stretch on the tRnaI border, CSB B, CSB C (TA(A)n-like), CSB D, CSB E (a stem and loop structure), and CSB F (a G+A-rich sequence block). The origin of replication of the major strand is associated with the T-stretch [45,47]. The origin of replication of the minor strand is presumably located in the region of the stem and loop structure (CSB E). It has been shown that the sequence GAA(A)nT flanking the loop structure (in Stenobothrus n = 2) is also present in the region of the replication origin of the L-strand in mammals [45,48]. It is also known that the RNA primer for L-strand replication starts to be synthesized on the open part of the loop structure of the template L-strand, when the DNA polymerase replicating the H-strand passes through the loop structure [49]. In invertebrates, this occurs when the first chain is almost 100% synthesized. Other CSBs may be also involved in the replication–transcription regulation or in the mtDNA binding to the mitochondrion inner membrane.
Of particular interest is the divergence rate of the CR in comparison with the substitution rate of other mitochondrial regions. As a rule, 2.3% of sequence divergence per 1 million years is taken as an average substitution rate for mtDNA [50]. This rate is confirmed by the study of the mtDNA evolution of darkling beetles (Coleoptera: Tenebrionidae) using the well-established biogeographic barriers to calibrate the molecular clock [44]. However, there are significant differences between different parts of mtDNA regions. The substitution rate corresponds to 3.54% for the COI gene and to 1.06% for 16S rRNA in darkling beetles [44] and to 4.22% for the CytB gene in tiger beetles [51]. The substitution rate of the CR is significantly higher than the rate of other mtDNA regions in Drosophila [26] and vertebrates [52], with significant heterogeneity among the regions and among the sites. Our data show that the substitution rates of the CR and of the COI gene are similar at the level of comparison of Stenobothrus-Myrmeleotettix-Omocestus genera (k = 0.91–1.22). But the substitution rate of the CR increases compared to the COI gene rate at the split level of Stenobothrus and C. pullus and of more distantly related outgroup species. The substitution rate could be variable at different levels of evolution, but the evolutionary rates of two linked markers should change in a correlated manner and the rate ratio (k) should remain constant. The increase in the rate ratio to 1.83 indicates the decrease in the apparent substitution rate of the COI gene regardless of the CR rate. One of the reasons could be the genetic saturation effect caused by multiple substitutions at the same site (homoplasy), which leads to underestimation of the evolutionary rate and, subsequently, to overestimation of the divergence time. We suppose that the genetic saturation affected the divergence rate of the CR at deeper levels of phylogeny than the rate of the COI gene. We also suggest that the CR reflects the time of divergence at the level of the subfamily Gomphocerinae more accurately than the COI gene.

4.2. Phylogenetic Relationships and Taxonomy within the Tribe Stenobothrini

The reconstructions based on both markers (Figure 2 and Figure 3) and the network based on the CR (Figure 4) were shown to have a similar topology. The tribe Stenobothrini appeared to divide into four groups: (1) the Omocestus genus, (2) the controversial clade of the species (M. maculatus, M. antennatus, M. pallidus, S. stigmaticus, S. festivus, and O. minutus) from all three genera, (3) the clade of M. palpalis, and (4) the Stenobothrus genus. All three genera of Stenobothrini were found to be paraphyletic. Our results mainly support the previous phylogenetic studies of Gomphocerinae [11,17,18,53]. However, all the studies confirm the monophyly of five species of Omocestus (O. viridulus, O. rufipes, O. haemorrhoidalis, O. Petraeus, and O. panteli) and most species of Stenobothrus except for the S. stigmaticus group.
At the same time, the topology of the two clades including the Myrmeleotettix species is debatable. We suggest that the S. stigmaticus group is closer to Myrmeleotettix than to Stenobothrus, and O. minutus is closer to Myrmeleotettix than to other species of Omocestus, which is also supported by previous studies [11,17,53]. One of the characteristic morphological features in the species of the Myrmeleotettix genus are the club-shape antennae tips, which distinguishes them from the species of the genera Stenobothrus and Omocestus [36]. However, the clustering of some species of Omocestus or Stenobothrus with the Myrmeleotettix species and paraphyly of the Myrmeleotettix genus indicate the parallel and independent evolution of the club-shape antennae. The club-shape antennae are usually used during the courtship visual display (e.g., [12,54]). Within the genus Myrmeleotettix, the antennae in M. palpalis are the least thickened at the ends, which is probably correlated with very weak antennae movements during courtship [55]. According to the phylogeny based on the COI gene, M. palpalis forms a separate monophyletic clade sister to the Stenobothrus genus (Figure 3). The phylogeny reconstruction based on the CR places M. palpalis together with other species of this genus but with rather low bootstrap supports (Figure 2). Thus, we suggest the mtDNA lineage of M. palpalis to be the most distantly related to other Myrmeleotettix species.
We revealed a very complicated structure of the Stenobothrus clade. According to the mtDNA data, there is almost no subdivision into taxa within the Stenobothrus genus. Only some species (such as S. fischeri or S. newskii) are distinguished by mtDNA markers. Other haplotypes do not form species-specific clades showing a star-like topology, and haplotypes of the same mitochondrial lineage can be found in different species (Figure 2, Figure 3 and Figure 4). The genus-specific degree of divergence corresponds to the intraspecific level. It is likely that a common ancestor of the Stenobothrus genus shared one mitochondrial haplogroup that evolved in the Pleistocene (1.9–0.6 mya). This haplogroup gave a recent and very fast rise to a complex of the modern Stenobothrus species. Thus, the modern species have already been fully formed but the mitochondrial gene pool has not yet split. This is an example of the maximum degree of incomplete lineage sorting. We suggest that the genus Stenobothrus appears to represent an unusual evolutionary model, showing a later stage of speciation than most other species. At the same time, an absence of clustering by species within the genus Stenobothrus resembles the complexity of the C. biguttulus group [18,56]. The main mitochondrial lineages of the C. biguttulus group diversified about 506 ka, within the mid-Pleistocene. The nominal species are paraphyletic, which indicates the rapid radiation, incomplete lineage sorting, and/or the extensive gene flow. It is remarkable that most species within the C. biguttulus group are also widespread and lack morphological apomorphies but can be easily distinguished by songs.
The two species, S. eurasius and S. hyalosuperficies, are suggested to be very closely related [10]. We, therefore, expected to find relatively low genetic distances between them. At the same time, we assumed that the resolution capacity of the CR as a phylogenetic marker would be sufficient to detect the differentiation between these species in allopatric localities. Our expectations were partially confirmed: allopatric populations of S. eurasius from Altai and Europe [41] form their own mt-haplogroup, whereas allopatric populations of S. hyalosuperficies fall into the basal haplogroup of Stenobothrus. This indicates that the CR haplotypes of S. hyalosuperficies have more in common with the more distant Stenobothrus species than with the closely related S. eurasius. In the contact zone, S. eurasius has mt-haplotypes shared with S. hyalosuperficies, which might indicate an introgression of mtDNA from S. hyalosuperficies to the S. eurasius gene pool. This is in good agreement with our preliminary behavioral experiments with the playback of the songs, in which the S. hyalosuperficies females showed a reduced selectivity and high responsiveness to the S. eurasius songs [16].
The two species used as the outgroups, P. parallelus and C. pullus, have special places in the genealogy of the Gomphocerini tribe because of the nuclear–mitochondrial discordance. Pseudochorthippus parallelus appears to be closer to Stenobothrini than to Gomphocerini according to the mtDNA data [11,17,18,53], whereas the nuclear markers place these species into the Gomphocerini tribe [18]. Chorthippus pullus shows a similar discordance [57]. At the same time, the degrees of divergence of the mitochondrial markers between Stenobothrus and C. pullus or P. parallelus are lower than between Stenobothrus and G. rufus (Table 1). Thus, the latter species undoubtedly belongs to the tribe Gomphocerini (e.g., [17,18]), whereas the assignment of C. pullus and P. parallelus to this tribe is debatable.
At the same time, certain limitations should be considered when interpreting our data obtained from the two mtDNA markers. These results reflect the evolution of taxa along only the maternal lineage. However, many studies show that nuclear genes provide a tree topology different from that based on mitochondrial genes (e.g., [18,19]). Moreover, even traditional multigene studies have limited effectiveness in grasshoppers due to the large genome sizes, the abundance of mitochondrial pseudogenes, and mitochondrial haplotype sharing [12,20,28,56,57]. We expect that high-throughput methods such as double-digest restriction site-associated DNA sequencing (ddRADseq) would yield much more information and increase the resolution of the genetic data in this family (e.g., [57]).
Another approach to the study of fast evolution could be an analysis of the genes involved in the adaptations and directional changes in the behavioral and morphological characters. For example, a population genomic scan in three species of the C. biguttulus group showed several genes that may be involved in song production and hearing as well as genes involved in other traits, such as food preferences and metabolism [58]. It was also shown in Drosophila that the genes tartan and Sox21b underlie the differences in male genitalia [59,60]. In mosquitoes, STAT genes play an important role in immunity. Some species of Anopheles were shown to have a retro-duplicated copy of the STAT gene (STAT-B). The greater amino acid divergence in STAT-B might be indicative of an adaptive evolution, particularly in comparison to the ancestral STAT-A gene [61].

4.3. Phylogeography of the Genus Stenobothrus and Possible Scenarios of the Origin of S. eurasius and S. hyalosuperficies

The distribution of the Stenobothrus species covers the territory from the Iberian Peninsula to Mongolia and China (Figure 5). Among these species, one can distinguish those with large ranges, such as S. nigromaculatus, S. fischeri, and S. lineatus. Other species distribute over smaller areas: S. rubicundulus and S. miramae occur in Europe, and S. carbonarius inhabit Asia but are very patchy. In the mountains (the Alps, the Carpathians, the Balkan Mountains, the Caucasus, northern Tien Shan, and the Altai), there are many endemic species, such as S. cotticus, S. clavatus, S. sviridenkoi, S. newskii, and others.
S. eurasius can be attributed to the widespread species, because its range spreads from eastern Europe and the Balkans to Transbaikalia (Figure 5). There are several subspecies of S. eurasius in the Balkans and Anatolia. Moreover, the song analysis revealed that S. eurasius eurasius, S. euraisus bohemicus, and S. eurasius clavicornis could be the same species and S. eurasius macedonicus and S. croaticus could represent another species [33]. However, they were not revised taxonomically. The range of S. hyalosuperficies is smaller than that of S. eurasius, spreading from the south-eastern part of European Russia to Kyrgyzstan and north-western China. In the south-eastern part of European Russia (Saratov, Samara, and the Orenburg region) and in Kazakhstan, the southern border of the range of S. eurasius overlaps with the northern border of the range of S. hyalosuperficies, forming the contact zone.
One can distinguish the two areas of maximal diversity of the Stenobothrus species. In one area that covers the Balkans, Anatolia, and the Caucasus, there are more than 13 species. In another area that includes the mountains of Kazakhstan, Middle Asia, and Altai, there are more than 10 species. We do not show several endemic species on the map (Figure 5), which are poorly studied and were not sequenced. In both areas, the numerous glacial refugia were suggested by various authors [62,63,64,65,66].
According to the analysis of the mt-haplotypes, almost all the species of the genus Stenobothrus studied share one common haplogroup with almost no fixed differences between the species. We suggest all these species diverged recently and have a limited number of dispersal waves from a common refugium, either in the Balkan–Anatolian region or Central Asia. The divergence time estimates of this genus vary from 0.6 mya [18] to 1.9 mya [17]. We, however, estimate this divergence time as 200–300 ka, which might correspond to two–three glacial–interglacial cycles [67]. It was suggested by Hewitt (1996) [68] that the rates of evolution can be expected to differ between the northern and southern parts of a refugium. The edge northern population extended its range northward during each interglacial period and contracted its range southward during each glacial period. In the southern parts of a refugium, by contrast, the habitats contracted, forcing the isolation of populations to more restricted higher altitudes during the warmer interglacial periods. During the following glacial periods, the range of meadows expanded, and the southern populations increased. According to Hewitt (1996 and 2000) [68,69], the lower genetic diversity would be expected in the north as compared with the south of a refugium. However, glaciations are suggested to be about 10 times longer than interglacials (e.g., [65]). Thus, the southern populations could be in contact during each glacial cycle much longer than in isolation at higher altitudes during each interglacial cycle. This could explain the common mt-haplotype in many Stenobothrus species, among which one can find either species with large ranges or endemics in the mountains. The mountain endemics seemed to have not had enough time to form separate mt-haplogroups.
The group of S. eurasius is of special interest. The European and Altai populations share one haplotype, which is different from the basic mt-haplogroup of the Stenobothrus genus. Notably, among the European populations, only the most northern ones were analyzed [41], which are suggested to represent the nominate subspecies of S. eurasius [10]. Unfortunately, the south-European populations represented by S. eurasius macedonicus, S. eurasius clavicornis, and S. croaticus were not genetically studied. Nevertheless, taking into account the diversity of this group in the Balkans, we suggest that the ancestor of these populations could occur in a separate refugium (e.g., the Balkans) from that of the basic haplogroup. By contrast, S. hyalosuperficies very likely occupies the ancestral range (e.g., Kazakhstan), where a common ancestor of at least five species of the Stenobothrus genus occurred. Thus, our hypothesis that S. hyalosuperficies diverged later than S. eurasius is not supported. The hypothesis of mutual monophyly is partly supported, because only the European and Altai populations of S. eurasius form a separate cluster on the phylogenetic trees (Figure 2, Figure 3 and Figure 4). It is likely that the edge northern population of the Balkan refugium experienced a few periods of population decline and the subsequent expansion, which was accompanied by the formation of the separate mt-haplogroups. We did not obtain a distinct polyphyletic structure of the phylogenetic trees, but nevertheless, one of the S. eurasius specimens from Altai (PP239154, Figure 4) had the S. hyalosuperficies haplotype. Therefore, we cannot exclude the ancestral polymorphism by which the two species could share a common gene pool.

Supplementary Materials

The following supporting information can be downloaded at: https://www.mdpi.com/article/10.3390/insects15080592/s1, Table S1: List of the Gomphocerinae species and NCBI nucleotide/BOLD accession numbers of sequences used in phylogenetic analysis [70,71,72,73,74,75,76,77,78,79].

Author Contributions

S.S. conceived the idea; V.V. organized the sampling expeditions, and everybody collected the samples; S.S., N.S., and T.T. performed the molecular genetic lab work; N.S. and S.S. carried out the molecular genetic analysis; S.S., N.S., and T.T. prepared the tables and figures; S.S. and N.S. wrote substantial parts of the manuscript; V.V. led the writing and provided comments and ideas on the manuscript. All authors have read and agreed to the published version of the manuscript.

Funding

This research was funded by the Russian Science Foundation (grant 23-24-00533).

Data Availability Statement

All the sequences obtained from this study were deposited in NCBI GenBank under the accession numbers PP239129-PP239198 and PP453567-PP453568 for the CR and PP177426-PP177427, PP177431-PP177435, and PP190403-PP190408 for the COI gene.

Acknowledgments

We are grateful to Oliver Hawlitschek (Department of Evolutionary Biology and Environmental Studies, Universität Zürich) and Evgenia Kovalyova (Institute for Information Transmission Problems, Moscow) for their help with sample collection. We also thank the Core Centrum of the Institute of Developmental Biology RAS for the equipment provided for the molecular studies. We are grateful to Alexey Kulikov (Koltzov Institute of Developmental Biology) for helpful discussions and to the reviewers (Oliver Hawlitschek and the anonymous reviewer) for their invaluable comments on the manuscript.

Conflicts of Interest

The authors declare no conflicts of interest.

References

  1. Dobzhansky, T. Genetics and the Origin of Species, 1st ed.; Columbia University Press: New York, NY, USA, 1937. [Google Scholar]
  2. Mayr, E. Populations, Species, and Evolution; Belknap Press: Cambridge, MA, USA, 1970; 453p. [Google Scholar]
  3. Coyne, J.A.; Orr, H.A. A catalogue and critique of species concepts. In Speciation; Oxford University Press: Oxford, UK, 2004; pp. 272–292. [Google Scholar]
  4. West–Eberhard, M.J. Sexual selection, social competition, and speciation. Q. Rev. Biol. 1983, 58, 155–183. [Google Scholar] [CrossRef]
  5. Andersson, M. Sexual Selection; Princeton University Press: Princeton, NJ, USA, 1994; Volume 72. [Google Scholar]
  6. Panhuis, T.M.; Butlin, R.; Zuk, M.; Tregenza, T. Sexual selection and speciation. Trends Ecol. Evol. 2001, 16, 364–371. [Google Scholar] [CrossRef] [PubMed]
  7. Ragge, D.R.; Reynolds, W.J. The Songs of the Grasshoppers and Crickets of Western Europe; Harley Books, Natural History Museum: London, UK, 1998; 591p. [Google Scholar]
  8. Bukhvalova, M.A. Acoustic signals and morphological features of some grasshoppers of the Chorthippus biguttulus group (Orthoptera, Acrididae) of Russia and adjacent territories. Entomol. Rev. 1995, 74, 56–67. [Google Scholar]
  9. Vedenina, V.Y.; von Helversen, O. A re–examination of the taxonomy of the Chorthippus albomarginatus group in Europe on the basis of song and morphology (Orthoptera: Acrididae). Tijdschr. Voor Entomol. 2009, 152, 65–97. [Google Scholar] [CrossRef]
  10. Tarasova, T.A.; Sevastianov, N.S.; Vedenina, V.Y. Songs and morphology in grasshoppers of the Stenobothrus eurasius group (Orthoptera: Acrdidae: Gomphocerinae) from Russia and adjacent countries: Clarifying of taxonomic status. Zootaxa 2021, 4965, 244–260. [Google Scholar] [CrossRef] [PubMed]
  11. Vedenina, V.; Mugue, N. Speciation in gomphocerine grasshoppers: Molecular phylogeny versus bioacoustics and courtship behavior. J. Orthoptera Res. 2011, 20, 109–125. [Google Scholar] [CrossRef]
  12. Vedenina, V.Y.; Sevastianov, N.S.; Tarasova, T.A. Contributions to the study of the grasshopper (Orthoptera: Acrididae: Gomphocerinae) courtship songs from Kazakhstan and adjacent territories. Zootaxa 2020, 4895, 505–527. [Google Scholar] [CrossRef] [PubMed]
  13. Bridle, J.R.; Butlin, R.K. Mating signal variation and bimodality in a mosaic hybrid zone between Chorthippus grasshopper species. Evolution. 2002, 56, 1184–1198. [Google Scholar] [CrossRef]
  14. Vedenina, V.Y.; von Helversen, O. Complex courtship in a bimodal grasshopper hybrid zone. Behav. Ecol. Sociobiol. 2003, 54, 44–54. [Google Scholar] [CrossRef]
  15. Vedenina, V.Y.; Sradnick, J.; Klopfel, A.; Elsner, N. A narrow hybrid zone between the grasshoppers Stenobothrus clavatus and Stenobothrus rubicundus: Courtship song analysis. Biol. J. Linn. Soc. 2012, 107, 383–397. [Google Scholar] [CrossRef]
  16. Tarasova, T.; Sevastianov, N.; Vedenina, V. The processes in the hybrid zone between sibling grasshopper species of the Stenobothrus eurasius group (Acrididae, Gomphocerinae). In Proceedings of the Invertebrate Sound and Vibration Conference, Lincoln, UK, 30 March–2 April 2023; p. 29. [Google Scholar]
  17. Sevastianov, N.; Neretina, T.; Vedenina, V. Evolution of calling songs in the grasshopper subfamily Gomphocerinae (Orthoptera, Acrididae). Zool. Scr. 2023, 52, 154–175. [Google Scholar] [CrossRef]
  18. Hawlitschek, O.; Ortiz, E.M.; Noori, S.; Webster, K.C.; Husemann, M.; Pereira, R.J. Transcriptomic data reveals nuclear-mitochondrial discordance in Gomphocerinae grasshoppers (Insecta: Orthoptera: Acrididae). Mol. Phylogen. Evol. 2022, 170, 107439. [Google Scholar] [CrossRef] [PubMed]
  19. Huang, J.P.; Hill, J.G.; Ortego, J.; Knowles, L.L. Paraphyletic species no more –genomic data resolve a Pleistocene radiation and validate morphological species of the Melanoplus scudderi complex (Insecta: Orthoptera). Syst. Entomol. 2020, 45, 594–605. [Google Scholar] [CrossRef]
  20. Hawlitschek, O.; Morinière, J.; Lehmann, G.U.C.; Lehmann, A.W.; Kropf, M.; Dunz, A.; Glaw, F.; Detcharoen, M.; Schmidt, S.; Hausmann, A.; et al. DNA barcoding of crickets, katydids and grasshoppers (Orthoptera) from Central Europe with focus on Austria, Germany and Switzerland. Mol. Ecol. Res. 2017, 17, 1037–1053. [Google Scholar] [CrossRef] [PubMed]
  21. Gaugel, S.M.; Hawlitschek, O.; Dey, L.S.; Husemann, M. Evolution of mitogenomic gene order in Orthoptera. Insect Mol. Biol. 2023, 32, 387–399. [Google Scholar] [CrossRef] [PubMed]
  22. Xu, H.; Mao, B.; Storozhenko, S.Y.; Huang, Y.; Chen, Z.; Huang, J. Phylogenetic position of the genus Alulacris (Orthoptera: Acrididae: Melanoplinae: Podismini) revealed by complete mitogenome evidence. Insects 2021, 12, 918. [Google Scholar] [CrossRef] [PubMed]
  23. Chang, H.; Qiu, Z.; Yuan, H.; Wang, X.; Li, X.; Sun, H.; Guo, X.; Lu, Y.; Feng, X.; Majid, M.; et al. Evolutionary rates of and selective constraints on the mitochondrial genomes of Orthoptera insects with different wing types. Mol. Phylogen. Evol. 2020, 145, 106734. [Google Scholar] [CrossRef] [PubMed]
  24. Wang, L.; Chen, J.; Xue, X.; Qin, G.; Gao, Y.; Li, K.; Zhang, Y.; Li, X.J. Comparative analysis of mitogenomes among three species of grasshoppers (Orthoptera: Acridoidea: Gomphocerinae) and their phylogenetic implications. PeerJ 2023, 11, e16550. [Google Scholar] [CrossRef] [PubMed]
  25. Lewis, D.L.; Farr, C.L.; Farquhar, A.L.; Kaguni, L.S. Sequence, organization, and evolution of the A+T region of Drosophila melanogaster mitochondrial DNA. Mol. Biol. Evol. 1994, 11, 523–538. [Google Scholar] [CrossRef]
  26. Brehm, A.; Harris, D.J.; Hernández, M.; Cabrera, V.M.; Larruga, J.M.; Pinto, F.M.; González, A.M. Structure and evolution of the mitochondrial DNA complete control region in the Drosophila subobscura subgroup. Insect Mol. Biol. 2001, 10, 573–578. [Google Scholar] [CrossRef]
  27. Ma, Y.; Miao, Y. Mitogenomic comparison of the mole crickets Gryllotalpidae with the phylogenetic implications (Orthoptera: Ensifera). Insects 2022, 13, 919. [Google Scholar] [CrossRef]
  28. Pereira, R.J.; Ruiz-Ruano, F.J.; Thomas, C.J.; Pérez-Ruiz, M.; Jiménez-Bartolomé, M.; Liu, S.; de la Torre, J.; Bella, J.L. Mind the numt: Finding informative mitochondrial markers in a giant grasshopper genome. J. Zool. Syst. Evol. Res. 2021, 59, 635–645. [Google Scholar] [CrossRef]
  29. Tsuji, J.; Frith, M.C.; Tomii, K.; Horton, P. Mammalian NUMT insertion is non-random. Nucleic Acids Res. 2012, 40, 9073–9088. [Google Scholar] [CrossRef] [PubMed]
  30. Folmer, O.; Black, M.; Hoeh, W.; Lutz, R.; Vrijenkoek, R. DNA primers for amplification of mitochondrial cytochrome c oxidase subunit I from diverse metazoan invertebrates. Mol. Mar. Biol. Biotechnol. 1994, 3, 294–299. [Google Scholar]
  31. Proutski, V.; Holmes, E. SWAN: Sliding window analysis of nucleotide sequence variability. Bioinformatics 1998, 14, 467–468. [Google Scholar] [CrossRef]
  32. Tamura, K.; Stecher, G.; Kumar, S. MEGA11: Molecular Evolutionary Genetics Analysis Version 11. Mol. Biol. Evol. 2021, 38, 7–3022. [Google Scholar] [CrossRef]
  33. Tamura, K. Estimation of the number of nucleotide substitutions when there are strong transition-transversion and G+C-content biases. Mol. Biol. Evol. 1992, 9, 678–687. [Google Scholar] [CrossRef]
  34. Nei, M.; Kumar, S. Molecular Evolution and Phylogenetics; Oxford University Press: Oxford, UK, 2000. [Google Scholar]
  35. Schwarz, G. The bayesian information criterion. Ann. Stat. 1978, 6, 461–464. [Google Scholar]
  36. Bey-Bienko, G.Y.; Mistshenko, L.L. Locusts and Grasshoppers of the USSR and Adjacent Countries; Part II; Academy of Sciences of USSR Publisher: Moscow-Leningrad, Russia, 1951; pp. 1–287. (In Russian) [Google Scholar]
  37. Latchininsky, A.V.; Sergeev, M.G.; Childebaev, M.K.; Chernjakhovsky, M.E.; Lockwood, J.A.; Kambulin, V.E.; Gapparov, F.A. Grasshoppers of Kazakhstan, Middle Asia and Adjacent Territories; Association for Applied Acridology International, University of Wyoming: Laramie, WY, USA, 2002; 387p. (In Russian) [Google Scholar]
  38. Berger, D. The Evolution of Complex Courtship Songs in the Genus Stenobothrus Fischer, 1853 (Orthoptera, Caelifera, Gomphocerinae). Ph.D. Thesis, Friedrich-Alexander-Universität Erlangen, Erlangen, Germany, 2008; 169p. [Google Scholar]
  39. Berger, D.; Chobanov, D.P.; Mayer, F. Interglacial refugia and range shifts of the alpine grasshopper Stenobothrus cotticus (Orthoptera: Acrididae: Gomphocerinae). Org. Divers. Evol. 2010, 10, 123–133. [Google Scholar] [CrossRef]
  40. Gantigmaa, C.; Myagmar, G. Orthopteroid Insects in Mongolia; Mongolian Academy of Sciences: Ulaanbaatar, Mongolia, 2022; 564p. (In Mongolian) [Google Scholar]
  41. Kenyeres, Z.; Bauer, N.; Kociński, M.; Grzywacz, B. Genetic and morphological differences among relict marginal occurrences of Stenobothrus eurasius (Orthoptera). Arthropod Syst. Phylogen. 2024, 82, 503–514. [Google Scholar] [CrossRef]
  42. Sergeev, M.G. Distribution Patterns of Grasshoppers and Their Kin over the Eurasian Steppes. Insects 2021, 12, 77. [Google Scholar] [CrossRef] [PubMed]
  43. Zhao, L.; Zheng, Z.M.; Huang, Y.; Zhou, Z.J.; Wang, L. Comparative analysis of the mitochondrial control region in Orthoptera. Zool. Stud. 2011, 50, 385–393. [Google Scholar]
  44. Papadopoulou, A.; Anastasiou, I.; Vogler, A.P. Revisiting the insect mitochondrial molecular clock: The mid-Aegean trench calibration. Mol. Biol. Evol. 2010, 27, 1659–1672. [Google Scholar] [CrossRef] [PubMed]
  45. Zhang, D.X.; Szymura, J.M.; Hewitt, G.M. Evolution and structural conservation of the control region of insect mitochondrial DNA. J. Mol. Evol. 1995, 40, 382–391. [Google Scholar] [CrossRef] [PubMed]
  46. Zhongying, Q.; Huihui, C.; Hao, Y.; Yuan, H.; Huimeng, L.; Xia, L.; Xingchun, G. Comparative mitochondrial genomes of four species of Sinopodisma and phylogenetic implications (Orthoptera, Melanoplinae). ZooKeys 2020, 969, 23. [Google Scholar] [CrossRef]
  47. Saito, S.; Tamura, K.; Aotsuka, T. Replication origin of mitochondrial DNA in insects. Genetics 2005, 171, 1695–1705. [Google Scholar] [CrossRef] [PubMed]
  48. Wolstenholme, D.R. Animal mitochondrial DNA: Structure and evolution. Intern. Rev. Cyt. 1992, 141, 173–216. [Google Scholar] [CrossRef]
  49. Zinovkina, L.A. DNA replication in human mitochondria. Biochemistry 2019, 84, 884–895. [Google Scholar] [CrossRef] [PubMed]
  50. Brower, A.V. Rapid morphological radiation and convergence among races of the butterfly Heliconius erato inferred from patterns of mitochondrial DNA evolution. Proc. Nat. Acad. Sci. USA 1994, 91, 6491–6495. [Google Scholar] [CrossRef]
  51. Pons, J.; Vogler, A.P. Complex pattern of coalescence and fast evolution of a mitochondrial rRNA pseudogene in a recent radiation of tiger beetles. Mol. Biol. Evol. 2005, 22, 991–1000. [Google Scholar] [CrossRef]
  52. Avise, J.C.; Walker, D.E. Pleistocene phylogeographic effects on avian populations and the speciation process. Proc. R. Soc. Lond. Ser. B 1998, 265, 457–463. [Google Scholar] [CrossRef] [PubMed]
  53. Nattier, R.; Robillard, T.; Amedegnato, C.; Couloux, A.; Cruaud, C.; Desutter–Grandcolas, L. Evolution of acoustic communication in the Gomphocerinae (Orthoptera: Caelifera: Acrididae). Zool. Scr. 2011, 40, 479–497. [Google Scholar] [CrossRef]
  54. Berger, D.; Gottsberger, B. Analysis of the courtship of Myrmeleotettix antennatus (Fieber, 1853) –With general remarks on multimodal courtship behavior in gomphocerine grasshoppers. Articulata 2010, 25, 1–21. [Google Scholar]
  55. Vedenina, V.; Sevastianov, N.; Kovalyova, E. New data on bioacoustics and courtship behaviour in grasshoppers (Orthoptera, Acrididae, Gomphocerinae) from Russia and adjacent countries. ZooKeys 2024, 1200, 1–26. [Google Scholar] [CrossRef] [PubMed]
  56. Nolen, Z.J.; Yildirim, B.; Irisarri, I.; Liu, S.; Groot Crego, C.; Amby, D.B.; Mayer, F.; Gilbert, M.T.P.; Pereira, R.J. Historical isolation facilitates species radiation by sexual selection: Insights from Chorthippus grasshoppers. Mol. Ecol. 2020, 29, 4985–5002. [Google Scholar] [CrossRef] [PubMed]
  57. Schmidt, R.; Dufresnes, C.; Krištín, A.; Künzel, S.; Vences, M.; Hawlitschek, O. Phylogenetic insights into Central European Chorthippus and Pseudochorthippus (Orthoptera: Acrididae) species using ddRADseq data. Mol. Phylogen. Evol. 2024, 193, 108012. [Google Scholar] [CrossRef] [PubMed]
  58. Berdan, E.L.; Mazzoni, C.J.; Waurick, I.; Roehr, J.T.; Mayer, F. A population genomic scan in Chorthippus grasshoppers unveils previously unknown phenotypic divergence. Mol. Ecol. 2015, 24, 3918–3930. [Google Scholar] [CrossRef] [PubMed]
  59. Hagen, J.F.D.; Mendes, C.C.; Blogg, A.; Payne, A.; Tanaka, K.M.; Gaspar, P.; Jimenez, J.F.; Kittelmann, M.; McGregor, A.P.; Nunes, M.D.S. Tartan underlies the evolution of Drosophila male genital morphology. Proc. Natl. Acad. Sci. USA 2019, 116, 19025–19030. [Google Scholar] [CrossRef] [PubMed]
  60. Ridgway, A.M.; Hood, E.J.; Jimenez, J.F.; Nunes, M.D.S.; McGregor, A.P. Sox21b underlies the rapid diversification of a novel male genital structure between Drosophila species. Current Biology 2024, 34, 1114–1121. [Google Scholar] [CrossRef]
  61. Gupta, K.; Dhawan, R.; Kajla, M.; Misra, T.; Kumar, S.; Gupta, L. The evolutionary divergence of STAT transcription factor in different Anopheles species. Gene 2017, 596, 89–97. [Google Scholar] [CrossRef]
  62. Horsák, M.; Chytrý, M.; Hájková, P.; Hájek, M.; Danihelka, J.; Horsáková, V.; Horsáková, V.; Ermakov, N.; German, D.A.; Kočí, M.; et al. European glacial relict snails and plants: Environmental context of their modern refugial occurrence in southern Siberia. Boreas 2015, 44, 638–657. [Google Scholar] [CrossRef]
  63. Kühne, G.; Kosuch, J.; Hochkirch, A.; Schmitt, T. Extra-Mediterranean glacial refugia in a Mediterranean faunal element: The phylogeography of the chalk-hill blue Polyommatus coridon (Lepidoptera, Lycaenidae). Sci. Rep. 2017, 7, 43533. [Google Scholar] [CrossRef]
  64. Pavelková Řičánková, V.; Robovský, J.; Riegert, J. Ecological structure of recent and last glacial mammalian faunas in northern Eurasia: The case of Altai-Sayan refugium. PLoS ONE. 2014, 9, e85056. [Google Scholar] [CrossRef]
  65. Stewart, J.R.; Lister, A.M.; Barnes, I.; Dalén, L. Refugia revisited: Individualistic responses of species in space and time. Proc. R. Soc. B Biol. Sci. 2010, 277, 661–671. [Google Scholar] [CrossRef]
  66. Zhang, Y.J.; Stöck, M.; Zhang, P.; Wang, X.L.; Zhou, H.; Qu, L.H. Phylogeography of a widespread terrestrial vertebrate in a barely-studied Palearctic region: Green toads (Bufo viridis subgroup) indicate glacial refugia in Eastern Central Asia. Genetica 2008, 134, 353–365. [Google Scholar] [CrossRef]
  67. Barth, A.M.; Clark, P.U.; Bill, N.S.; He, F.; Pisias, N.G. Climate evolution across the Mid-Brunhes transition. Clim. Past. 2018, 14, 2071–2087. [Google Scholar] [CrossRef]
  68. Hewitt, G.M. Some genetic consequences of ice ages, and their role in divergence and speciation. Biol. J. Linn. Soc. 1996, 58, 247–276. [Google Scholar] [CrossRef]
  69. Hewitt, G. The genetic legacy of the Quaternary ice ages. Nature 2000, 405, 907–913. [Google Scholar] [CrossRef] [PubMed]
  70. Qiu, Z.; Zhang, X.; Cui, Y.; Liu, L.; Wang, X.; Gou, X. Characterization of the complete mitochondrial genome of Euchorthippus unicolor (Orthoptera: Arcypteridae). Mitochondrial DNA Part. B 2019, 4, 846–847. [Google Scholar] [CrossRef]
  71. Chapco, W.; Contreras, D. Subfamilies Acridinae, Gomphocerinae and Oedipodinae are “fuzzy sets”: A proposal for a common African origin. J. Orthoptera Res. 2011, 20, 173–190. [Google Scholar] [CrossRef]
  72. Laiolo, P.; Illera, J.C.; Obeso, J.R. Local climate determines intra-and interspecific variation in sexual size dimorphism in mountain grasshopper communities. J. Evol. Biol. 2013, 26, 2171–2183. [Google Scholar] [CrossRef] [PubMed]
  73. Sirin, D.; Taylan, M.S.; Bircan, R.; Akyildiz, G.; Can, L. Phylogenetic and phylogeographic analysis of Myrmeleotettix maculatus (Orthoptera: Acrididae: Gomphocerinae) species group in Anatolia. Zootaxa 2021, 4949, 149–162. [Google Scholar] [CrossRef] [PubMed]
  74. Huang, J.; Zhang, A.; Mao, S.; Huang, Y. DNA barcoding and species boundary delimitation of selected species of Chinese Acridoidea (Orthoptera: Caelifera). PLoS ONE 2013, 8, e82400. [Google Scholar] [CrossRef] [PubMed]
  75. Contreras, D.; Chapco, W. Molecular phylogenetic evidence for multiple dispersal events in gomphocerine grasshoppers. J. Orthoptera Res. 2006, 15, 91–98. [Google Scholar] [CrossRef]
  76. Laiolo, P.; Pato, J.; Illera, J.C.; Obeso, J.R. Selection for functional performance in the evolution of cuticle hardening mechanisms in insects. Evolution 2021, 75, 1132–1142. [Google Scholar] [CrossRef]
  77. Bugrov, A.; Novikova, O.; Mayorov, V.; Adkison, L.; Blinov, A. Molecular phylogeny of Palaearctic genera of Gomphocerinae grasshoppers (Orthoptera, Acrididae). Syst. Entomol. 2006, 31, 362–368. [Google Scholar] [CrossRef]
  78. Zhao, L.; Zhan, L.; Li, Q.; Ren, J. DNA barcoding of nymph grasshoppers from Xinjiang. Xinjiang Agric. Sci. 2015, 52, 785. (In Chinese) [Google Scholar]
  79. Song, H.; Béthoux, O.; Shin, S.; Donath, A.; Letsch, H.; Liu, S.; McKenna, D.D.; Meng, G.; Misof, B.; Podsiadlowski, L.; et al. Phylogenomic analysis sheds light on the evolutionary pathways towards acoustic communication in Orthoptera. Nat. Commun. 2020, 11, 4939. [Google Scholar] [CrossRef]
Figure 1. A sliding window analysis of the complete control region on the basis of the sequence alignment in four species of different levels of phylogenetic relationships (Stenobothrus eurasius, Myrmeleotettix sp., Pseudochorthippus parallelus, and Gomphocerippus rufus). The variability plot indicates the number of segregating sites (Ss) in alignment in a window size of 40 bp, with a step size of 1 bp. Blue blocks—the conservative sequence blocks (CSBs) described for Orthoptera [43], green block—the additional CSB x, and black arrows—the primers used for the analysis.
Insects 15 00592 g001
Figure 2. A phylogenetic reconstruction inferred from the maximum likelihood analysis based on the control region (691 bp) of the mtDNA in the Stenobothrini species. Bootstrap values higher than 50 are shown. The monophyletic taxa and other supported clades are marked by color and legends. The scale below the tree indicates the distance.
Insects 15 00592 g002
Figure 3. A phylogenetic reconstruction inferred from the maximum likelihood analysis based on the cytochrome oxidase (617 bp) sequences of the mtDNA in the Stenobothrini species. Bootstrap values higher than 50 are shown. The monophyletic taxa and other supported clades are marked by color and legends. The scale below the tree indicates the distance.
Insects 15 00592 g003
Figure 4. The haplotype network based on the mtDNA control region (691 bp) of the Stenobothrini species. The size of the circles indicates the number of samples with the given haplotype, and the marks on the branches of the network indicate the number of substitutions. The main clades distinguished in this network are marked by color. The OmocestusMyrmeleotettix clade is separated from the Stenobothrus clade by 12 phylogenetically significant substitutions. The Stenobothrus clade is divided into two haplogroups separated by a few substitutions. The OmocestusMyrmeleotettix clade is subdivided into three haplogroups separated by 8–14 phylogenetically significant substitutions.
Insects 15 00592 g004
Figure 5. The map of the approximate distribution of the Stenobothrus species based on the literature and our own data. We distinguish the species with large ranges (S. nigromaculatus, S. fischeri, S. lineatus, and S. eurasius), those that distribute over smaller areas (S. rubicundulus, S. miramae, S. carbonarius, and S. hyalosuperficies), and endemic species (S. cotticus, S. clavatus, S. sviridenkoi, and S. newskii). The ranges of S. eurasius and S. hyalosuperficies are highlighted by oblique lines.
Insects 15 00592 g005
Table 1. The degree of divergence of the control region and the COI gene between the main mitochondrial lineages of Stenobothrini (Stenobothrus, Omocestus, and Myrmeleotettix) and the sister taxa (Chorthippus pullus, Pseudochorthippus parallelus, Gomphocerippus rufus, and Euchorthippus).
Control RegionCOI Genek CR/COI
HSPISp-Distance ± SET3P (CR + tRNA) ± SET3P (CR)HSPISp-Distance ± SET3P ± SE
Stenobothrus/M. palpalis30/252424.89 ± 0.79 5.13 ± 0.906.58 ± 1.0841/460435.18 ± 0.89 5.41 ± 1.051.22
Stenobothrus/M. maculatus group *30/364435.34 ± 0.785.63 ± 0.877.00 ± 1.1441/983536.59 ± 0.88 7.03 ± 1.071.00
Stenobothrus/
Omocestus
30/358455.03 ± 0.725.26 ± 0.846.61 ± 1.1241/1182576.91 ± 0.947.26± 1.17 0.91
Stenobothrus/C. pullus30/1728.24 ± 1.159.00 ± 1.3811.50 ± 1.6241/1646.35 ± 1.06 6.75 ± 1.111.7
Stenobothrus/P. parallelus30/18811.08 ± 1.2012.43 ± 1.5716.50 ± 2.1141/1708.44 ± 1.14 9.13 ± 1.361.8
Stenobothrus/G. rufus30/19412.56 ± 1.2714.14 ± 1.7017.79 ± 2.1941/1758.94 ± 1.129.68 ± 1.351.83
Stenobothrus/
Euchorthippus
30/111915.88 ± 1.4718.48 ± 1.8622.84 ± 2.6141/19513.23 ± 1.33 14.75 ± 1.651.54
H—the number of haplotypes, S—the number of segregating sites, PIS—parsimony informative sites, p-distance—the uncorrected mean pairwise genetic distance (%), T3P—the Tamura 3-parameter model mean distance (%), and SE—the standard error obtained by the bootstrap procedure (100 replicates). CR+tRNA—the partial sequence of the control region and two tRNA genes (trnI and trnQ), 691 bp; CR—the partial sequence of the control region, 535 bp. * The M. maculatus group includes the M. maculatus, M. antennatus, M. pallidus, and O. minutus sequences of the CR and COI gene.
Table 2. The characteristics of the nucleotide variability in the control region and the COI gene within the genus Stenobothrus.
Control Region COI Gene
HSPISp-Distance ± SET3P (CR + tRNA) ± SET3P (CR)HSPISp-Distance ± SET3P ± SE
S. eurasius121080.59 ± 0.210.60 ± 0.210.79 ± 0.281735141.47 ± 0.331.49 ± 0.28
S. hyalosuperficies81440.74 ± 0.220.74 ± 0.220.99 ± 0.2731101.34 ± 0.421.36 ± 0.43
Stenobothrus3024170.87 ± 0.23 0.88 ± 0.221.03 ± 0.34141221.27 ± 0.251.29 ± 0.28
H—the number of haplotypes, S—the number of segregating sites, PIS—parsimony informative sites, p-distance—the uncorrected mean pairwise genetic distance (%), T3P—the mean pairwise genetic distance using the Tamura 3-parameter model (%), and SE—the standard error obtained by the bootstrap procedure (100 replicates). CR+tRNA—the partial sequence of the control region and two tRNA genes (trnI and trnQ), 691 bp; CR—the partial sequence of the control region, 535 bp.
Table 3. The nucleotide diversity within the groups (π, on the diagonal), the mean nucleotide diversity for the combined dataset (πT, above the diagonal), and the coefficients of differentiation (NST, below the diagonal) of the allopatric and sympatric populations of S. eurasius and S. hyalosuperficies. A fragment including 535 bp of the control region and 152 bp of two tRNA genes (trnI and trnQ) was used.
S. eurasius AltaiS. eurasius Contact ZoneS. hyalosuperficies KazakhstanS. hyalosuperficies Contact ZoneS. hyalosuperficies
S. eurasius Altai0.17 ± 0.080.45 ± 0.130.46 ± 0.16 0.43 ± 0.160.52 ± 0.17
S. eurasius contact zone45.7 ± 15.60.32 ± 0.120.39 ± 0.160.37 ± 0.110.41 ± 0.12
S. hyalosuperficies Kazakhstan45.57 ± 15.6318.24 ± 9.610.32 ± 0.140.428 ± 0.123
S. hyalosuperficies contact zone32.56 ± 12.961.34 ± 3.5813.82 ± 8.770.41 ± 0.13
S. hyalosuperficies42.43 ± 11.698.57 ± 3.580.43 ± 0.12
All values (mean ± standard error) are multiplied by 100. Standard errors were computed by the bootstrap method.
Disclaimer/Publisher’s Note: The statements, opinions and data contained in all publications are solely those of the individual author(s) and contributor(s) and not of MDPI and/or the editor(s). MDPI and/or the editor(s) disclaim responsibility for any injury to people or property resulting from any ideas, methods, instructions or products referred to in the content.

