
A Framework for Identifying Selective Chemical Applications for IPM in Dryland Agriculture


Abstract
:1. Introduction

2. Experimental Section
2.1. Trial Sites
2.2. Chemical Treatments

| Trial Site | Treatment Name | Chemical Trade Name | Active Ingredient(s) | Rate (mL/ha) | Treatment Date(s) | Gaucho® Seed Coating |
|---|---|---|---|---|---|---|
| Inverleigh 2009 | Broad-spectrum * | Talstar and Le-mat | bifenthrin (250 g/L) and omethoate (290 g/L) | 40 and 100 | 02/06/2009 and 24/06/2009 | No |
| Thiamethoxam/abamectin | Columbus | thiamethoxam (72 g/L)/abamectin (36 g/L) | 300 | 24/06/2009 | Yes | |
| Spinosad | GF-1587 | spinosad (100 g/L) | 83.6 | 24/06/2009 | Yes | |
| Weed cover | - | - | - | - | Yes | |
| Imidacloprid | - | - | - | - | Yes | |
| Untreated control | - | - | - | - | No | |
| Rossbridge 2009 | Broad-spectrum * | Talstar and Le-mat | bifenthrin (250 g/L) and omethoate (290 g/L) | 40 and 100 | 04/06/2009 and 16/07/2009 | No |
| Diafenthiuron | Pegasus | diafenthiuron (500 g/L) | 400 | 16/07/2009 | Yes | |
| Paraffinic oil | Canopy | paraffinic oil (792 g/L) | 5000 | 16/07/2009 | Yes | |
| Weed cover | - | - | - | - | Yes | |
| Imidacloprid | - | - | - | - | Yes | |
| Untreated control | - | - | - | - | No | |
| Inverleigh 2010 | Broad-spectrum | Talstar | bifenthrin (250 g/L) | 40 | 22/06/2010 | Yes |
| Thiamethoxam/abamectin | Columbus | thiamethoxam (72 g/L)/abamectin (36 g/L) | 400 | 22/06/2010 | Yes | |
| Dimethoate | Danadim | dimethoate (400 g/L) | 55 | 22/06/2010 | Yes | |
| Weed cover | - | - | - | - | Yes | |
| Imidacloprid | - | - | - | - | Yes | |
| Untreated control | - | - | - | - | No | |
| Rossbridge 2010 | Broad-spectrum | Talstar | bifenthrin (250 g/L) | 40 | 29/06/2010 | Yes |
| Diafenthiuron | Pegasus | diafenthiuron (500 g/L) | 400 | 29/06/2010 | Yes | |
| Thiamethoxam/abamectin | Columbus | thiamethoxam (72 g/L)/abamectin (36 g/L) | 400 | 29/06/2010 | Yes | |
| Weed cover | - | - | - | - | Yes | |
| Imidacloprid | - | - | - | - | Yes | |
| Untreated control | - | - | - | - | No |
2.3. Invertebrate Sampling
2.4. Plant Assessments
2.5. Statistical Analysis
3. Results
3.1. Invertebrates
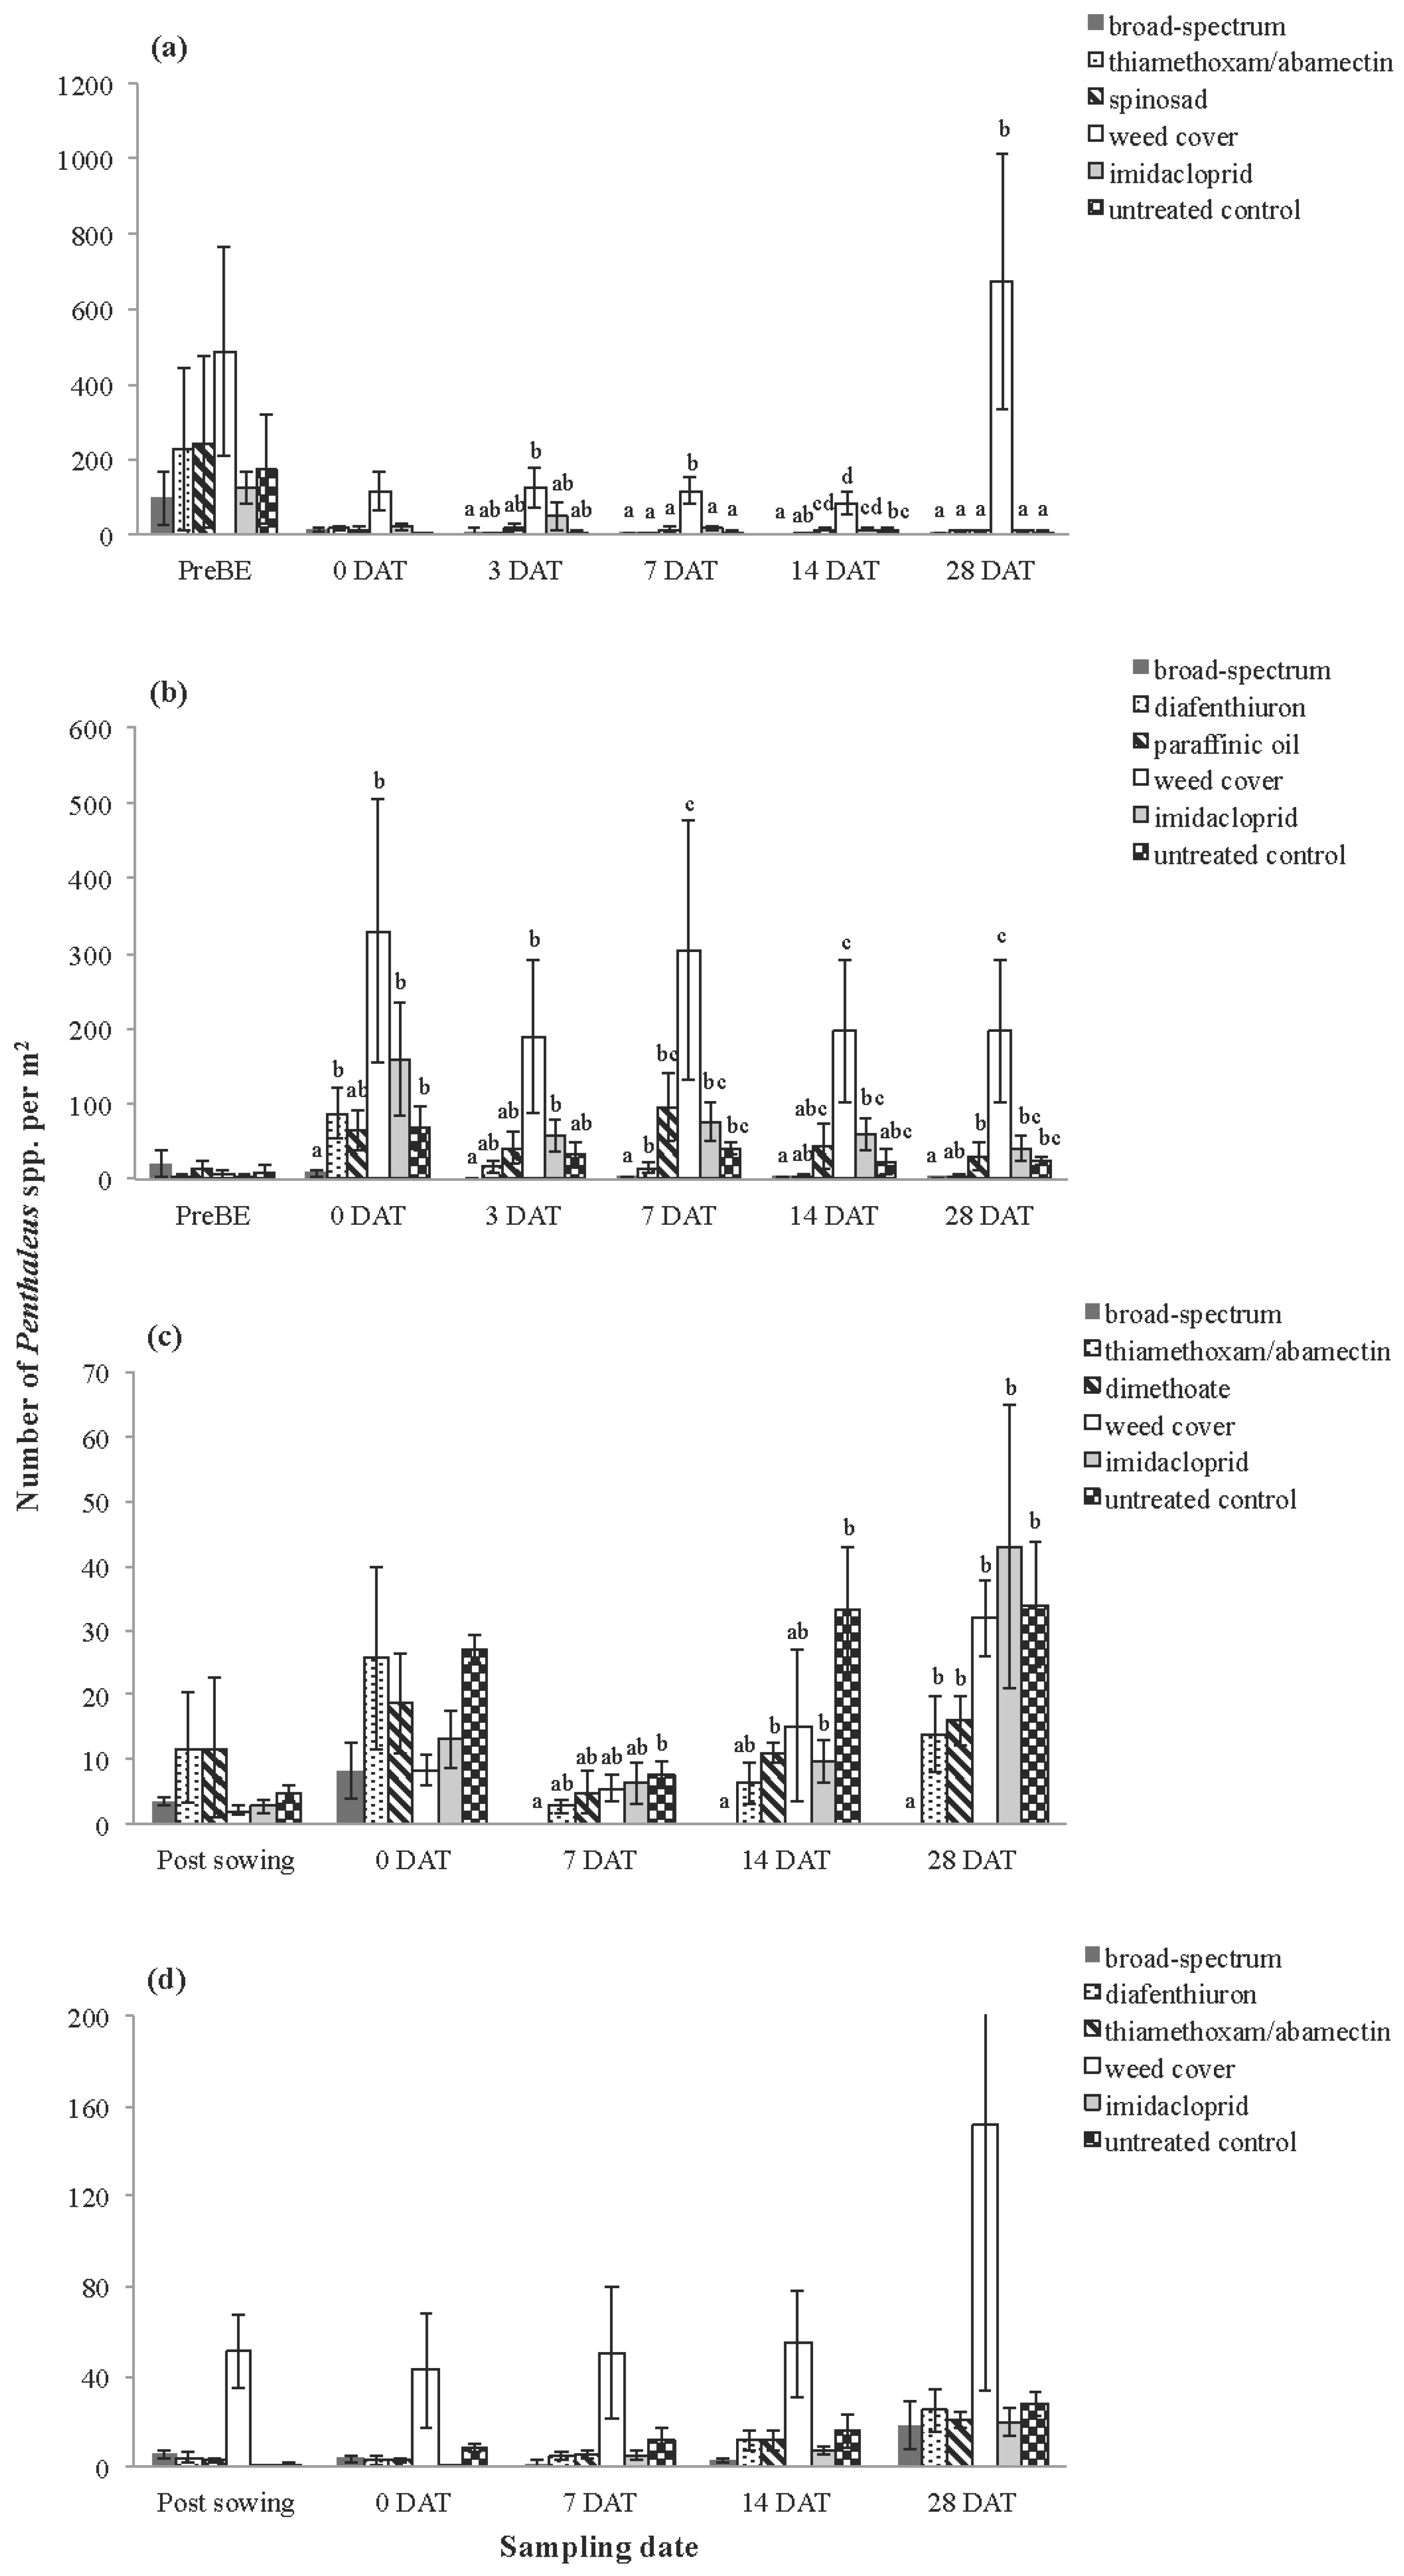
3.1.1. Pest Species
| Trial Site | Functional Group | Sampling Type | df | MS | F-value | p |
|---|---|---|---|---|---|---|
| Inverleigh 2009 | H. destructor | V | 5, 18 | 9.030 | 32.489 | <0.001 |
| Penthaleus spp. | V | 5, 18 | 4.954 | 13.104 | <0.001 | |
| Collembola | V | 5, 18 | 0.009 | 0.181 | 0.966 | |
| Predatory mites | V | 5, 18 | 1.317 | 7.153 | 0.001 | |
| Formicidae | P | 5, 18 | 0.379 | 5.592 | 0.003 | |
| Predatory beetles | P | 5, 18 | 4.035 | 4.313 | 0.009 | |
| Rossbridge 2009 | H. destructor | V | 5, 18 | 2.883 | 2.520 | 0.070 |
| Penthaleus spp. | V | 5, 18 | 8.927 | 9.301 | <0.001 | |
| Collembola | V | 5, 18 | 2.248 | 17.565 | <0.001 | |
| Oribatidae | V | 5, 18 | 2.137 | 1.616 | 0.209 | |
| Predatory mites | V | 5, 18 | 1.536 | 4.613 | 0.008 | |
| Formicidae | P | 5, 18 | 0.400 | 5.425 | 0.003 | |
| Predatory beetles | P | 5, 18 | 4.262 | 5.498 | 0.003 | |
| Inverleigh 2010 | H. destructor | V | 5, 18 | 1.175 | 4.920 | 0.006 |
| Penthaleus spp. | V | 5, 18 | 2.275 | 13.948 | <0.001 | |
| Collembola | V | 5, 18 | 0.682 | 4.503 | 0.009 | |
| Oribatidae | V | 5, 18 | 0.991 | 0.181 | 0.966 | |
| Predatory mites | V | 5, 18 | 0.165 | 0.405 | 0.839 | |
| Formicidae | P | 5, 18 | 0.169 | 2.962 | 0.042 | |
| Predatory beetles | P | 5, 18 | 2.437 | 1.770 | 0.170 | |
| Rossbridge 2010 | H. destructor | V | 5, 18 | 8.347 | 22.831 | <0.001 |
| Penthaleus spp. | V | 5, 18 | 1.123 | 2.324 | 0.088 | |
| Collembola | V | 5, 18 | 0.666 | 26.237 | <0.001 | |
| Oribatidae | V | 5, 18 | 0.316 | 0.627 | 0.681 | |
| Predatory mites | V | 5, 18 | 1.808 | 20.471 | <0.001 | |
| Formicidae | P | 5, 18 | 0.056 | 3.858 | 0.016 | |
| Predatory beetles | P | 5, 18 | 0.797 | 0.722 | 0.616 |


3.1.2. Non-Target Invertebrates
| Functional Group | Trial Site | Treatment | Pre-treatment ± se * | Post-treatment ± se (Cumulative) | Post hoc Tests |
|---|---|---|---|---|---|
| Collembola | Rossbridge 2009 | Broad-spectrum | 709 ± 254 | 1910 ± 654 | a |
| Diafenthiuron | 545 ± 270 | 2471 ± 157 | a | ||
| Paraffinic oil | 521 ± 160 | 5600 ± 772 | b | ||
| Weed cover | 523 ± 190 | 8867 ± 2395 | b | ||
| Imidacloprid | 586 ± 204 | 7632 ± 1768 | b | ||
| Untreated control | 512 ± 148 | 6406 ± 1835 | b | ||
| Inverleigh 2010 | Broad-spectrum | 6367 ± 1789 | 28303 ± 2625 | ||
| Thiamethoxam/abamectin | 8985 ± 2939 | 28538 ± 8827 | |||
| Dimethoate | 9823 ± 2506 | 46174 ± 3125 | |||
| Weed cover | 6976 ± 2354 | 47028 ± 8540 | |||
| Imidacloprid | 10509 ± 1729 | 50818 ± 4650 | |||
| Untreated control | 14511 ± 2501 | 49211 ± 6949 | |||
| Rossbridge 2010 | Broad-spectrum | 3557 ± 1777 | 37035 ± 3466 | a | |
| Diafenthiuron | 1679 ± 541 | 45098 ± 3932 | a | ||
| Thiamethoxam/abamectin | 1555 ± 655 | 49813 ± 3796 | a | ||
| Weed cover | 1264 ± 217 | 145550 ± 6794 | c | ||
| Imidacloprid | 3293 ± 1513 | 68824 ± 6279 | b | ||
| Untreated control | 833 ± 100 | 82464 ± 5788 | b | ||
| Predatory mites | Inverleigh 2009 | Broad-spectrum | 198 ± 54 | 1073 ± 193 | |
| Thiamethoxam/abamectin | 156 ± 32 | 1277 ± 336 | |||
| Spinosad | 119 ± 24 | 1241 ± 134 | |||
| Weed cover | 140 ± 40 | 545 ± 154 | |||
| Imidacloprid | 123 ± 34 | 1331 ± 51 | |||
| Untreated control | 181 ± 52 | 1681 ± 298 | |||
| Rossbridge 2009 | Broad-spectrum | 77 ± 19 | 73 ± 22 | a | |
| Diafenthiuron | 76 ± 19 | 117 ± 30 | ab | ||
| Paraffinic oil | 62 ± 26 | 192 ± 37 | ab | ||
| Weed cover | 120 ± 37 | 216 ± 48 | b | ||
| Imidacloprid | 115 ± 38 | 282 ± 57 | b | ||
| Untreated control | 141 ± 41 | 294 ± 63 | b | ||
| Rossbridge 2010 | Broad-spectrum | 519 ± 196 | 249 ± 17 | a | |
| Diafenthiuron | 300 ± 148 | 417 ± 74 | b | ||
| Thiamethoxam/abamectin | 732 ± 308 | 376 ± 103 | b | ||
| Weed cover | 548 ± 185 | 2202 ± 214 | b | ||
| Imidacloprid | 601 ± 108 | 332 ± 53 | b | ||
| Untreated control | 338 ± 192 | 491 ± 30 | b | ||
| Formicidae | Inverleigh 2009 | Broad-spectrum | - | 8 ± 2 | a |
| Thiamethoxam/abamectin | - | 24 ± 4 | b | ||
| Spinosad | - | 25 ± 6 | b | ||
| Weed cover | - | 10 ± 3 | ab | ||
| Imidacloprid | - | 24 ± 5 | b | ||
| Untreated control | - | 25 ± 7 | b | ||
| Rossbridge 2009 | Broad-spectrum | 2 ± 0 | 4 ± 0 | ||
| Diafenthiuron | 7 ± 1 | 13 ± 1 | |||
| Paraffinic oil | 8 ± 2 | 14 ± 3 | |||
| Weed cover | 3 ± 1 | 6 ± 1 | |||
| Imidacloprid | 6 ± 2 | 15 ± 4 | |||
| Untreated control | 10 ± 2 | 19 ± 4 | |||
| Inverleigh 2010 | Broad-spectrum | 25 ± 8 | 9 ± 2 | ||
| Thiamethoxam/abamectin | 18 ± 2 | 8 ± 2 | |||
| Dimethoate | 17 ± 2 | 15 ± 3 | |||
| Weed cover | 28 ± 2 | 13 ± 3 | |||
| Imidacloprid | 21 ± 3 | 15 ± 3 | |||
| Untreated control | 10 ± 2 | 11 ± 3 | |||
| Rossbridge 2010 | Broad-spectrum | 15 ± 2 | 4 ± 1 | a | |
| Diafenthiuron | 8 ± 2 | 6 ± 1 | ab | ||
| Thiamethoxam/abamectin | 9 ± 3 | 5 ± 1 | ab | ||
| Weed cover | 10 ± 2 | 4 ± 1 | ab | ||
| Imidacloprid | 12 ± 3 | 7 ± 0 | b | ||
| Untreated control | 16 ± 3 | 7 ± 1 | ab | ||
| Predatory beetles | Inverleigh 2009 | Broad-spectrum | - | 7 ± 1 | a |
| Diafenthiuron | - | 6 ± 1 | ab | ||
| Paraffinic oil | - | 9 ± 1 | ab | ||
| Weed cover | - | 4 ± 1 | ab | ||
| Imidacloprid | - | 12 ± 2 | b | ||
| Untreated control | - | 10 ± 3 | ab | ||
| Rossbridge 2009 | Broad-spectrum | 1 ± 0 | 3 ± 1 | ||
| Thiamethoxam/abamectin | 1 ± 0 | 10 ± 3 | |||
| Dimethoate | 1 ± 0 | 7 ± 2 | |||
| Weed cover | 1 ± 0 | 3 ± 1 | |||
| Imidacloprid | 1 ± 0 | 7 ± 2 | |||
| Untreated control | 1 ± 0 | 7 ± 2 |

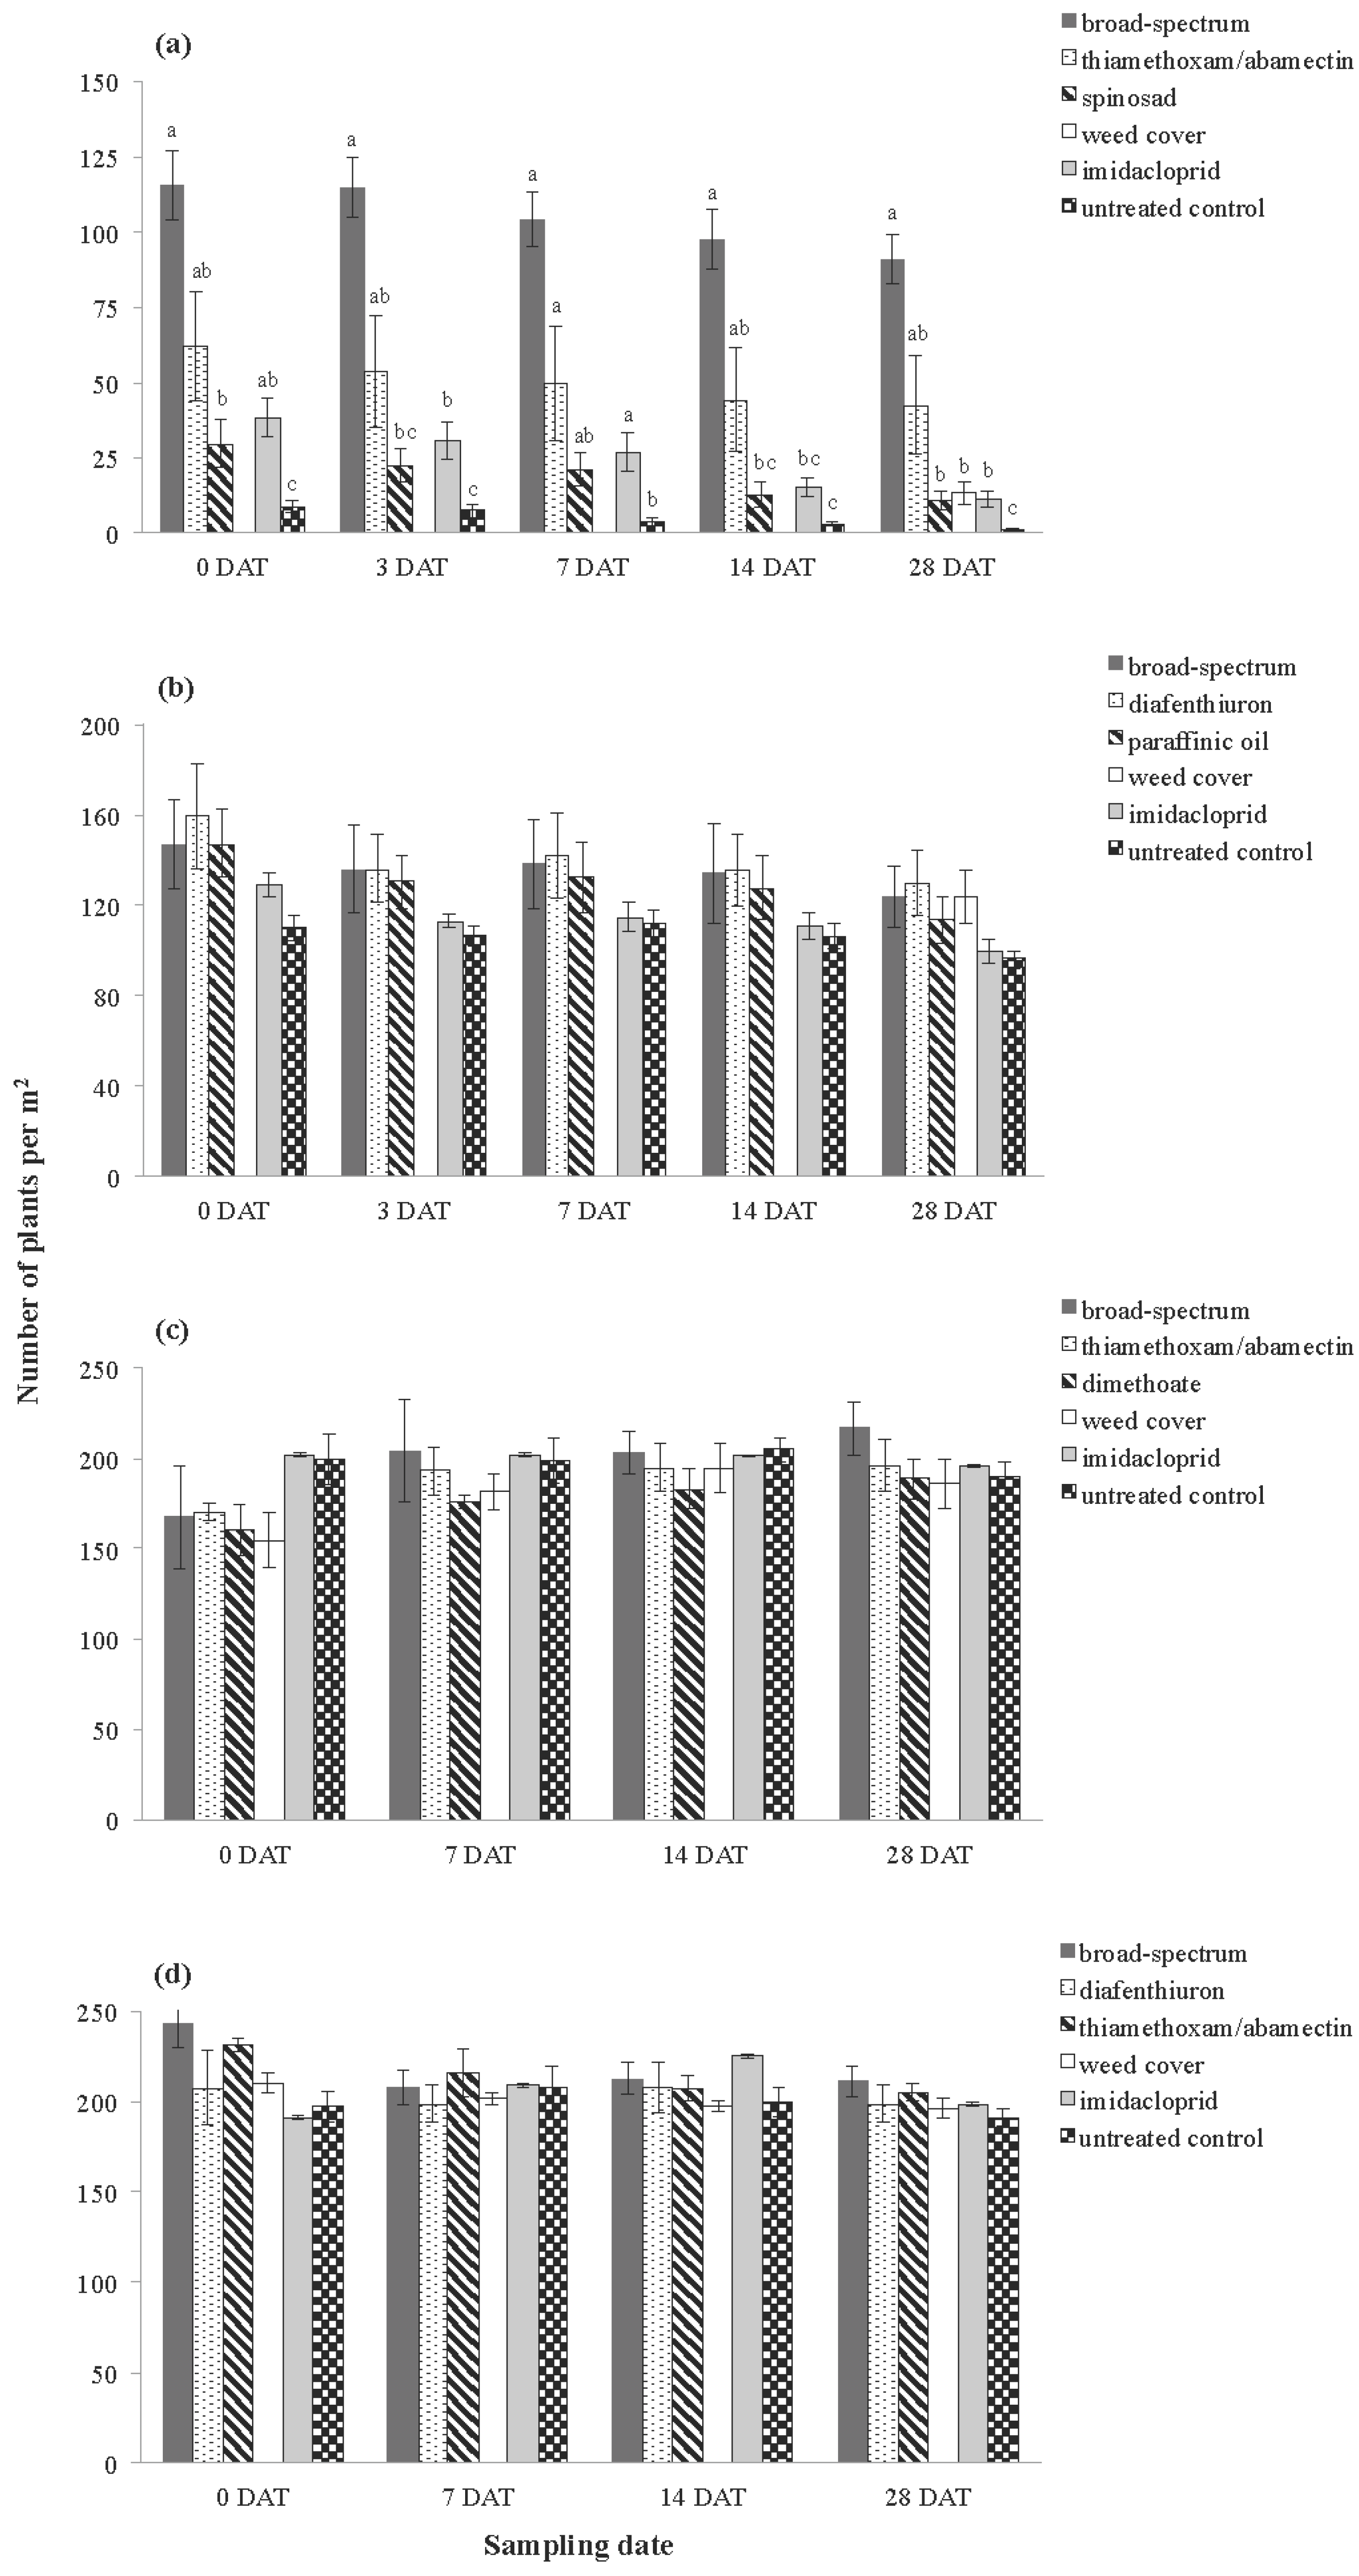
3.2. Plant Assessments
| Trial Site | Plant Measure | df | MS | F-Value | p |
|---|---|---|---|---|---|
| Inverleigh 2009 | Number of plants | 5, 18 | 4.991 | 9.247 | 0.001 |
| Plant damage | 5, 18 | 2.177 | 21.171 | <0.001 | |
| Rossbridge 2009 | Number of plants | 5, 18 | 0.045 | 1.277 | 0.322 |
| Plant damage | 5, 18 | 0.252 | 6.979 | 0.002 | |
| Inverleigh 2010 | Number of plants | 5, 18 | 0.009 | 0.896 | 0.505 |
| Plant damage | 5, 18 | 0.006 | 1.339 | 0.293 | |
| Rossbridge 2010 | Number of plants | 5, 18 | 0.004 | 1.210 | 0.344 |
| Plant damage | 5, 18 | 0.020 | 9.529 | <0.001 |


| Trial Site | Treatment | Yield (t/ha) ± se | Post hoc Tests |
|---|---|---|---|
| Inverleigh 2009 | Bifenthrin and omethoate | 2.04 ± 0.19 | a |
| Thiamethoxam/abamectin | 1.48 ± 0.47 | ab | |
| Spinosad | 1.07 ± 0.35 | abc | |
| Weed cover | 0.39 ± 0.17 | bc | |
| Imidacloprid | 0.74 ± 0.18 | bc | |
| Untreated control | 0.18 ± 0.11 | c | |
| Rossbridge 2009 | Bifenthrin and omethoate | 1.37 ± 0.07 | ab |
| Diafenthiuron | 1.43 ± 0.28 | a | |
| Paraffinic oil | 1.25 ± 0.36 | ab | |
| Weed cover | 0.67 ± 0.31 | b | |
| Imidacloprid | 1.33 ± 0.42 | ab | |
| Untreated control | 0.99 ± 0.57 | ab | |
| Inverleigh 2010 | Bifenthrin | 5.20 ± 0.32 | |
| Thiamethoxam/abamectin | 4.23 ± 0.76 | ||
| Dimethoate | 4.52 ± 0.71 | ||
| Weed cover | 4.19 ± 0.98 | ||
| Imidacloprid | 4.80 ± 0.53 | ||
| Untreated control | 4.61 ± 0.97 | ||
| Rossbridge 2010 | Bifenthrin | 4.82 ± 0.20 | |
| Diafenthiuron | 4.71 ± 0.34 | ||
| Thiamethoxam/abamectin | 4.90 ± 0.15 | ||
| Weed cover | 4.93 ± 0.17 | ||
| Imidacloprid | 5.04 ± 0.40 | ||
| Untreated control | 4.91 ± 0.22 |
4. Discussion
5. Conclusions
Supplementary Files
Supplementary File 1Acknowledgments
Author Contributions
Conflicts of Interest
References
- Narayanamma, V.L.; Reddy, K.D.; Reddy, A.V. Integrated pest and disease management practices in oilseeds—A critical review. Indian J. Entomol. 2013, 75, 34–56. [Google Scholar]
- Macfadyen, S.; Hardie, D.C.; Fagan, L.; Stefanova, K.; Perry, K.D.; DeGraaf, H.E.; Holloway, J.; Spafford, H.; Umina, P.A. Reducing insecticide use in broad-acre grains production: An Australian study. PLoS ONE 2014, 9, e89119. [Google Scholar] [CrossRef] [PubMed]
- Varenhorst, A.J.; O’Neal, M.E. The response of natural enemies to selective insecticides applied to soybean. Environ. Entomol. 2012, 41, 1565–1574. [Google Scholar] [CrossRef] [PubMed]
- DeBach, P.; Rosen, D. Biological Control by Natural Enemies, 2nd ed.; CUP Archive: Cambridge, UK, 1991. [Google Scholar]
- Pimentel, D.; Acquay, H.; Biltonen, M.; Rice, P.; Silva, M.; Nelson, J.; Lipner, V.; Giordano, S.; Horowitz, A.; D’amore, M. Environmental and economic costs of pesticide use. BioScience 1992, 42, 750–760. [Google Scholar] [CrossRef]
- Hassan, S.A.; Albert, R.; Bigler, F.; Blaisinger, P.; Bogenschutz, H.; Boller, E.; Brun, J.; Chiverton, P.; Edwards, P.; Englert, W.D.; et al. Results of the 3rd Joint Pesticide Testing Program by the IOBC WPRS-working group pesticides and beneficial organisms. J. Appl. Entomol. 1987, 103, 92–107. [Google Scholar] [CrossRef]
- Chen, G.H.; Hinds, J.; Zobel, E.; Rosario-Lebron, A.; Hooks, C.R.R. Evaluation of prophylactic sprays on pest abundance, foliar damage and yield in winter wheat. Int. J. Pest Manag. 2015, 61, 161–170. [Google Scholar] [CrossRef]
- Zalucki, M.P.; Furlong, M.J.; Schellhorn, N.A.; Macfadyen, S.; Davies, A.P. Assessing the impact of natural enemies in agroecosystems: Toward “real” IPM or in quest of the holy grail? Insect Sci. 2015, 22, 1–5. [Google Scholar] [CrossRef] [PubMed]
- Australian Bureau of Statistics. Year Book Australia 2012. Available online: http://www.abs.gov.au/ausstats/[email protected]/Lookup/by%20Subject/1301.0~2012~Main%20Features~Agricultural%20production~260 (accessed on 18 August 2015).
- Murray, D.A.H.; Clarke, M.B.; Ronning, D.A. Estimating invertebrate pest losses in six major Australian grain crops. Aust. J. Entomol. 2013, 52, 227–241. [Google Scholar] [CrossRef]
- Valenzuela, I.; Hoffmann, A.A. Effects of aphid feeding and associated virus injury on grain crops in Australia. Austral Entomol. 2014, 54, 292–305. [Google Scholar] [CrossRef]
- Hoffmann, A.A.; Weeks, A.R.; Nash, M.A.; Mangano, G.P.; Umina, P.A. The changing status of invertebrate pests and the future of pest management in the Australian grains industry. Aust. J. Exp. Agric. 2008, 48, 1481–1493. [Google Scholar] [CrossRef]
- Micic, S.; Hoffmann, A.A.; Strickland, G.; Weeks, A.R.; Bellati, J.; Henry, K.; Nash, M.A.; Umina, P.A. Pests of germinating grain crops in southern Australia: An overview of their biology and management options. Austr. J. Exp. Agric. 2008, 48, 1560–1573. [Google Scholar] [CrossRef]
- Gu, H.; Fitt, G.P.; Baker, G.H. Invertebrate pests of canola and their management in Australia: A review. Aust. J. Entomol. 2007, 46, 231–243. [Google Scholar] [CrossRef]
- Horne, P.A.; Page, J.; Nicholson, C. When will integrated pest management strategies be adopted? Example of the development and implementation of integrated pest management strategies in cropping systems in victoria. Aust. J. Exp. Agric. 2008, 48, 1601–1607. [Google Scholar] [CrossRef]
- Ridsdill-Smith, T.J.; Hoffmann, A.A.; Mangano, G.P.; Gower, J.M.; Pavri, C.C.; Umina, P.A. Strategies for control of the redlegged earth mite in Australia. Aust. J. Exp. Agric. 2008, 48, 1506–1513. [Google Scholar] [CrossRef]
- Umina, P.A.; Hoffmann, A.A.; Weeks, A.R. Biology, ecology and control of the Penthaleus species complex (Acari: Penthaleidae). Exp. Appl. Acarol. 2004, 34, 211–237. [Google Scholar] [CrossRef] [PubMed]
- Umina, P.A.; Hoffmann, A.A. Diapause and implications for control of Penthaleus species and Halotydeus destructor (Acari: Penthaleidae) in southeastern Australia. Exp. Appl. Acarol. 2003, 31, 209–223. [Google Scholar] [CrossRef] [PubMed]
- Umina, P.A.; Hoffmann, A.A. Plant host associations of Penthaleus species and Halotydeus destructor (Acari: Penthaleidae) and implications for integrated pest management. Exp. Appl. Acarol. 2004, 33, 1–20. [Google Scholar] [CrossRef] [PubMed]
- Marcic, D. Acaricides in modern management of plant-feeding mites. J. Pest Sci. 2012, 85, 395–408. [Google Scholar] [CrossRef]
- Umina, P.A. Pyrethroid resistance discovered in a major agricultural pest in southern Australia: The redlegged earth mite Halotydeus destructor (Acari: Penthaleidae). Pest Manag. Sci. 2007, 63, 1185–1190. [Google Scholar] [CrossRef] [PubMed]
- Michael, P. Season-long effects of four chemicals on redlegged earth mite and lucerne flea. In Proceedings of the National Workshop on Redlegged Earth Mite, Lucerne Flea and Blue Oat Mite, Perth, Australia, 9–11 September 1991; pp. 63–65.
- Asteraki, E.J.; Hanks, C.B.; Clements, R.O. The impact of two insecticides on predatory ground beetles (Carabidae) in newly-sown grass. Ann. Appl. Biol. 1992, 120, 25–39. [Google Scholar] [CrossRef]
- Curtis, J.E.; Horne, P.A. Effect of chlorpyrifos and cypermethrin applications on non-target invertebrates in a conservation-tillage crop. J. Aust. Entomol. Soc. 1995, 34, 229–231. [Google Scholar] [CrossRef]
- Umina, P.A.; Weeks, A.R.; Roberts, J.; Jenkins, S.; Mangano, P.; Lord, A.; Micic, S. The current status of pesticide resistance in Australian populations of the redlegged earth mite (Halotydeus destructor). Pest Manag. Sci. 2012, 68, 889–896. [Google Scholar] [CrossRef] [PubMed]
- Allinson, G.; Hagen, T.; Salzman, S.; Wightwick, A.; Nugegoda, D. Effect of increasing salinity on the acute toxicity of a commercial endosulfan formulation to the bdelloid rotifer Philodina acuticornis odiosa. Toxicol. Environ. Chem. 2011, 93, 722–728. [Google Scholar] [CrossRef]
- Australian Pesticides and Veterinary Medicines Authority. Listing of Chemical Reviews. Available online: http://apvma.gov.au/chemicals-and-products/chemical-review/listing (accessed on 18 August 2015).
- Nash, M.A.; Thomson, L.J.; Hoffmann, A.A. Effect of remnant vegetation, pesticides and farm management on abundance of the beneficial predator Notonomus gravis (Chaudoir) (Coleoptera: Carabidae). Biol. Control 2008, 46, 83–93. [Google Scholar] [CrossRef]
- Macfadyen, S.; Zalucki, M.P. Assessing the short-term impact of an insecticide (deltamethrin) on predator and herbivore abundance in soybean glycine max using a replicated small-plot field experiment. Insect Sci. 2012, 19, 112–120. [Google Scholar] [CrossRef]
- Horne, P.A.; Page, J. Integrated Pest Management for Crops and Pastures; Landlinks Press: Collingwood, Australia, 2008. [Google Scholar]
- Nash, M.A.; Hoffmann, A.A.; Thomson, L.J. Identifying signature of chemical applications on indigenous and invasive nontarget arthropod communities in vineyards. Ecol. Appl. 2010, 20, 1693–1703. [Google Scholar] [CrossRef] [PubMed]
- Umina, P.A.; Arthur, A.L.; McColl, S.A.; Hoffmann, A.A.; Roberts, J.M.K. Selective control of mite and collembolan pests of pastures and grain crops in Australia. Crop Prot. 2010, 29, 190–196. [Google Scholar] [CrossRef]
- Jenkins, S.; Hoffmann, A.A.; McColl, S.A.; Tsitsilas, A.; Umina, P.A. Synthetic pesticides in agro-ecosystems: Are they as detrimental to nontarget invertebrate fauna as we suspect? J. Econ. Entomol. 2013, 106, 756–775. [Google Scholar] [CrossRef] [PubMed]
- Roberts, J.M.K.; Weeks, A.R.; Hoffmann, A.A.; Umina, P.A. Does Bdellodes lapidaria (Acari: Bdellidae) have a role in biological control of the springtail pest, Sminthurus viridis (Collembola: Sminthuridae) in south-eastern Australia? Biol. Control 2011, 58, 222–229. [Google Scholar] [CrossRef]
- Tsitsilas, A.; Stuckey, S.; Hoffmann, A.A.; Weeks, A.R.; Thomson, L.J. Shelterbelts in agricultural landscapes suppress invertebrate pests. Aust. J. Exp. Agric. 2006, 46, 1379–1388. [Google Scholar] [CrossRef]
- Buffington, M.L.; Redak, R.A. A comparison of vacuum sampling versus sweep-netting for arthropod biodiversity measurements in California coastal sage scrub. J. Insect Conserv. 1998, 2, 99–106. [Google Scholar] [CrossRef]
- Neville, P.J.; Yen, A.L. Standardising terrestrial invertebrate biomonitoring techniques across natural and agricultural systems. Aust. J. Exp. Agric. 2007, 47, 384–391. [Google Scholar] [CrossRef]
- Arthur, A.L.; Hoffmann, A.A.; Umina, P.A. Impact of Halotydeus destructor on crop seedlings at different plant developmental stages and levels of moisture stress. Environ. Entomol. 2013, 42, 998–1012. [Google Scholar] [CrossRef] [PubMed]
- Liu, A.; Ridsdill-Smith, T.J. Feeding by redlegged earth mite (Halotydeus destructor) on seedlings influences subsequent plant performance of different pulse crops. Aust. J. Agric. Res. 2000, 40, 715–723. [Google Scholar] [CrossRef]
- Sokal, R.R.; Rohlf, F.J. Biometry: The Principles and Practice of Statistics in Biological Research, 3rd ed.; W.H. Freeman: New York, NY, USA, 1995. [Google Scholar]
- Wick, M.; Freier, B. Long-term effects of an insecticide application on non-target arthropods in winter wheat—A field study over 2 seasons. Anz. Schadl. J. Pest Sci. 2000, 73, 61–69. [Google Scholar] [CrossRef]
- Prischmann, D.A.; James, D.G.; Wright, L.C.; Teneyck, R.D.; Snyder, W.E. Effects of chlorpyrifos and sulfur on spider mites (Acari: Tetranychidae) and their natural enemies. Biol. Control 2005, 33, 324–334. [Google Scholar] [CrossRef]
- Duffield, S.J.; Jepson, P.C.; Wratten, S.D.; Sotherton, N.W. Spatial changes in invertebrate predation rate in winter wheat following treatment with dimethoate. Entomol. Exp. Appl. 1996, 78, 9–17. [Google Scholar] [CrossRef]
- Stern, V.M.; Smith, R.F.; van den Bosch, R.; Hagen, K.S. The integrated control concept. Hilgardia 1959, 29, 81–101. [Google Scholar] [CrossRef]
- Pedigo, L.P.; Hutchins, S.H.; Higley, L.G. Economic injury levels in theory and practice. Annu. Rev. Entomol. 1986, 31, 341–368. [Google Scholar] [CrossRef]
- Arthur, A.; Hoffmann, A.; Umina, P. Challenges in devising economic spray thresholds for a major pest of Australian canola, the redlegged earth mite (Halotydeus destructor). Pest Manag. Sci. 2015, 71, 1462–1470. [Google Scholar] [CrossRef] [PubMed]
- Ohnesorg, W.J.; Johnson, K.D.; O’Neal, M.E. Impact of reduced-risk insecticides on soybean aphid and associated natural enemies. J. Econ. Entomol. 2009, 102, 1816–1826. [Google Scholar] [CrossRef] [PubMed]
- Goulson, D. Review: An overview of the environmental risks posed by neonicotinoid insecticides. J. Appl. Ecol. 2013, 50, 977–987. [Google Scholar] [CrossRef]
- Ridsdill-Smith, T.J. Biology and control of Halotydeus destructor (Tucker) (Acarina: Penthaleidae): A review. Exp. Appl. Acarol. 1997, 21, 195–224. [Google Scholar] [CrossRef]
- Stark, J.D.; Banks, J.E.; Vargas, R. How risky is risk assessment: The role that life history strategies play in susceptibility of species to stress. Proc. Natl. Acad. Sci. USA 2004, 101, 732–736. [Google Scholar] [CrossRef] [PubMed]
- Desneux, N.; Decourtye, A.; Delpuech, J.M. The sublethal effects of pesticides on beneficial arthropods. Annu. Rev. Entomol. 2007, 52, 81–106. [Google Scholar] [CrossRef] [PubMed]
© 2015 by the authors; licensee MDPI, Basel, Switzerland. This article is an open access article distributed under the terms and conditions of the Creative Commons Attribution license (http://creativecommons.org/licenses/by/4.0/).
Share and Cite
Umina, P.A.; Jenkins, S.; McColl, S.; Arthur, A.; Hoffmann, A.A. A Framework for Identifying Selective Chemical Applications for IPM in Dryland Agriculture. Insects 2015, 6, 988-1012. https://doi.org/10.3390/insects6040988
Umina PA, Jenkins S, McColl S, Arthur A, Hoffmann AA. A Framework for Identifying Selective Chemical Applications for IPM in Dryland Agriculture. Insects. 2015; 6(4):988-1012. https://doi.org/10.3390/insects6040988
Chicago/Turabian StyleUmina, Paul A., Sommer Jenkins, Stuart McColl, Aston Arthur, and Ary A. Hoffmann. 2015. "A Framework for Identifying Selective Chemical Applications for IPM in Dryland Agriculture" Insects 6, no. 4: 988-1012. https://doi.org/10.3390/insects6040988