

Acute Responses of Youth Elite Players to a Football Match in Terms of Blood Markers


Abstract
1. Introduction
2. Materials and Methods
2.1. Participants
2.2. Procedures
2.3. Statistical Analysis
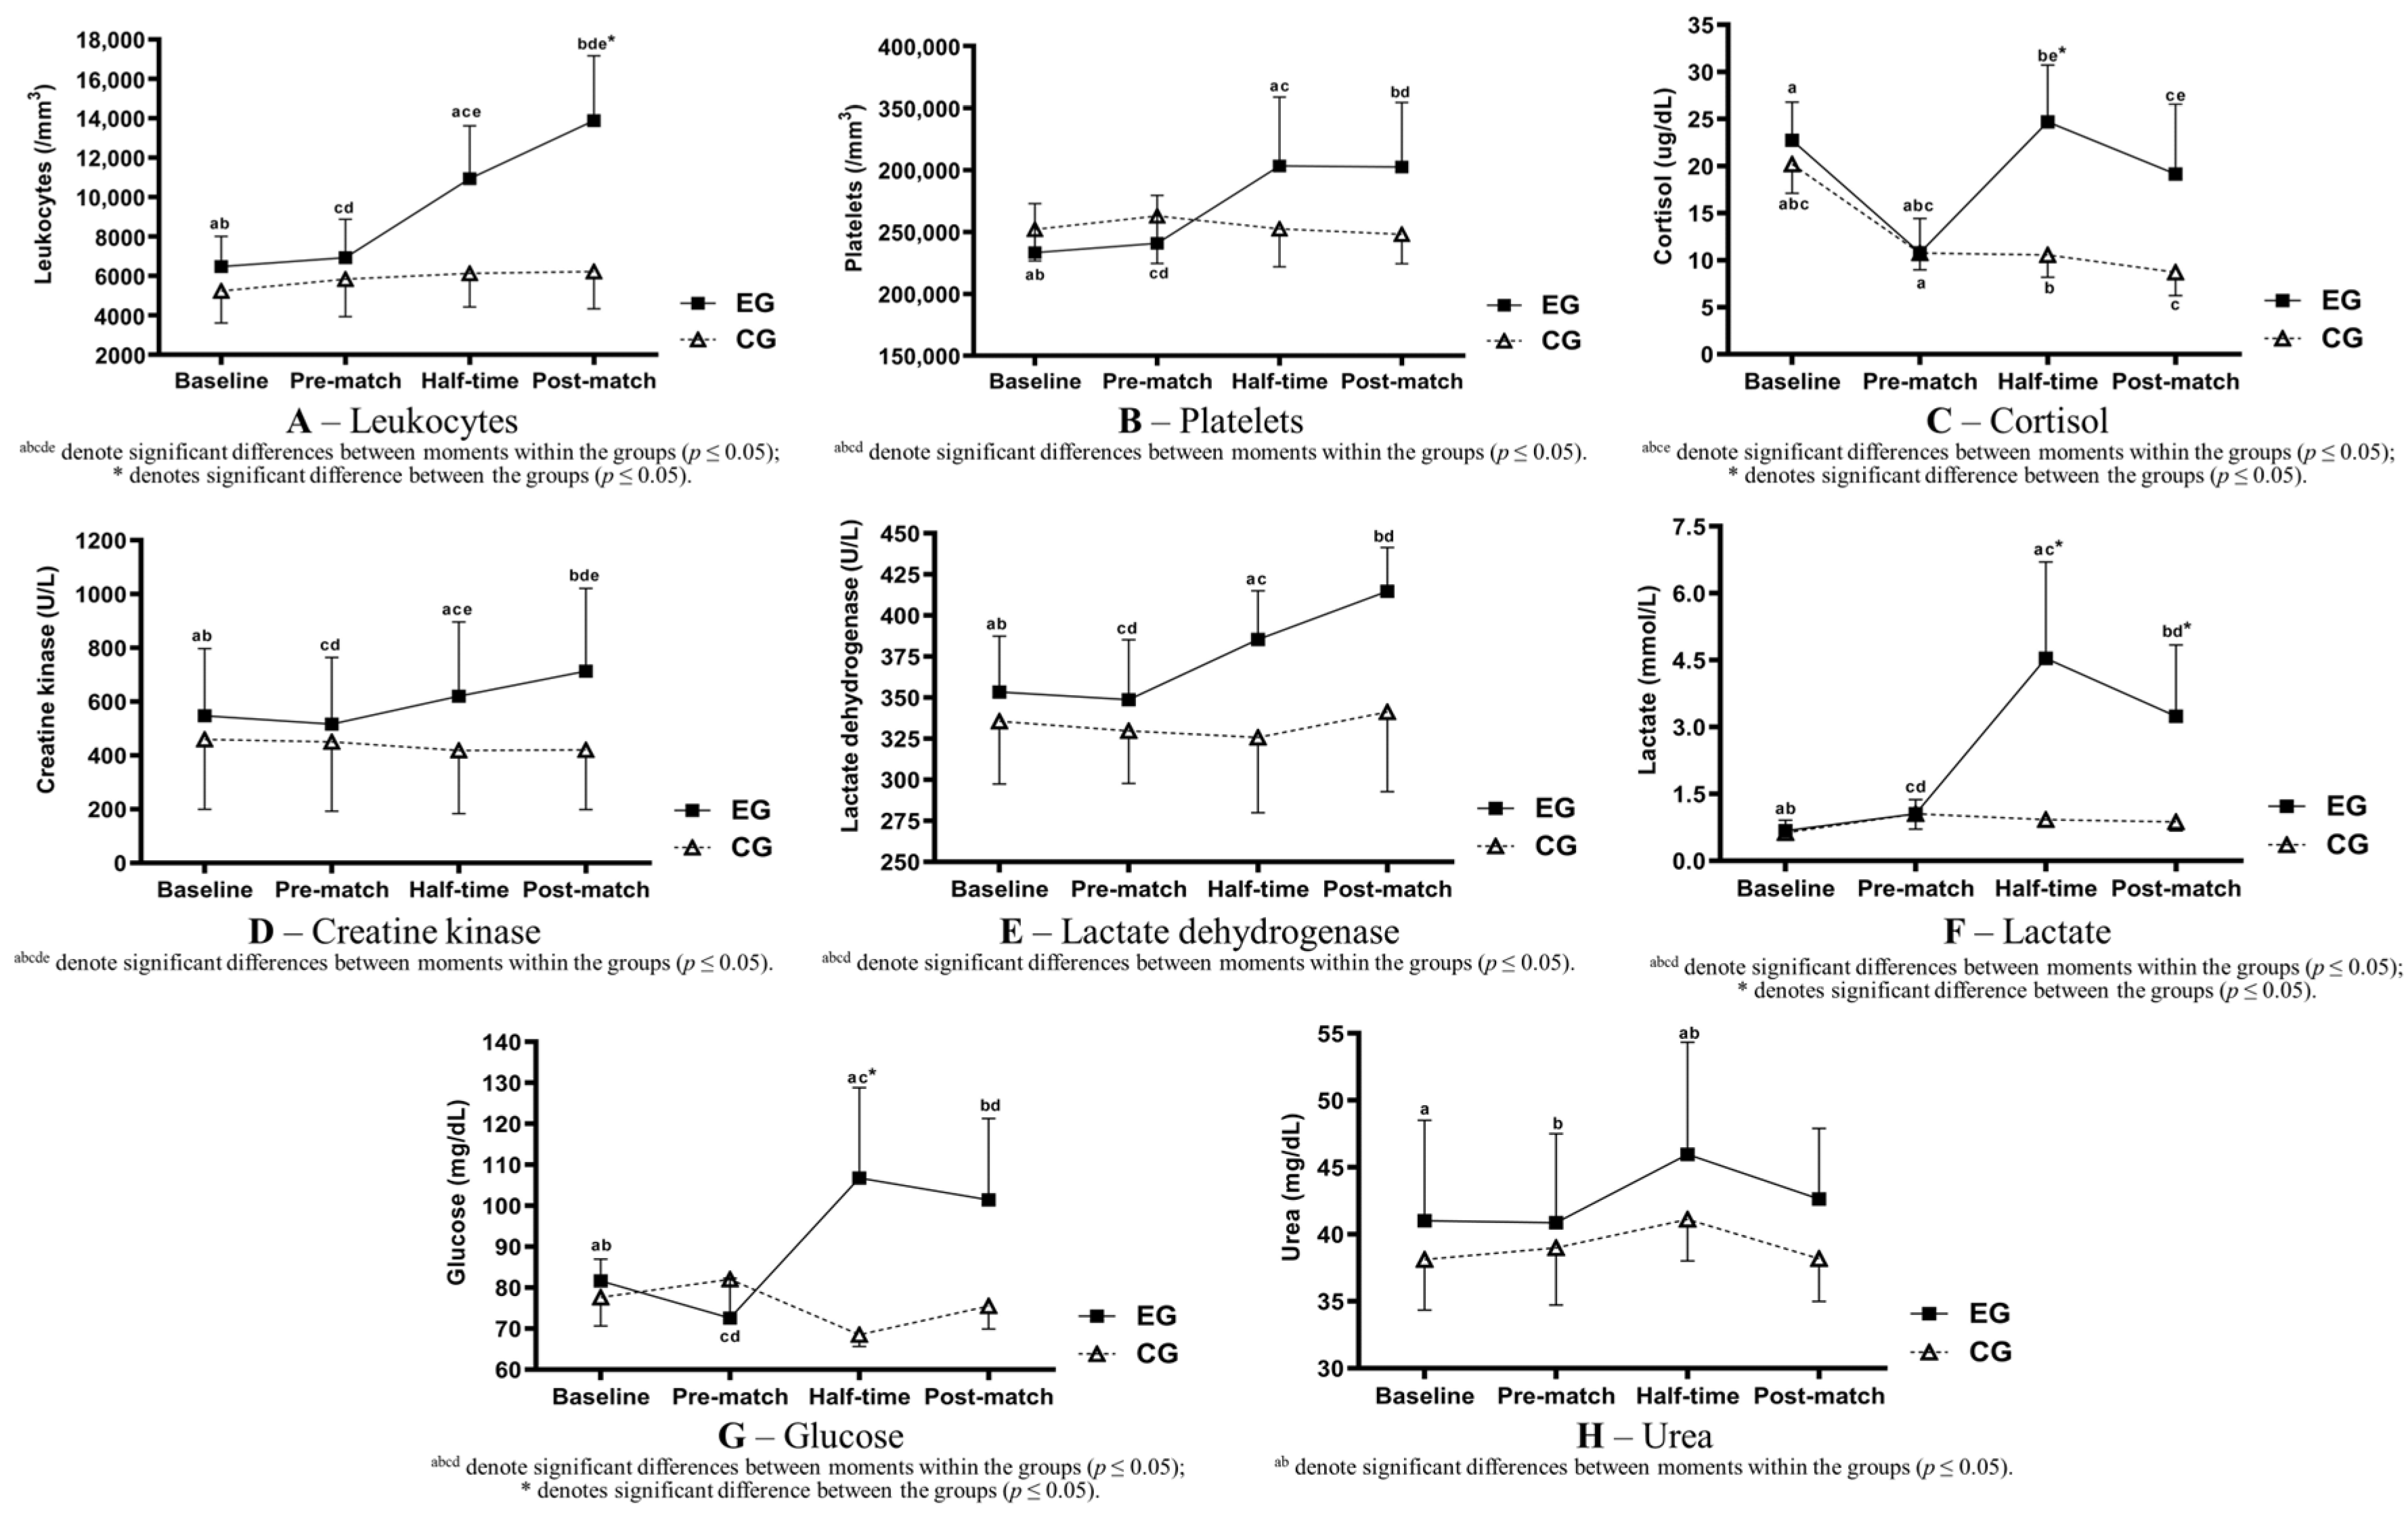
3. Results
4. Discussion
5. Conclusions
Author Contributions
Funding
Institutional Review Board Statement
Informed Consent Statement
Data Availability Statement
Conflicts of Interest
References
- Bangsbo, J.; Mohr, M.; Krustrup, P. Physical and metabolic demands of training and match-play in the elite football player. J. Sports Sci. 2006, 24, 665–674. [Google Scholar] [CrossRef] [PubMed]
- Carling, C. Interpreting physical performance in professional soccer match-play: Should we be more pragmatic in our approach? Sports Med. 2013, 43, 655–663. [Google Scholar] [CrossRef] [PubMed]
- Paul, D.J.; Bradley, P.S.; Nassis, G.P. Factors affecting match running performance of elite soccer players: Shedding some light on the complexity. Int. J. Sports Physiol. 2015, 10, 516–519. [Google Scholar] [CrossRef] [PubMed]
- Bradley, P.S.; Ade, J.D. Are current physical match performance metrics in elite soccer fit for purpose or is the adoption of an integrated approach needed? Int. J. Sports Physiol. 2018, 13, 656–664. [Google Scholar] [CrossRef]
- Enes, A.; Oneda, G.; Alves, D.L.; Palumbo, D.d.P.; Cruz, R.; Moiano Junior, J.V.; Novack, L.F.; Osiecki, R. Determinant factors of the match-based internal load in elite soccer players. Res. Q. Exerc. Sport 2021, 92, 63–70. [Google Scholar] [CrossRef]
- Di Mascio, M.; Bradley, P.S. Evaluation of the most intense high-intensity running period in English FA premier league soccer matches. J. Strength Cond. Res. 2013, 27, 909–915. [Google Scholar] [CrossRef]
- Mohr, M.; Krustrup, P.; Bangsbo, J. Match performance of high-standard soccer players with special reference to development of fatigue. J. Sports Sci. 2003, 21, 519–528. [Google Scholar] [CrossRef]
- Stølen, T.; Chamari, K.; Castagna, C.; Wisløff, U. Physiology of soccer: An update. Sports Med. 2005, 35, 501–536. [Google Scholar] [CrossRef]
- Osgnach, C.; Poser, S.; Bernardini, R.; Rinaldo, R.; Di Prampero, P.E. Energy cost and metabolic power in elite soccer: A new match analysis approach. Med. Sci. Sports Exerc. 2010, 42, 170–178. [Google Scholar] [CrossRef]
- Conde, J.H.; Alves, D.L.; Novack, L.F.; Carneiro, C.F.; Cruz, R.; Osiecki, R. Comparisons of recovery, external and internal load by playing position and match outcome in professional soccer. Mot. Rev. Educ. Física 2018, 24, e1018140. [Google Scholar] [CrossRef]
- Achten, J.; Jeukendrup, A.E. Heart rate monitoring: Applications and limitations. Sports Med. 2003, 3, 517–538. [Google Scholar] [CrossRef] [PubMed]
- Banister, E.W. Modeling elite athletic performance. In Physiological Testing of the High-Performance Athlete; MacDougall, H.A., Wenger, H.A., Green, H.J., Eds.; Human Kinetics Books: Champaing, IL, USA, 1991; Volume 347, pp. 403–422. [Google Scholar]
- Edwards, S. (Ed.) High performance training and racing. In The Heart Rate Monitor Book; Feet Fleet Press: Sacramento, CA, USA, 1993; Volume 349, pp. 113–123. [Google Scholar]
- Lucía, A.; Hoyos, J.; Pérez, M.; Chicharro, J.L. Heart rate and performance parameters in elite cyclists: A longitudinal study. Med. Sci. Sports Exerc. 2000, 32, 1777–1782. [Google Scholar] [CrossRef] [PubMed]
- Impellizzeri, F.M.; Rampinini, E.; Marcora, S.M. Physiological assessment of aerobic training in soccer. J. Sports Sci. 2005, 23, 583–592. [Google Scholar] [CrossRef] [PubMed]
- McArdle, W.D.; Katch, F.I.; Katch, V.L. Exercise Physiology, Energy, Nutrition & Human Performance; Lippincott Williams & Wilkins: Baltimore, MD, USA, 2007. [Google Scholar]
- Ispirlidis, I.; Fatouros, I.G.; Jamurtas, A.Z.; Nikolaidis, M.G.; Michailidis, I.; Douroudos, I.; Margonis, K.; Chatzinikolaou, A.; Kalistratos, E.; Katrabasas, I. Time-course of changes in inflammatory and performance responses following a soccer game. Clin. J. Sport Med. 2008, 18, 423–431. [Google Scholar] [CrossRef]
- Souglis, A.; Bogdanis, G.; Giannopoulou, I.; Papadopoulos, C.; Apostolidis, N. Comparison of inflammatory responses and muscle damage indices following a soccer, basketball, volleyball and handball game at an elite competitive level. Res. Sports Med. 2015, 23, 59–72. [Google Scholar] [CrossRef]
- Fatouros, I.G.; Chatzinikolaou, A.; Douroudos, I.I.; Nikolaidis, M.G.; Kyparos, A.; Margonis, K.; Michailidis, Y.; Vantarakis, A.; Taxildaris, K.; Katrabasas, I. Time-course of changes in oxidative stress and antioxidant status responses following a soccer game. J. Strength Cond. Res. 2010, 24, 3278–3286. [Google Scholar] [CrossRef]
- Souglis, A.G.; Papapanagiotou, A.; Bogdanis, G.C.; Travlos, A.K.; Apostolidis, N.G.; Geladas, N.D. Comparison of inflammatory responses to a soccer match between elite male and female players. J. Strength Cond. Res. 2015, 29, 1227–1233. [Google Scholar] [CrossRef]
- Jamurtas, A.Z.; Douroudos, I.I.; Deli, C.K.; Draganidis, D.; Chatzinikolaou, A.; Mohr, M.; Avloniti, A.; Barbero-Álvarez, J.C.; Margonis, K.; Mavropalias, G. Iron status markers are only transiently affected by a football game. J. Sports Sci. 2015, 33, 2088–2099. [Google Scholar] [CrossRef]
- Rampinini, E.; Bosio, A.; Ferraresi, I.; Petruolo, A.; Morelli, A.; Sassi, A. Match-related fatigue in soccer players. Med. Sci. Sports Exerc. 2011, 43, 2161–2170. [Google Scholar] [CrossRef]
- Thorpe, R.; Sunderland, C. Muscle damage, endocrine, and immune marker response to a soccer match. J. Strength Cond. Res. 2012, 26, 2783–2790. [Google Scholar] [CrossRef]
- Tsubakihara, T.; Umeda, T.; Takahashi, I.; Matsuzaka, M.; Iwane, K.; Tanaka, M.; Matsuda, M.; Oyamada, K.; Aruga, R.; Nakaji, S. Effects of soccer matches on neutrophil and lymphocyte functions in female university soccer players. Luminescence 2013, 28, 129–135. [Google Scholar] [CrossRef] [PubMed]
- Romagnoli, M.; Sanchis-Gomar, F.; Alis, R.; Risso-Ballester, J.; Bosio, A.; Graziani, R.L.; Rampinini, E. Changes in muscle damage, inflammation, and fatigue-related parameters in young elite soccer players after a match. J. Sports Med. Phys. Fitness 2016, 56, 1198–1205. [Google Scholar] [PubMed]
- Novack, L.F.; de Souza, G.C.; Conde, J.H.S.; de Souza, R.O.; Osiecki, R. Quantification of match internal load and its relationship with physical fitness and recovery state of professional soccer athletes during the competitive period. Hum. Mov. 2018, 19, 30–37. [Google Scholar] [CrossRef]
- Silva, J.R.; Rumpf, M.; Hertzog, M.; Castagna, C.; Farooq, A.; Girard, O.; Hader, K. Acute and residual soccer match-related fatigue: A systematic review and meta-analysis. Sports Med. 2018, 48, 539–583. [Google Scholar] [CrossRef] [PubMed]
- Neves, P.R.D.S.; Tenório, T.R.D.S.; Lins, T.A.; Muniz, M.T.C.; Pithon-Curi, T.C.; Botero, J.P.; Do Prado, W.L. Acute effects of high- and low-intensity exercise bouts on leukocyte counts. J. Exerc. Sci. Fit. 2015, 13, 24–28. [Google Scholar] [CrossRef] [PubMed]
- Heber, S.; Volf, I. Effects of physical (in)activity on platelet function. BioMed Res. Int. 2015, 2015, 165078. [Google Scholar] [CrossRef]
- Oakley, R.H.; Cidlowski, J.A. The biology of the glucocorticoid receptor: New signaling mechanisms in health and disease. J. Allergy Clin. Immunol. 2013, 132, 1033–1044. [Google Scholar] [CrossRef]
- Bangsbo, J.; Iaia, F.M.; Krustrup, P. Metabolic response and fatigue in soccer. Int. J. Sports. Physiol. 2007, 2, 111–127. [Google Scholar] [CrossRef]
- Goodwin, M.L.; Harris, J.E.; Hernández, A.; Gladden, L.B. Blood lactate measurements and analysis during exercise: A guide for clinicians. J. Diabetes Sci. Technol. 2007, 1, 558–569. [Google Scholar] [CrossRef]
- Heyward, V.H.; Stolarczyk, L.M. Applied Body Composition Assessment; Human Kinetics: Champaign, IL, USA, 1996; pp. 66–88. [Google Scholar]
- Faulkner, J.A. Physiology of Swimming and diving. In Exercise Physiology; Falls, H., Ed.; Academic Press: Baltimore, MA, USA, 1968; pp. 415–446. [Google Scholar]
- Medicine, A.C.O.S. ACSM’s Guidelines for Exercise Testing and Prescription; Lippincott Williams & Wilkins: Philadelphia, PA, USA, 2005; pp. 72–87. [Google Scholar]
- Powers, S.K.; Howley, E.T. Exercise Physiology: Theory and Application to Fitness and Performance; McGraw-Hill Education: New York, NY, USA, 2018; pp. 386–401. [Google Scholar]
- Barros, R.M.; Misuta, M.S.; Menezes, R.P.; Figueroa, P.J.; Moura, F.A.; Cunha, S.A.; Anido, R.; Leite, N.J. Analysis of the distances covered by first division Brazilian soccer players obtained with an automatic tracking method. J. Sports Sci. Med. 2007, 6, 233–242. [Google Scholar]
- Di Salvo, V.; Baron, R.; Tschan, H.; Calderon Montero, F.J.; Bachl, N.; Pigozzi, F. Performance characteristics according to playing position in elite soccer. Int. J. Sports Med. 2007, 28, 222–227. [Google Scholar] [CrossRef]
- Rampinini, E.; Coutts, A.J.; Castagna, C.; Sassi, R.; Impellizzeri, F.M. Variation in top level soccer match performance. Int. J. Sports Med. 2007, 28, 1018–1024. [Google Scholar] [CrossRef]
- Younesian, A.; Mohammadion, M.; Rahnama, N.; Cable, T. Haemathology of professional soccer players before and after 90 min match. Cell. Mol. Biol. Lett. 2004, 9, 133–136. [Google Scholar]
- Verrastro, T.; Lorenzi, T.F.; Neto, S.W. Hematologia e Hemoterapia: Fundamentos de Morfologia, Fisiologia, Patologia e Clínica; Ateneu: Sao Paulo, Brazil, 2005; pp. 83–91. [Google Scholar]
- Kraemer, W.J.; Ratamess, N.A. Hormonal responses and adaptations to resistance exercise and training. Sports Med. 2005, 35, 339–361. [Google Scholar] [CrossRef] [PubMed]
- Totsuka, M.; Nakaji, S.; Suzuki, K.; Sugawara, K.; Sato, K. Break point of serum creatine kinase release after endurance exercise. J. Appl. Physiol. 2002, 93, 1280–1286. [Google Scholar] [CrossRef] [PubMed]
- Sayers, S.P.; Clarkson, P.M. Short-term immobilization after eccentric exercise. Part II: Creatine kinase and myoglobin. Med. Sci. Sports Exerc. 2003, 35, 762–768. [Google Scholar] [CrossRef] [PubMed]
- Harper, D.J.; Carling, C.; Kiely, J. High-intensity acceleration and deceleration demands in elite team sports competitive match play: A systematic review and meta-analysis of observational studies. Sports Med. 2019, 49, 1923–1947. [Google Scholar] [CrossRef] [PubMed]
- Gastin, P.B.; Hunkin, S.L.; Fahrner, B.; Robertson, S. Deceleration, acceleration, and impacts are strong contributors to muscle damage in professional Australian football. J. Strength Cond. Res. 2019, 33, 3374–3383. [Google Scholar] [CrossRef] [PubMed]
- Armstrong, R.B.; Ogilvie, R.W.; Schwane, J.A. Eccentric exercise-induced injury to rat skeletal muscle. J. Appl. Physiol. Respir. Environ. Exerc. Physiol. 1983, 54, 80–93. [Google Scholar] [CrossRef] [PubMed]
- Douglas, J.; Pearson, S.; Ross, A.; McGuigan, M. Eccentric exercise: Physiological characteristics and acute responses. Sports Med. 2017, 47, 663–675. [Google Scholar] [CrossRef] [PubMed]
- Hader, K.; Rumpf, M.C.; Hertzog, M.; Kilduff, L.P.; Girard, O.; Silva, J.R. Monitoring the athlete match response: Can external load variables predict post-match acute and residual fatigue in soccer? A systematic review with meta-analysis. Sports Med. Open 2019, 5, 48. [Google Scholar] [CrossRef]
- Helgerud, J.; Engen, L.C.; Wisløff, U.; Hoff, J. Aerobic endurance training improves soccer performance. Med. Sci. Sports Exerc. 2001, 33, 1925–1931. [Google Scholar] [CrossRef]
- Bangsbo, J. The physiology of soccer—With special reference to intense intermittent exercise. Acta Physiol. Scand. 1994, 619, 1–155. [Google Scholar]
- Krustrup, P.; Bangsbo, J. Physiological demands of top-class soccer refereeing in relation to physical capacity: Effect of intense intermittent exercise training. J. Sports Sci. 2001, 19, 881–891. [Google Scholar] [CrossRef] [PubMed]
- Colombini, A.; Machado, M.; Lombardi, G.; Lanteri, P.; Banfi, G. Modifications of biochemical parameters related to protein metabolism and renal function in male soccer players after a match. J. Sports Med. Phys. Fitness 2014, 54, 658–664. [Google Scholar] [PubMed]
- Maughan, R.J.; Watson, P.; Evans, G.H.; Broad, N.; Shirreffs, S.M. Water balance and salt losses in competitive football. Int. J. Sport Nutr. Exerc. Metab. 2007, 17, 583–594. [Google Scholar] [CrossRef]
- Lee, G.; Wintrobe, M. Wintrobe’s Clinical Hematology; Lea & Febiger: Philadelphia, PA, USA, 1999; pp. 617–682. [Google Scholar]
- Iraki, L.; Bogdan, A.; Hakkou, F.; Amrani, N.; Abkari, A.; Touitou, Y. Ramadan diet restrictions modify the circadian time structure in humans. A study on plasma gastrin, insulin, glucose, and calcium and on gastric pH. J. Clin. Endocrinol. Metab. 1997, 82, 1261–1273. [Google Scholar] [CrossRef][Green Version]


| Experimental Group | Control Group | p-Value | |
|---|---|---|---|
| Age (y/o) | 18.33 ± 0.44 | 17.91 ± 0.53 | 0.1145 |
| Height (cm) | 177.35 ± 4.15 | 182.58 ± 8.40 | 0.1147 |
| Body weight (kg) | 75.32 ± 3.25 | 80.85 ± 5.73 | 0.0260 * |
| %Bodyfat | 11.20 ± 1.10 | 11.90 ± 1.46 | 0.2945 |
| HRrest (bpm) | 68.2 ± 11.4 | 59.8 ± 3.9 | 0.1804 |
| HRmax (bpm) | 198.1 ± 8.2 | 195.0 ± 7.4 | 0.5251 |
| VO2max (mL/kg/min) | 57.22 ± 3.53 | 54.92 ± 9.35 | 0.5010 |
| Experimental Group | Control Group | |
|---|---|---|
| Pre-match (mL) | 312.5 ± 200.8 | 336.0 ± 143.7 |
| Half-time (mL) | 123.3 ± 67.7 | 439.5 ± 107.7 * |
| Marker | Group | Baseline | Pre-Match | Half-Time | Post-Match |
|---|---|---|---|---|---|
| Leukocytes | EG | 6470 ± 1541 ab | 6920 ± 1949 cd | 10,940 ± 2683 ace | 13,890 ± 3292 bde |
| (/mm3) | CG | 5233 ± 1623 | 5833 ± 1912 | 6133 ± 1710 | 6217 ± 1895 |
| Platelets | EG | 233,300 ± 39,497 ab | 240,700 ± 38,807 cd | 303,300 ± 55,627 ac | 302,400 ± 52,073 bd |
| (/mm3) | CG | 252,000 ± 25,479 | 262,833 ± 38,426 | 252,333 ± 30,480 | 248,000 ± 23,698 |
| Cortisol | EG | 22.73 ± 4.06 a | 10.78 ± 3.63 abc | 24.70 ± 6.04 bd* | 19.15 ± 7.40 cd |
| (µg/dL) | CG | 20.20 ± 3.10 abc | 10.75 ± 1.77 a | 10.55 ± 2.37 b | 8.70 ± 2.47 c |
| Marker | Group | Baseline | Pre-Match | Half-Time | Post-Match |
|---|---|---|---|---|---|
| CK | EG | 547.20 ± 250.74 ab | 516.50 ± 248.38 cd | 620.30 ± 276.12 ace | 713.70 ± 308.20 bde |
| (U/L) | CG | 459.50 ± 260.47 | 450.50 ± 258.44 | 418.50 ± 234.56 | 420.67 ± 222.59 |
| LDH | EG | 353.40 ± 34.08 ab | 348.80 ± 36.49 cd | 385.40 ± 29.62 ac | 414.80 ± 26.55 bd |
| (U/L) | CG | 335.50 ± 38.11 | 329.83 ± 32.16 | 325.83 ± 45.85 | 341.17 ± 48.35 |
| Marker | Group | Baseline | Pre-Match | Half-Time | Post-Match |
|---|---|---|---|---|---|
| Lactate | EG | 0.67 ± 0.24 ab | 1.05 ± 0.32 cd | 4.54 ± 2.16 ac* | 3.24 ± 1.60 bd* |
| (mmol/L) | CG | 0.63 ± 0.17 | 1.05 ± 0.34 | 0.92 ± 0.12 | 0.87 ± 0.20 |
| Glucose | EG | 81.65 ± 5.29 ab | 72.54 ± 9.76 cd | 106.79 ± 22.02 ac* | 101.42 ± 19.87 bd |
| (mg/dL) | CG | 77.65 ± 7.01 | 82.03 ± 10.46 | 68.48 ± 2.82 | 75.53 ± 5.64 |
| Erythrocytes | EG | 5.21 ± 0.26 ab | 5.03 ± 0.19 a | 5.11 ± 0.21 | 5.06 ± 0.25 b |
| (millions/mm3) | CG | 5.06 ± 0.30 a | 4.94 ± 0.29 | 4.88 ± 0.24 | 4.82 ± 0.17 a |
| Hemoglobin | EG | 14.72 ± 1.00 a | 14.20 ± 0.94 a | 14.51 ± 1.03 | 14.43 ± 0.89 |
| (g/dL) | CG | 14.78 ± 1.09 a | 14.40 ± 0.81 | 14.32 ± 0.67 | 14.25 ± 0.80 a |
| Hematocrit | EG | 44.56 ± 2.30 ab | 42.81 ± 2.09 a | 43.54 ± 2.20 | 42.88 ± 1.88 b |
| (%) | CG | 44.37 ± 3.14 a | 43.37 ± 2.36 | 42.75 ± 2.44 | 42.43 ± 1.91 a |
| Urea | EG | 41.02 ± 7.48 a | 40.87 ± 6.65 b | 45.96 ± 8.38 ab | 42.64 ± 5.26 |
| (mg/dL) | CG | 38.12 ± 3.78 | 38.98 ± 4.27 | 41.12 ± 3.11 | 38.17 ± 3.18 |
| Marker | Group | Baseline | Pre-Match | Half-Time | Post-Match |
|---|---|---|---|---|---|
| Calcium | EG | 9.83 ± 0.26 ab | 10.33 ± 0.28 ac | 10.12 ± 0.33 d | 9.37 ± 0.29 bcd |
| (mg/dL) | CG | 9.44 ± 0.34 abc | 10.06 ± 0.13 ad | 9.97 ± 0.37 be | 8.89 ± 0.32 cde |
| Sodium | EG | 138.3 ± 1.06 a | 136.4 ± 1.07 ab | 138.0 ± 1.49 b* | 136.8 ± 1.48 |
| (mEq/L) | CG | 138.0 ± 0.89 ab | 136.0 ± 0.89 a | 135.3 ± 0.82 b | 136.3 ± 0.82 |
| Potassium | EG | 3.75 ± 0.20 abc | 7.29 ± 0.98 ad | 5.79 ± 0.89 bde* | 6.87 ± 1.00 ce |
| (mEq/L) | CG | 3.97 ± 0.12 abc | 6.95 ± 0.76 a | 7.53 ± 0.82 b | 6.67 ± 0.65 c |
Disclaimer/Publisher’s Note: The statements, opinions and data contained in all publications are solely those of the individual author(s) and contributor(s) and not of MDPI and/or the editor(s). MDPI and/or the editor(s) disclaim responsibility for any injury to people or property resulting from any ideas, methods, instructions or products referred to in the content. |
© 2023 by the authors. Licensee MDPI, Basel, Switzerland. This article is an open access article distributed under the terms and conditions of the Creative Commons Attribution (CC BY) license (https://creativecommons.org/licenses/by/4.0/).
Share and Cite
Fornaziero, A.M.; Novack, L.F.; Nascimento, V.B.; Osiecki, R. Acute Responses of Youth Elite Players to a Football Match in Terms of Blood Markers. Sports 2023, 11, 242. https://doi.org/10.3390/sports11120242
Fornaziero AM, Novack LF, Nascimento VB, Osiecki R. Acute Responses of Youth Elite Players to a Football Match in Terms of Blood Markers. Sports. 2023; 11(12):242. https://doi.org/10.3390/sports11120242
Chicago/Turabian StyleFornaziero, André Montanholi, Luiz Fernando Novack, Vitor Bertoli Nascimento, and Raul Osiecki. 2023. "Acute Responses of Youth Elite Players to a Football Match in Terms of Blood Markers" Sports 11, no. 12: 242. https://doi.org/10.3390/sports11120242
APA StyleFornaziero, A. M., Novack, L. F., Nascimento, V. B., & Osiecki, R. (2023). Acute Responses of Youth Elite Players to a Football Match in Terms of Blood Markers. Sports, 11(12), 242. https://doi.org/10.3390/sports11120242