
Validity and Reliability of Wearable Technology Devices during Simulated Pickleball Game Play

 ,
,  , , ,
, , , Highlights
- Wrist-worn (Garmin Instinct, Polar Vantage M2) and bicep-worn (Polar OH1, Polar Verity Sense) devices provide accurate and consistent heart rate readings during pickleball gameplay.
- The Garmin Instinct was inaccurate and inconsistent in measuring energy expenditure in pickleball, while the Polar Vantage M2 was consistent but inaccurate; wearable algorithms need improvement for better heart rate accuracy, especially for varied movements.
- The wearable devices in this study accurately indicate exercise intensity during pickleball gameplay, but players should note they do not provide an accurate measure of calories burned.
Abstract
:1. Introduction
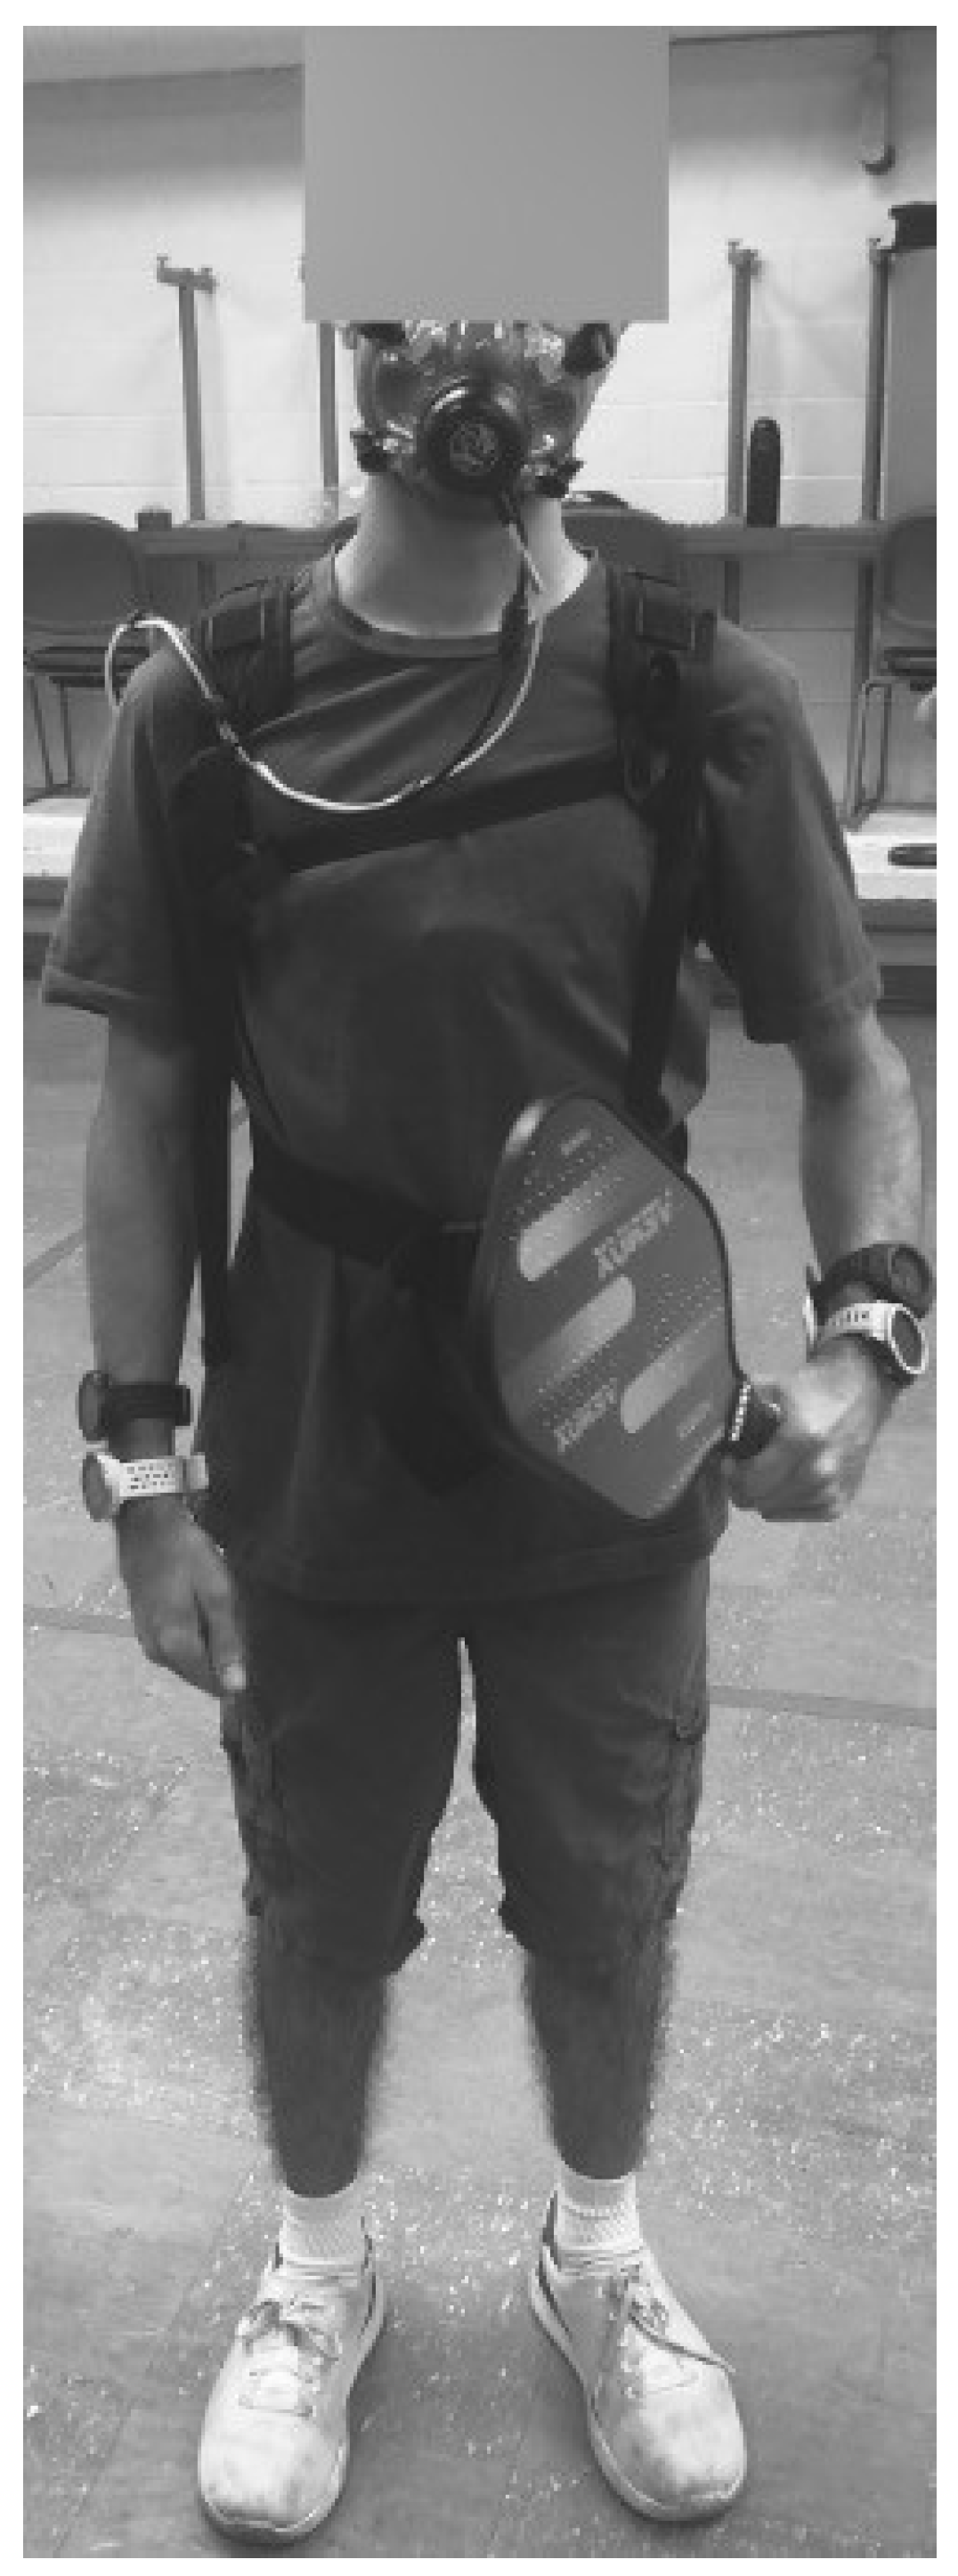
2. Materials and Methods
2.1. Participants
2.2. Protocol
2.3. Data Analysis
3. Results
Sex Disaggregated Data
4. Discussion
5. Conclusions
Author Contributions
Funding
Institutional Review Board Statement
Informed Consent Statement
Data Availability Statement
Acknowledgments
Conflicts of Interest
References
- USA Pickleball. SFIA Topline Report Tabs Pickleball as America’s Fastest-Growing Sport for Third Consecutive Year. Available online: https://usapickleball.org/news/sfia-topline-report-tabs-pickleball-as-americas-fastest-growing-sport/ (accessed on 26 March 2024).
- USA Pickleball. 2023 USA Pickleball Fact Sheet. Available online: https://www.usapickleball.org/docs/USA-Pickleball-Fact-Sheet-2023.pdf (accessed on 26 March 2024).
- USA Pickleball. USA Pickleball Official Rulebook. Available online: https://usapickleball.org/what-is-pickleball/official-rules/ (accessed on 30 March 2024).
- Vitale, K.; Liu, S. Pickleball: Review and Clinical Recommendations for this Fast-growing Sport. Curr. Sports Med. Rep. 2020, 19, 406–413. [Google Scholar] [CrossRef] [PubMed]
- Thompson, W.R. Worldwide Survey of Fitness Trends for 2023. ACSM’s Health Fit. J. 2023, 27, 9–18. [Google Scholar] [CrossRef]
- Iqbal, M.H.; Aydin, A.; Brunckhorst, O.; Dasgupta, P.; Ahmed, K. A review of wearable technology in medicine. J. R. Soc. Med. 2016, 109, 372–380. [Google Scholar] [CrossRef] [PubMed]
- Buzzelli, A.A.; Draper, J.A. Examining the motivation and perceived benefits of pickleball participation in older adults. J. Aging Phys. Act. 2019, 28, 180–186. [Google Scholar] [CrossRef]
- Casper, J.M.; Bocarro, J.N.; Lothary, A.F. An examination of pickleball participation, social connections, and psychological well-being among seniors during the COVID-19 pandemic. World Leis. J. 2021, 63, 330–346. [Google Scholar] [CrossRef]
- Heo, J.; Ryu, J.; Yang, H.; Kim, K.M. Serious leisure and depression in older adults: A study of pickleball players. Leis. Stud. 2018, 37, 561–573. [Google Scholar] [CrossRef]
- Greiner, N. Pickleball: Injury considerations in an increasingly popular sport. Mo. Med. 2019, 116, 488. [Google Scholar]
- Forrester, M.B. Pickleball-related injuries treated in emergency departments. J. Emerg. Med. 2020, 58, 275–279. [Google Scholar] [CrossRef] [PubMed]
- Smith, L.E.; Buchanan, C.A.; Dalleck, L.C. The acute and chronic physiological responses to pickleball in middle-aged and older adults. Int. J. Res. Exerc. Physiol. 2018, 13, 21–32. [Google Scholar]
- Denning, W.; Zagrodnik, J.; Smith, M.; Ruden, T. Physical activity differences between walking and playing pickleball doubles. Sci. Sports 2022, 37, 513.e1–513.e514. [Google Scholar] [CrossRef]
- Webber, S.C.; Anderson, S.; Biccum, L.; Jin, S.; Khawashki, S.; Tittlemier, B.J. Physical activity intensity of singles and doubles pickleball in older adults. J. Aging Phys. Act. 2022, 31, 365–370. [Google Scholar] [CrossRef] [PubMed]
- Lee, I.-M.; Keadle, S.K.; Matthews, C.E. Fitness Trackers to Guide Advice on Activity Prescription. JAMA 2023, 330, 1733–1734. [Google Scholar] [CrossRef] [PubMed]
- Bilić, Z.; Dukarić, V.; Šanjug, S.; Barbaros, P.; Knjaz, D. The Concurrent Validity of Mobile Application for Tracking Tennis Performance. Appl. Sci. 2023, 13, 6195. [Google Scholar] [CrossRef]
- Navalta, J.W.; Davis, D.W.; Malek, E.M.; Carrier, B.; Bodell, N.G.; Manning, J.W.; Cowley, J.; Funk, M.; Lawrence, M.M.; DeBeliso, M. Heart rate processing algorithms and exercise duration on reliability and validity decisions in biceps-worn Polar Verity Sense and OH1 wearables. Sci. Rep. 2023, 13, 11736. [Google Scholar] [CrossRef] [PubMed]
- ANSI/CTA-2056-A; Physical Activity Monitoring for Fitness Wearables: Step Counting. ANSI: Washington, DC, USA, 2016.
- Navalta, J.W.; Davis, D.W.; Carrier, B.; Malek, E.M.; Vargas, N.; Rodriguez, J.P.; Weyers, B.; Carlos, K.; Peck, M. Validity and Reliability of Wearable Devices during Self-Paced Walking, Jogging and Overground Skipping. Sport. Mont. 2023, 21, 23–29. [Google Scholar] [CrossRef]
- Heidari, S.; Babor, T.F.; De Castro, P.; Tort, S.; Curno, M. Sex and gender equity in research: Rationale for the SAGER guidelines and recommended use. Res. Integr. Peer Rev. 2016, 1, 1–9. [Google Scholar]
- Muggeridge, D.J.; Hickson, K.; Davies, A.V.; Giggins, O.M.; Megson, I.L.; Gorely, T.; Crabtree, D.R. Measurement of Heart Rate Using the Polar OH1 and Fitbit Charge 3 Wearable Devices in Healthy Adults During Light, Moderate, Vigorous, and Sprint-Based Exercise: Validation Study. JMIR Mhealth Uhealth 2021, 9, e25313. [Google Scholar] [CrossRef]
- Olstad, B.H.; Zinner, C. Validation of the Polar OH1 and M600 optical heart rate sensors during front crawl swim training. PLoS ONE 2020, 15, e0231522. [Google Scholar] [CrossRef]
- Schubert, M.M.; Clark, A.; De La Rosa, A.B. The Polar ((R)) OH1 Optical Heart Rate Sensor is Valid during Moderate-Vigorous Exercise. Sports Med. Int. Open 2018, 2, E67–E70. [Google Scholar] [CrossRef]
- Hettiarachchi, I.T.; Hanoun, S.; Nahavandi, D.; Nahavandi, S. Validation of Polar OH1 optical heart rate sensor for moderate and high intensity physical activities. PLoS ONE 2019, 14, e0217288. [Google Scholar] [CrossRef]
- Hermand, E.; Cassirame, J.; Ennequin, G.; Hue, O. Validation of a Photoplethysmographic Heart Rate Monitor: Polar OH1. Int. J. Sports Med. 2019, 40, 462–467. [Google Scholar] [CrossRef]
- Bodell, N.; Carrier, B.; Gil, D.; Fullmer, W.; Cruz, K.; Aguilar, C.D.; Davis, D.W.; Malek, E.M.; Montes, J.; Manning, J.W. Validity of average heart rate and energy expenditure in Polar OH1 and Verity Sense while self-paced walking. Int. J. Exerc. Sci. Conf. Proc. 2021, 14, 69. [Google Scholar]
- Lopez-Belmonte, O.; Febles-Castro, A.; Gay, A.; Cuenca-Fernandez, F.; Arellano, R.; Ruiz-Navarro, J.J. Validity of the polar verity sense during swimming at different locations and intensities. Scand. J. Med. Sci. Sports 2023, 33, 2623–2625. [Google Scholar] [CrossRef] [PubMed]
- Alfonso, C.; Garcia-Gonzalez, M.A.; Parrado, E.; Gil-Rojas, J.; Ramos-Castro, J.; Capdevila, L. Agreement between two photoplethysmography-based wearable devices for monitoring heart rate during different physical activity situations: A new analysis methodology. Sci. Rep. 2022, 12, 15448. [Google Scholar] [CrossRef]
- Zarei, S.; Cruz, S.; Carrier, B.; Davis, D.W.; Bovell, J.; Sweder, T.; Blank, M.; Malek, E.M.; Navalta, J.W. Validity and Reliability of the Garmin Instinct in Measuring Heart Rate during Pickleball. Int. J. Exerc. Sci. Conf. Proc. 2023, 14, 134. [Google Scholar]
- Pearce, D.R.; Ellingford, B.; Carrier, B.; Aguilar, C.D.; Gil, D.; Torres, M.; Davis, D.W.; Zielger, W.; Fullmer, W.; Peck, M. Concurrent validity and reliability of average heart rate and energy expenditure of identical Garmin Instinct watches during low intensity resistance training. Int. J. Exerc. Sci. Conf. Proc. 2022, 14, 159. [Google Scholar]
- Thornton, T.; Ziegler, W.; Maxwell, S.; McKenzie, A.; Routsis, A.; Ziegler, K.; Carrier, B.; Aguilar, C.; Green, D.; Bovell, J. Heart Rate and Energy Expenditure Concurrent Validity of Identical Garmin Wrist Watches During Moderately Heavy Resistance Training. Int. J. Exerc. Sci. Conf. Proc. 2023, 14, 138. [Google Scholar]
- Pearce, D.R.; Graffius, J.M.; Ellingford, B.; Carrier, B.; Aguilar, C.D.; Gil, D.; Torres, M.; Davis, D.W.; Ziegler, W.; Fullmer, W.; et al. Heart Rate And Energy Expenditure Validity And Reliability In Garmin Instinct Watches during Resistance Training: 1186. Med. Sci. Sports Exerc. 2023, 55, 382–383. [Google Scholar] [CrossRef]
- Bunn, J.A.; Navalta, J.W.; Fountaine, C.J.; Reece, J.D. Current State of Commercial Wearable Technology in Physical Activity Monitoring 2015–2017. Int. J. Exerc. Sci. 2018, 11, 503–515. [Google Scholar]
- Reddy, R.K.; Pooni, R.; Zaharieva, D.P.; Senf, B.; El Youssef, J.; Dassau, E.; Doyle Iii, F.J.; Clements, M.A.; Rickels, M.R.; Patton, S.R.; et al. Accuracy of Wrist-Worn Activity Monitors during Common Daily Physical Activities and Types of Structured Exercise: Evaluation Study. JMIR Mhealth Uhealth 2018, 6, e10338. [Google Scholar] [CrossRef]
- Murakami, H.; Kawakami, R.; Nakae, S.; Yamada, Y.; Nakata, Y.; Ohkawara, K.; Sasai, H.; Ishikawa-Takata, K.; Tanaka, S.; Miyachi, M. Accuracy of 12 Wearable Devices for Estimating Physical Activity Energy Expenditure Using a Metabolic Chamber and the Doubly Labeled Water Method: Validation Study. JMIR Mhealth Uhealth 2019, 7, e13938. [Google Scholar] [CrossRef] [PubMed]
- Hajj-Boutros, G.; Landry-Duval, M.A.; Comtois, A.S.; Gouspillou, G.; Karelis, A.D. Wrist-worn devices for the measurement of heart rate and energy expenditure: A validation study for the Apple Watch 6, Polar Vantage V and Fitbit Sense. Eur. J. Sport. Sci. 2023, 23, 165–177. [Google Scholar] [CrossRef] [PubMed]
- Taffe, P. When can the Bland & Altman limits of agreement method be used and when it should not be used. J. Clin. Epidemiol. 2021, 137, 176–181. [Google Scholar] [CrossRef] [PubMed]

| Polar H10 | Garmin Instinct 1 | Garmin Instinct 2 | Polar Verity Sense 1 | Polar Verity Sense 2 | Polar OH1 1 | Polar OH1 2 | |
|---|---|---|---|---|---|---|---|
| Average (bpm) | 130.89 | 124.78 | 124.42 | 129.32 | 129.19 | 128.32 | 130.59 |
| Standard Deviation | 21.02 | 23.93 | 24.41 | 22.04 | 21.91 | 21.97 | 21.52 |
| Count | 14,291 | 6163 | 5310 | 13,682 | 14,191 | 13,853 | 10,474 |
| Variance | 441.97 | 572.54 | 595.87 | 485.73 | 479.85 | 482.77 | 463.18 |
| MAPE | 6.32% | 5.73% | 2.97% | 2.92% | 3.39% | 3.45% | |
| Pearson Correlation | 0.85 | 0.88 | 0.96 | 0.96 | 0.93 | 0.94 | |
| Lin’s Concordance | 0.82 | 0.84 | 0.95 | 0.96 | 0.93 | 0.94 | |
| Repeated Measures Correlation | 0.87 | 0.89 | 0.92 | 0.94 | 0.92 | 0.90 | |
| Mean Difference | 5.67 | 5.34 | 1.91 | 1.84 | 2.58 | 2.25 | |
| SE Difference | 0.16 | 0.16 | 0.06 | 0.05 | 0.07 | 0.07 | |
| Lower 90% CI Difference | 5.41 | 5.09 | 1.82 | 1.76 | 2.47 | 2.13 | |
| Upper 90% CI Difference | 5.94 | 5.60 | 2.01 | 1.92 | 2.70 | 2.37 | |
| Equivalence Interval (10% of criterion average) | 13.09 | ||||||
| Equivalence Testing Result | Equivalence Supported | Equivalence Supported | Equivalence Supported | Equivalence Supported | Equivalence Supported | Equivalence Supported | |
| Deming Regression Slope | −19.06 | −24.18 | −6.69 | −7.59 | −7.19 | −2.90 | |
| Deming Regression Intercept | 1.10 | 1.15 | 1.04 | 1.04 | 1.04 | 1.00 | |
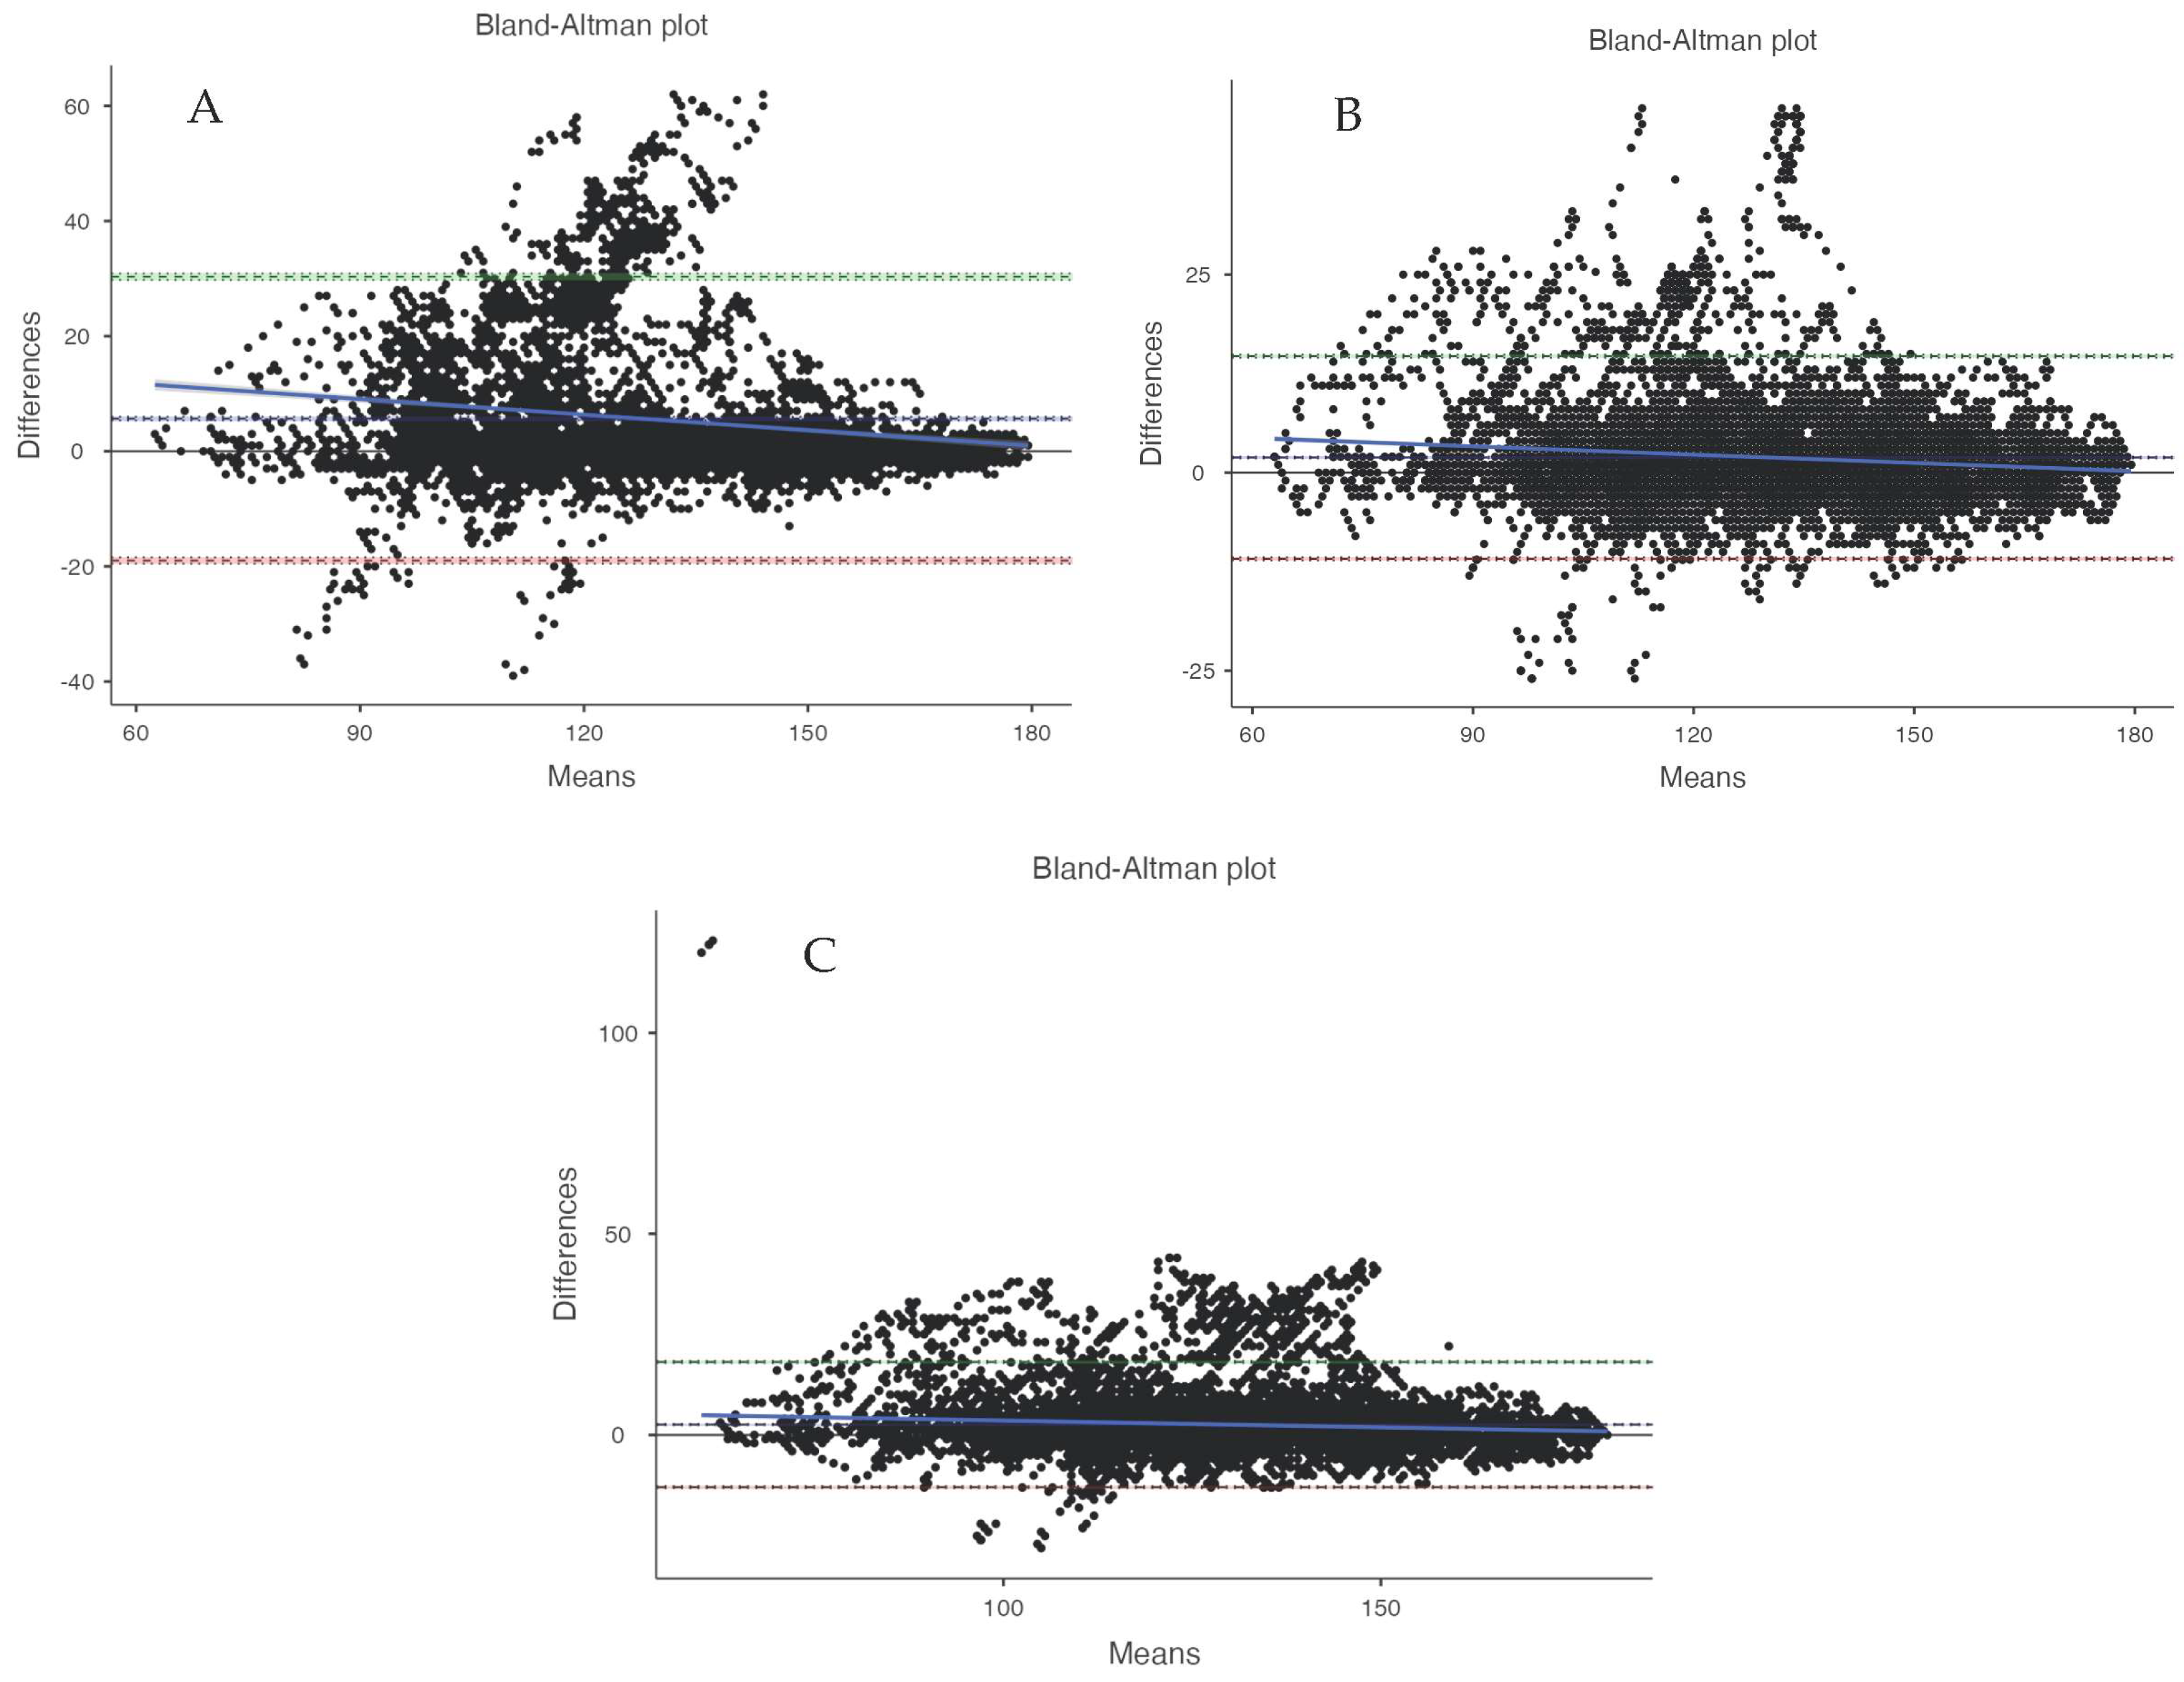
| Bland–Altman Bias | 5.67 (5.36, 5.99) | 5.34 (5.04, 5.65) | 1.91 (1.80, 2.02) | 1.87 (1.74, 1.94) | 2.58 (2.45, 2.72) | 2.25 (2.11, 2.39) | |
| Bland–Altman Lower Limit of Agreement | −18.98 | −17.06 | −10.87 | −9.97 | −12.92 | −12.20 | |
| Bland–Altman Upper Limit of Agreement | 30.32 | 27.75 | 14.70 | 13.65 | 18.09 | 16.69 | |
| Bland–Altman t-statistic, p-value | 35.33, <0.001 | 33.99, <0.001 | 34.18, <0.001 | 36.26, <0.001 | 38.31, <0.001 | 31.04, <0.001 | |
| Bland–Altman regression, p-value | 0.065, <0.001 | 0.167, <0.001 | 0.065, <0.001 | 0.103, <0.001 | 0.029, <0.001 | 0.044, <0.001 | |
| Reliability Testing | |||||||
| CV | 9.30% | 2.68% | 5.01% | ||||
| SEM (bpm) | 11.5861 | 3.4655 | 6.4797 | ||||
| ICC (two-way fixed) | 0.77 (0.76, 0.78) | 0.98 (0.97, 0.98) | 0.91 (0.91, 0.91) | ||||
| COSMED K5 | Garmin Instinct 1 | Garmin Instinct 2 | Polar Vantage M2 1 | Polar Vantage M2 2 | |
|---|---|---|---|---|---|
| Accumulated total (kcal) | 42.28 | 41.85 | 49.33 | 42.06 | 39.40 |
| Standard Deviation | 9.03 | 17.84 | 17.92 | 15.40 | 19.48 |
| Count | 40 | 40 | 40 | 18 | 10 |
| Variance | 81.54 | 318.34 | 321.10 | 237.23 | 379.60 |
| MAPE | 28.08% | 27.67% | 18.87% | 23.38% | |
| Pearson Correlation | 0.59 | 0.69 | 0.69 | 0.71 | |
| Lin’s Concordance | 0.47 | 0.49 | 0.63 | 0.62 | |
| Mean Difference | 0.42 | −7.05 | −1.22 | 3.9 | |
| SE Difference | 2.3 | 2.12 | 2.64 | 4.36 | |
| Lower 90% CI Difference | −3.44 | −10.62 | −5.81 | −4.09 | |
| Upper 90% CI Difference | 4.29 | −3.48 | 3.36 | 11.89 | |
| Equivalence Interval (10% of criterion average) | 4.2275 | ||||
| Equivalence Testing Result | Equivalence Not Supported | Equivalence Not Supported | Equivalence Not Supported | Equivalence Not Supported | |
| Deming Regression Slope | 2.85 | 2.55 | 1.8 | 1.92 | |
| Deming Regression Intercept | −78.83 | −58.28 | −31.46 | −43.94 | |
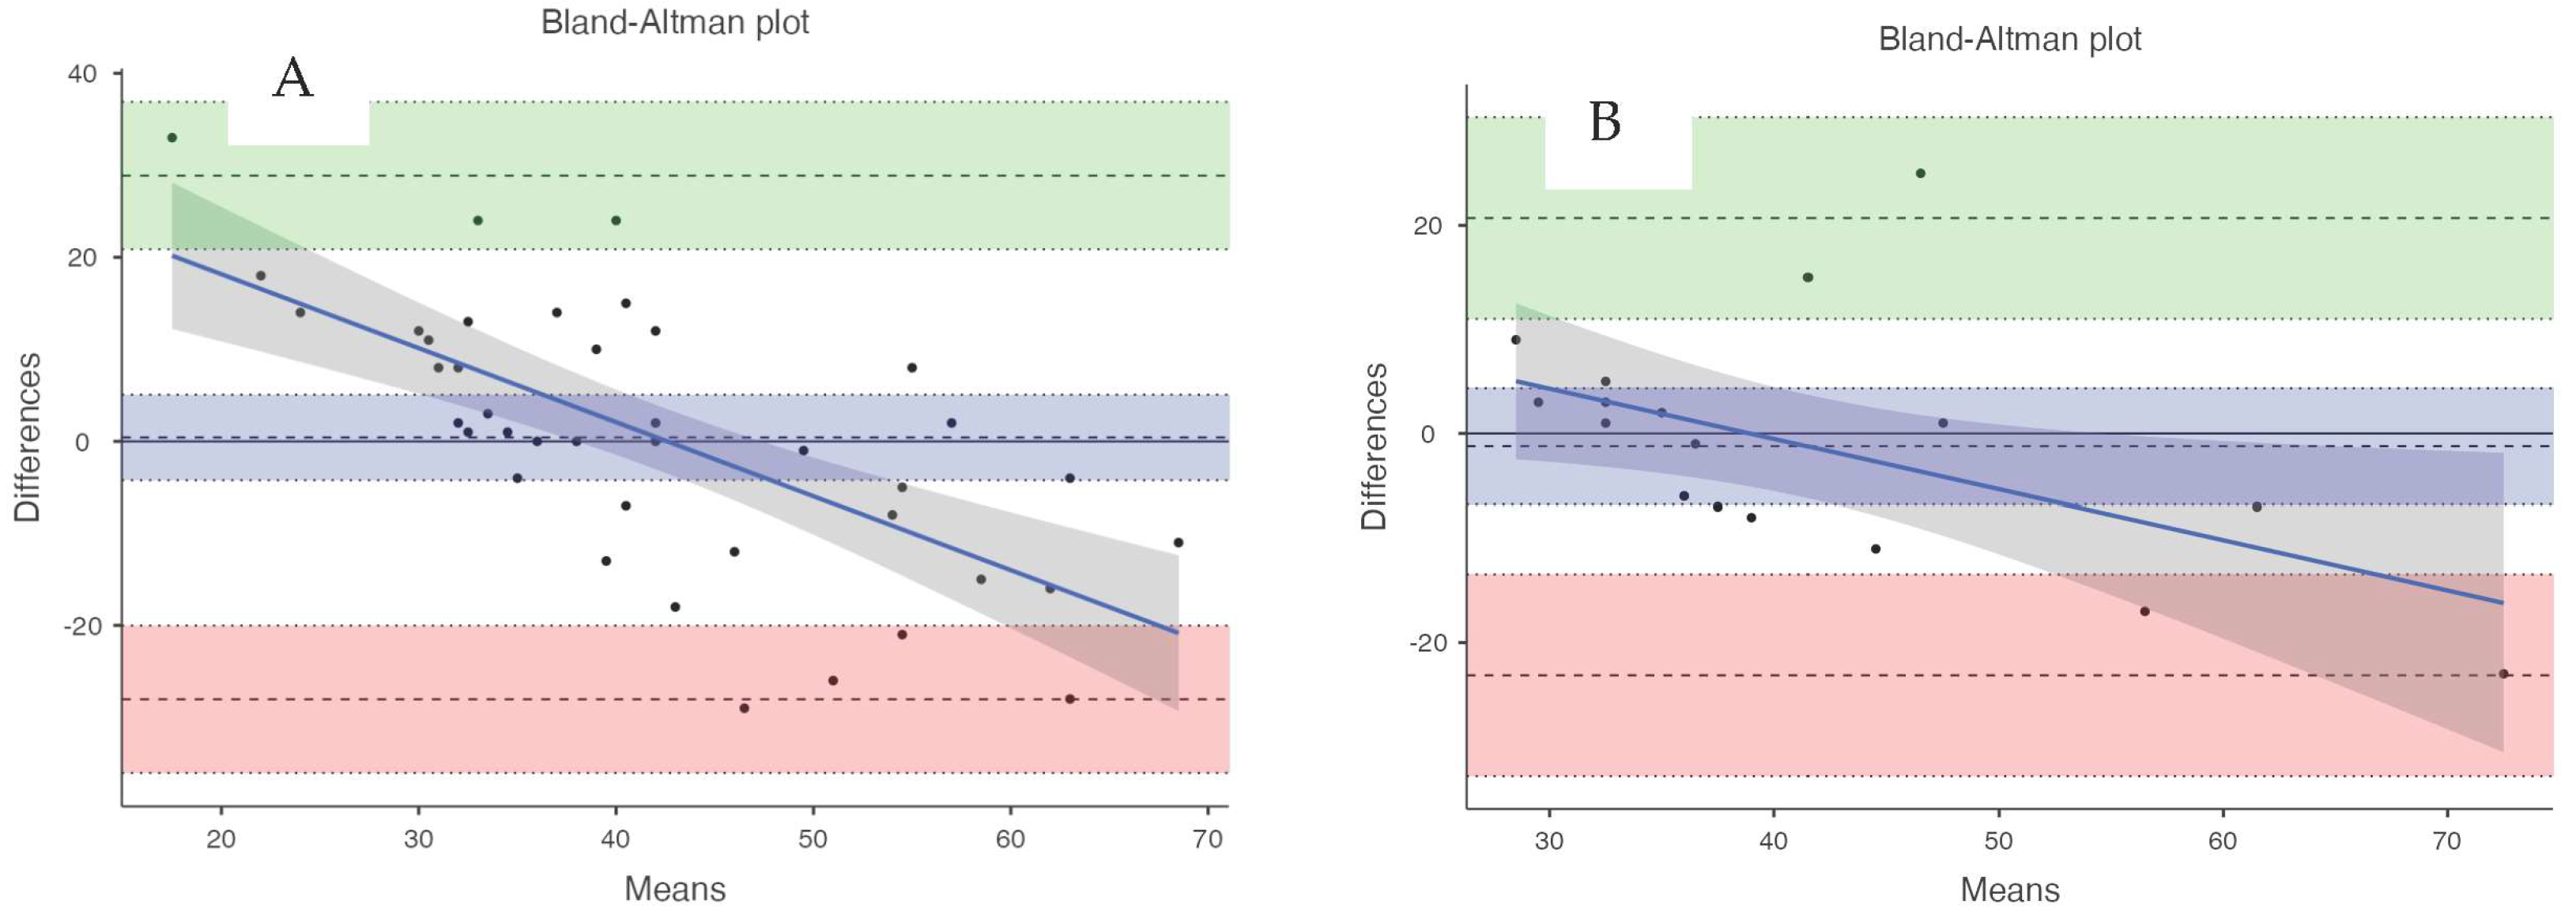
| Bland–Altman Bias | 0.42 (−4.22, 5.07) | −7.05 (−11.34, −2.76) | −1.22 (−6.78, 4.34) | 3.90 (−5.96, 13.76) | |
| Bland–Altman Lower Limit of Agreement | −28.03 | −33.35 | −23.15 | −23.11 | |
| Bland–Altman Upper Limit of Agreement | 28.88 | 19.25 | 20.7 | 30.91 | |
| Bland–Altman t-statistic, p-value | 0.19, 0.854 | 3.32, 0.002 | 0.46, 0.649 | 0.89, 0.394 | |
| Bland–Altman regression, p-value | 0.538, <0.001 | 0.607, <0.001 | 0.377, <0.001 | 0.377, 0.123 | |
| Reliability Analysis | |||||
| CV | 14.69% | 6.01% | |||
| SEM (kcal) | 6.6948 | 2.4725 | |||
| ICC (two-way fixed) | 0.86 | 0.98 | |||
| Sex | Hand | RF (br/min) | VT (L) | VE (L/min) | RER | VO2 (mL/Kg/min) | FAT% | CHO% |
|---|---|---|---|---|---|---|---|---|
| Female (n = 7) | Dominant | 36.44 ± 5.44 | 1.09 ± 0.13 | 39.74 ± 8.88 | 0.79 ± 0.07 | 21.00 ± 4.17 | 70.90 ± 22.51 | 29.10 ± 22.51 |
| Non | 37.90 ± 4.76 | 1.06 ± 0.15 | 39.60 ± 5.01 | 0.79 ± 0.06 | 20.70 ± 2.31 | 69.57 ± 19.39 | 30.43 ± 19.39 | |
| Male (n = 13) | Dominant | 38.74 ± 6.06 | 1.49 ± 0.34 | 57.31 ± 13.20 | 0.82 ± 0.08 | 27.12 ± 5.52 | 59.48 ± 24.21 | 40.52 ± 24.21 |
| Non | 39.94 ± 5.43 | 1.38 ± 0.27 | 54.26 ± 11.28 | 0.83 ± 0.05 | 24.68 ± 4.27 | 58.31 ± 17.63 | 41.69 ± 17.63 |
Disclaimer/Publisher’s Note: The statements, opinions and data contained in all publications are solely those of the individual author(s) and contributor(s) and not of MDPI and/or the editor(s). MDPI and/or the editor(s) disclaim responsibility for any injury to people or property resulting from any ideas, methods, instructions or products referred to in the content. |
© 2024 by the authors. Licensee MDPI, Basel, Switzerland. This article is an open access article distributed under the terms and conditions of the Creative Commons Attribution (CC BY) license (https://creativecommons.org/licenses/by/4.0/).
Share and Cite
Navalta, J.W.; Carrier, B.; Blank, M.; Zarei, S.; Davis, D.W.; Craig, M.; Perez, O.R.; Baca, J.; Sweder, T.S.; Carballo, T.; et al. Validity and Reliability of Wearable Technology Devices during Simulated Pickleball Game Play. Sports 2024, 12, 234. https://doi.org/10.3390/sports12090234
Navalta JW, Carrier B, Blank M, Zarei S, Davis DW, Craig M, Perez OR, Baca J, Sweder TS, Carballo T, et al. Validity and Reliability of Wearable Technology Devices during Simulated Pickleball Game Play. Sports. 2024; 12(9):234. https://doi.org/10.3390/sports12090234
Chicago/Turabian StyleNavalta, James W., Bryson Carrier, Matahn Blank, Setareh Zarei, Dustin W. Davis, Micah Craig, Olivia R. Perez, Jacob Baca, Thea S. Sweder, Tashari Carballo, and et al. 2024. "Validity and Reliability of Wearable Technology Devices during Simulated Pickleball Game Play" Sports 12, no. 9: 234. https://doi.org/10.3390/sports12090234
APA StyleNavalta, J. W., Carrier, B., Blank, M., Zarei, S., Davis, D. W., Craig, M., Perez, O. R., Baca, J., Sweder, T. S., Carballo, T., & Bovell, J. (2024). Validity and Reliability of Wearable Technology Devices during Simulated Pickleball Game Play. Sports, 12(9), 234. https://doi.org/10.3390/sports12090234