

Analysis of Velocity, Power and Skin Temperature in Paralympic Powerlifting Athletes with Fixed and Variable Resistance

 ,
,  ,
,  , ,
, ,  , ,
, ,  , and
, and 
Abstract
1. Introduction
2. Materials and Methods
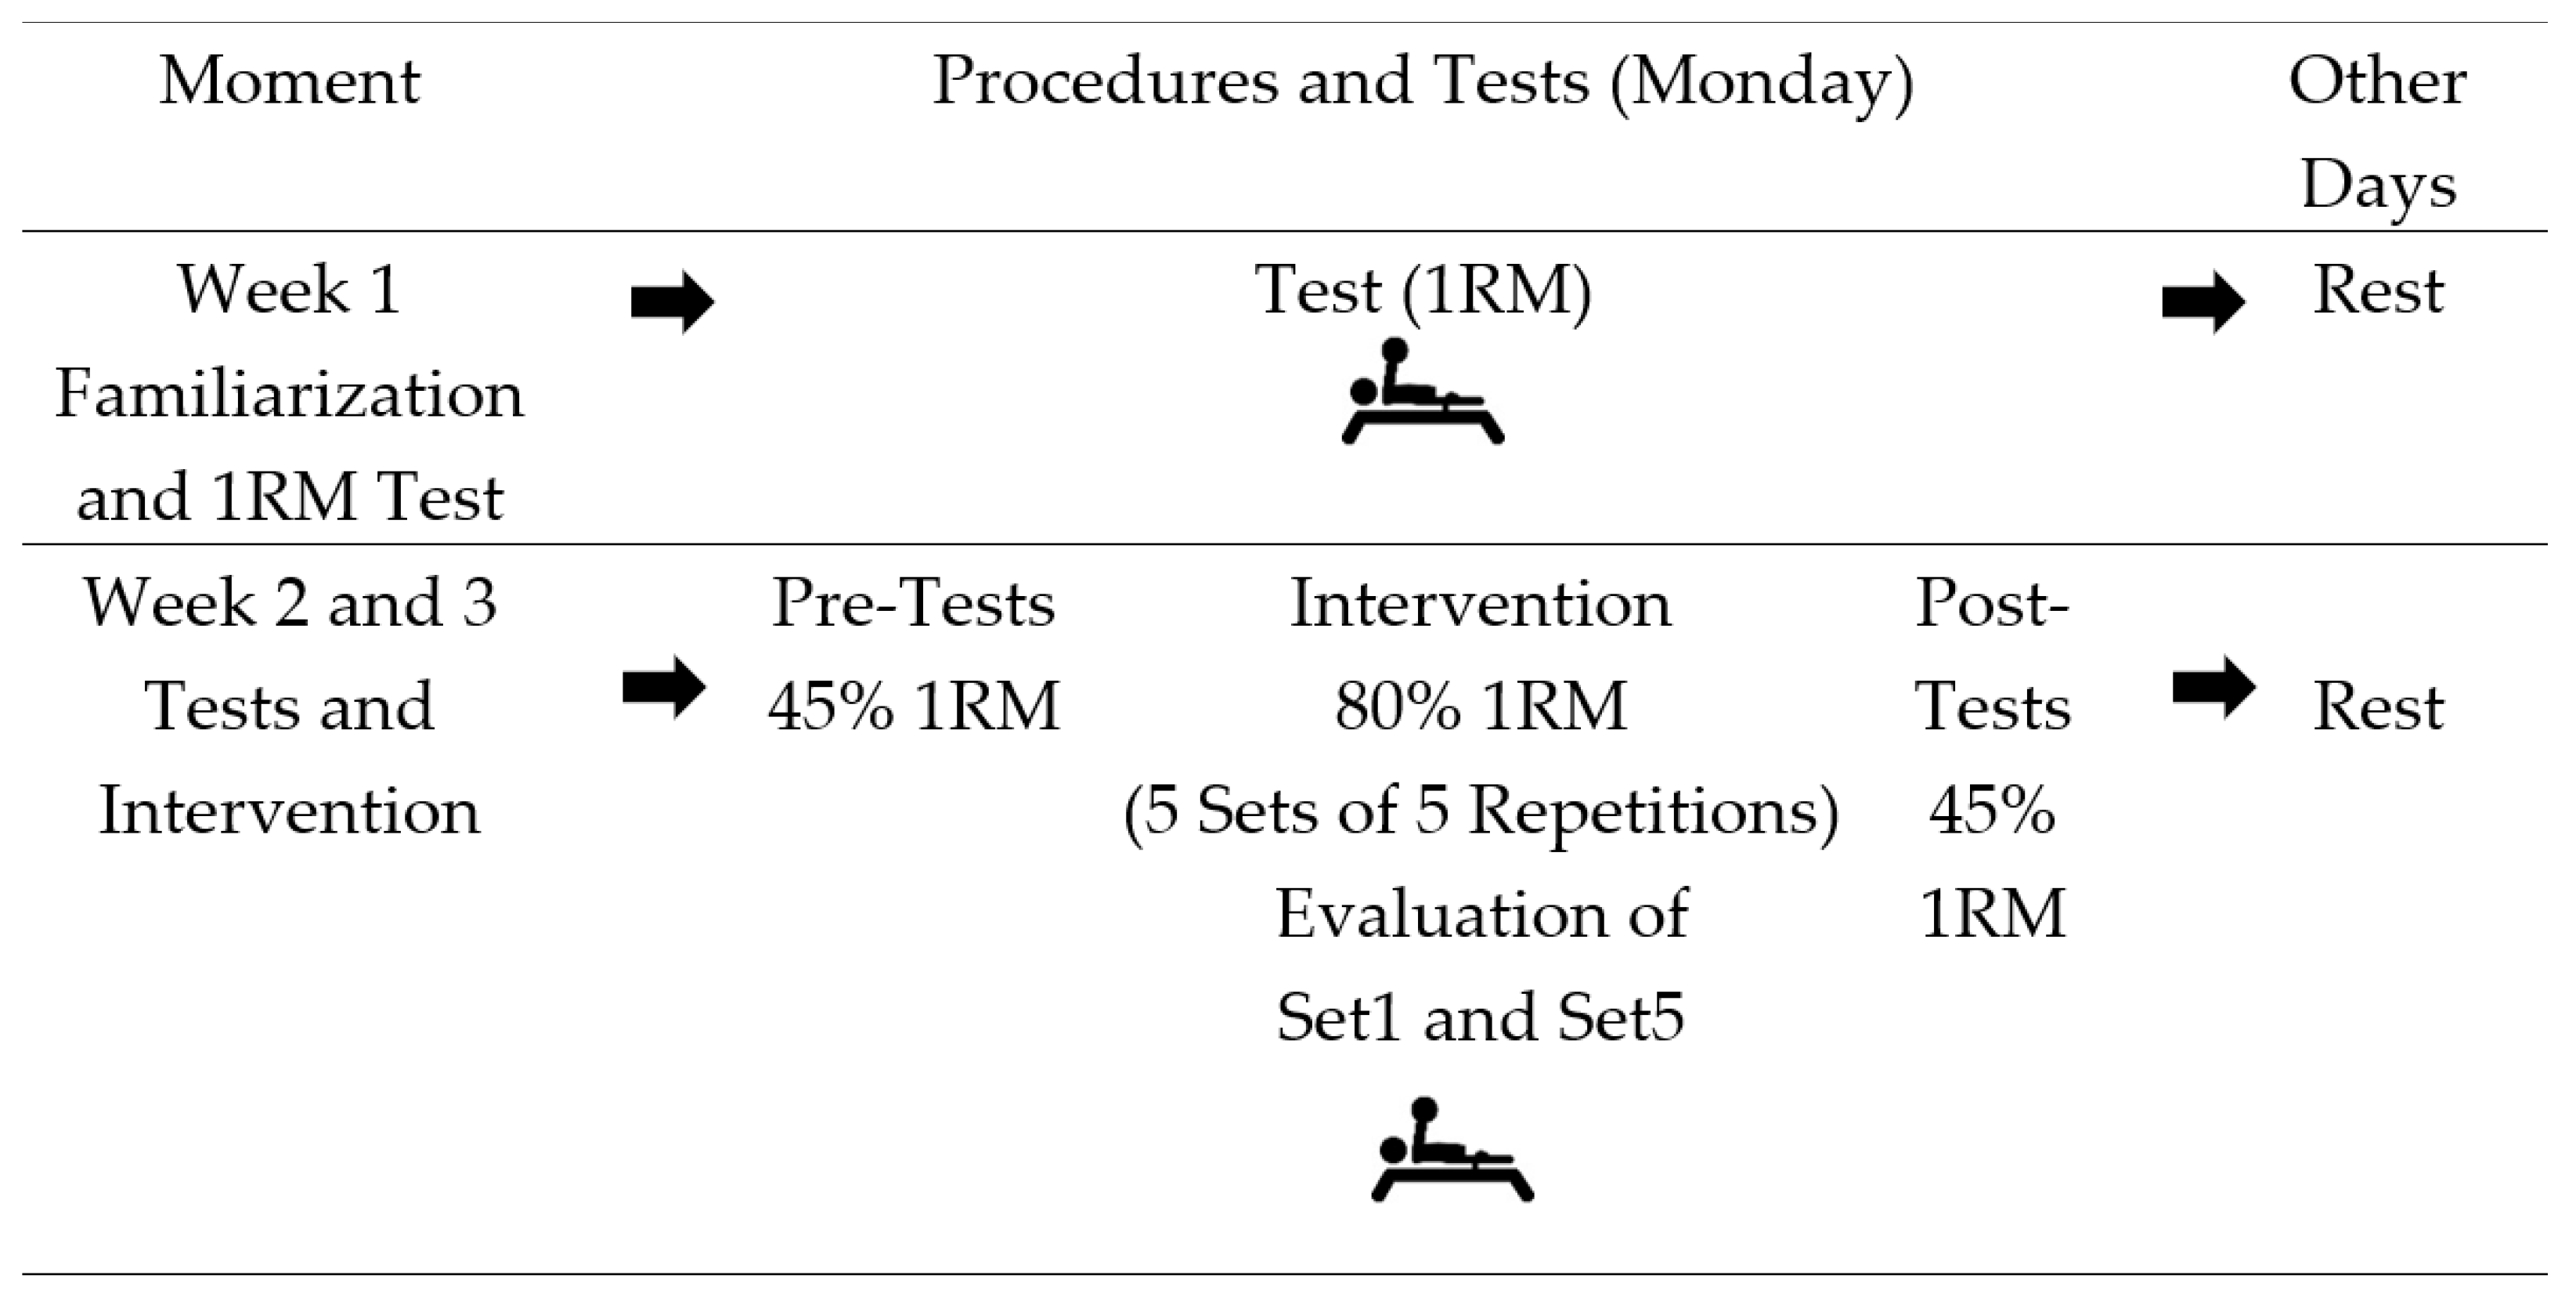
2.1. Design
2.2. Sample
2.3. Instruments and Procedures
2.4. Maximum Load Test (1RM)
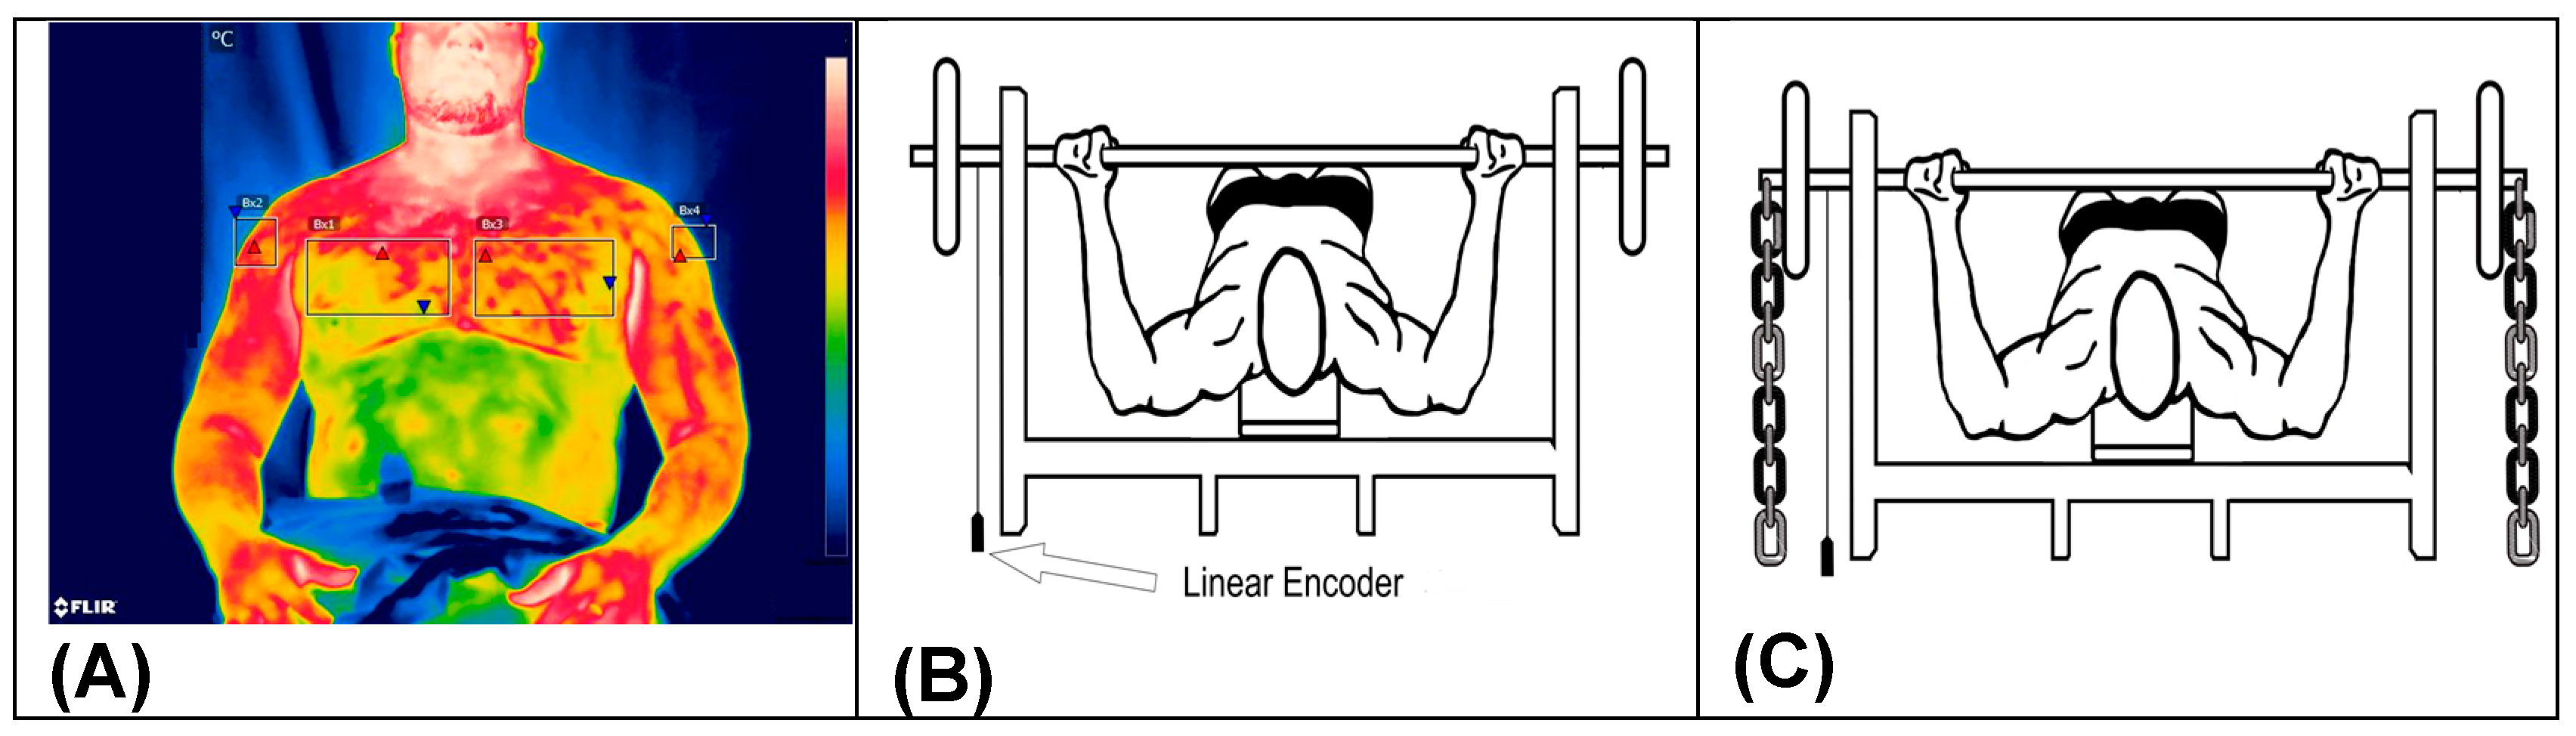
2.5. Dynamic Force Measurements
2.6. Skin Temperature Measurement
2.7. Overload with the Use of Chains
2.8. Statistics
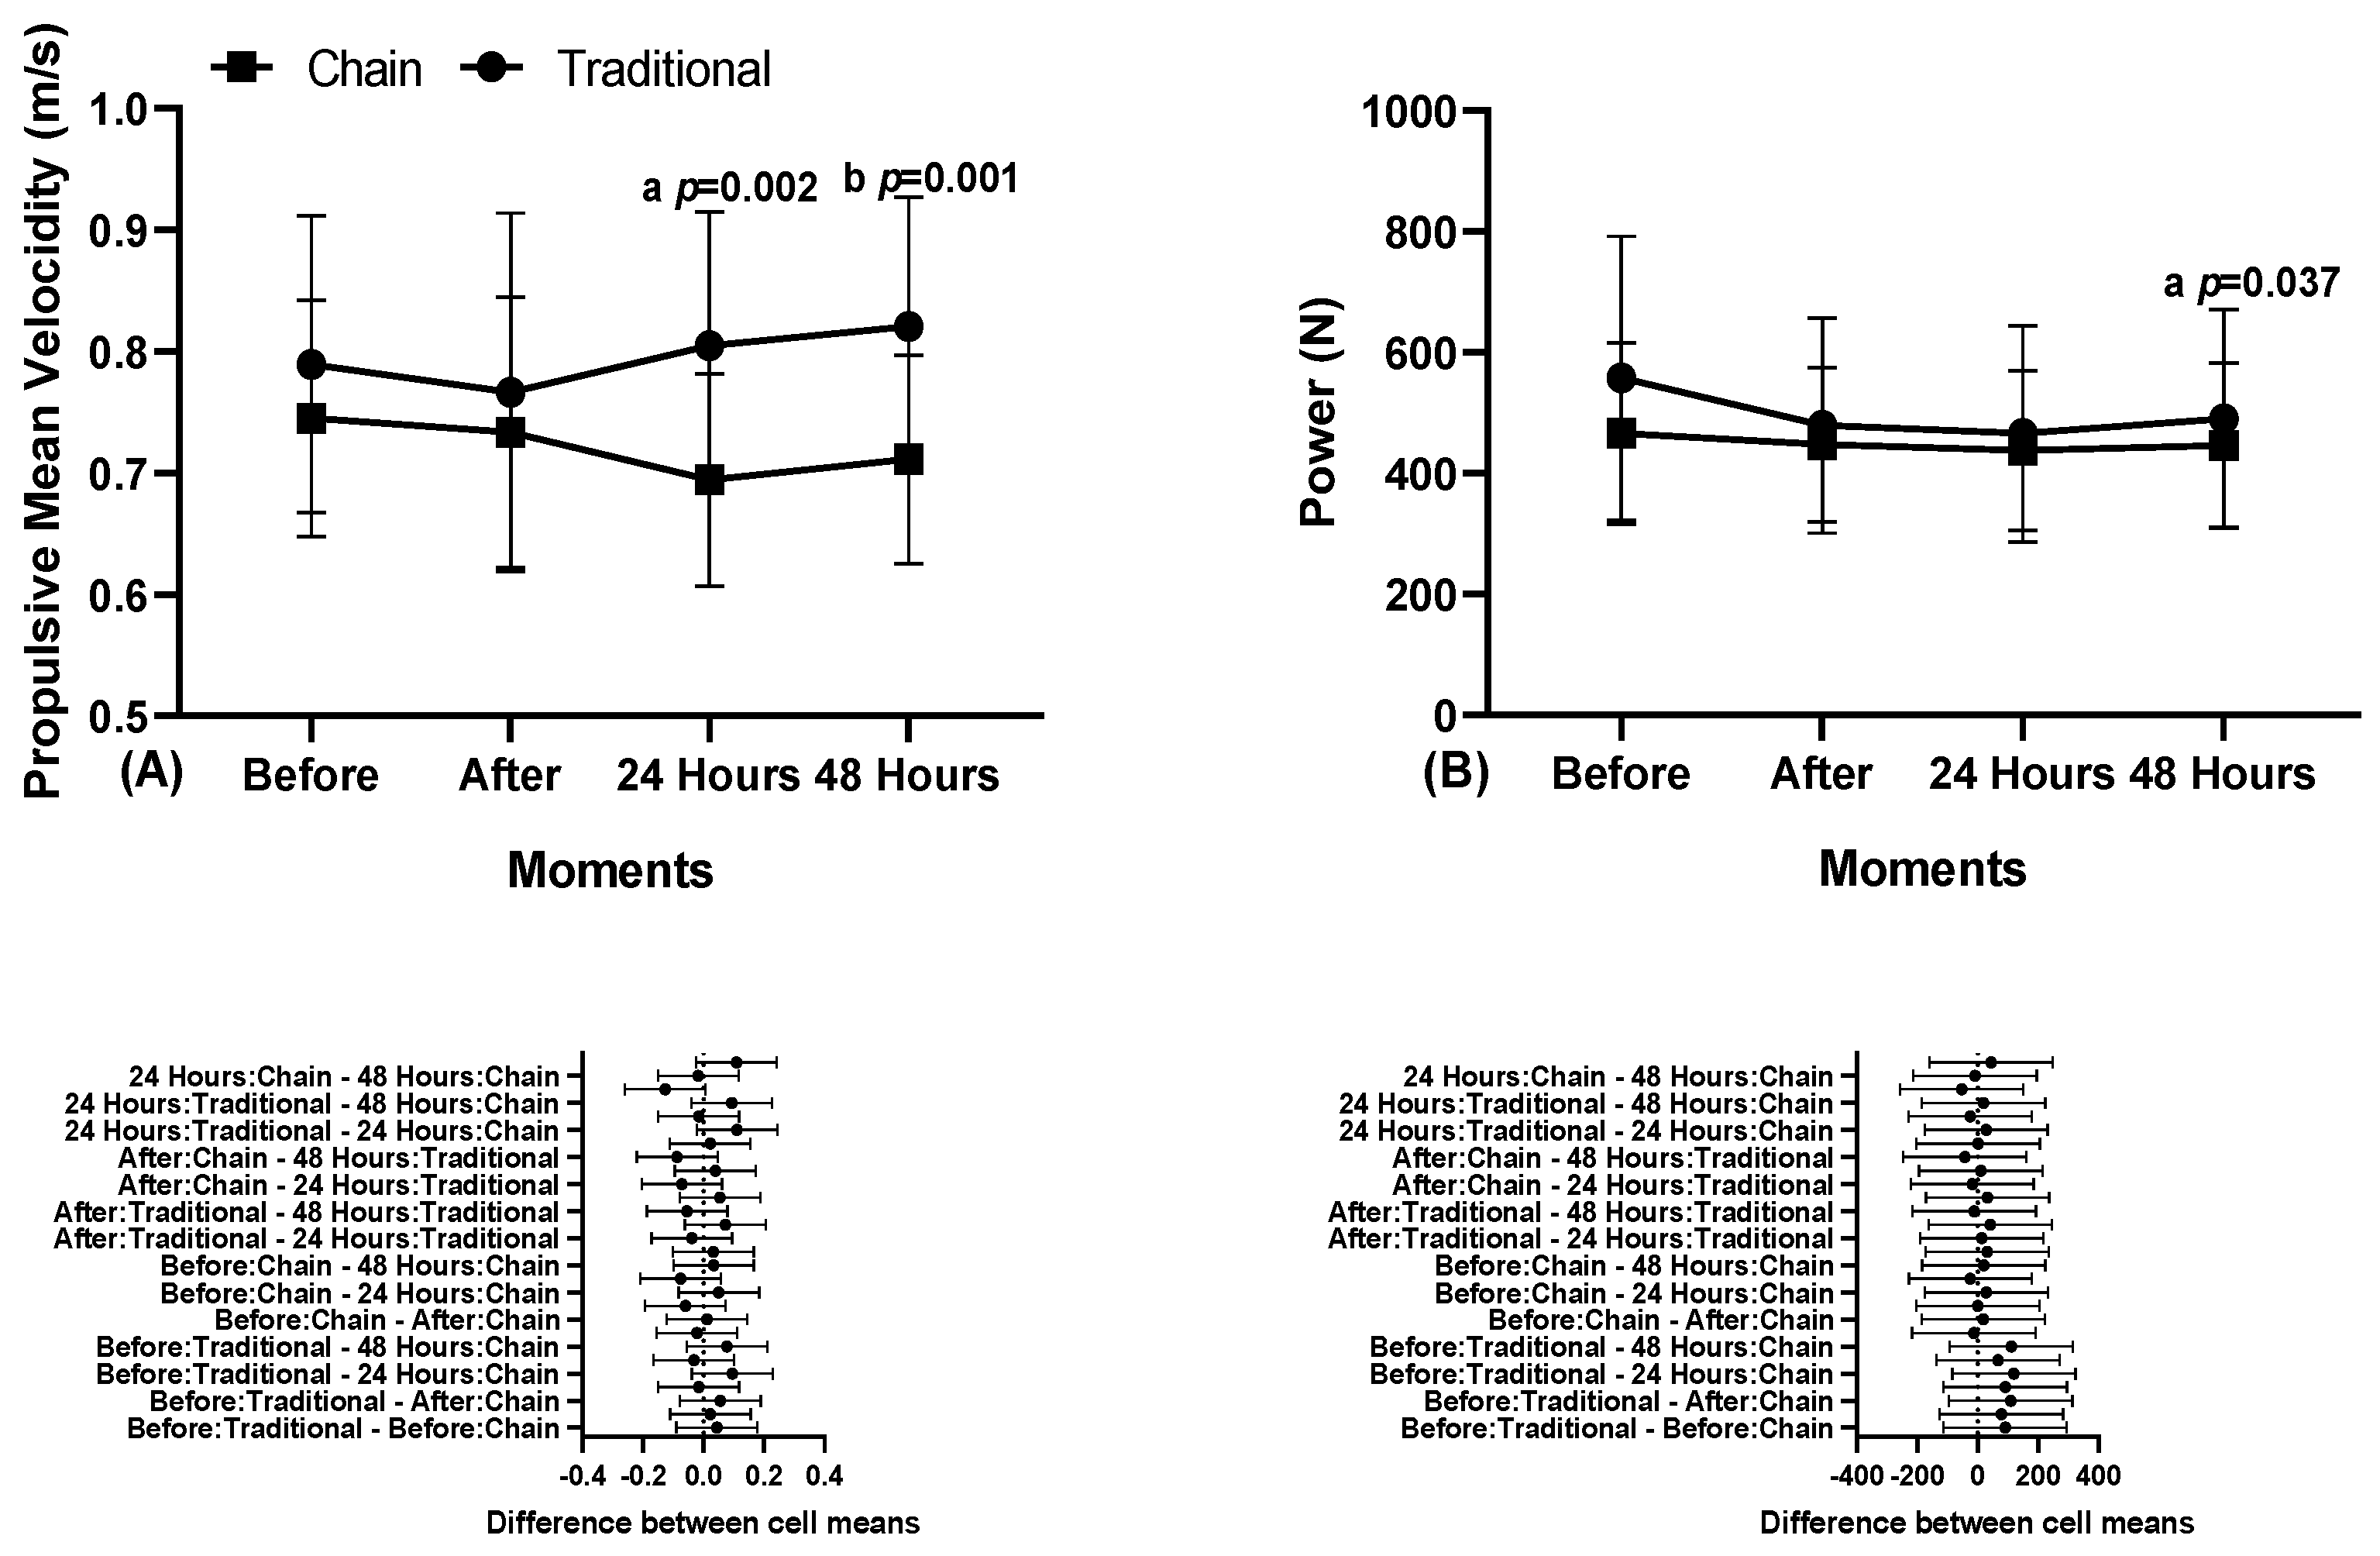
3. Results
4. Discussion
5. Conclusions
Author Contributions
Funding
Institutional Review Board Statement
Informed Consent Statement
Data Availability Statement
Conflicts of Interest
References
- Androulakis-Korakakis, P.; Michalopoulos, N.; Fisher, J.P.; Keogh, J.; Loenneke, J.P.; Helms, E.; Wolf, M.; Nuckols, G.; Steele, J. The Minimum Effective Training Dose Required for 1RM Strength in Powerlifters. Front. Sports Act. Living 2021, 3, 713655. [Google Scholar] [CrossRef] [PubMed]
- Newton, R.U.; Murphy, A.J.; Humphries, B.J.; Wilson, G.J.; Kraemer, W.J.; Häkkinen, K. Influence of Load and Stretch Shortening Cycle on the Kinematics, Kinetics and Muscle Activation That Occurs during Explosive Upper-Body Movements. Eur. J. Appl. Physiol. 1997, 75, 333–342. [Google Scholar] [CrossRef] [PubMed]
- Lander, J.E.; Bates, B.T.; Sawhill, J.A.; Hamill, J. A Comparison between Free-Weight and Isokinetic Bench Pressing. Med. Sci. Sports Exerc. 1985, 17, 344–353. [Google Scholar] [CrossRef] [PubMed]
- Sanchez-Medina, L.; Perez, C.E.; Gonzalez-Badillo, J.J. Importance of the Propulsive Phase in Strength Assessment. Int. J. Sports Med. 2010, 31, 123–129. [Google Scholar] [CrossRef] [PubMed]
- McMaster, D.T.; Cronin, J.; McGuigan, M. Forms of Variable Resistance Training. Strength Cond. J. 2009, 31, 50–64. [Google Scholar] [CrossRef]
- Lin, Y.; Xu, Y.; Hong, F.; Li, J.; Ye, W.; Korivi, M. Effects of Variable-Resistance Training Versus Constant-Resistance Training on Maximum Strength: A Systematic Review and Meta-Analysis. Int. J. Environ. Res. Public Health 2022, 19, 8559. [Google Scholar] [CrossRef]
- Shi, L.; Cai, Z.; Chen, S.; Han, D. Acute Effects of Variable Resistance Training on Force, Velocity, and Power Measures: A Systematic Review and Meta-Analysis. PeerJ 2022, 10, e13870. [Google Scholar] [CrossRef]
- Aidar, F.J.; Clemente, F.M.; de Lima, L.F.; de Matos, D.G.; Ferreira, A.R.P.; Marçal, A.C.; Moreira, O.C.; Bulhões-Correia, A.; de Almeida-Neto, P.F.; Díaz-de-Durana, A.L.; et al. Evaluation of Training with Elastic Bands on Strength and Fatigue Indicators in Paralympic Powerlifting. Sports 2021, 9, 142. [Google Scholar] [CrossRef]
- Shaw, M.P.; Andersen, V.; Sæterbakken, A.H.; Paulsen, G.; Samnøy, L.E.; Solstad, T.E.J. Contemporary Training Practices of Norwegian Powerlifters. J. Strength Cond. Res. 2022, 36, 2544–2551. [Google Scholar] [CrossRef]
- Swinton, P.A.; Lloyd, R.; Agouris, I.; Stewart, A. Contemporary Training Practices in Elite British Powerlifters: Survey Results from an International Competition. J. Strength Cond. Res. 2009, 23, 380–384. [Google Scholar] [CrossRef]
- Getirana-Mota, M.; Aidar, F.J.; Ribeiro Neto, F.; Santos, T.P.; de Almeida-Neto, P.F.; de Araújo Tinôco Cabral, B.G.; Vieira-Souza, L.M.; Garrido, N.D.; Reis, V.M.; Souza, R.F. Comparison of Neuromuscular Fatigue in Powerlifting Paralympics in Different Training Methods. Sports Med. Int. Open 2024, 8, a22077922. [Google Scholar] [CrossRef] [PubMed]
- Loturco, I.; Pereira, L.A.; Winckler, C.; Santos, W.L.; Kobal, R.; McGuigan, M. Load-Velocity Relationship in National Paralympic Powerlifters: A Case Study. Int. J. Sports Physiol. Perform. 2019, 14, 531–535. [Google Scholar] [CrossRef] [PubMed]
- van den Hoek, D.; Garrett, J.; Howells, R.; Latella, C. Paralympians Are Stronger Than You Know: A Comparison of Para and Nondisabled Powerlifting Bench Press World Records. J. Strength Cond. Res. 2023, 37, 452–456. [Google Scholar] [CrossRef] [PubMed]
- Teles, L.J.L.; Aidar, F.J.; de Matos, D.G.; Marçal, A.C.; de Almeida-Neto, P.F.; Neves, E.B.; Moreira, O.C.; Ribeiro Neto, F.; Garrido, N.D.; Vilaça-Alves, J.; et al. Static and Dynamic Strength Indicators in Paralympic Power-Lifters with and without Spinal Cord Injury. Int. J. Environ. Res. Public Health 2021, 18, 5907. [Google Scholar] [CrossRef] [PubMed]
- Mendonça, T.P.; Aidar, F.J.; Matos, D.G.; Souza, R.F.; Marçal, A.C.; Almeida-Neto, P.F.; Cabral, B.G.; Garrido, N.D.; Neiva, H.P.; Marinho, D.A.; et al. Force Production and Muscle Activation during Partial vs. Full Range of Motion in Paralympic Powerlifting. PLoS ONE 2021, 16, e0257810. [Google Scholar] [CrossRef]
- Aidar, F.J.; Fraga, G.S.; Getirana-Mota, M.; Marçal, A.C.; Santos, J.L.; de Souza, R.F.; Ferreira, A.R.P.; Neves, E.B.; de Zanona, A.F.; Bulhões-Correia, A.; et al. Effects of Ibuprofen Use on Lymphocyte Count and Oxidative Stress in Elite Paralympic Powerlifting. Biology 2021, 10, 986. [Google Scholar] [CrossRef]
- Aidar, F.J.; Fraga, G.S.; Getirana-Mota, M.; Marçal, A.C.; Santos, J.L.; de Souza, R.F.; Vieira-Souza, L.M.; Ferreira, A.R.P.; de Matos, D.G.; de Almeida-Neto, P.F.; et al. Evaluation of Ibuprofen Use on the Immune System Indicators and Force in Disabled Paralympic Powerlifters of Different Sport Levels. Healthcare 2022, 10, 1331. [Google Scholar] [CrossRef]
- de Aquino Resende, M.; Aidar, F.J.; Vasconcelos Resende, R.B.; Reis, G.C.; de Oliveira Barros, L.; de Matos, D.G.; Marçal, A.C.; de Almeida-Neto, P.F.; Díaz-de-Durana, A.L.; Merino-Fernández, M.; et al. Are Strength Indicators and Skin Temperature Affected by the Type of Warm-Up in Paralympic Powerlifting Athletes? Healthcare 2021, 9, 923. [Google Scholar] [CrossRef]
- Neves, E.B.; Vilaca-Alves, J.; Antunes, N.; Felisberto, I.M.V.; Rosa, C.; Reis, V.M. Different Responses of the Skin Temperature to Physical Exercise: Systematic Review. In Proceedings of the 2015 37th Annual International Conference of the IEEE Engineering in Medicine and Biology Society (EMBC), Milan, Italy, 25–29 August 2015; pp. 1307–1310. [Google Scholar] [CrossRef]
- Santos, L.C.V.; Aidar, F.J.; Villar, R.; Greco, G.; de Santana, J.L.; Marçal, A.C.; de Almeida-Neto, P.F.; de Araújo Tinoco Cabral, B.G.; Badicu, G.; Nobari, H.; et al. Evaluation of the Training Session in Elite Paralympic Powerlifting Athletes Based on Biomechanical and Thermal Indicators. Sports 2023, 11, 151. [Google Scholar] [CrossRef]
- Côrte, A.; Hernandez, A. Termografia Médica Infravermelha Aplicada a Medicina Do Esporte. Rev. Bras. Med. Esporte 2016, 22, 315–319. [Google Scholar] [CrossRef]
- Para Powerlifting Rules and Regulations. Available online: https://www.paralympic.org/powerlifting/rules (accessed on 30 May 2024).
- Ball, R.; Weidman, D. Analysis of USA Powerlifting Federation Data from January 1, 2012-June 11, 2016. J. Strength Cond. Res. 2018, 32, 1843–1851. [Google Scholar] [CrossRef]
- Pérez-Castilla, A.; Piepoli, A.; Delgado-García, G.; Garrido-Blanca, G.; García-Ramos, A. Reliability and Concurrent Validity of Seven Commercially Available Devices for the Assessment of Movement Velocity at Different Intensities During the Bench Press. J. Strength Cond. Res. 2019, 33, 1258–1265. [Google Scholar] [CrossRef] [PubMed]
- Matos, F.; Neves, E.B.; Rosa, C.; Reis, V.M.; Saavedra, F.; Silva, S.; Tavares, F.; Vilaça-Alves, J. Effect of Cold-Water Immersion on Elbow Flexors Muscle Thickness after Resistance Training. J. Strength Cond. Res. 2018, 32, 756–763. [Google Scholar] [CrossRef]
- Neves, E.B.; Moreira, T.R.; Lemos, R.; Vilaça-Alves, J.; Rosa, C.; Reis, V.M. Using Skin Temperature and Muscle Thickness to Assess Muscle Response to Strength Training. Rev. Bras. Med. Esporte 2015, 21, 350–354. [Google Scholar] [CrossRef]
- Rivière, M.; Louit, L.; Strokosch, A.; Seitz, L.B. Variable Resistance Training Promotes Greater Strength and Power Adaptations Than Traditional Resistance Training in Elite Youth Rugby League Players. J. Strength Cond. Res. 2017, 31, 947–955. [Google Scholar] [CrossRef]
- Mesquita Souza, R.L.; Aidar, F.J.; Villar, R.; Greco, G.; Santos, L.D.; Poli, L.; Lima de Santana, J.; Carvutto, R.; Gama de Matos, D.; Badicu, G.; et al. Assessment of Asymmetry at Different Intensities between Conventional and Paralympic Powerlifting Athletes. Heliyon 2023, 9, e16211. [Google Scholar] [CrossRef]
- Cohen, J. Statistical Power Analysis for the Behavioral Sciences, 2nd ed.; Routledge: New York, NY, USA, 1988; ISBN 978-0-203-77158-7. [Google Scholar]
- Cohen, J. A Power Primer. Psychol. Bull. 1992, 112, 155–159. [Google Scholar] [CrossRef]
- Muyor, J.M.; Rodríguez-Ridao, D.; Oliva-Lozano, J.M. Comparison of Muscle Activity between the Horizontal Bench Press and the Seated Chest Press Exercises Using Several Grips. J. Hum. Kinet. 2023, 87, 23–34. [Google Scholar] [CrossRef]
- Aedo-Muñoz, E.; Sanchez-Ramírez, C.; Moya-Jofre, C.; Bustamante-Garrido, A.; Araya-Ibacache, M.; Bello, F.D.; Brito, C.-J.; Miarka, B. Electromyographic Inter-Limb Asymmetry in Bench Press Exercise in Elite Paralympics Weightlifters. ISBS Proc. Arch. 2019, 37, 276. [Google Scholar]
- Guerra, I.; Aidar, F.J.; Greco, G.; de Almeida-Neto, P.F.; De Candia, M.; de Araújo Tinoco Cabral, B.G.; Poli, L.; Filho, M.M.; Carvutto, R.; Silva, A.F.; et al. Are sEMG, Velocity and Power Influenced by Athletes’ Fixation in Paralympic Powerlifting? Int. J. Environ. Res. Public Health 2022, 19, 4127. [Google Scholar] [CrossRef]
- Bandeira, F.; de Moura, M.A.M.; de Souza, M.A.; Nohama, P.; Neves, E.B. Can Thermography Aid in the Diagnosis of Muscle Injuries in Soccer Athletes? Rev. Bras. Med. Esporte 2012, 18, 246–251. [Google Scholar] [CrossRef]
- Garagiola, U.; Giani, E. Use of Telethermography in the Management of Sports Injuries. Sports Med. 1990, 10, 267–272. [Google Scholar] [CrossRef] [PubMed]
- Stewart, I.B.; Moghadam, P.; Borg, D.N.; Kung, T.; Sikka, P.; Minett, G.M. Thermal Infrared Imaging Can Differentiate Skin Temperature Changes Associated With Intense Single Leg Exercise, But Not With Delayed Onset of Muscle Soreness. J. Sports Sci. Med. 2020, 19, 469–477. [Google Scholar] [PubMed]
- Marins, J.; Fernández-Cuevas, I.; Arnaiz Lastras, J.; Fernandes, A.D.A.; Sillero Quintana, M. Applications of infrared thermography in sports. A review. Int. J. Med. Sci. Phys. Act. Sport 2013, 15, 805–824. [Google Scholar]
- Coker, C.A.; Berning, J.M.; Briggs, D.L. A Preliminary Investigation of the Biomechanical and Perceptual Influence of Chain Resistance on the Performance of the Snatch. J. Strength Cond. Res. 2006, 20, 887–891. [Google Scholar] [CrossRef]
- Al-Nakhli, H.H.; Petrofsky, J.S.; Laymon, M.S.; Berk, L.S. The Use of Thermal Infra-Red Imaging to Detect Delayed Onset Muscle Soreness. J. Vis. Exp. JoVE 2012, 3551. [Google Scholar] [CrossRef]
- Baker, D.G.; Newton, R.U. Effect of Kinetically Altering a Repetition via the Use of Chain Resistance on Velocity during the Bench Press. J. Strength Cond. Res. 2009, 23, 1941–1946. [Google Scholar] [CrossRef]
- Jürgenson, J.; Serg, M.; Kampus, P.; Kals, J.; Zagura, M.; Viru, M.; Zilmer, K.; Zilmer, M.; Eha, J.; Unt, E. Oxidative Stress Parameters and Its Associations with Arterial Stiffness in Competitive Powerlifting Athletes After 12-Week Supervised Strength Training. J. Strength Cond. Res. 2019, 33, 1816–1822. [Google Scholar] [CrossRef]
- van den Tillaar, R.; Saeterbakken, A.H.; Andersen, V. The Acute Effects of Attaching Chains to the Barbell on Kinematics and Muscle Activation in Bench Press in Resistance-Trained Men. J. Funct. Morphol. Kinesiol. 2022, 7, 39. [Google Scholar] [CrossRef]
- González-Badillo, J.J.; Sánchez-Medina, L. Movement Velocity as a Measure of Loading Intensity in Resistance Training. Int. J. Sports Med. 2010, 31, 347–352. [Google Scholar] [CrossRef]
- Godwin, M.S.; Fernandes, J.F.T.; Twist, C. Effects of Variable Resistance Using Chains on Bench Throw Performance in Trained Rugby Players. J. Strength Cond. Res. 2018, 32, 950–954. [Google Scholar] [CrossRef] [PubMed]


| Variable | (Mean ± Standard Deviation) |
|---|---|
| Age (years) | 28.00 ± 5.64 |
| Body mass (kg) | 82.00 ± 23.93 |
| Experience (years) | 3.54 ± 1.11 |
| 1RM test (bench press) (kg) | 141.43 ± 47.43 |
| 1RM test/body mass (kg) | 1.82 ± 0.61 * |
| Pectoral Sternal (°C) | Pectoral Clavicular (°C) | Deltoid Anterior (°C) | Triceps (°C) | |
|---|---|---|---|---|
| Before Traditional “a” | 33.29 ± 1.47 (32.44–34.13) | 33.76 ± 1.32 (32.99–34.52) | 33.80 ± 1.09 (33.17–34.43) | 32.01 ± 1.06 (31.40–32.63) |
| Before Chain “b” | 33.36 ± 1.45 (32.52–34.19) | 33.79 ± 1.31 (33.03–34.54) | 33.79 ± 1.05 (33.18–34.39) | 31.93 ± 1.07 (31.31–32.55) |
| After Traditional “c” | 33.73 ± 1.95 (32.60–34.86) | 34.47 ± 1.34 (33.69–35.24) | 34.18 ± 1.46 (33.34–35.03) | 32.81 ± 1.23 (32.09–33.52) |
| After Chain “d” | 34.64 ± 1.95 b (33.52–35.77) | 35.79 ± 3.68 b (33.66–37.91) | 36.21 ± 3.51 c (34.19–38.24) | 33.71 ± 1.54 c (32.82–34.60) |
| 24 h Traditional “e” | 33.76 ± 1.74 (32.76–34.76) | 34.42 ± 1.31 (33.67–35.18) | 34.22 ± 1.28 (33.48–34.96) | 32.84 ± 1.65 (31.89–33.80) |
| 24 h Chain “f” | 34.36 ± 1.34 (33.59–35.13) | 34.79 ± 1.05 (34.18–35.39) | 34.64 ± 1.22 (33.94–35.34) | 33.50 ± 1.61 e (32.57–34.43) |
| 48 h Traditional “g” | 33.53 ± 1.34 (32.75–34.31) | 33.89 ± 1.01 (33.31–34.47) | 33.68 ± 1.00 (33.10–34.25) | 32.26 ± 1.09 (31.63–32.88) |
| 48 h Chain “h” | 34.36 ± 1.69 g (33.38–35.33) | 34.36 ± 1.55 (33.46–35.25) | 34.50 ± 1.61 g (33.57–35.43) | 33.00 ± 1.18 g (32.32–33.68) |
| p | b p = 0.040 g p = 0.018 | b p = 0.003 | c p = 0.026 g p = 0.017 | c p = 0.005 e p = 0.045 g p = 0.005 |
| F | b = 2.212 * g = 11.966 # | b = 4.495 * | c, g = 17.181 # | c, e, g = 17.781 # |
| η2p | b = 0.145 g = 0.479 | b = 0.257 | c, g = 0.569 | c, e, g = 0.578 |
Disclaimer/Publisher’s Note: The statements, opinions and data contained in all publications are solely those of the individual author(s) and contributor(s) and not of MDPI and/or the editor(s). MDPI and/or the editor(s) disclaim responsibility for any injury to people or property resulting from any ideas, methods, instructions or products referred to in the content. |
© 2024 by the authors. Licensee MDPI, Basel, Switzerland. This article is an open access article distributed under the terms and conditions of the Creative Commons Attribution (CC BY) license (https://creativecommons.org/licenses/by/4.0/).
Share and Cite
Filho, G.F.d.S.; Aidar, F.J.; Getirana-Mota, M.; Brito, C.J.; Aedo-Muñoz, E.; de Almeida Paz, Â.; de Souza Leite Júnior, J.A.; Vieira, E.L.M.; Nikolaidis, P.T. Analysis of Velocity, Power and Skin Temperature in Paralympic Powerlifting Athletes with Fixed and Variable Resistance. Sports 2024, 12, 250. https://doi.org/10.3390/sports12090250
Filho GFdS, Aidar FJ, Getirana-Mota M, Brito CJ, Aedo-Muñoz E, de Almeida Paz Â, de Souza Leite Júnior JA, Vieira ELM, Nikolaidis PT. Analysis of Velocity, Power and Skin Temperature in Paralympic Powerlifting Athletes with Fixed and Variable Resistance. Sports. 2024; 12(9):250. https://doi.org/10.3390/sports12090250
Chicago/Turabian StyleFilho, Gildo Francisco dos Santos, Felipe J. Aidar, Márcio Getirana-Mota, Ciro José Brito, Esteban Aedo-Muñoz, Ângelo de Almeida Paz, Joilson Alves de Souza Leite Júnior, Edson Lucas Monteiro Vieira, and Pantelis T. Nikolaidis. 2024. "Analysis of Velocity, Power and Skin Temperature in Paralympic Powerlifting Athletes with Fixed and Variable Resistance" Sports 12, no. 9: 250. https://doi.org/10.3390/sports12090250
APA StyleFilho, G. F. d. S., Aidar, F. J., Getirana-Mota, M., Brito, C. J., Aedo-Muñoz, E., de Almeida Paz, Â., de Souza Leite Júnior, J. A., Vieira, E. L. M., & Nikolaidis, P. T. (2024). Analysis of Velocity, Power and Skin Temperature in Paralympic Powerlifting Athletes with Fixed and Variable Resistance. Sports, 12(9), 250. https://doi.org/10.3390/sports12090250