
Advancements in Performance Monitoring: A Systematic Review of Sensor Technologies in Rowing and Canoeing Biomechanics

 ,
,  ,
,  and
and
Abstract
:1. Introduction
2. Methods
2.1. Search Strategy and Study Selection
2.2. Screening Process
2.3. Quality of the Studies and Extraction of Data
3. Results
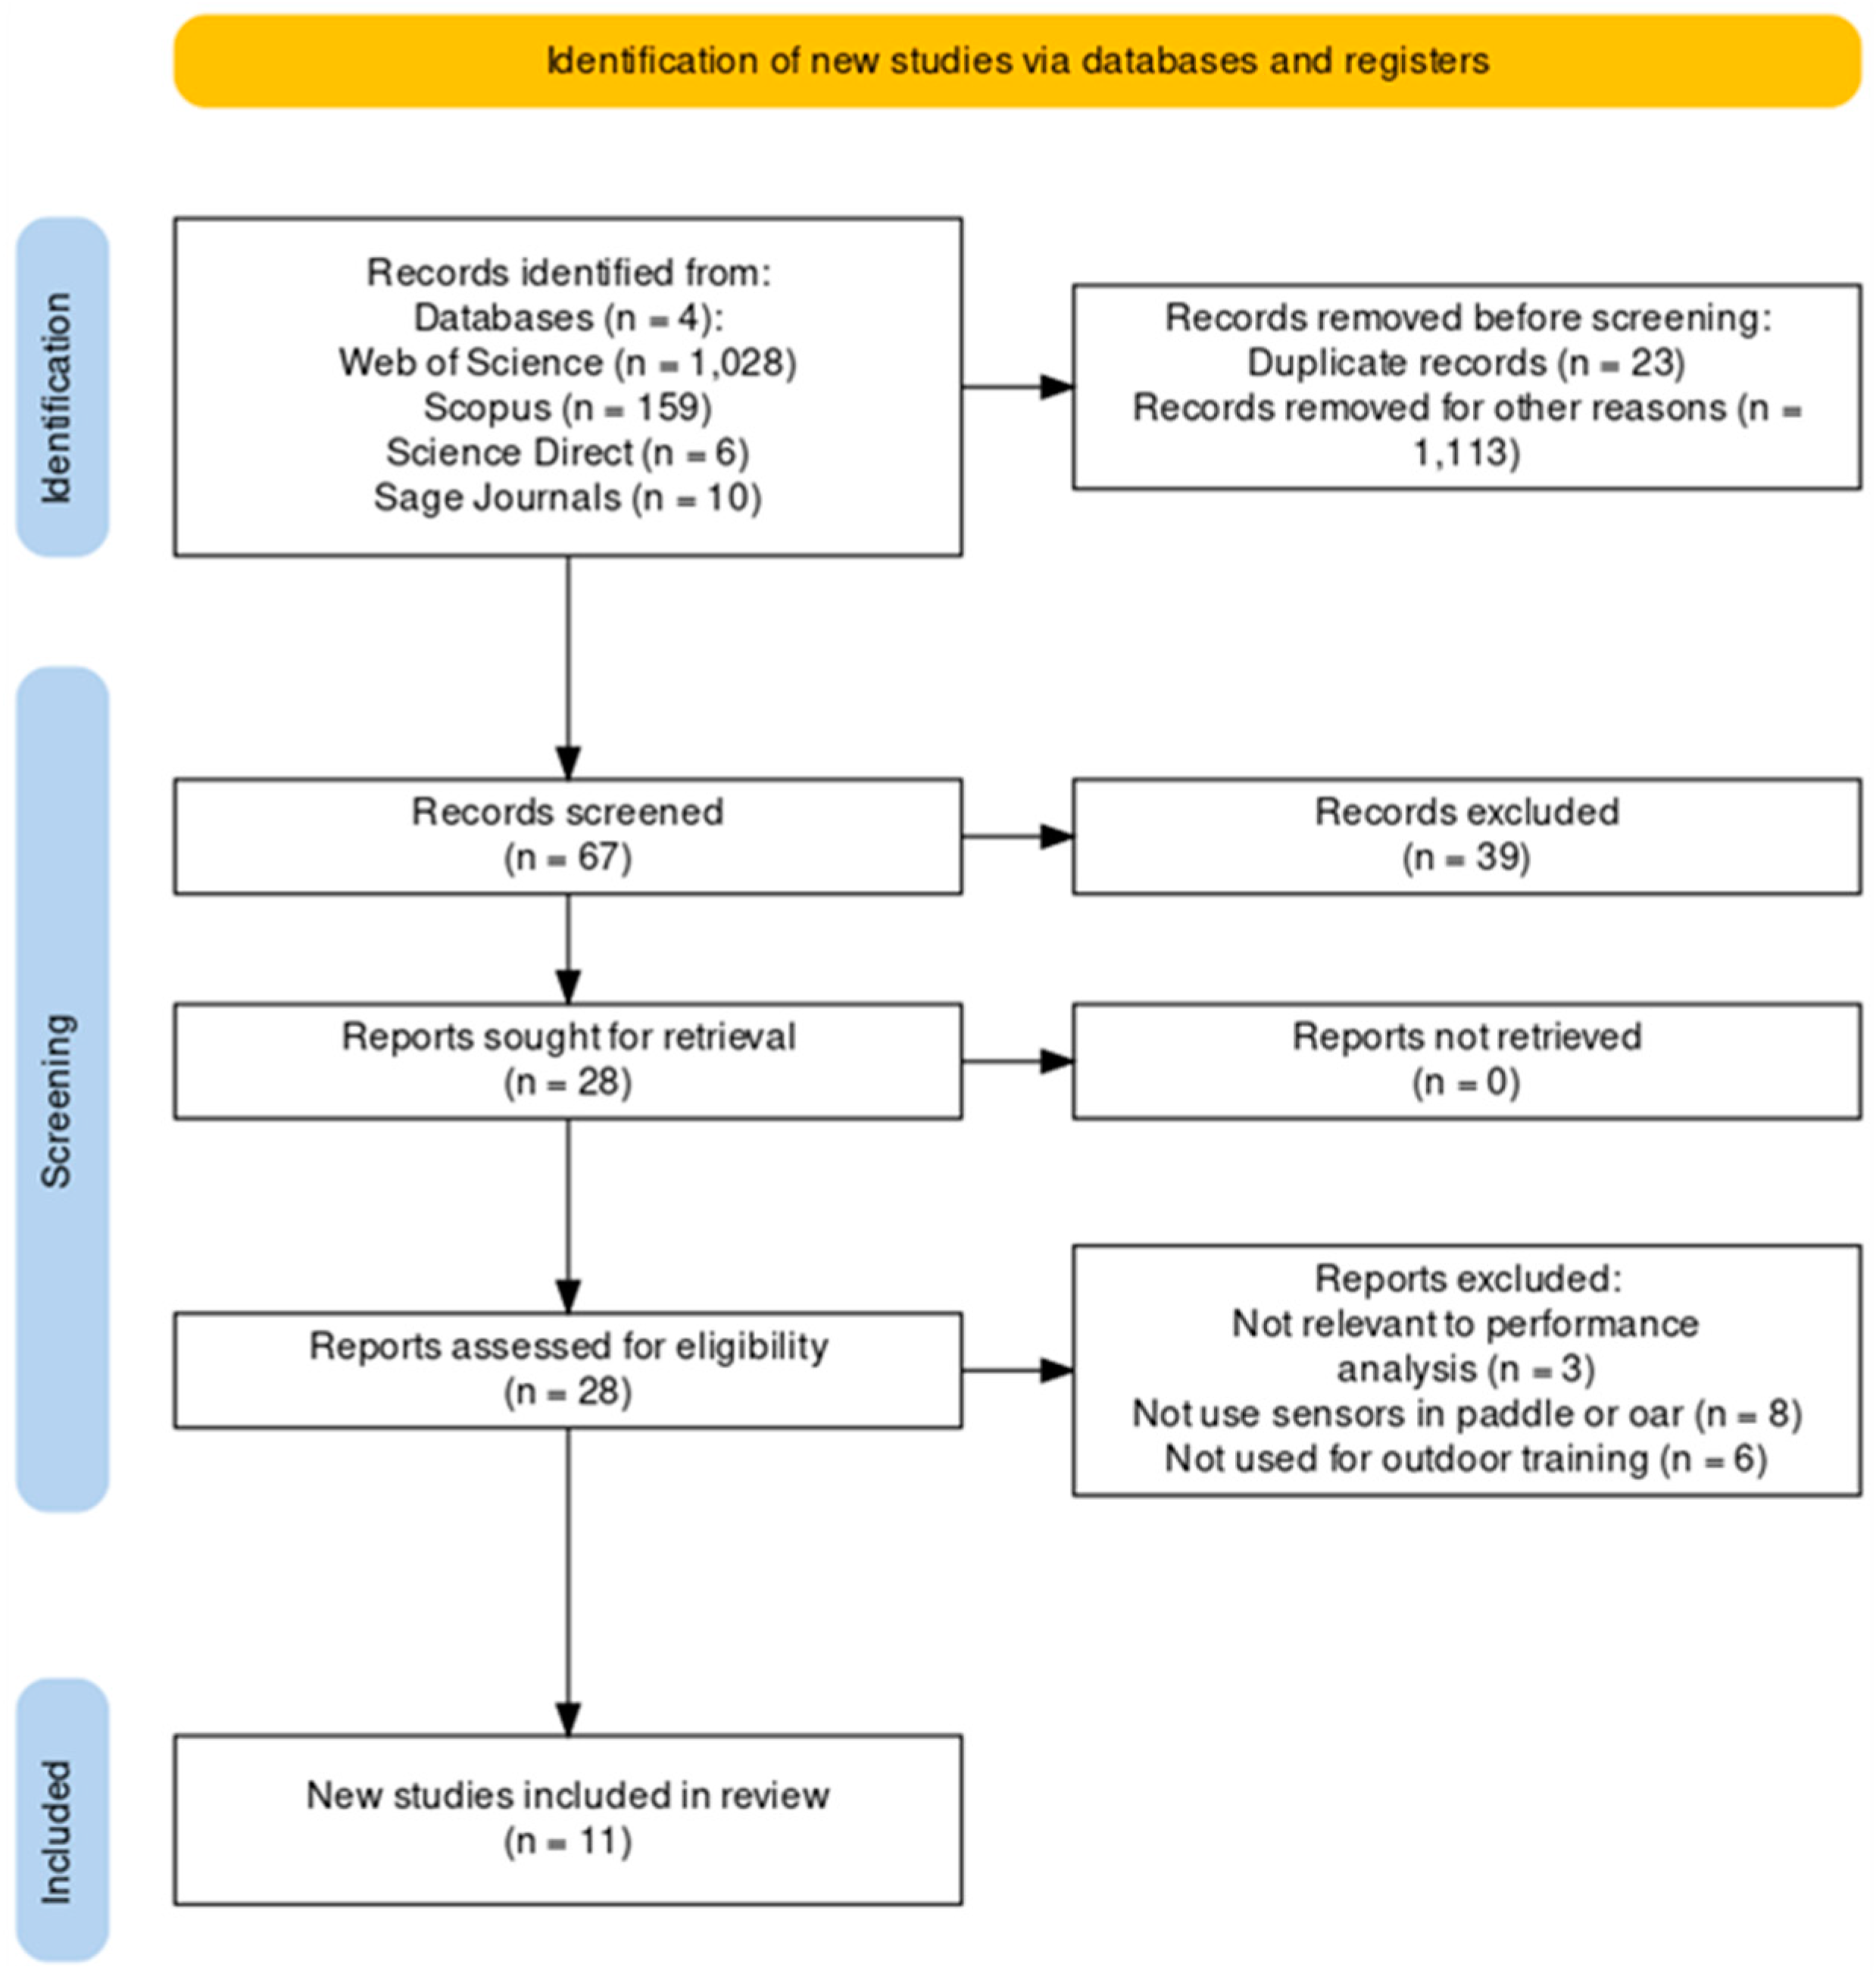
3.1. Search Results
3.2. Results of NHLBI Quality Analysis
3.3. Overview of Variables and Sensors
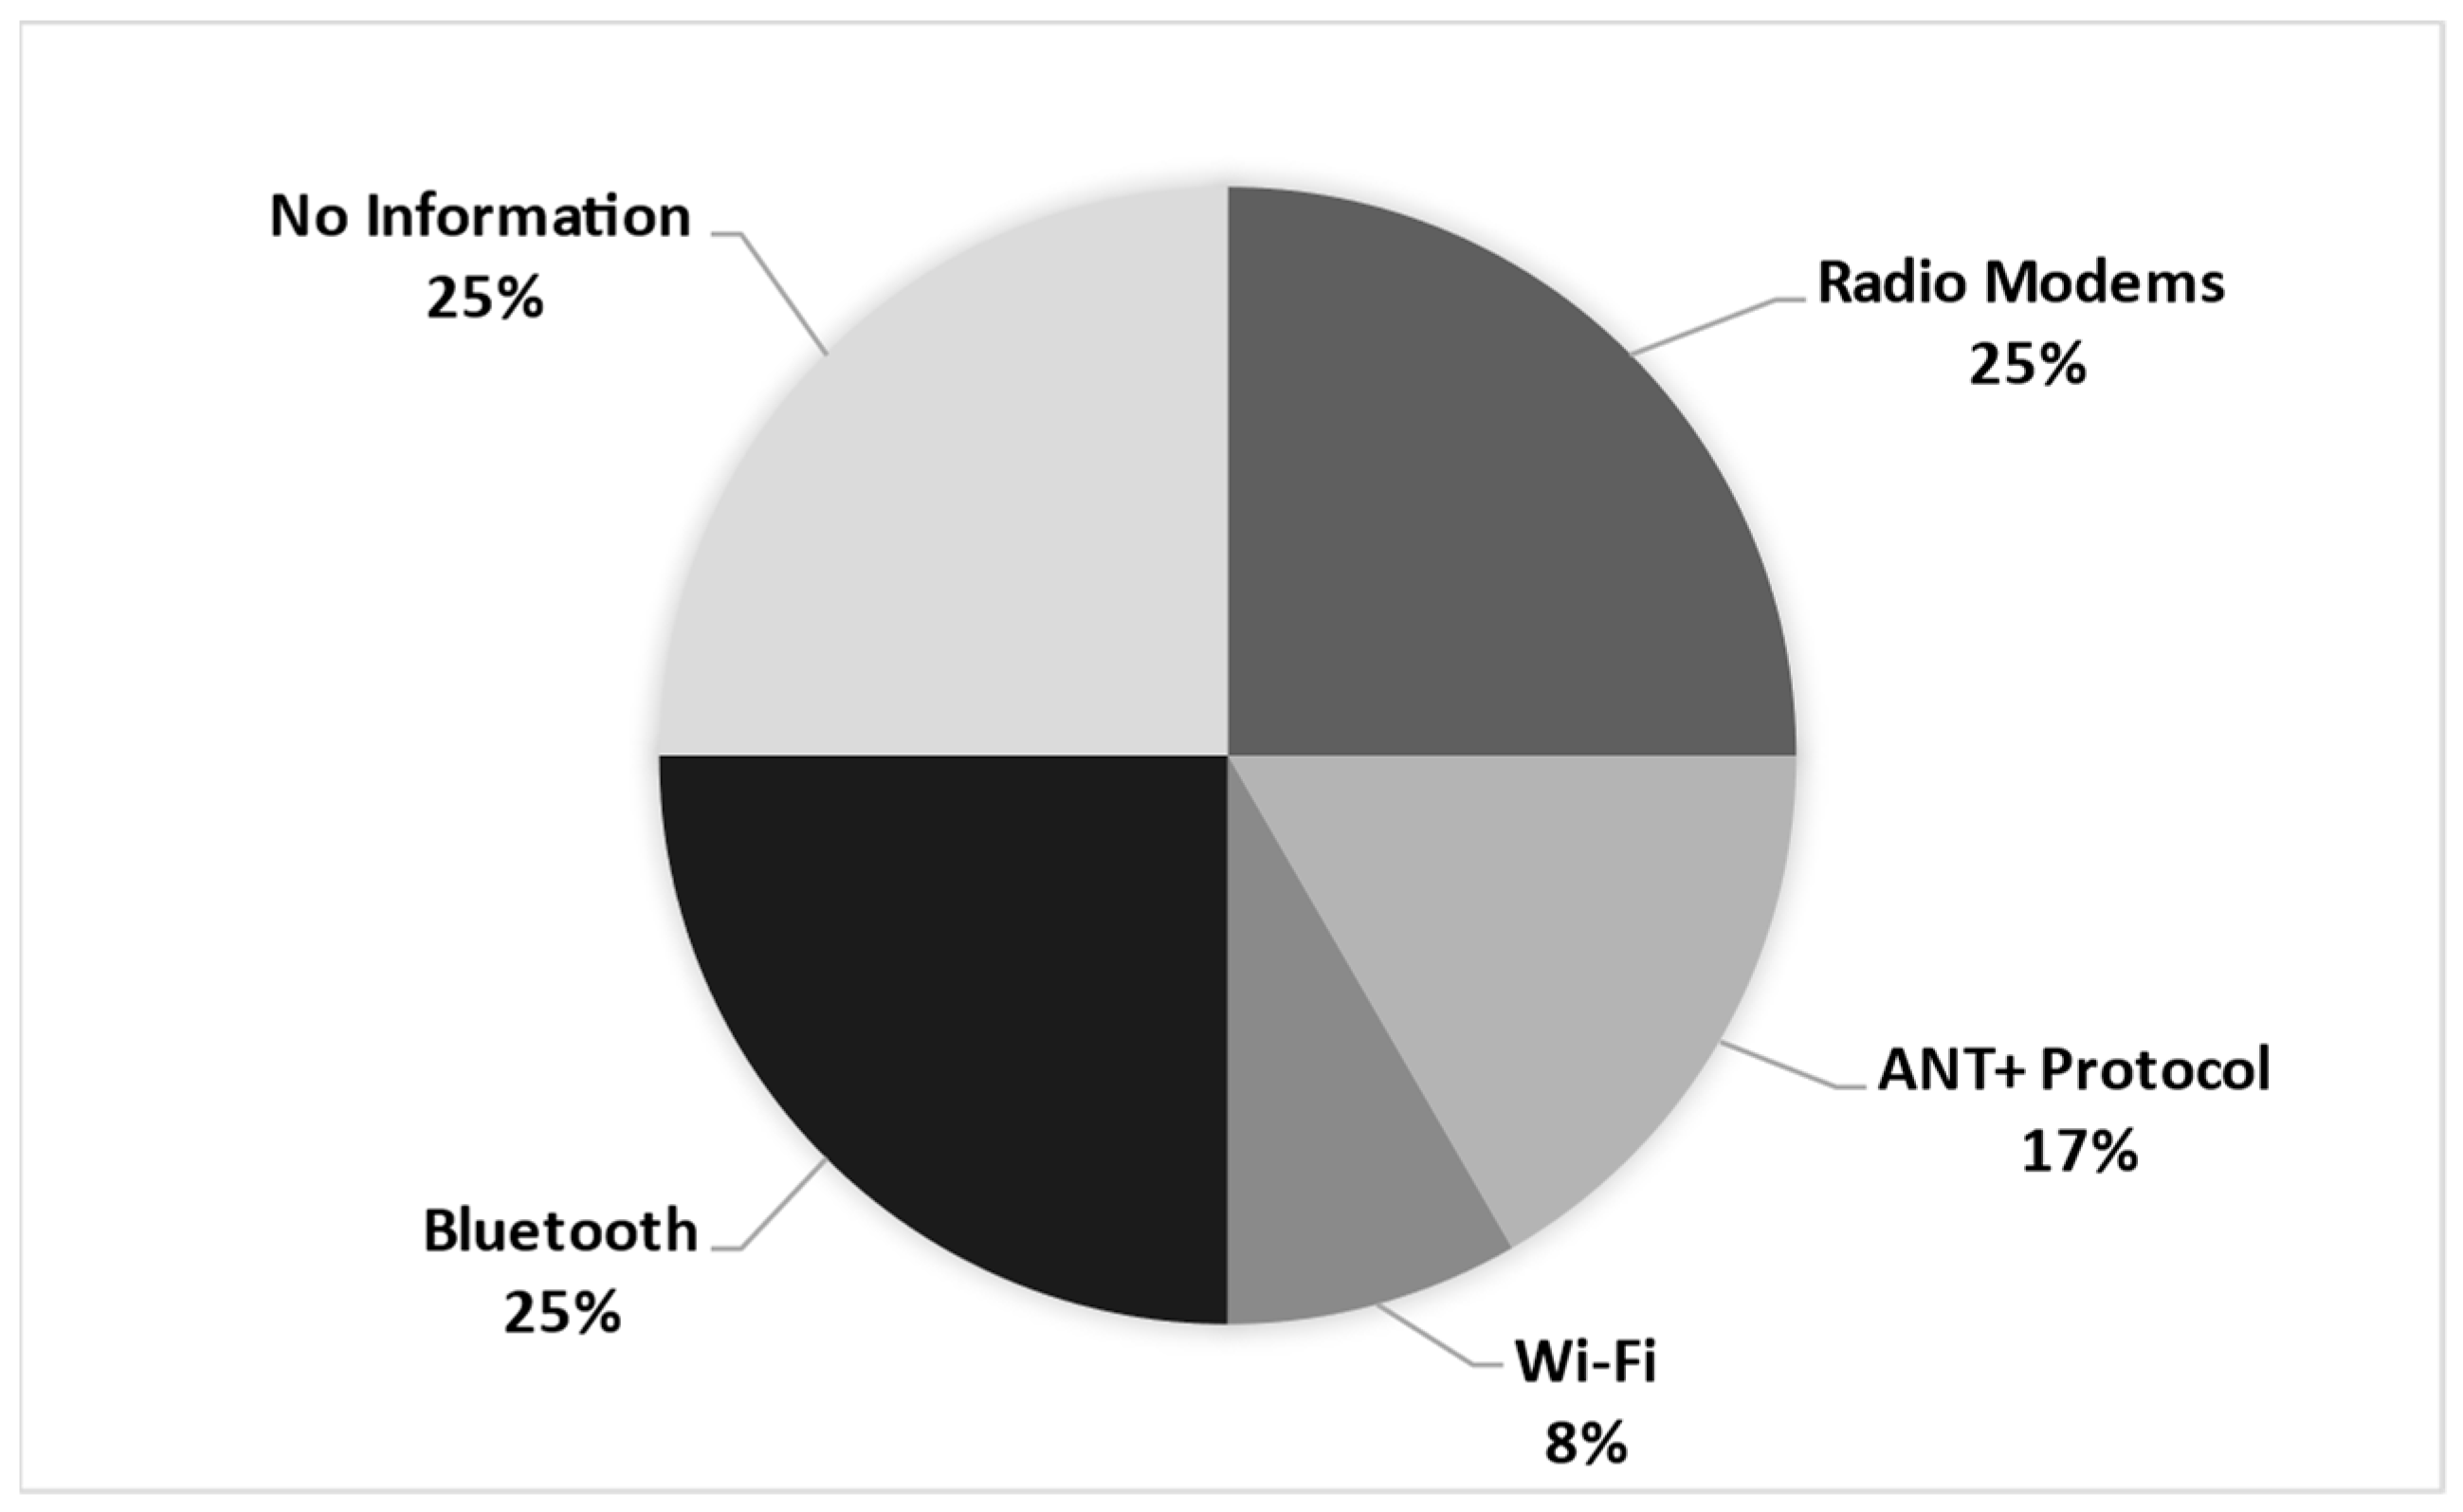
3.4. Presentation of Results: Data Transmission, Processing, and Visualization
4. Discussion
4.1. Methodological Quality and Data Extraction of the Studies Analyzed
4.2. Variables and Sensor Technologies Used in the Studies
4.3. Discussion on Data Transmission, Processing and Visualization
4.4. Limitations on Review
5. Conclusions
Author Contributions
Funding
Acknowledgments
Conflicts of Interest
Appendix A


| Database | Search Terms |
|---|---|
| Web of Science (Core collection) | “athletes rowing” OR “athletes canoeing” OR canoeing OR rowing OR kayak (Title) and “inertial sensor” OR sensor OR gyroscope OR accelerometer OR “strain gauge” OR GPS OR “Global Position System” OR GNSS OR “Global Navigation Satellite System” (Abstract) and kinetic OR kinematics OR velocity OR power OR time OR force OR angle OR biofeedback (Topic) not ergometer (Topic) |
| Scopus | (TITLE ((“athlete$ row*” OR “athletes canoe*” OR canoeing OR rowing OR kayak)) AND ABS ((“inertial sensor$” OR sensor$ OR gyroscope OR *meter OR “strain gauge$” OR GPS OR “Global Position System” OR GNSS OR “Global Navigation Satellite System”)) AND TITLE-ABS-KEY ((kine* OR velocity OR power O tim* OR force$ OR angle$ OR *feedback)) AND NOT TITLE-ABS-KEY (ergometer)) |
| Science Direct | (TITLE ((“athlete rowing” OR “athletes canoeing” OR canoeing OR rowing OR kayak)) AND TITLE-ABS-KEY ((“inertial sensor” OR sensor OR gyroscope OR accelerometer OR “strain gauge” OR GPS OR “Global Position System” OR GNSS OR “Global Navigation Satellite System” OR kinetic OR kinetics OR velocity OR power OR time OR force OR angle OR biofeedback)) AND NOT TITLE-ABS-KEY (ergometer)) |
| Sage Journals | Anywhere (kine* OR velocity OR power OR tim* OR force$ OR angle$ OR *feedback) AND NOT Anywhere (ergometer) AND Abstract (“inertial sensor$” OR sensor$ OR gyroscope OR *meter OR “strain gauge$” OR GPS OR “Global Position System” OR GNSS OR “Global Navigation Satellite System”) AND Title (“athlete$ row*” OR “athletes canoe*” OR canoeing OR rowing OR kayak) |
References
- Buckeridge, E.M.; Bull, A.M.J.; McGregor, A.H. Biomechanical Determinants of Elite Rowing Technique and Performance. Scand. J. Med. Sci. Sport. 2015, 25, e176–e183. [Google Scholar] [CrossRef] [PubMed]
- Xiao, G.; Zheng, W.T. Development of Canoe Equipments for Strength Training in Rowing Tank. Adv. Mater. Res. 2013, 680, 435–439. [Google Scholar] [CrossRef]
- Wu, Y.; Xu, G. Monitoring the Physiological and Biochemical Indicators of Teenage Male Rowers during Winter Training. IOP Conf. Ser. Earth Environ. Sci. 2019, 252, 022038. [Google Scholar] [CrossRef]
- Hendelman, D.L.; Whittlesey, S.; Caldwell, G.E.; Freedson, P.S. Biomechanical and Physiological Determinants of Rowing Performance. Med. Sci. Sport. Exerc. 1998, 30, 50. [Google Scholar] [CrossRef]
- Nurkholis; Mintarto, E.; Hariyanto, A. Physical and Psychological Indicators for Canoeing Athlete Selection. J. Adv. Soc. Sci. Humanit. 2019, 5, 622–626. [Google Scholar]
- Castro, R.; Mujica, G.; Portilla, J. Internet of Things in Sport Training: Application of a Rowing Propulsion Monitoring System. IEEE Internet Things J. 2022, 9, 18880–18897. [Google Scholar] [CrossRef]
- Baca, A.; Kornfeind, P.; Heller, M. Feedback Systems in Rowing. In Proceedings of the Engineering of Sport 6; Moritz, E.F., Haake, S., Eds.; Springer: New York, NY, USA, 2006; pp. 407–412. [Google Scholar]
- Mäestu, J.; Jürimäe, J.; Jürimäe, T. Monitoring of Performance and Training in Rowing. Sport. Med. 2005, 35, 597–617. [Google Scholar] [CrossRef]
- Klitgaard, K.K.; Hauge, C.; Oliveira, A.S.; Heinen, F. A Kinematic Comparison of On-Ergometer and on-Water Kayaking. Eur. J. Sport. Sci. 2021, 21, 1375–1384. [Google Scholar] [CrossRef]
- Mendes, J.J.A.; Vieira, M.E.M.; Pires, M.B.; Stevan, S.L. Sensor Fusion and Smart Sensor in Sports and Biomedical Applications. Sensors 2016, 16, 1569. [Google Scholar] [CrossRef]
- Camomilla, V.; Bergamini, E.; Fantozzi, S.; Vannozzi, G. Trends Supporting the In-Field Use of Wearable Inertial Sensors for Sport Performance Evaluation: A Systematic Review. Sensors 2018, 18, 873. [Google Scholar] [CrossRef]
- Worsey, M.T.O.; Espinosa, H.G.; Shepherd, J.B.; Thiel, D.V. Inertial Sensors for Performance Analysis in Combat Sports: A Systematic Review. Sports 2019, 7, 28. [Google Scholar] [CrossRef] [PubMed]
- Espinosa, H.G.; Shepherd, J.B.; Thiel, D.V.; Worsey, M.T.O. Anytime, Anywhere! Inertial Sensors Monitor Sports Performance. IEEE Potentials 2019, 38, 11–16. [Google Scholar] [CrossRef]
- McNab, T.; James, D.A.; Rowlands, D. IPhone Sensor Platforms: Applications to Sports Monitoring. In Proceedings of the Procedia Engineering; Elsevier Ltd.: Amsterdam, The Netherlands, 2011; Volume 13, pp. 507–512. [Google Scholar]
- Worsey, M.T.O.; Espinosa, H.G.; Shepherd, J.B.; Thiel, D.V. A Systematic Review of Performance Analysis in Rowing Using Inertial Sensors. Electronics 2019, 8, 1304. [Google Scholar] [CrossRef]
- Liu, L.; Qiu, S.; Wang, Z.L.; Li, J.; Wang, J.X. Canoeing Motion Tracking and Analysis via Multi-Sensors Fusion. Sensors 2020, 20, 2110. [Google Scholar] [CrossRef]
- Peltonen, J.; Rusko, H. Interrelations between Power, Force Production and Energy Metabolism in Maximal Leg Work Using a Modified Rowing Ergometer. J. Sport. Sci. 1993, 11, 233–240. [Google Scholar] [CrossRef]
- Rethlefsen, M.L.; Kirtley, S.; Waffenschmidt, S.; Ayala, A.P.; Moher, D.; Page, M.J.; Koffel, J.B.; Blunt, H.; Brigham, T.; Chang, S.; et al. PRISMA-S: An Extension to the PRISMA Statement for Reporting Literature Searches in Systematic Reviews. Syst. Rev. 2021, 10, 39. [Google Scholar] [CrossRef]
- Macdermid, P.W.; Gilbert, C.; Jayes, J. Using a Kayak Paddle Power-Meter in the Sport of Whitewater Slalom. J. Hum. Sport. Exerc. 2020, 15, 105–118. [Google Scholar] [CrossRef]
- Hogan, C.; Binnie, M.J.; Doyle, M.; Peeling, P. Quantifying Sprint Kayak Training on a Flowing River: Exploring the Utility of Novel Power Measures and Its Relationship to Measures of Relative Boat Speed. Eur. J. Sport. Sci. 2022, 22, 1668–1677. [Google Scholar] [CrossRef]
- Holt, A.C.; Aughey, R.J.; Ball, K.; Hopkins, W.G.; Siegel, R. Technical Determinants of On-Water Rowing Performance. Front. Sport. Act. Living 2020, 2, 589013. [Google Scholar] [CrossRef]
- Holt, A.C.; Siegel, R.; Ball, K.; Hopkins, W.G.; Aughey, R.J. Prediction of 2000-m on-Water Rowing Performance with Measures Derived from Instrumented Boats. Scand. J. Med. Sci. Sport. 2022, 32, 710–719. [Google Scholar] [CrossRef]
- Bonaiuto, V.; Gatta, G.; Romagnoli, C.; Boatto, P.; Lanotte, N.; Annino, G. A Pilot Study on the E-Kayak System: A Wireless DAQ Suited for Performance Analysis in Flatwater Sprint Kayaks. Sensors 2020, 20, 542. [Google Scholar] [CrossRef] [PubMed]
- Croft, H.; Ribeiro, D.C. Developing and Applying a Tri-Axial Accelerometer Sensor for Measuring Real Time Kayak Cadence. In Proceedings of the Procedia Engineering; Elsevier Ltd.: Amsterdam, The Netherlands, 2013; Volume 60, pp. 16–21. [Google Scholar]
- Kleshnev, V. Boat Acceleration, Temporal Structure of the Stroke Cycle, and Effectiveness in Rowing. Proc. Inst. Mech. Eng. P J. Sport. Eng. Technol. 2010, 224, 63–74. [Google Scholar] [CrossRef]
- Sturm, D.; Yousaf, K.; Brodin, L.Å.; Halvorsen, K. Wireless Kayak On-Water Ergometry—Part 1: Paddle Blade Force. Sport. Technol. 2013, 6, 29–42. [Google Scholar] [CrossRef]
- Gomes, B.B.; Ramos, N.V.; Conceição, F.A.V.; Sanders, R.H.; Vaz, M.A.P.; Vilas-Boas, J.P. Paddling Force Profiles at Different Stroke Rates in Elite Sprint Kayaking. J. Appl. Biomech. 2015, 31, 258–263. [Google Scholar] [CrossRef]
- Prétot, C.; Carmigniani, R.; Hasbroucq, L.; Labbé, R.; Boucher, J.P.; Clanet, C. On the Physics of Kayaking. Appl. Sci. 2022, 12, 8925. [Google Scholar] [CrossRef]
- Checking out the Kayak Power Meter System|DC Rainmaker. Available online: https://www.dcrainmaker.com/2013/06/checking-power-system.html (accessed on 28 June 2023).
- Peach Innovations—Rowing Telemetry and Instrumentation. Available online: http://www.peachinnovations.com/ (accessed on 27 June 2023).
- Vaaka Paddle Cadence Sensor—Vaaka Cadence. Available online: https://www.vaakacadence.com/shop/vaaka-paddle-cadence-sensor/ (accessed on 27 June 2023).
- Tosi, J.; Taffoni, F.; Santacatterina, M.; Sannino, R.; Formica, D. Performance Evaluation of Bluetooth Low Energy: A Systematic Review. Sensors 2017, 17, 2898. [Google Scholar] [CrossRef]
- Augustin, A.; Yi, J.; Clausen, T.; Townsley, W. A Study of LoRa: Long Range & Low Power Networks for the Internet of Things. Sensors 2016, 16, 1466. [Google Scholar] [CrossRef]
- Cattani, M.; Boano, C.; Römer, K. An Experimental Evaluation of the Reliability of LoRa Long-Range Low-Power Wireless Communication. J. Sens. Actuator Netw. 2017, 6, 7. [Google Scholar] [CrossRef]
- Rajšp, A.; Fister, I. A Systematic Literature Review of Intelligent Data Analysis Methods for Smart Sport Training. Appl. Sci. 2020, 10, 3013. [Google Scholar] [CrossRef]
- Page, M.J.; McKenzie, J.E.; Bossuyt, P.M.; Boutron, I.; Hoffmann, T.C.; Mulrow, C.D.; Shamseer, L.; Tetzlaff, J.M.; Akl, E.A.; Brennan, S.E.; et al. The PRISMA 2020 statement: An Updated Guideline for Reporting Systematic Reviews. Br. Med. J. 2021, 71, 372. [Google Scholar] [CrossRef]
| P | Athletes Who Practice Rowing or Canoeing |
|---|---|
| E | Documents describing sensors to monitor or analyze performance in rowing and canoeing |
| C | Do not apply |
| O | Multiple sensors and variables for analysis of the performance in rowing and canoeing |
| Author | 1 | 2 | 3 | 4 | 5 | 6 | 7 | 8 | 9 | 10 | 11 | 12 | 13 | 14 | Quality Rating |
|---|---|---|---|---|---|---|---|---|---|---|---|---|---|---|---|
| [19] | Y | N | Y | Y | Y | NA | NA | NA | Y | Y | Y | NA | NA | NR | GOOD |
| [20] | Y | Y | Y | Y | N | NA | NA | NA | Y | Y | Y | NA | NA | NR | GOOD |
| [21] | Y | Y | Y | Y | N | NA | NA | NA | Y | N | Y | NA | NA | NR | GOOD |
| [22] | Y | Y | Y | Y | N | NA | NA | NA | Y | N | Y | NA | NA | NR | GOOD |
| [23] | Y | Y | NA | NR | N | NA | NA | NA | Y | N | Y | NA | NA | NR | GOOD |
| [24] | Y | NA | NA | NA | NA | NA | NA | NA | Y | NA | Y | NA | NA | NA | FAIR |
| [25] | Y | Y | Y | Y | N | NA | NA | NA | Y | Y | Y | NA | NA | NR | GOOD |
| [26] | Y | NA | NA | NA | NA | NA | NA | NA | Y | NA | Y | NA | NA | NA | FAIR |
| [27] | Y | Y | Y | Y | N | NA | NA | NA | Y | N | Y | NA | NA | NR | GOOD |
| [6] | Y | NA | NA | NA | NA | NA | NA | NA | Y | NA | Y | NA | NA | NR | FAIR |
| [28] | Y | Y | Y | Y | N | NA | NA | NA | Y | NR | Y | NA | NA | NR | GOOD |
| Reference | Sport | Parameters | Sensors |
|---|---|---|---|
| [19] | C | Stroke length; Impulse; Peak force; Time to peak force | Kayak Power Meter |
| [20] | C | Stroke rate; Hand force output; Acceleration; Rotational velocity; Heart rate | Kayak Power Meter |
| [21] | R | Boat velocity; Stroke rate; Time from catch to minimum velocity; Distance per stroke; Mean force; Power output; Peak force; Time to peak force from the catch; Peak force angle; Gate angle | PeachPowerLine; GPS |
| [22] | R | Oar angle and force; Boat velocity per stroke | Peach PowerLine GPS |
| [23] | C | Instantaneous stroke rate; Boat speed; Travelled distance; Angular acceleration; Forces on paddle and footrest; Force impulse; Time to peak; Stroke time; Cycle time | eKayak |
| [24] | C | Cadence | Vaaka |
| [25] | R | Boat velocity and acceleration; Horizontal/vertical oar angle; Normal component of the force; Seat position | Electromagnetic impeller; Accelerometer; Potentiometers; Strain gauge |
| [26] | C | Force in the paddle shaft | Strain gauges; Accelerometer; Gyroscope |
| [27] | C | Force in the paddle; Acceleration | FPaddle |
| [6] | R | Force; Acceleration; Speed; Power of stroke | Load cell; Accelerometer; GPS |
| [28] | C | Force; Velocity | Strain gauges; Accelerometer; Gyrometer; Go pro |
| Reference | Sampling Frequency | Storage Systems | Visualization of Data | System of Data Transfer | Software for Data Analysis |
|---|---|---|---|---|---|
| [19] | 50 Hz | - | Real-time | ANT+ protocol or Bluetooth | - |
| [20] | 1 Hz | Proprietary Software | Real-time | - | Excel (version 16.40) R-Studio (v4.0.2, Boston, FL, USA) |
| [21] | 50 Hz | Proprietary Software | Real-time | - | Proprietary Software |
| [22] | 50 Hz | Proprietary Software | Not real time | - | Excel SAS (version 9.4, SAS Institute, Cary, NC, USA) |
| [23] | 50 Hz | Website | Real-time | Wi-fi | MATLAB (version R2018b by The MathWorks Inc., Natick, MA, USA) |
| [24] | - | Microprocessor | Real-time | ANT+ protocol | Proprietary Software |
| [25] | 25 Hz | PC | Not real time | Radio Modems | - |
| [26] | 100 Hz | Mobile phone, tablet, and PC | Not real time | Radio Modems | MATLAB (version R2011a) (The MathWorks Inc., Natick, MA, USA) |
| [27] | 256 Hz | PC | Not real time | Radio Modems | MATLAB (version R2010a by The MathWorks Inc., Natick, MA, USA) IBM SPSS (version 12.0, IBM Inc., Chicago, IL, USA) |
| [6] | - | Mobile device | - | Bluetooth | - |
| [28] | 100 Hz | SD Card | - | Bluetooth | - |
| Sensor Type | Measurable Variables | Applications in Canoeing and Rowing |
|---|---|---|
| Accelerometer | Angular position | Monitoring stroke acceleration, boat movement patterns, and paddle dynamics |
| Electromagnetic Impeller | Boat Velocity and acceleration | Measuring boat dynamics |
| Global Position System | Position, Speed, and Distance | Tracking boat velocity, measuring distance covered, race pacing strategies |
| Gyroscope | Angular velocity and orientation | Analyzing rotational movement and stability during paddling |
| Load Cell | Force and Weight | Measuring force exerted on the paddle |
| Potentiometer | Angular Position | Measuring our angles during strokes |
| Strain Gauges | Force and Pressure | Analyzing force distribution on paddles |
Disclaimer/Publisher’s Note: The statements, opinions and data contained in all publications are solely those of the individual author(s) and contributor(s) and not of MDPI and/or the editor(s). MDPI and/or the editor(s) disclaim responsibility for any injury to people or property resulting from any ideas, methods, instructions or products referred to in the content. |
© 2024 by the authors. Licensee MDPI, Basel, Switzerland. This article is an open access article distributed under the terms and conditions of the Creative Commons Attribution (CC BY) license (https://creativecommons.org/licenses/by/4.0/).
Share and Cite
Cruz, M.I.; Sarmento, H.; Amaro, A.M.; Roseiro, L.; Gomes, B.B. Advancements in Performance Monitoring: A Systematic Review of Sensor Technologies in Rowing and Canoeing Biomechanics. Sports 2024, 12, 254. https://doi.org/10.3390/sports12090254
Cruz MI, Sarmento H, Amaro AM, Roseiro L, Gomes BB. Advancements in Performance Monitoring: A Systematic Review of Sensor Technologies in Rowing and Canoeing Biomechanics. Sports. 2024; 12(9):254. https://doi.org/10.3390/sports12090254
Chicago/Turabian StyleCruz, Maria I., Hugo Sarmento, Ana M. Amaro, Luís Roseiro, and Beatriz B. Gomes. 2024. "Advancements in Performance Monitoring: A Systematic Review of Sensor Technologies in Rowing and Canoeing Biomechanics" Sports 12, no. 9: 254. https://doi.org/10.3390/sports12090254
APA StyleCruz, M. I., Sarmento, H., Amaro, A. M., Roseiro, L., & Gomes, B. B. (2024). Advancements in Performance Monitoring: A Systematic Review of Sensor Technologies in Rowing and Canoeing Biomechanics. Sports, 12(9), 254. https://doi.org/10.3390/sports12090254