Phase-Specific Changes in Rate of Force Development and Muscle Morphology Throughout a Block Periodized Training Cycle in Weightlifters

 ,
,  , ,
, , 
Abstract
:1. Introduction
2. Materials and Methods
2.1. Athletes
2.2. Training
2.3. Hydration
2.4. Warm-Up
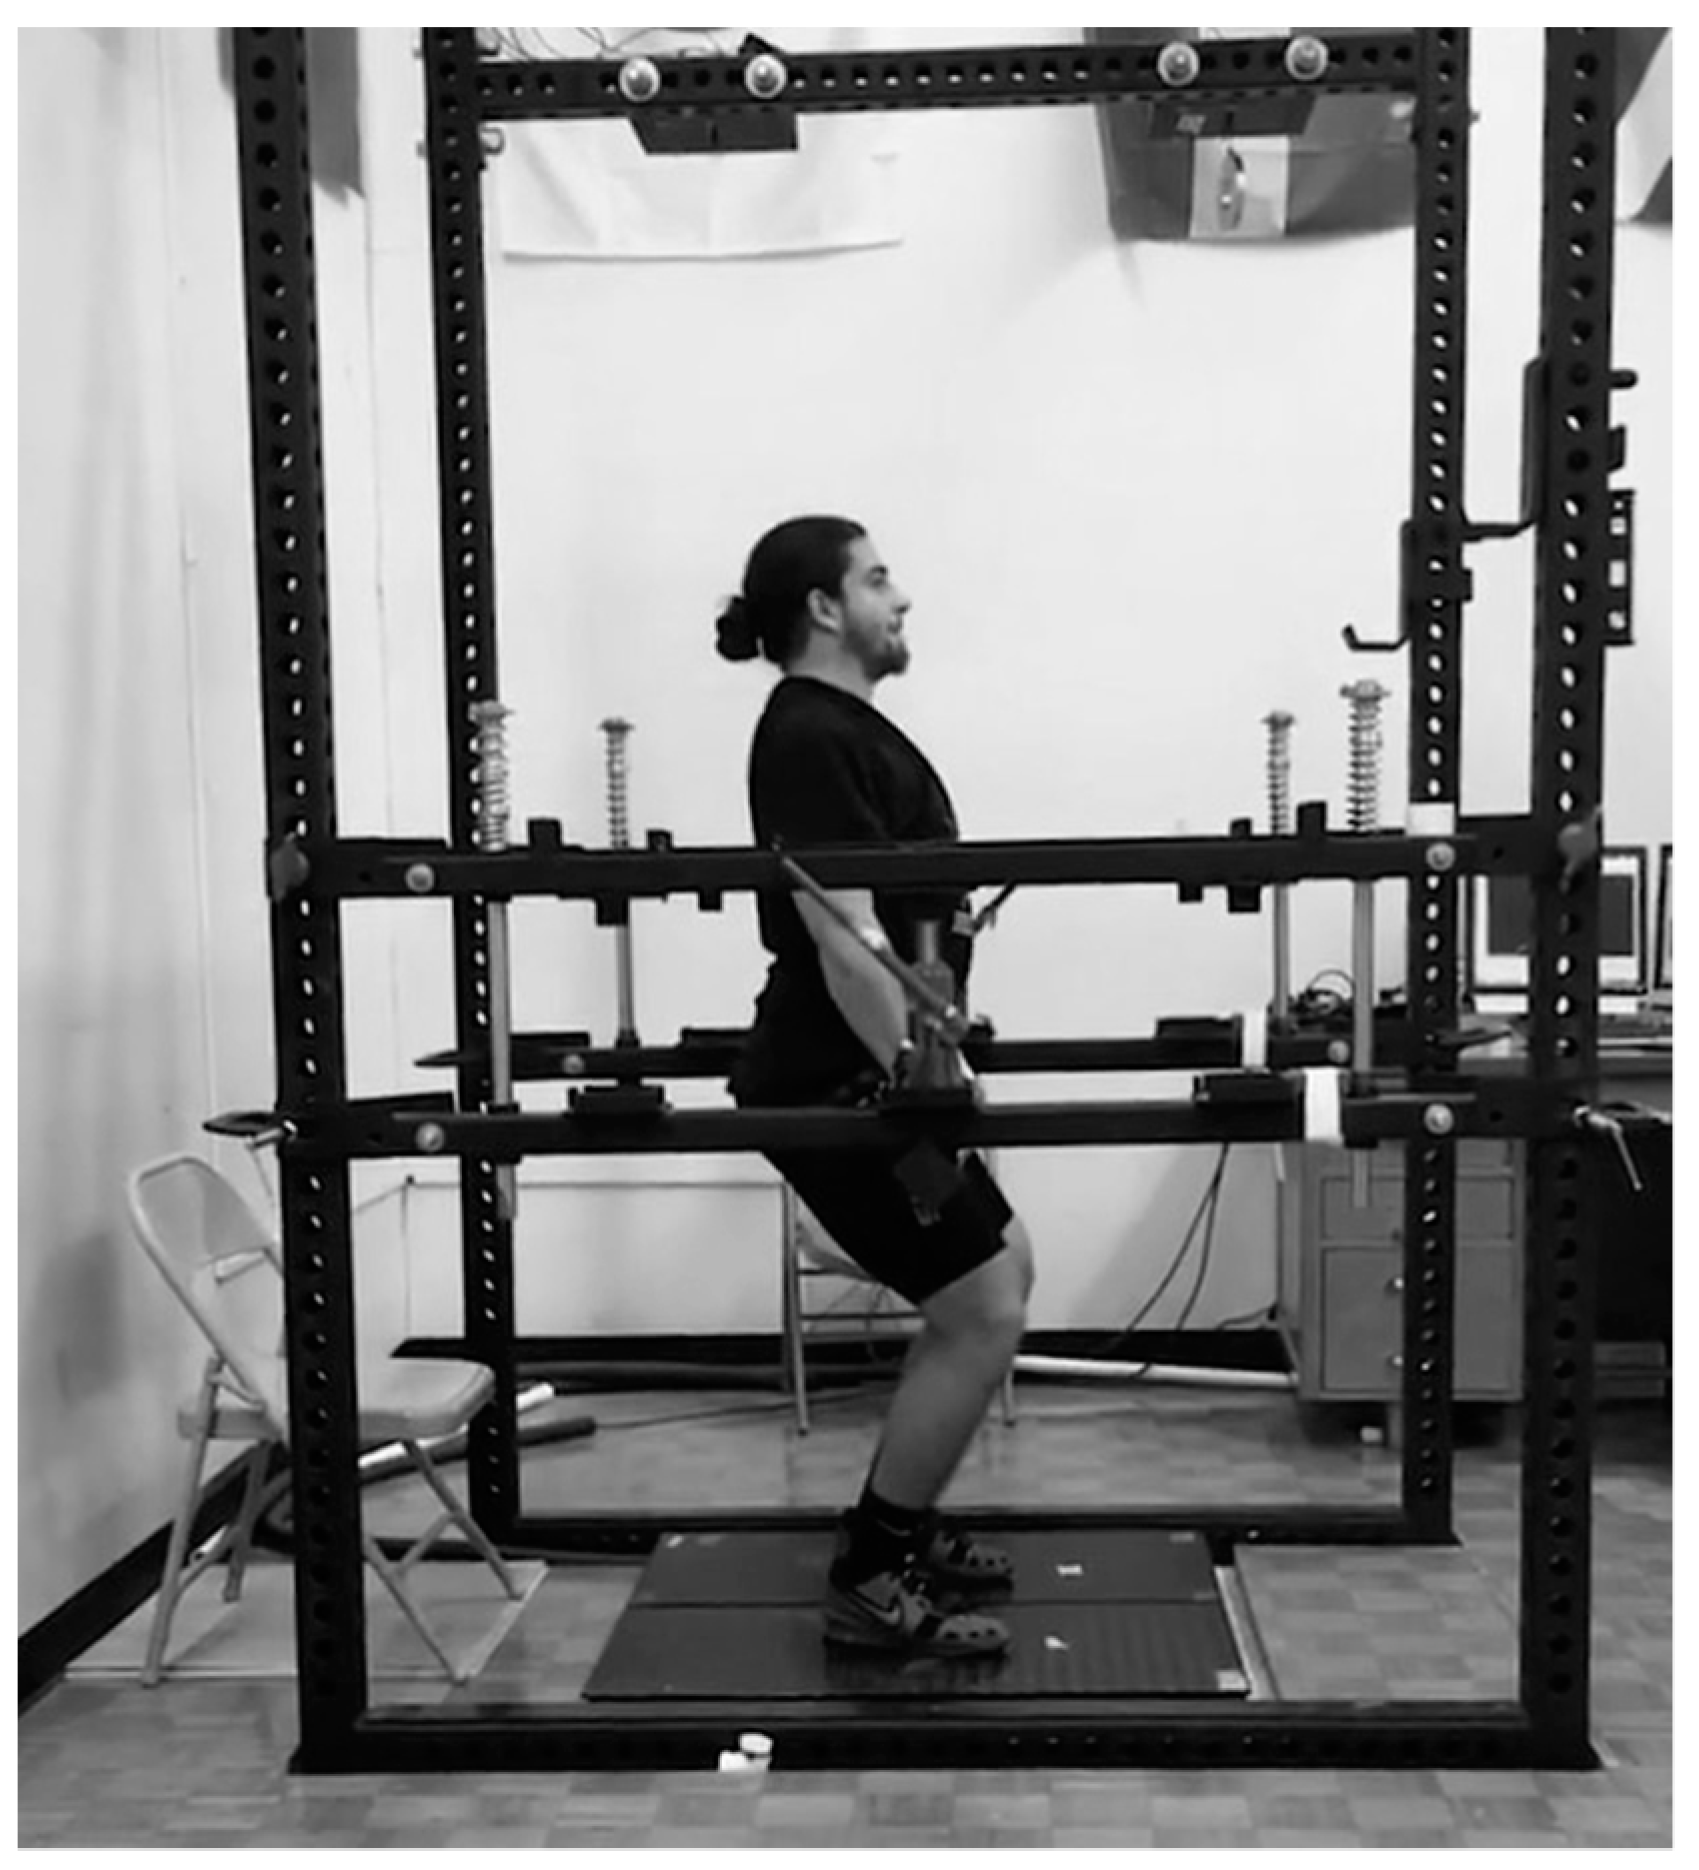
2.5. Isometric Mid-Thigh Pull
2.6. Ultrasonography
2.7. Statistical Analyses
3. Results
3.1. Isometric Mid-Thigh Pull
3.2. Ultrasonography
4. Discussion
5. Conclusions
Author Contributions
Funding
Acknowledgments
Conflicts of Interest
References
- Aján, T.; Baroga, L. Weightlifting: Fitness for All Sports; International Weightlifting Federation: Budapest, Hungary, 1988; p. 214. [Google Scholar]
- Kauhanen, H.; Hakkinen, K.; Komi, P. A biomechanical analysis of the snatch and clean & jerk techniques of Finnish elite and district level weightlifters. Scand. J. Sports Sci. 1984, 6, 47–56. [Google Scholar]
- Garhammer, J. A Review of Power Output Studies of Olympic and Powerlifting: Methodology, Performance. J. Strength Cond. Res. 1993, 7, 76–89. [Google Scholar]
- Stone, M.H.; O’bryant, H.S.; Williams, F.E.; Johnson, R.L.; Pierce, K.C. Analysis of Bar Paths During the Snatch in Elite Male Weightlifters. Strength Cond. J. 1998, 20, 30–38. [Google Scholar] [CrossRef]
- Garhammer, J. Power production by Olympic weightlifters. Med. Sci. Sports Exerc. 1980, 12, 54–60. [Google Scholar] [CrossRef] [PubMed]
- Garhammer, J. Biomechanical profiles of Olympic weightlifters. Int. J. Sport Biomech. 1985, 1, 122–130. [Google Scholar] [CrossRef]
- Stone, M.H.; Sands, W.A.; Pierce, K.C.; Carlock, J.; Cardinale, M.; Newton, R.U. Relationship of maximum strength to weightlifting performance. Med. Sci. Sports Exerc. 2005, 37, 1037–1043. [Google Scholar]
- Storey, A.; Smith, H.K. Unique aspects of competitive weightlifting: performance, training and physiology. Sports Med. 2012, 42, 769–790. [Google Scholar] [CrossRef]
- DeWeese, B.H.; Hornsby, G.; Stone, M.; Stone, M.H. The training process: Planning for strength–power training in track and field. Part 2: Practical and applied aspects. J. Sport Health Sci. 2015, 4, 318–324. [Google Scholar] [CrossRef]
- Zatsiorsky, V.M.; Kraemer, W.J. Science and Practice of Strength Training; Human Kinetics: Champaign, IL, USA, 2006; pp. 89–107. [Google Scholar]
- DeWeese, B.H.; Hornsby, G.; Stone, M.; Stone, M.H. The training process: Planning for strength–power training in track and field. Part 1: Theoretical aspects. J. Sport Health Sci. 2015, 4, 308–317. [Google Scholar] [CrossRef]
- Hornsby, W.G.; Gentles, J.A.; MacDonald, C.J.; Mizuguchi, S.; Ramsey, M.W.; Stone, M.H. Maximum Strength, Rate of Force Development, Jump Height, and Peak Power Alterations in Weightlifters across Five Months of Training. Sports 2017, 5, 78. [Google Scholar] [CrossRef] [PubMed]
- Beckham, G.; Mizuguchi, S.; Carter, C.; Sato, K.; Ramsey, M.; Lamont, H.; Hornsby, G.; Haff, G.; Stone, M. Relationships of isometric mid-thigh pull variables to weightlifting performance. J. Sports Med. Phys. Fitness 2013, 53, 573–581. [Google Scholar] [PubMed]
- Haff, G.G.; Carlock, J.M.; Hartman, M.J.; Kilgore, J.L. Force-time curve characteristics of dynamic and isometric muscle actions of elite women olympic weightlifters. J. Strength Cond. Res. 2005, 19, 741. [Google Scholar] [PubMed]
- Maffiuletti, N.A.; Aagaard, P.; Blazevich, A.J.; Folland, J.; Tillin, N.; Duchateau, J. Rate of force development: Physiological and methodological considerations. Eur. J. Appl. Physiol. 2016, 116, 1091–1116. [Google Scholar] [CrossRef] [PubMed]
- Taber, C.; Bellon, C.; Abbott, H.; Bingham, G.E. Roles of maximal strength and rate of force development in maximizing muscular power. Strength Cond. J. 2016, 38, 71–78. [Google Scholar] [CrossRef]
- Norris, D.; Joyce, D.; Siegler, J.; Clock, J.; Lovell, R. Recovery of Force-Time Characteristics Following Australian Rules Football Matches: Examining the Utility of the Isometric Mid-Thigh Pull. Int. J. Sport Physiol. 2018, 1–18. [Google Scholar] [CrossRef]
- Haff, G.G.; Ruben, R.P.; Lider, J.; Twine, C.; Cormie, P. A comparison of methods for determining the rate of force development during isometric midthigh clean pulls. J. Strength Cond. Res. 2015, 29, 386–395. [Google Scholar] [CrossRef]
- Van Cutsem, M.; Duchateau, J.; Hainaut, K. Changes in single motor unit behaviour contribute to the increase in contraction speed after dynamic training in humans. J. Physiol. 1998, 513, 295–305. [Google Scholar] [CrossRef]
- Gruber, M.; Gollhofer, A. Impact of sensorimotor training on the rate of force development and neural activation. Eur. J. Appl. Physiol. 2004, 92, 98–105. [Google Scholar] [CrossRef] [Green Version]
- Andersen, L.L.; Aagaard, P. Influence of maximal muscle strength and intrinsic muscle contractile properties on contractile rate of force development. Eur. J. Appl. Physiol. 2006, 96, 46–52. [Google Scholar] [CrossRef]
- Andersen, L.L.; Andersen, J.L.; Zebis, M.K.; Aagaard, P. Early and late rate of force development: Differential adaptive responses to resistance training? Scand. J. Med. Sci. Sports 2010, 20, e162–e169. [Google Scholar] [CrossRef]
- Methenitis, S.; Spengos, K.; Zaras, N.; Stasinaki, A.-N.; Papadimas, G.; Karampatsos, G.; Arnaoutis, G.; Terzis, G. Fiber Type Composition And Rate Of Force Development In Endurance And Resistance Trained Individuals. J. Strength Cond. Res. 2017. [Google Scholar] [CrossRef] [PubMed]
- Folland, J.; Buckthorpe, M.; Hannah, R. Human capacity for explosive force production: Neural and contractile determinants. Scand. J. Med. Sci. Sports 2014, 24, 894–906. [Google Scholar] [CrossRef] [PubMed]
- Rodríguez-Rosell, D.; Pareja-Blanco, F.; Aagaard, P.; González-Badillo, J.J. Physiological and methodological aspects of rate of force development assessment in human skeletal muscle. Clin. Physiol. Funct. Imaging 2017, 38, 743–762. [Google Scholar] [CrossRef] [PubMed]
- Kavvoura, A.; Zaras, N.; Stasinaki, A.-N.; Arnaoutis, G.; Methenitis, S.; Terzis, G. The Importance of Lean Body Mass for the Rate of Force Development in Taekwondo Athletes and Track and Field Throwers. J. Funct. Morphol. Kinesiol. 2018, 3, 43. [Google Scholar] [CrossRef]
- Verkhoshansky, Y. Programming and Organization of Training; Sportivny Press: Livonia, MI, USA, 1988; pp. 127–153. [Google Scholar]
- Stone, M.H.; Sanborn, K.; O’bryant, H.S.; Hartman, M.; Stone, M.E.; Proulx, C.; Ward, B.; Hruby, J. Maximum strength-power-performance relationships in collegiate throwers. J. Strength Cond. Res. 2003, 17, 739–745. [Google Scholar]
- Verkoshanksy, Y.; Siff, M.C. Supertraining; Supertraining Institute: Denver, CO, USA, 2003; pp. 83–88. [Google Scholar]
- Stone, M.H.; Stone, M.; Sands, W.A. Principles and Practice of Resistance Training; Human Kinetics: Champaign, IL, USA, 2007; pp. 260–264. [Google Scholar]
- Luden, N.; Hayes, E.; Galpin, A.J.; Minchev, K.; Jemiolo, B.; Raue, U.; Trappe, T.A.; Harber, M.P.; Bowers, T.; Trappe, S.W. Myocellular basis for tapering in competitive distance runners. J. Appl. Physiol. 2010, 108, 1501–1509. [Google Scholar] [CrossRef] [Green Version]
- Murach, K.; Raue, U.; Wilkerson, B.; Minchev, K.; Jemiolo, B.; Bagley, J.; Luden, N.; Trappe, S. Single muscle fiber gene expression with run taper. PLoS ONE 2014, 9, e108547. [Google Scholar] [CrossRef]
- Häkkinen, K.; Kallinen, M.; Komi, P.V.; Kauhanen, H. Neuromuscular adaptations during short-term “normal” and reduced training periods in strength athletes. Electromyogr. Clin. Neurophysiol. 1991, 31, 35–42. [Google Scholar]
- Aagaard, P.; Thorstensson, A. Neuromuscular aspects of exercise–adaptive responses evoked by strength training. In Textbook of Sports Medicine: Basic Science and Clinical Aspects of Sports Injury and Physical Activity; John Wiley & Sons: Hoboken, NJ, USA, 2008. [Google Scholar]
- Harridge, S.; Bottinelli, R.; Canepari, M.; Pellegrino, M.; Reggiani, C.; Esbjörnsson, M.; Saltin, B. Whole-muscle and single-fibre contractile properties and myosin heavy chain isoforms in humans. Pflügers Arch. 1996, 432, 913–920. [Google Scholar] [CrossRef]
- Zaras, N.D.; Stasinaki, A.-N.E.; Methenitis, S.K.; Krase, A.A.; Karampatsos, G.P.; Georgiadis, G.V.; Spengos, K.M.; Terzis, G.D. Rate of force development, muscle architecture, and performance in young competitive track and field throwers. J. Strength Cond. Res. 2016, 30, 81–92. [Google Scholar] [CrossRef]
- Hides, J.A.; Richardson, C.A.; Jull, G.A. Magnetic resonance imaging and ultrasonography of the lumbar multifidus muscle. Comparison of two different modalities. Spine 1995, 20, 54–58. [Google Scholar] [CrossRef] [PubMed]
- Palmer, T.B.; Akehi, K.; Thiele, R.M.; Smith, D.B.; Thompson, B.J. Reliability of panoramic ultrasound imaging in simultaneously examining muscle size and quality of the hamstring muscles in young, healthy males and females. Ultrasound Med. Biol. 2015, 41, 675–684. [Google Scholar] [CrossRef]
- Raadsheer, M.; Van Eijden, T.; Van Spronsen, P.; Van Ginkel, F.; Kiliaridis, S.; Prahl-Andersen, B. A comparison of human masseter muscle thickness measured by ultrasonography and magnetic resonance imaging. Arch. Oral Biol. 1994, 39, 1079–1084. [Google Scholar] [CrossRef]
- Blazevich, A.J.; Gill, N.D.; Bronks, R.; Newton, R.U. Training-specific muscle architecture adaptation after 5-wk training in athletes. Med. Sci. Sports & Exerc. 2003, 35, 2013–2022. [Google Scholar]
- Bazyler, C.D.; Mizuguchi, S.; Harrison, A.P.; Sato, K.; Kavanaugh, A.A.; DeWeese, B.H.; Stone, M.H. Changes in muscle architecture, explosive ability, and track and field throwing performance throughout a competitive season and after a taper. J. Strength Cond. Res. 2017, 31, 2785–2793. [Google Scholar] [CrossRef]
- Nimphius, S.; McGuigan, M.R.; Newton, R.U. Changes in muscle architecture and performance during a competitive season in female softball players. J. Strength Cond. Res. 2012, 26, 2655–2666. [Google Scholar] [CrossRef]
- Schoenfeld, B.J. The Mechanisms of Muscle Hypertrophy and Their Application to Resistance Training. J. Strength Cond. Res. 2010, 24, 2857–2872. [Google Scholar] [CrossRef] [Green Version]
- Schoenfeld, B.J.; Ogborn, D.; Krieger, J.W. Dose-response relationship between weekly resistance training volume and increases in muscle mass: A systematic review and meta-analysis. J. Sports Sci. 2017, 35, 1073–1082. [Google Scholar] [CrossRef]
- Bazyler, C.D.; Mizuguchi, S.; Sole, C.J.; Suchomel, T.J.; Sato, K.; Kavanaugh, A.A.; DeWeese, B.H.; Stone, M.H. Jumping Performance is Preserved but Not Muscle Thickness in Collegiate Volleyball Players After a Taper. J. Strength Cond. Res. 2018, 32, 1020–1028. [Google Scholar] [CrossRef]
- Bazyler, C.D.; Mizuguchi, S.; Zourdos, M.C.; Sato, K.; Kavanaugh, A.A.; DeWeese, B.H.; Breuel, K.F.; Stone, M.H. Characteristics of a National Level Female Weightlifter Peaking for Competition: A Case Study. J. Strength Cond. Res. 2018, 32, 3029–3038. [Google Scholar] [CrossRef]
- DeWeese, B.; Sams, M.; Serrano, A. Sliding toward Sochi—Part 1: A review of programming tactics used during the 2010–2014 quadrennial. Natl. Strength Cond. Assoc. Coach 2014, 1, 30–42. [Google Scholar]
- Judelson, D.A.; Maresh, C.M.; Farrell, M.J.; Yamamoto, L.M.; Armstrong, L.E.; Kraemer, W.J.; Volek, J.S.; Spiering, B.A.; Casa, D.J.; Anderson, J.M. Effect of hydration state on strength, power, and resistance exercise performance. Med. Sci. Sports & Exerc. 2007, 39, 1817–1824. [Google Scholar] [CrossRef]
- Wagle, J.P.; Carroll, K.M.; Cunanan, A.J.; Taber, C.B.; Wetmore, A.; Bingham, G.E.; DeWeese, B.H.; Sato, K.; Stuart, C.A.; Stone, M.H. Comparison of the Relationship between Lying and Standing Ultrasonography Measures of Muscle Morphology with Isometric and Dynamic Force Production Capabilities. Sports 2017, 5, 88. [Google Scholar] [CrossRef] [PubMed]
- Hopkins, W.; Marshall, S.; Batterham, A.; Hanin, J. Progressive statistics for studies in sports medicine and exercise science. Med. Sci. Sports & Exerc. 2009, 41, 3. [Google Scholar]
- Damas, F.; Phillips, S.M.; Lixandrão, M.E.; Vechin, F.C.; Libardi, C.A.; Roschel, H.; Tricoli, V.; Ugrinowitsch, C. Early resistance training-induced increases in muscle cross-sectional area are concomitant with edema-induced muscle swelling. Eur. J. Appl. Physiol. 2016, 116, 49–56. [Google Scholar] [CrossRef] [PubMed]


| Sex | Age (years) | Height (cm) | BM (kg) | BF (%) | RT Age (years) | WL Age (years) | Snatch (kg) | C & J (kg) | IPF (N) |
|---|---|---|---|---|---|---|---|---|---|
| Males | 22.4 ± 1.6 | 169.9 ± 3.8 | 83.7 ± 7.0 | 11.7 ± 3.0 | 5.4 ± 1.0 | 3.8 ± 0.4 | 117.6 ± 8.2 | 147.8 ± 13.6 | 6147.2 ± 860.6 |
| Females | 20.5 ± 2.6 | 157.3 ± 4.0 | 57.6 ± 7.2 | 16.8 ± 1.9 | 7.0 ± 3.1 | 6.5 ± 3.2 | 69.3 ± 8.0 | 90.8 ± 10.1 | 4431.0 ± 609.7 |
| Phase | Week | Sets × Reps | Daily Intensities (M, W, Th, S) |
|---|---|---|---|
| SE | 1 | 3 × 10 | M, M, VL, VL |
| SE | 2 | 3 × 10 | MH, MH, L, L |
| SE | 3 | 3 × 10 | L, L, VL, VL |
| SP | 1 | 3 × 5 (1 × 5) | M, M, L, VL |
| SP | 2 | 3 × 5 (1 × 5) | MH, MH, L, VL |
| SP | 3 | 3 × 3 (1 × 5) | H, H, L, VL |
| SP | 4 | 3 × 2 (1 × 5) | MH, L, VL, VL |
| PT | 1 | 5 × 5 (1 × 5) | MH, M, L, VL |
| PT | 2 | 3 × 3 (1 × 5) | M, MH, VL, VL |
| PT | 3 | 3 × 3 (1 × 5) | MH, M, VL, VL |
| PT | 4 | 3 × 2 (1 × 5) | ML, L, VL, Meet |
| Day | Strength-Endurance | Strength-Power | Peak/Taper |
|---|---|---|---|
| Monday/Thursday | AM | AM | AM |
| Back Squat | Back Squat | Back Squat* | |
| PM | PM | ||
| PM | Push Press | Jerk | |
| Push Press | Jerk Lockout | Dead Stop Parallel Squat** | |
| Press from split | BTN Press | BTN Press | |
| DB Press | DB Press | DB Press* | |
| Wednesday | AM | AM | AM |
| Snatch Tech | Snatch Tech | Snatch Tech | |
| CGSS | CGSS | CGSS | |
| CG Pull–Floor | CG Pull–Floor | CG Pull–PP | |
| PM | PM | PM | |
| Snatch Tech | Snatch Tech | Snatch Tech | |
| CGSS | CGSS | SGSS | |
| CG Pull–PP | CG Pull–Knee | SG Pull–Floor | |
| CG SLDL | CG SLDL | CG SLDL* | |
| DB Row | CG Bent Over Row | DB Row* | |
| Saturday | Snatch Tech | Snatch Tech | Snatch Tech |
| SGSS | SGSS | SGSS | |
| Snatch | Snatch | Snatch | |
| C & J | C & J | C & J | |
| SG SLDL | SG SLDL | SG SLDL | |
| DB Row | SG Bent Over Row | DB Row |
| Variable | T1 | T2 | T3 | T4 | T5 |
|---|---|---|---|---|---|
| PF (N) | 4956 ± 1418 | 4942 ± 1499 | 4884 ± 1412 | 4948 ± 1378 | 4902 ± 1224 |
| RFD50 (N·S−1) | 2452 ± 1329 | 2392 ± 1820 | 2910 ± 1416 | 2503 ± 1290 | 3111 ± 1478 |
| RFD100 (N·S−1) | 5183 ± 3253 | 4808 ± 3455 | 6240 ± 3494 | 5379 ± 2325 | 6436 ± 3108 |
| RFD150 (N·S−1) | 7699 ± 4332 | 7112 ± 4170 | 8565 ± 4524 | 7852 ± 2999 | 8687 ± 4397 |
| RFD200 (N·S−1) | 8397 ± 3970 | 7850 ± 3853 | 9116 ± 3936 | 8465 ± 2955 | 8542 ± 3965 |
| RFD250 (N·S−1) | 7830 ± 3243 | 7450 ± 3226 | 8290 ± 2991 | 7917 ± 2261 | 7420 ± 2945 |
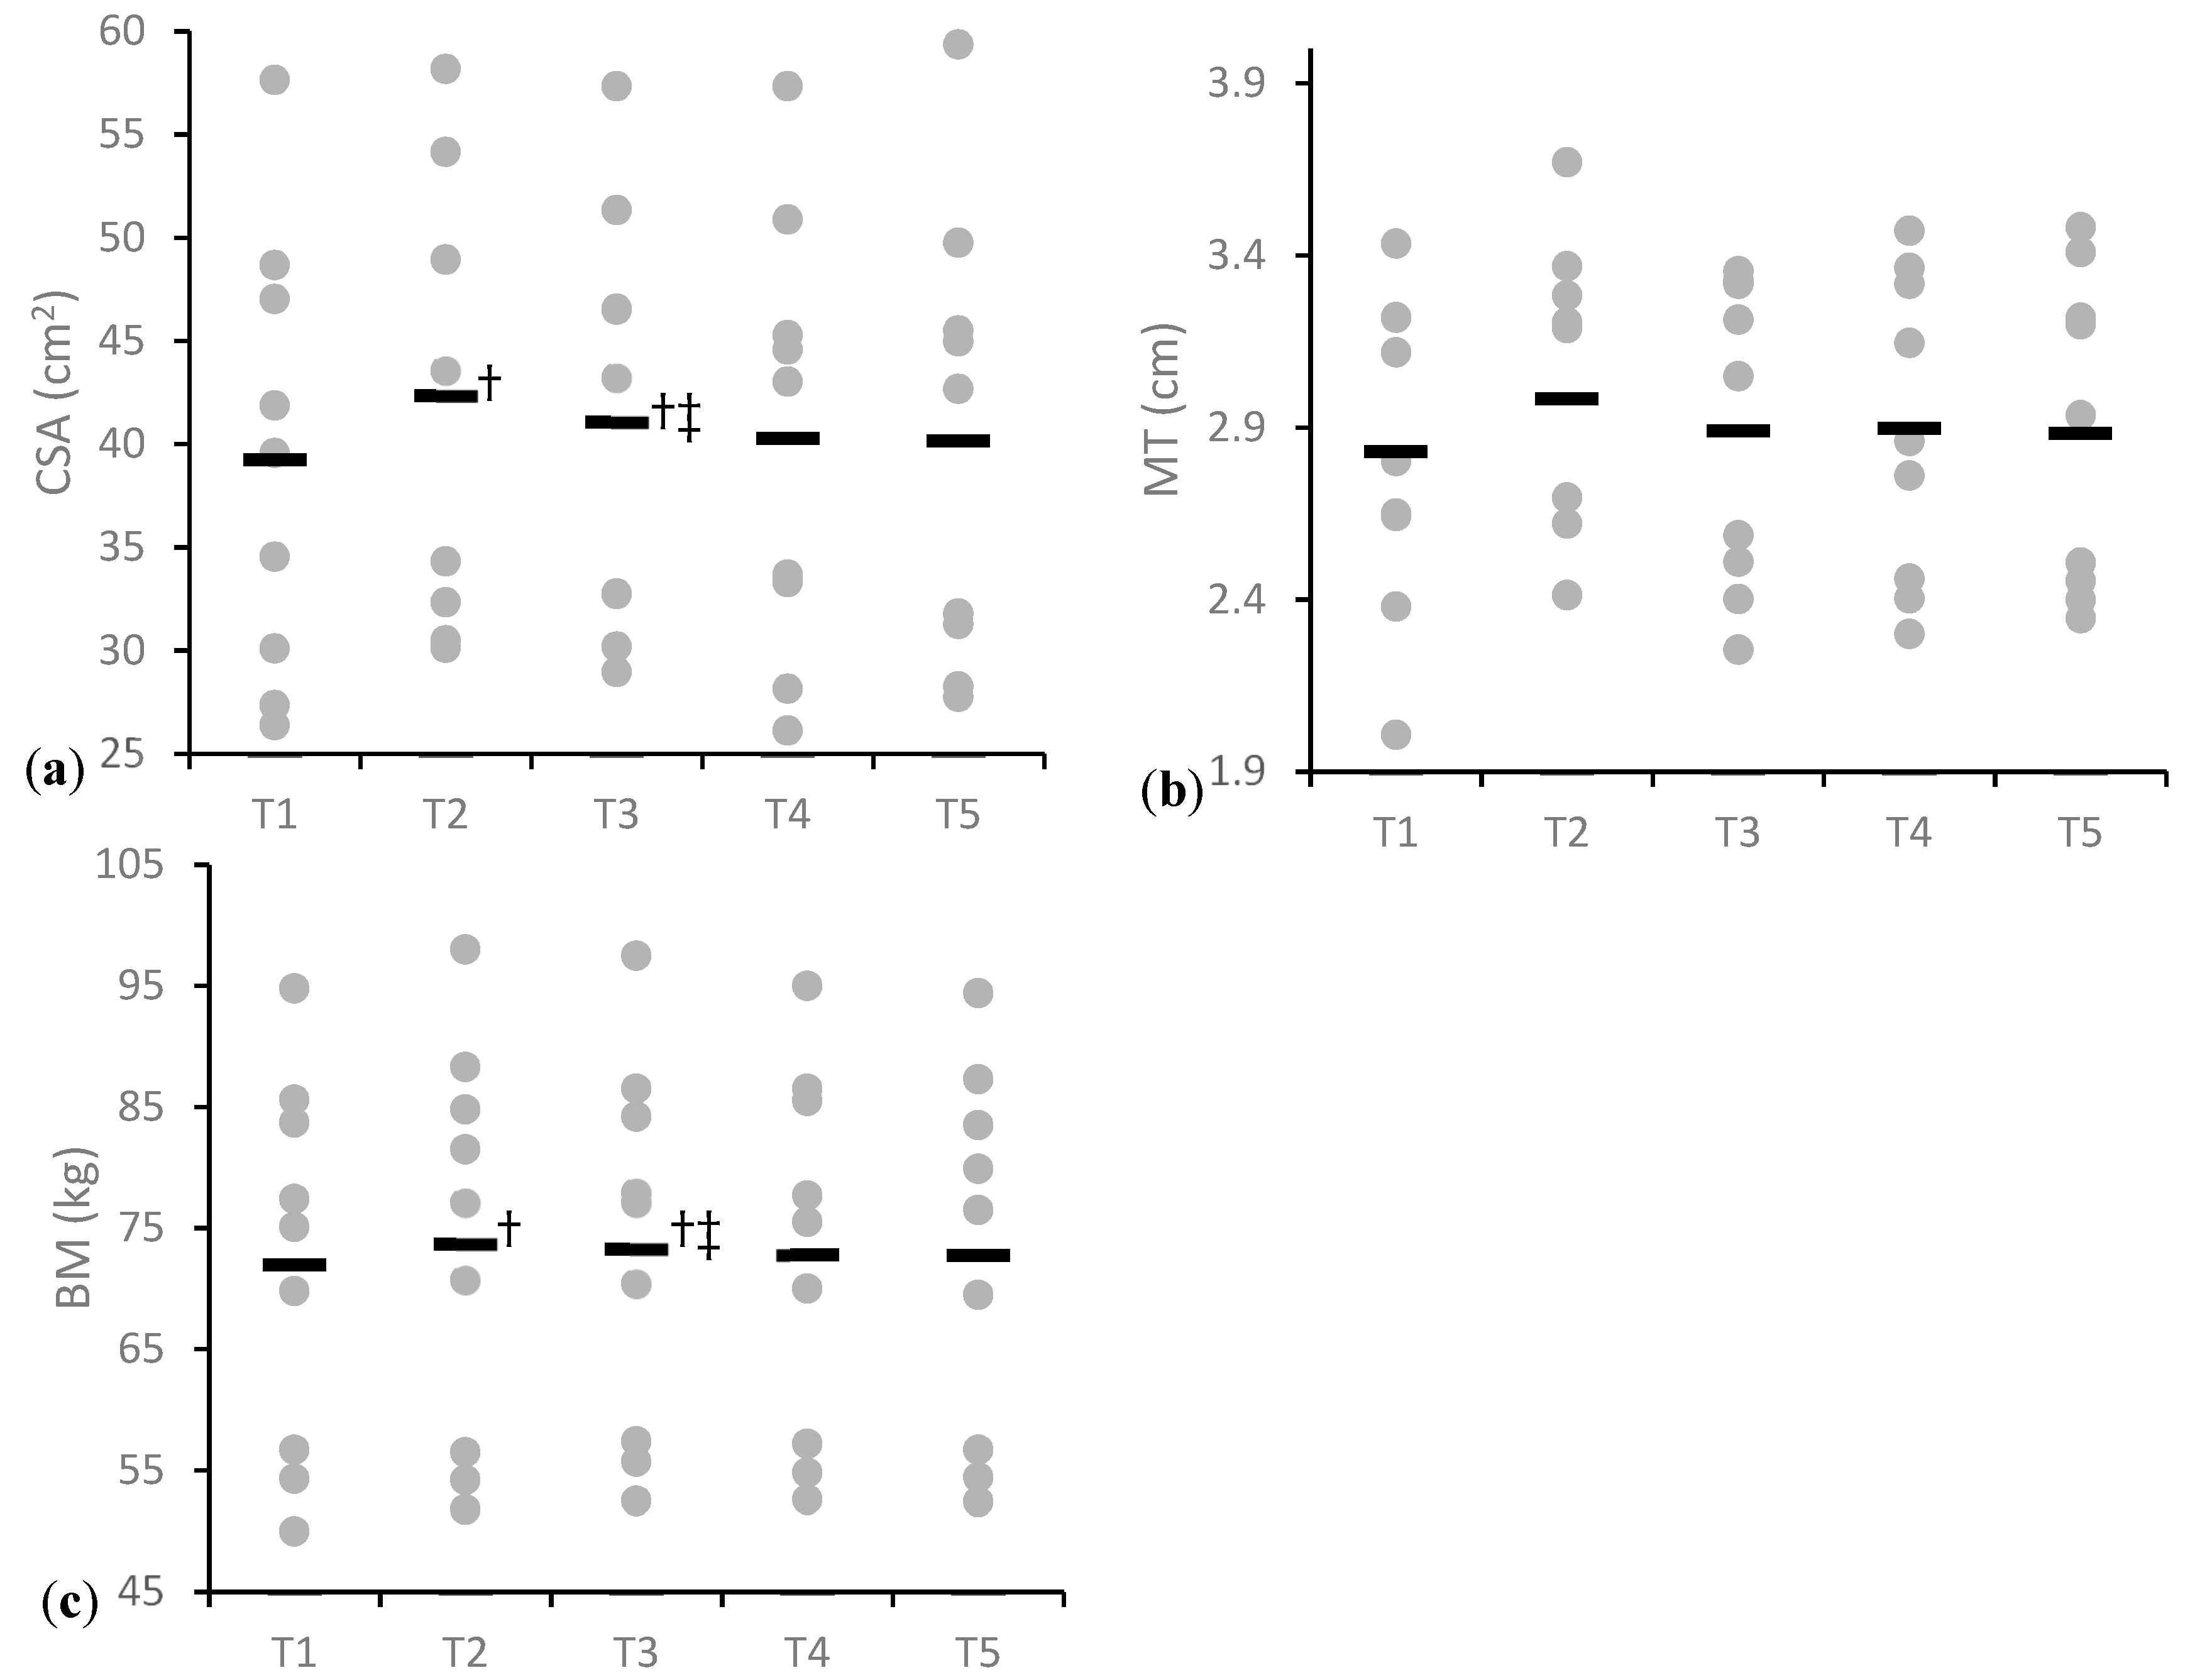
| BM (kg) | 71.9 ± 14.5 | 73.6 ± 15.5 † | 73.2 ± 14.5 †‡ | 72.7 ± 14.3 | 72.7 ± 14.4 |
| CSA (cm2) | 39.2 ± 10.0 | 42.3 ± 10.1 † | 41.0 ± 9.6 †‡ | 40.2 ± 9.9 | 40.1 ± 10.3 |
| MT (cm) | 2.82 ± 0.43 | 2.98 ± 0.43 | 2.88 ± 0.42 | 2.89 ± 0.42 | 2.88 ± 0.43 |
| PA (°) | 21.2 ± 5.45 | 21.5 ± 3.64 | 21.01 ± 5.16 | 19.9 ± 3.93 | 19.3 ± 4.89 |
| FL (cm) | 8.1 ± 1.9 | 8.2 ± 1.0 | 8.4 ± 2.1 | 8.7 ± 1.8 | 9.0 ± 1.3 |
© 2019 by the authors. Licensee MDPI, Basel, Switzerland. This article is an open access article distributed under the terms and conditions of the Creative Commons Attribution (CC BY) license (http://creativecommons.org/licenses/by/4.0/).
Share and Cite
Suarez, D.G.; Mizuguchi, S.; Hornsby, W.G.; Cunanan, A.J.; Marsh, D.J.; Stone, M.H. Phase-Specific Changes in Rate of Force Development and Muscle Morphology Throughout a Block Periodized Training Cycle in Weightlifters. Sports 2019, 7, 129. https://doi.org/10.3390/sports7060129
Suarez DG, Mizuguchi S, Hornsby WG, Cunanan AJ, Marsh DJ, Stone MH. Phase-Specific Changes in Rate of Force Development and Muscle Morphology Throughout a Block Periodized Training Cycle in Weightlifters. Sports. 2019; 7(6):129. https://doi.org/10.3390/sports7060129
Chicago/Turabian StyleSuarez, Dylan G., Satoshi Mizuguchi, William Guy Hornsby, Aaron J. Cunanan, Donald J. Marsh, and Michael H. Stone. 2019. "Phase-Specific Changes in Rate of Force Development and Muscle Morphology Throughout a Block Periodized Training Cycle in Weightlifters" Sports 7, no. 6: 129. https://doi.org/10.3390/sports7060129