Abstract
Recreational facilities are widely regarded as one of the largest sources of and contributors to the tourism of countries worldwide. Given this, this study aimed to examine adults’ general behavioral intentions and actual visitation to amusement and recreational facilities. A total of 1367 adult and young-adult Filipinos voluntarily answered a self-administered survey consisting of measure items drawing on the extended theory of planned behavior framework. Structural equation modeling was employed for the simultaneous analysis of all latent variables and their causal relationships, and the marketing mix greatly affected the hedonic motivation and perceived behavioral control, leading to an indirect effect on behavioral intentions and actual visitation. Subjective norms and attitudes also had a significant direct effect on behavioral intentions and indirect effects on actual visitation. Interestingly, the marketing mix prompted a higher significant effect than behavioral intentions on actual visitation. It was implied that consumers are going to recreational facilities and amusement parks when they can visit an area, access a location, participate in different activities, and have enough resources. Businesses may capitalize on this finding in promoting their amusement parks and recreational facilities. In addition, they may highlight their location and space because they are among the highly significant measured items that the participants noted. The results of this study provides insights into the strategies, individual behavior, and motivation aspects. Implications and managerial insights are provided for the study’s adoption and extension worldwide.
1. Introduction
Amusement parks, also known as theme parks, have been established for people’s entertainment and enjoyment, featuring fun challenges where they can collect rewards and win prizes. Their aim is to provide pleasure and leisure activities among family and friends [1]. According to the International Association of Amusement Parks and Attractions [2], the US alone has a total of 400 amusement parks—including water parks—generating a total of USD 24 billion in 2017. This value increased in the past decade, as 154 million people from different countries visited these amusement parks, which shows their continuous success in the upcoming years. In addition, recreational facilities are establishments where leisure is also provided. Similar to amusement parks, they also provide fun and entertaining activities that focus more on the physical and cognitive aspects.
Recreational facilities may include fitness centers, swimming pools, saunas, playgrounds, and the like. As explained in the study of Sato et al. [3], these parks and facilities are enjoyed by not only children but also adults. It was indicated that parks and facilities also cater to adults, especially those who are near their retirement years, to engage them in physical and cognitive activities while experiencing leisure and fun. According to the study by Geissler and Rucks [4], these businesses are front-lining marketing, business designs, and experience-focused services. Milman et al. [5] established that this type of business led to an increase in tourism activities in different countries, bringing in about 7% of the total population, making global parks and facilities the most prominent in 2018. Moreover, 4% was added in the succeeding year, proving that the overall experience was deemed positive. However, there was a decline in visitation during the COVID-19 pandemic due to health concerns, lockdowns, and the closure of facilities.
Young adults and adults make up the majority of visitors in the current generation. It has also been noted that children are included, as one of such businesses’ main goals is to create bonds among family and friends, with their costs being paid by their parents and guardians. This means that their experiences and behavioral intentions should be the focus of these businesses, since they possess the resources for a visit. This area of study was seen to be scarce, and it should be examined to understand customers and build strategies to increase visitation behavior.
Researchers have found a steady and continuous increase in visitation as the world reopens after the COVID-19 pandemic [6]. However, various studies have only focused on other behavioral intentions during and after the pandemic. In the study of Milman et al. [5], it was seen that despite the pandemic, people were still willing to visit theme parks as long as there was space and sanitation available. There have been no behavioral-related studies on visitation, to which Milman et al. [5] suggested extending such research for a better assessment and evaluation. Accordingly, it was reported in the study by Choi et al. [7] that cultural differences affected visitation among businesses. In their study comparing Asian (Chinese) and American visitors, the latter group was hesitant and uncertain about foreign visitors. Products, pricing, and services were also an issue. According to the study by Liu et al. [8], the place creates issues for a business, thus leading them to simulate capacity. Since place [8], products, price, and services (or promotion) [7] affect consumer behavior, the need to identify the effects of these factors on behavior should also be assessed. With the different studies mentioned, there clearly is a need to analyze the behavioral intentions and actual visits to amusement parks and recreational facilities. Studies have only considered either the behavioral domain [5] or the marketing mix [7,8], and none have examined motivation. In addition, despite increasing visitation, little to no studies have focused on the visitation behavior among customers—especially at the end of the pandemic when an increase in visitations is seen.
Focusing on the Philippines, recreational facilities and amusement parks have been widely regarded as one of the largest contributors to tourism and the gross national product (GNP) [9]. Aside from information, parks and other recreational facilities provide entertainment, including arcades and video game houses, which provide customers with the chance to be challenged while enjoying these venues [10]. However, despite the apparent opportunities, only a small number of adults were recorded to have visited these businesses in the year 2022. This might have caused children to be influenced by the older generation, given that resources are provided by adults. Thus, a clear gap is seen in the overall behavioral intentions of young adults and adults when visiting parks and recreational facilities. In addition, no studies had been conducted on developing countries such as the Philippines in the context of behavioral intentions for and actual visitation to these facilities.
It could be seen that locals have travelled to several countries in order to experience amusement park services, theme parks, and recreational activities. As a per recent news, the Philippines’ largest amusement park has seen a diminished count of tourists—both local and international [11,12]. Despite having a size of 25 hectares and costing only about USD 35 for unlimited rides, many may have preferred going abroad to experience well-known amusement parks like Disneyland.
One of the challenges during the post-COVID-19 pandemic is ensuring safety and tragic-free experiences. It was observed that the local amusement park, Enchanted Kingdom, has partnered with Paramount and with the local government units like the Department of Tourism and the Department of Science and Technology to maximize the output of trips and avoid queues. This effort was made to increase customer satisfaction. The Philippines is highly considered as a good spot for tourism. In fact, in 2012, there were news circulating that had been high hopes of opening a Disneyland franchise [12]. Yet, to date, there have been no clear plans to open in the local area, contributing to people travelling abroad and spending more.
In different reports [13,14], the recreation and art industry in the Philippines indicated customers distributed their spending across the following areas: 33.2% on amusement and recreation activities, 29.4% on gambling, 24.8% on sports activities, 6.5% on art and entertainment, and 6.1% on libraries, archives, and museum. This shows that local tourism is enough to be competitive and is expected to reach 3 billion USD and grow at a CAR of 11% on a 2020–2025 forecast [14]. This means that there is a need for analyses on the intention and actual visitation of local tourists. Understanding this could help local tourism, especially amusement parks and other leisure activities, increase demand and visitation. With the rapid growth of tourism in the current era, competitive markets across the world, and accessibility among people, it is difficult to compete on a local perspective. Therefore, there is a need to establish local availability to increase visitation as well as economic growth from local and international tourists.
There are current studies that focus on these parks and facilities, but most of these dealt with play intervention among children [15], experience and behavior on virtual reality versus theme park experiences [16], health benefits [3], revisitation intention focusing economic aspects [1], advertisement among children [17], accessibility [18], culture influence [7], simulation [8], labor [19], park influence on racism [20], and cost and carbon emission [21]. Most of these recent studies also focused on how to increase customers, facilitate customers, develop strategies, and reduce cost among developed countries. However, one of the major gaps among these studies is the customers’ behavioral intentions to visit parks and recreational facilities in developing countries. In addition, most of them considered children as their primary audiences, but children are financed by parents. Thus, the understanding of tourist behavior could help increase competitive advantage and decipher proper actions that could be considered for marketing and economic development strategies.
To holistically measure the different behavioral aspects among visitors, one of the established theories that may be utilized is the theory of planned behavior (TPB). Ajzen [22] established the TPB from the theory of reasoned action, adding perceived behavioral control with the established attitude toward the behavior and subjective norm that is said to affect a person’s intention and actual behavior. Moreover, as explained in the study of Pahrudin et al. [23], the TPB needs an extension of other latent variables to holistically measure an individual’s behavior. In their study of post COVID-19 visitation intentions on a destination, they considered health consciousness as a latent variable to completely measure the actual behavior of an individual. Following the suggestion of related studies [1,4,8,15,16,17,18,19], it could be deduced that the 4Ps of marketing (marketing mix) should be incorporated in this study, since the place, price, promotion, and product (i.e., amusement parks and recreational facilities) affect an individuals’ intention to visit these businesses [7,8]. In a similar study by Ong et al. [24], they included the marketing mix as a factor affecting the open innovation dynamics in the theory of planned behavior. In addition, Anand et al. [25] indicated that both utilitarian and hedonic motivation affect customer satisfaction. Fung and Lee [26] also explained that many adults visit Disneyland because their friends and children persuade them. Lastly, according to Arnould et al. [27], there are four phases of visiting a facility: anticipation, purchase, the actual experience, and recollection. Thus, this study considered all factors to holistically measure the actual visitation behavior on amusement parks and recreational facilities.
To fill the gap, the main goal of this study is to holistically measure the behavioral intentions and actual visitation to amusement parks and recreational facilities in the Philippines. The study considered several latent variables such as motivation and marketing mix as an extension of the TPB model, leading to a wider perspective of behavioral factors. Considering a higher-order structural equation modeling, specific marketing mix variables may be identified to create strategies for the facilities, which were discussed in the implication section. The outcomes of this study could provide valuable insights in enhancing the overall satisfaction of customers of theme parks by enhancing their services, maintaining customer loyalty, attracting new clients, and ensuring an outstanding customer experience. Thus, the results of the study could be used as a reference for further investigations and apply the framework established by future researchers even in the area of tourism. The outcome could be a benchmark study in identifying significant factors affecting urban tourism behavior, enabling the creation and development of engaging local tourism, marketing strategy, and economic development strategy—linking the study to the theme of Special Issue of Tourism, Urban Culture, and Local Development under Societies. The paper has been designed to explain the (1) introduction and research gap, (2) conceptual framework, (3) methodology, (4) results, (5) discussion and implications, and (6) conclusion.
2. Literature Review
The definition of behavioral intention is a person’s expected or intended future action [22]. It may be operationalized as the likelihood to act and conveys an individual’s expectations about a certain behavior in a particular situation [28]. Lam and Hsu [29] stated that there is a rise in the capacity for revisiting a place which was accompanied by an increase in preferable attitude, subjective norm, and perceived behavioral control. It was said that their enjoyment, interest, and fun experience affected the behavioral intention of visiting the facilities. Moreover, Han and Kim [30] showed that revisiting intention is positively and significantly related to the intention, which is greatly affected by their enjoyment and positive experience. In addition, multisensory experiences, which are under the sphere of hedonic motivation, have been linked to the feeling of pleasure among consumers. According to Labbe et al. [31], coffee is an example of an item that is bought based on the perceived hedonic and utilitarian motivation of a consumer. Thus, the sensory enjoyment of the consumers in a given product can trigger an emotional and cognitive response which relates the two types of motivation [31].
Mohaidin et al. [32] showed that motivation is a factor which stimulates individuals to decide to revisit a destination. Sato et al. [3] said that the benefits of going to recreational facilities and amusement parks are being considered by adults. This means that utilitarian motivation plays a role among consumers and their intention.
Several studies have indicated that both hedonic and utilitarian motivations are preceding factors of behavioral intentions and are usually included as an extension of the framework on the TPB. Nardi et al. [33] believed that when there is an exchange of positive benefit among consumers (utilitarian), a positive behavior would be seen in their intentions. Similarly, individual concerns highlighted more the utilitarian motivations among the behaviors of individuals [34]. In relation to this study, it could be posited that self-regulation and functionality campaigns could promote positive behavioral intention among customers. Wang et al. [35] found that both motivational factors highlight the intention of an individual, which should be considered when extending theories like the TPB. Lifestyle and demographic characteristics were also other factors that could be explored as motivations for visitation. The younger generation would have higher hedonic factors, while those of the older generation may consider utilitarian values on theme park visitation, according to Wonf and Cheung [36]. When a fun experience is expected, Josiam and Henry [37] expressed that there is a need for the experience to be integrated so both motivational factors would be deemed significant, which is similar with the study of Kertasunjaya et al. [38].
Liu et al. [39] also said that games should be fun and entertaining to highlight hedonism, while direct experience and exchange for value is needed for utilitarian motivation. In relation to this study, both experience and enjoyment should be considered by facilities (e.g., costs, place, and experience). Lastly, Chang and Cheng [40] reiterated that both utilitarian and hedonic motivations are drivers of customer intention when purchasing products or services. When time is being considered, the stimuli and response of people are highlighted. Hence, this study hypothesized the following:
H1:
Hedonic motivation has a significant direct positive effect on the behavioral intention of visiting recreational facilities and amusement parks.
H2:
Utilitarian motivation has a significant direct positive effect on the behavioral intention of visiting recreational facilities and amusement parks.
The TPB model has helped explain why individuals choose to participate in certain activities. The theory has been used in several investigations to show a direct association between TPB variables and behavioral intention. The TPB model states that a person’s behavioral intention to perform a specific activity is determined by the individual’s behavioral intention to perform the behavior [41]. The person’s attitude, subjective norms, and perceived behavioral control are three factors that are associated with the behavior and affect this behavioral intention.
The TPB, as explained by Ajzen [42], has been widely utilized and questioned on its capacity to holistically measure the overall behavior among individuals. For example, the study presented by Ong et al. [43] showed that people’s overall behavior using the TPB measurement assesses only an insight based on the constructs made for each variable. This limits the capability of assessment for overall behavior. As a reflection, pro-environmental behavioral studies [44,45] reflected sustainability domains, or motivational factors [46], even other theories [47,48]. Their studies presented coherence on the integration for overall behavioral assessment, reflecting on the suggestion of Ajzen [42], stating that integration, extension, and model modification could be made as the model itself is flexible.
In order to determine and evaluate the revisiting behavior in recreational facilities, the current research has utilized the extended TPB. In particular, Park et al. [49] employed the TPB to explain the intent of Chinese college students to visit Japan for recreational activity and found that two of the three TPB components, subjective norms and attitudes, significantly predicted visit intention. Similarly, Lam and Hsu [29] found that although respondents’ attitudes were unrelated to their visiting plans, visitors’ perceptions of subjective norms and perceived behavioral control were significant. In contrast, Hsu and Songshan Huang [50] explained that both perceived behavioral control and attitude may have a significant impact on predicting, describing, and influencing visitors’ behavioral intentions to engage in certain behaviors like revisiting a particular location.
Moreover, studies like Abbasi et al. [51] highlighted that the value people perceived with the destination portrayed higher behavioral intention, that is, perceived behavioral control prompted a high impact on customer satisfaction and positive intention for visitation. Modifying the TPB framework, Pahrudin et al. [23] highlighted that perceived behavioral control and attitude highlighted tourist intentions to visit destinations post-pandemic. An interesting insight was obtained on subjective norms not being significant due to health concerns. Contrary to their findings, Azhar et al. [52] highlighted how the TPB domains prompted significant influences on rural destination traveling after the pandemic. It was because continued travel intention and travel engagement were the attributes of the measured individuals. Thus, the following were hypothesized:
H3:
The attitude of adults has a significant direct positive effect on the behavioral intention of visiting recreational facilities and amusement parks.
H4:
Subjective norms have a significant direct positive effect on the behavioral intention of visiting recreational facilities and amusement parks.
H5:
Perceived behavioral control has a significant direct positive effect on the behavioral intention of visiting recreational facilities and amusement parks.
The 4Ps of marketing are being utilized by marketers to highlight the purchasing powers among consumers [24]. It was explained by Loo and Leung [53] that the 4Ps of marketing—the price, product, promotions, and place—affected customer’s expectations and subsequently their experience and satisfaction. As a reflection, it could be posited that consumer’s perception of the service being provided could be an indication for their continued patronage—as suggested in their study covering hotel services. For example, Arnold and Reynolds [54] established how the infrastructure and landscape affect the motivation of individuals to perform a positive activity. Leng and Chin [55] proved that marketing mix factors affect the behavioral intention among individuals. It presented a significant effect on marketing mix and perceived behavioral control [24]. Lastly, Anjani et al. [56] discussed how positive motivation due to enjoyment, interest, and positive feeling affect customers’ loyalty. This would lead to a positive significant effect on hedonic motivation.
In relation to the current study, the 4Ps of marketing greatly affect individual behavior, intention, and motivation in recreational facilities and amusement parks [1,4,8,15,16,17,18,19]. The study of Kim and Park [57] explained that marketing mix has a positive influence on attitude. It was explained in their study that people’s decisions based on price, place, and product greatly influence attitude and behavioral intentions. Aime et al. [58] also presented similar findings, indicating that the affective behavior, cognitive, and commerce perspective influenced that attitude for positive intention among consumers. Jaminyasa et al. [59] also explained a great influence of behavioral intention when consumers are deciding on what to purchase, which was preceded by marketing mix factors using the 4Ps. Khanta et al. [60] further demonstrated the effect of marketing mix not just on attitude but also on utilitarian motivation. Their study presented that lifestyle and equity built a positive effect on consumer’s behavioral intention. Similarly, Chou et al. [61] delved into the thought of perceived quality and customer social responsibility and built the positive effect of the utilitarian concept and behavioral factors on behavioral intentions. Therefore, the following were hypothesized:
H6:
Marketing mix has a significant direct positive effect on perceived behavioral control.
H7:
Marketing mix has a significant direct positive effect on attitude.
H8:
Marketing mix has a significant direct positive effect on the hedonic motivation of individuals.
H9:
Marketing mix has a significant direct positive effect on the utilitarian motivation of individuals.
H10:
Marketing mix has a significant direct positive effect on the behavioral intention of visiting recreational facilities and amusement parks.
In a study conducted by Labbe et al. [31], it was revealed that certain attributes such as pleasantness and pleasure are different factors affecting positive emotional response on actual behaviors of individuals. In relation to this study, when enjoyment and fun activities are offered, people lean towards a positive actual behavior on continuous visits to recreational facilities and amusement parks [7]. It was also explained that one of the major factors could be the establishment of motivational experiences. On the other hand, Olson [62] reported that the level and type of marketing mixes within a particular market, whether it is sustainable or not, provides effects on the purchasing intentions and powers of the consumer within the society. When this is implemented positively, a positive behavioral intention affecting actual behavior among consumers is observed. Also, behavioral intention from the TPB has established a positive significant effect on actual behavior among individuals. Thus, the following was hypothesized:
H11:
Behavioral intentions has a significant direct positive effect on the actual visitation intention of visiting recreational facilities and amusement parks.
3. Methodology
3.1. Conceptual Framework
The visit of amusement parks and recreational activities is one of the most well-liked activities, being adored by both domestic and foreign visitors. Based on the different studies discussed, the experience of visiting may produce positive emotions or feelings that range from pleasure to aesthetic shock, appreciation, relaxation, serenity, and calmness. In relation, a generalized overview of the actual visit intention on recreational facilities and amusement parks was evaluated in this study using an extended TPB, as seen in Figure 1. A total of 11 hypotheses with higher-order constructs were created.
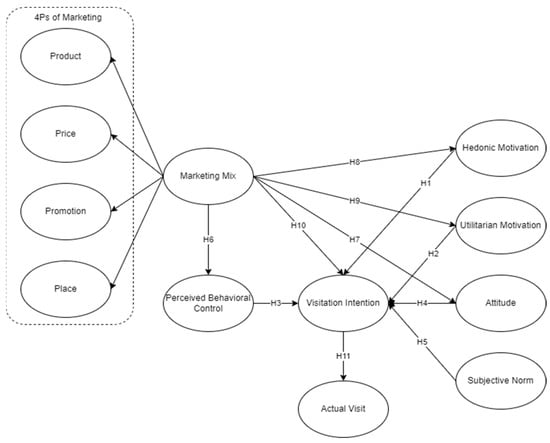
Figure 1.
Conceptual research framework.
3.2. Participants
This study has accumulated a total number of 1367 valid participants. Following the study of German et al. [48], a total of 400 respondents is needed to generalize 62.6 million Filipinos with 95% confidence. Using purposive sampling, the study was able to accumulate responses among people who have experienced going to amusement parks and recreational facilities. This evaluated only those who have experienced going to recreational and amusement parks. A filtering question at the beginning asking the respondents whether they have experienced going to the different recreational facilities in the country was included. Those who answered yes continued with the survey, while those who answered no were directed to the end of the survey (thank you remarks).
Table 1 presents the demographic characteristics of the respondents with the majority being female (65.47%), while the rest were male. Most of them were 18–25 years old (32.85%) and 26–35 years old (29.04%)—representing young adults, while the rest are adults who are single (73%), married (17.85%), and the rest are separated (7.610%) or widowed (1.54%). In addition, most are living in urban areas (72.13%) who are employed/self-employed (75.86%) with 30,000–39,000 PhP monthly income (17.79%) or higher.

Table 1.
Respondents’ demographic profile (n = 1367).
Based on the report by the Philippine Statistics Government [63], only 4.8% of people are older than 65 years old, 32% are 14 years old and below, and the rest are 15–64 years old. In this study, the majority of responses are from 18 to 45 years old (86.16% in total), a few are 46–55 years old (10.46%), and only 3.36% are older people. These can be good representatives when it comes to age groups. On the other hand, there is a higher percentage of single citizens than married and widowed in the Philippines, and the employment rate was recorded to increase given the work-from-home set-ups [64]. With the higher minimum wage being implemented, the salary range increased presently. However, there is almost an equal number of males and females, which is one limitation of this study, since purposive sampling was employed. A higher number of respondents would gain better SEM quality [65].
3.3. Questionnaire
The questionnaire utilized in this study consisted of measure items adapted from several studies, as presented in Table 2. The questionnaire administered collected consent forms and acceptance by an Ethics Committee before proceeding. In accordance, participants were given the option to continue or decline answering if they feel uncomfortable. A 5-point Likert scale was used by the respondents for the items. Prior to dissemination, a preliminary test involving 150 respondents was conducted which resulted in an acceptable Cronbach’s alpha value (≥0.70).
Table 2.
Constructs and measure items.
3.4. Structural Equation Modeling (SEM)
SEM is a multivariate tool used to analyze the causal relationship among latent variables. As explained by Hair and Alamer [69], it is beneficial to use SEM when there are several latent variables assessing a target output. In the case of this study, several extensions and analyses are needed for a holistic measurement of actual behavior for visiting recreational facilities and amusement parks. The total effects of the different relationship may be obtained with the use of SEM [65]. Similar to the study of Choi et al. [7], they utilized SEM to analyze the purchasing decisions among amusement park customers. Lam and Hsu [29] established different significant relationships using SEM for travel destination intentions. Lastly, Lee et al. [1] also considered SEM in analyzing the causal relationship among theme park visitors and their experience, satisfaction, and revisitation intention in the context of economics. As suggested by Sarstedt et al. [70], Partial Least Square SEM (PLS-SEM) may be employed when a deeper analysis is needed such as performing higher-order construct analyses. In this study, marketing mix was considered, and we employed higher-order SEM. It was suggested that this type of analysis would be beneficial for path identification, since it reduces the number of relationships. Following the research of Fan et al. [71], they posited that the more the paths were considered, the lower the significance of other latent variables. Therefore, this study employed PLS-SEM analysis using SMART PLS v3 for the higher-order SEM analysis.
4. Results
Figure 2 presents the initial SEM considered in this study. The broken lines indicate nonsignificant relationships (H2 and H4) because they have p-values greater than 0.05 [65]. Moreover, as suggested by Dash and Paul [72], items with less than 0.70 values are insignificant (PL3, P1, PBC2, PBC3, AV2, SN3—represented as broken lines). Following the suggestion [65,72], these were removed and were not considered as measure items for their respective latent variables.
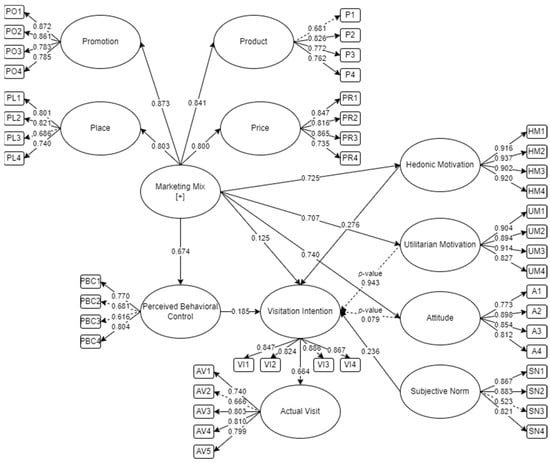
Figure 2.
Initial SEM for assessing actual visitation of recreational facilities.
The final SEM is presented in Figure 3. It could be observed that 9 hypotheses were accepted out of the 11 hypotheses. The detailed descriptive statistics are presented in Table 3, including the initial and final factor loadings and their validity.
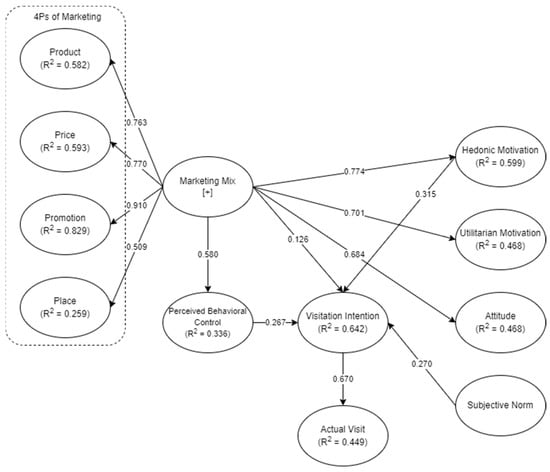
Figure 3.
Final SEM for assessing actual visitation of recreational facilities.
Table 3.
Descriptive statistics and construct validity.
As expressed by Hair [65], as adapted by other studies [24,73], the accepted composite reliability values, together with the Cronbach’s alpha, should be greater than or equal to 0.70. Accordingly, the average variance extracted should be greater than 0.50. These results showed higher values than the threshold, which indicates the validity of the constructs used in this study.
To further validate the outcome of this study, it is suggested that divergent validity should be employed. The Fornell–Larcker criterion (Table 4) should present diagonal values (presented in bold) greater than their correlational analyses output—vertically and horizontally [74]. Further support on the validity measure is the Monte Carlo adapted measure using the Heterotriat–Monotrait (HTMT) ratio, as presented in Table 5. As suggested, the threshold could either be 0.85 or 0.90 [69,72,74,75]. It could be seen from the output that validity has been achieved both on the convergent and discriminant measures.
Table 4.
Fornell–Larcker criterion.
Table 5.
HTMT ratio.
Lastly, the model fit indices using PLS-SEM was considered. The Normal Fit Index (NFI) has a value of 0.911, greater than the threshold, and Chi square/dF was lower than the threshold [76,77,78,79,80]. Moreover, the Standardized Root Mean Squared Residual (SRMR) has a value of 0.072, which is less than the set threshold [76,77,78]. Lastly, other model fit indices such as the Root Mean Square Error of Approximation (RMSEA), Comparative Fit Index (CFI), Incremental Fit Index (IFI), Parsimonious Comparative Fit Index (PCFI), and Parsimonious Normed Fit Index (PNFI) were within the set threshold from related studies [69,72]. This indicates that the model is acceptable, as presented in Table 6.
Table 6.
Model fit.
The decision of the different hypotheses, together with their beta and p-values, are presented in Table 7. It could be observed that the marketing mix had the highest influence, which was followed by the intention to visit, hedonic motivation, and behavioral factors. From the higher-order constructs, promotion was seen to be the highest, which was followed by product and price, and least is the place.
Table 7.
Hypotheses decision summary.
5. Discussion
The highest significant effect was seen on the marketing mix and its effect on hedonic motivation (β: 0.774, p < 0.001), utilitarian motivation (β: 0.701, p < 0.001), attitude (β: 0.684, p < 0.001), and perceived behavioral control (β: 0.580, p < 0.001). For the measure items, it was indicated that the availability, variety, design and architecture, and popularity based on trends of facilities all influenced the individual behavior. As explained in the study of Arnold and Reynolds [54], people have a positive significant influence when infrastructures are located in an accessible area. Tan and Huang [78] support this, believing that the architecture, atmosphere, and overall environment impacted the positive behavior among visitors. Contradictory to the study outcome, place is the least significant among the marketing mix variable (β: 0.509, p < 0.001). This is because the accessibility of the place, availability of transportation, and its location and space played a significant role in the positive visitation behavior of visitors. In the Philippines setting, the recreational facilities and theme parks are placed in larger spaces but are still considered within the proximity of the city to cater to the visitors coming from different regions.
In addition, public transportation in the different recreational facilities is always available. Relating with the study of Liu et al. [8] and Milman et al. [5], the space or place of the establishment played a key role in the intention of people to visit the facilities. Chen et al. [17] also expressed that accessibility is a significant factor considered by visitors when selecting the facilities and parks. On the other hand, as presented by Choi et al. [7], price has a significant direct effect on behavior, which is similar to this study (β: 0.770, p < 0.001). It is one of the factors that showed a significant influence; it is represented by lower-priced tickets, the availability of cheaper establishments and price comparison could be considered by visitors. In addition, promotional aspects, discounts, salespeople, and brand image gained the highest positive significant influence on promotion (β: 0.910, p < 0.001). The findings are similar to those of Bae et al. [79] and Naish et al. [15]. It could be posited that proper promotion should be planned and implemented to gain more visitors.
Second, intention to visit has a significant direct effect on actual visitation behavior (β: 0.670, p < 0.001). It positively indicated that the individuals who recommended going to recreational facilities and amusement parks believed they could engage in multiple activities and would exert an effort in going to these places. In a study conducted by Lee et al. [1], it was expressed that escapism was the key attribute of amusement and theme parks, which prompted a positive significant influence on the actual behavior of individuals. Relaxation through escaping reality was deemed important by the visitors, resulting as the highlighting factor affecting actual visitation behavior. Since people want to experience leisure, both local and foreign tourists are motivated to experience going to amusement parks and recreational facilities [78]. It could be deduced that visitors experiencing pleasure, leisure, and excitement should be highlighted by various facilities to promote a positive actual behavior.
Third, hedonic motivation presented a highly significant direct effect on intention to visit (β: 0.315, p < 0.001). For the respondents, going to amusement parks and recreational facilities is fun, entertaining, pleasant, enjoyable, and exciting. Both the studies of Buchmann et al. [80] and Zerva [82] highlighted the behavior exhibited when people experience enjoyment and fun. This leads to a positive intention for continuous visits as an authentic experience. In reality, what the parks and facilities provide is more on the hedonic aspects among consumers, which relates to a positive significant effect on their behavior.
Fourth, subjective norm presented a significant direct effect on intention to visit (β: 0.270, p < 0.001). Similar to the study of Hsu and Songshan Huang [50], they showed that the subjective norm was low in the significant latent variable on predicting, describing, and influencing visitors’ behavioral intentions to engage in certain behaviors like revisiting a particular location. In their study, it was expressed that their respondents did not relate with the promotional material, causing the subjective norm to not influence individuals on visitation behaviors. Meanwhile, the word-of-mouth factor had an influence on actual visitation behaviors. Similarly, family and friends influenced the individuals’ visit intentions, unlike social pressure, which had no influence on visitors’ intentions to go to recreational facilities and amusement parks. The results are similar with other studies [7,29], showing that subjective norm is a significant factor on an individual’s visit intentions.
Fifth, it was seen that perceived behavioral control had the highest significant direct effect on intention to visit (β: 0.267, p < 0.001) compared to the other behavioral domains. People are equipped with the necessary resources, knowledge, and skills to visit. In addition, they consider the quality of offered services, work opportunities provided, as well as their own decisions. This contradicts the study of Park et al. [49] which showed that perceived behavioral control did not have a significant direct effect on the intention to visit among Chinese students in Japan. In their study, it was explained that this latent variable was not significant among outbound visitors. In connection to this study, the collected participants are willing to travel and visit various facilities. As explained in the study of Hsu and Songshan Huang [50], their image, branding, and recognition caused a positive significant effect. In the Philippines, since recreational facilities are easily accessible, people have the ability to schedule their visits. Similarly, among local tourists, they are more likely willing to go to different amusement parks, as presented from the indicators.
Lastly, both attitude and utilitarian motivation on intention to visit did not present any significant relationship. These findings are contradictory, since people were satisfied and contented, as well as benefited, from the services. In addition, they find visiting these places invaluable. Aligning with the results of this study, valuable equates to their relaxation and pleasurable experience. Bae et al. [79] showed the positive significant effect of attitude on intention among theme park visitors. However, considering the distant location of parks and the low income of some citizens in the Philippines, people would only consider this for leisure and not on normal occasions. They expounded on the individual’s benefit on cognition and affective behavior. The factors include distinct features of the amusement park, including popularity, pleasure, and arousal. Goossens [83] explained that these factors include the branding of these facilities, which leads to a positive image. This would lead to the insignificant relationship of attitude on visitation intention in this study, indicating that people find that pleasure and valuable aspects affect their attitude but are likely to be not the driving force for visitation. As expressed by Abbasi et al. [51], higher values promote higher intention from attitude. Therefore, it could be posited that valuation on the visitation should be impactful for Filipinos to seriously consider visiting recreational facilities. These are what stakeholders and businesses should promote to provide a positive perspective on their establishments.
Interestingly, utilitarian motivation did not present any significant direct effect on intention and actual visitation behavior. Despite this, people still showed that visiting these places is necessary for social interaction and bonding with friends and family. The cluster analysis of Park et al. [84] showed that people are more inclined to entertainment, adventure and thrill experiences. This means that this type of business focuses more on the hedonic aspects of consumers rather than utilitarian. This is similar to the findings of Ribeiro Coimbra et al. [85]. From the clustering analysis, four distinct visitor characteristics such as fantasy, science, enjoyment, and thrill seekers played a distinct role in the classification of visitors’ motivation to go to these establishments [85]. It could further be deduced that since hedonism is being considered, businesses may want to categorize their advertisements into these four clusters or provide features in a single advertisement that cater to the different types of visitors. This way, visitors would be engaged and convinced to visit these establishments. In addition, for people to holistically have a positive visitation intention, highlighting the benefit (on a utilitarian point of view) may be needed. This means that stakeholders and owners may promote the social interaction, social development, and family-oriented services as well as promote the impact of bonding, functional, and economic benefit beyond the enjoyment aspects for people to promote the visitation.
Overall, it could be posited that the priorities of consumers include going to recreational facilities and amusement parks when they can visit the area, access the location, participate in different activities, and have enough resources. Businesses may capitalize on this finding to promote their amusement parks and recreational facilities. Also, businesses may highlight their location and space because this is one of the highly significant measure items participants have noted. In addition, price also played a significant role in the intention of visitors.
6. Conclusions
The current study provided insights on the actual behavior to visit recreational facilities and amusement parks. Since limited studies were formulated on the aspect of consumer behavior, this study was able to close the gap by identifying significant latent variables affecting actual visiting behavior. The extended theory utilized in this study presented interesting results. We also considered the addition of marketing mix factors, which had higher significant effects on the behavioral intention and actual visiting intentions. Similarly, the motivational factors were key identifiers of behavioral and actual intentions. It could be deduced that when activities are being considered on consumer behavior-related studies, marketing mix and motivational factors should be considered as extended latent variables, as the measure items are more flexible and could be applied to existing theories. From the established model, a more holistic measurement was provided among actual behavior. In addition, different implications were created based on the findings. Therefore, other researchers may consider the current framework or even extend it to consider a broader perspective of visitation behavior. The output showed that visitation behavior could be measured in a more holistic manner—which means that the model may be applied and extended in the tourism industry, buying behavior, or even in the evaluation of service-related businesses that provide leisure, excitement, or activities.
Based on the output of the study, several managerial implications for practical approaches may be considered. For the marketing mix, recreational facilities and amusement parks or theme parks should focus on the 4Ps of marketing, since they are the highest contributing factor on actual behavior. The accessibility and location played a distinct role for actual visiting behavior. Second, price and promotion should be as competitive as the average value in the market. Since consumers tend to consider different pricing, a proper strategy may be applied among the businesses. For recreational facilities like spa and massage parlors, the proper pricing based on market value could be implemented. For amusement parks and theme parks, highlighting their newly established rides, entertainment facilities, even architectural design may be considered for the pricing. Businesses can reach more anticipated visitors given that most visitors are active on social media. Moreover, a variety of social media platforms may be used to broadcast events, promotions, discounts, and even new entertainment attractions or activities to engage consumers. On the other hand, since hedonic motivation is obviously one of the factors that consumers consider when going to these establishments, the factors under this latent variable should be focused on. Advertisement may maximize on experience and leisure as are key attributes that consumers consider.
Limitation and Future Study Opportunities
Despite the positive and significant findings, there are several limitations to this study. First, it only considered an extended TPB. Other factors to reduce the questionnaire items were not considered. It is suggested that future researchers should conduct interviews before and after visiting recreational facilities or amusement parks to gain insights of their overall experience, which would lead to their actual visitation behavior. Second, future researchers may focus on the 4Ps of marketing alone to highlight the need from a business perspective. A business model built from the findings would also be beneficial for the different stakeholders. Third, since the purposive sampling of respondents with prior experience with recreational and amusement parks only were considered, future research may further perform different analyses especially on combinations of respondents with and/or without experiences in these facilities. This may bring light to the holistic measurement that was not included in this study and create other implications. Age groups may also be considered, along with other demographic characteristics. Finally, the established machine learning algorithms may be applied to classify distinct features of the items, cluster customers, and even classify significant factors.
Author Contributions
Conceptualization, A.K.S.O., J.C.A., D.A.F.A., S.M.L.O., J.F.N.S.M., E.R.A.R. and C.J.M.R.; methodology A.K.S.O., J.C.A., D.A.F.A., S.M.L.O., J.F.N.S.M., E.R.A.R. and C.J.M.R.; software, A.K.S.O., J.C.A., D.A.F.A., S.M.L.O., J.F.N.S.M., E.R.A.R. and C.J.M.R.; validation, A.K.S.O., J.C.A., D.A.F.A., S.M.L.O., J.F.N.S.M., E.R.A.R. and C.J.M.R.; formal analysis, A.K.S.O., J.C.A., D.A.F.A., S.M.L.O., J.F.N.S.M., E.R.A.R. and C.J.M.R.; investigation A.K.S.O., J.C.A., D.A.F.A., S.M.L.O., J.F.N.S.M., E.R.A.R. and C.J.M.R.; resources A.K.S.O., J.C.A., D.A.F.A., S.M.L.O., J.F.N.S.M., E.R.A.R. and C.J.M.R.; data curation, A.K.S.O., J.C.A., D.A.F.A., S.M.L.O., J.F.N.S.M., E.R.A.R. and C.J.M.R.; writing—original draft preparation, A.K.S.O., J.C.A., D.A.F.A., S.M.L.O., J.F.N.S.M., E.R.A.R. and C.J.M.R.; writing—review and editing, A.K.S.O., J.C.A., D.A.F.A., S.M.L.O. and J.F.N.S.M.; visualization, A.K.S.O., J.C.A., D.A.F.A., S.M.L.O., J.F.N.S.M., E.R.A.R. and C.J.M.R.; supervision, A.K.S.O.; project administration, A.K.S.O.; and funding acquisition, A.K.S.O. All authors have read and agreed to the published version of the manuscript.
Funding
This research was funded by the Mapua University Directed Research for Innovation and Value Enhancement (DRIVE).
Institutional Review Board Statement
This study was approved by the Mapua University Research Ethics Committees (FM-RC-23-01-18).
Informed Consent Statement
Informed consent was obtained from all subjects involved in this study (FM-RC-23-02-18).
Data Availability Statement
The data presented in this study are available on request from the corresponding author.
Acknowledgments
The authors would like to thank all the respondents who answered our online questionnaire. We would also like to thank our friends for their contributions to the distribution of the questionnaire.
Conflicts of Interest
The authors declare no conflicts of interest.
References
- Lee, S.; Jeong, E.; Qu, K. Exploring theme park visitors’ experience on satisfaction and revisit intention: A utilization of experience economy model. J. Qual. Assur. Hosp. Tour. 2019, 21, 474–497. [Google Scholar] [CrossRef]
- International Association of Amusement Parks and Attractions Global and Amusement Park Outlook 2016–2020. Available online: https://www.iaapa.org/research (accessed on 20 April 2024).
- Sato, M.; Inoue, Y.; Du, J.; Funk, D.C. Access to parks and recreational facilities, physical activity, and health care costs for older adults: Evidence from U.S. counties. J. Leis. Res. 2019, 50, 220–238. [Google Scholar] [CrossRef]
- Geissler, G.L.; Rucks, C.T. The overall theme park experience: A visitor satisfaction tracking study. J. Vacat. Mark. 2011, 17, 127–138. [Google Scholar] [CrossRef]
- Milman, A.; Tasci, A.D.A.; Wei, W. Crowded and popular: The two sides of the coin affecting theme-park experience, satisfaction, and Loyalty. J. Destin. Mark. Manag. 2020, 18, 100468. [Google Scholar] [CrossRef]
- Statista Topic: Amusement and Theme Parks Worldwide. Available online: https://www.statista.com/topics/2805/amusement-and-theme-parks/#topicOverview (accessed on 20 April 2024).
- Choi, D.W.; Lee, S.; Alcorn, M. Influence of Culture on Purchase Decision: Integrative Models Development of Amusement Park customers. Int. J. Hosp. Manag. 2020, 87, 102502. [Google Scholar] [CrossRef]
- Liu, S.; Zheng, X.; Wang, B. Analysis of the capacity of different frequency channel allocation method in the simulated amusement park. In Proceedings of the 2021 International Conference on Wireless Communications and Smart Grid (ICWCSG) 2021, Hangzhou, China, 13–15 August 2021. [Google Scholar]
- Philippine Statistics Authority. Available online: https://www.psa.gov.ph/content/2016-annual-survey-philippine-business-and-industry-aspbi-manufacturing-sector-final (accessed on 19 April 2024).
- Gao, Y.; Liu, C.; Gao, N.; Khalid, M.N.; Iida, H. Nature of arcade games. Entertain. Comput. 2022, 41, 100469. [Google Scholar] [CrossRef]
- Manila Bulletin Theme and Amusement Parks. Available online: https://mb.com.ph/2022/09/14/theme-and-amusement-parks/ (accessed on 10 July 2024).
- Magsanoc, K. Disneyland in the Philippines? Available online: https://www.rappler.com/entertainment/4955-disneyland-in-the-philippines/ (accessed on 10 July 2024).
- Balita, C. Philippines: Distribution of Establishments in the Arts and Recreation Industry by Type 2017. Available online: https://www.statista.com/statistics/1060276/philippines-distribution-arts-recreation-industry-by-type/ (accessed on 10 July 2024).
- 6Wresearch Philippines Amusement Park Market (2021–2027): Trends, Outlook & Forecast. Available online: https://www.6wresearch.com/industry-report/philippines-amusement-park-market-outlook (accessed on 10 July 2024).
- Naish, C.; McCormack, G.R.; Blackstaffe, A.; Frehlich, L.; Doyle-Baker, P.K. An observational study on play and physical activity associated with a recreational facility-led park-based “loose parts” play intervention during the COVID-19 pandemic. Children 2023, 10, 1049. [Google Scholar] [CrossRef]
- Wei, W.; Qi, R.; Zhang, L. Effects of virtual reality on theme park visitors’ experience and behaviors: A presence perspective. Tour. Manag. 2019, 71, 282–293. [Google Scholar] [CrossRef]
- Daems, K.; De Keyzer, F.; De Pelsmacker, P.; Moons, I. Personalized and cued advertising aimed at children. Young Consum. 2019, 20, 138–151. [Google Scholar] [CrossRef]
- Chen, Q.; Wang, C.; Lou, G.; Zhang, M.; Wu, S. Measurement of urban park accessibility from the quasi-public goods perspective. Sustainability 2019, 11, 4573. [Google Scholar] [CrossRef]
- Morris, P.; Arford, T. “sweat a little water, sweat a little blood”: A spectacle of Convict Labor at an American Amusement Park. Crime Media Cult. Int. J. 2018, 15, 423–446. [Google Scholar] [CrossRef]
- Morris, J.A. Disney’s influence on the modern theme park and the codification of colorblind racism in the American Amusement Industry. Perform. Disney Theme Park Exp. 2019, 1, 213–227. [Google Scholar]
- Zhang, L.; Gao, W.; Yang, Y.; Qian, F. Impacts of investment cost, energy prices and carbon tax on promoting the combined cooling, heating and power (CCHP) system of an amusement park resort in Shanghai. Energies 2020, 13, 4252. [Google Scholar] [CrossRef]
- Ajzen, I. The theory of planned behavior. Organ. Behav. Hum. Decis. Process. 1991, 50, 179–211. [Google Scholar] [CrossRef]
- Pahrudin, P.; Chen, C.-T.; Liu, L.-W. A modified theory of planned behavioral: A case of tourist intention to visit a destination post pandemic COVID-19 in Indonesia. Heliyon 2021, 7, e08230. [Google Scholar] [CrossRef]
- Ong, A.K.; Cleofas, M.A.; Prasetyo, Y.T.; Chuenyindee, T.; Young, M.N.; Diaz, J.F.; Nadlifatin, R.; Redi, A.A. Consumer behavior in clothing industry and its relationship with open innovation dynamics during the COVID-19 pandemic. J. Open Innov. Technol. Mark. Complex. 2021, 7, 211. [Google Scholar] [CrossRef]
- Anand, T.; Ramachandran, J.; Sambasivan, M.; Batra, G.S. Impact of hedonic motivation on consumer satisfaction towards online shopping: Evidence from Malaysia. e-Serv. J. 2019, 11, 56. [Google Scholar] [CrossRef]
- Fung, A.; Lee, M. Localizing a global amusement park: Hong Kong disneyland. Continuum 2009, 23, 197–208. [Google Scholar] [CrossRef]
- Arnould, E.J.; Price, L.; Zinkhan, G.M. Consumers; McGraw Hill/Irwin: Boston, MA, USA, 2002. [Google Scholar]
- Ajzen, I.; Fishbein, M. Understanding Attitude and Predicting Behavior; PrenticeHall: Englwood Cliffs, NJ, USA, 1980. [Google Scholar]
- Lam, T.; Hsu, C.H.C. Predicting behavioral intention of choosing a travel destination. Tour. Manag. 2006, 27, 589–599. [Google Scholar] [CrossRef]
- Han, H.; Kim, Y. An investigation of Green Hotel customers’ Decision Formation: Developing an extended model of the theory of planned behavior. Int. J. Hosp. Manag. 2010, 29, 659–668. [Google Scholar] [CrossRef]
- Labbe, D.; Ferrage, A.; Rytz, A.; Pace, J.; Martin, N. Pleasantness, emotions and perceptions induced by coffee beverage experience depend on the consumption motivation (hedonic or utilitarian). Food Qual. Prefer. 2015, 44, 56–61. [Google Scholar] [CrossRef]
- Mohaidin, Z.; Wei, K.T.; Ali Murshid, M. Factors influencing the tourists’ intention to select Sustainable Tourism Destination: A Case Study of Penang, Malaysia. Int. J. Tour. Cities 2017, 3, 442–465. [Google Scholar] [CrossRef]
- Nardi, V.A.; Jardim, W.C.; Ladeira, W.; Santini, F. Predicting food choice: A meta-analysis based on the theory of planned behavior. Br. Food J. 2019, 121, 2250–2264. [Google Scholar] [CrossRef]
- Wang, X. Integrating the theory of planned behavior and attitude functions: Implications for health campaign design. Health Commun. 2009, 24, 426–434. [Google Scholar] [CrossRef] [PubMed]
- Wang, X.; McClung, S.R. Toward a detailed understanding of illegal digital downloading intentions: An extended theory of planned behavior approach. New Media Soc. 2011, 13, 663–677. [Google Scholar] [CrossRef]
- Wong, K.K.; Cheung, P.W. Strategic theming in Theme Park Marketing. J. Vacat. Mark. 1999, 5, 319–332. [Google Scholar] [CrossRef]
- Josiam, B.M.; Henry, W. Eatertainment: Utilitarian and hedonic motivations for patronizing fun experience restaurants. Procedia-Soc. Behav. Sci. 2014, 144, 187–202. [Google Scholar] [CrossRef]
- Kertasunjaya, T.K.; Mediasari, T.D.; Manaf, P.A. The relation between hedonic and utilitarian values on satisfaction and behavior intention among casual-dining restaurants customers. Open J. Bus. Manag. 2020, 08, 2480–2492. [Google Scholar] [CrossRef]
- Liu, Y.; Song, Y.; Tamura, R. Hedonic and utilitarian motivations of home motion-sensing game play behavior in China: An empirical study. Int. J. Environ. Res. Public Health 2020, 17, 8794. [Google Scholar] [CrossRef]
- Chang, C.C.; Chen, C.W. Examining Hedonic and Utilitarian Bidding Motivations in Online Auctions: Impacts of Time Pressure and Competition. Int. J. Electron. Commer. 2015, 19, 36–65. [Google Scholar]
- Chen, M.-F.; Tung, P.-J. Developing an extended theory of planned behavior model to predict consumers’ intention to visit Green Hotels. Int. J. Hosp. Manag. 2014, 36, 221–230. [Google Scholar] [CrossRef]
- Ajzen, I. The theory of planned behavior: Frequently asked questions. Hum. Behav. Emerg. Technol. 2020, 2, 314–324. [Google Scholar] [CrossRef]
- Ong, A.K.; Cordova, L.N.; Longanilla, F.A.; Caprecho, N.L.; Javier, R.A.; Borres, R.D.; German, J.D. Purchasing intentions analysis of hybrid cars using random forest classifier and deep learning. World Electr. Veh. J. 2023, 14, 227. [Google Scholar] [CrossRef]
- Cheung, M.F.Y.; To, W.M. An extended model of value-attitude-behavior to explain Chinese consumers’ green purchase behavior. J. Retail. Consum. Serv. 2019, 50, 145–153. [Google Scholar] [CrossRef]
- Hamzah, M.I.; Tanwir, N.S. Do pro-environmental factors lead to purchase intention of hybrid vehicles? the moderating effects of environmental knowledge. J. Clean. Prod. 2021, 279, 123643. [Google Scholar] [CrossRef]
- Ong, A.K.; Prasetyo, Y.T.; Vallespin, B.E.; Persada, S.F.; Nadlifatin, R. Evaluating the influence of service quality, hedonic, and utilitarian value on Shopper’s behavioral intentions in urban shopping malls during the COVID-19 pandemic. Heliyon 2022, 8, e12542. [Google Scholar] [CrossRef] [PubMed]
- German, J.D.; Redi, A.A.; Ong, A.K.; Prasetyo, Y.T.; Sumera, V.L. Predicting factors affecting preparedness of volcanic eruption for a sustainable community: A case study in the Philippines. Sustainability 2022, 14, 11329. [Google Scholar] [CrossRef]
- German, J.D.; Ong, A.K.; Redi, A.A.; Prasetyo, Y.T.; Robas, K.P.; Nadlifatin, R.; Chuenyindee, T. Classification modeling of intention to donate for victims of Typhoon odette using Deep Learning Neural Network. Environ. Dev. 2023, 45, 100823. [Google Scholar] [CrossRef]
- Park, S.H.; Hsieh, C.-M.; Lee, C.-K. Examining Chinese college students’ intention to travel to Japan using the extended theory of planned behavior: Testing destination image and the mediating role of travel constraints. J. Travel Tour. Mark. 2016, 34, 113–131. [Google Scholar] [CrossRef]
- Hsu, C.H. Songshan Huang Formation of tourist behavioral intention and actual behavior. In Proceedings of the 2010 7th International Conference on Service Systems and Service Management 2010, Tokyo, Japan, 28–30 June 2010. [Google Scholar]
- Abbasi, G.A.; Kumaravelu, J.; Goh, Y.-N.; Dara Singh, K.S. Understanding the intention to revisit a destination by expanding the theory of planned behaviour (TPB). Span. J. Mark.-ESIC 2021, 25, 282–311. [Google Scholar] [CrossRef]
- Azhar, M.; Nafees, S.; Sujood; Hamid, S. Understanding post-pandemic travel intention toward rural destinations by expanding the theory of planned behavior (TPB). Future Bus. J. 2023, 9, 36. [Google Scholar] [CrossRef]
- Loo, P.T.; Leung, R. A service failure framework of hotels in Taiwan. J. Vacat. Mark. 2016, 24, 79–100. [Google Scholar] [CrossRef]
- Arnold, M.J.; Reynolds, K.E. Hedonic shopping motivations scale. PsycTESTS Dataset 2003, 79, 77–95. [Google Scholar]
- Leng, K.C.; Chin, T.A. The influence of marketing mix factors on consumer’s purchase intention toward hybrid car in Johor Bahru. Adv. Sci. Lett. 2017, 23, 9115–9116. [Google Scholar] [CrossRef]
- Anjani, H.D.; Irham, I.; Waluyati, L.R. Relationship of 7p marketing mix and consumers’ loyalty in traditional markets. Agro Ekon. 2019, 29, 261. [Google Scholar] [CrossRef]
- Kim, E.Y.; Park, K. Marketing mix elements influencing brand Attitude Strength: Global vs. Domestic Spa Brands. J. Glob. Sch. Mark. Sci. 2013, 23, 263–281. [Google Scholar] [CrossRef]
- Aime, R.S.; Premananto, G.C.; Rakotoarisoa, S. Marketing mix, customers’ attitude, and purchasing intention in social commerce with internet access as a moderating variable. J. Manaj. Teor. Dan Terap. J. Theory Appl. Manag. 2022, 15, 62–76. [Google Scholar] [CrossRef]
- Jaminyasa, I.M.; Pulawan, I.M.; Martadiani, A.A.M.; Amerta, I.M. The marketing mix affect on the consumer buying decision (case study of Sausage Products at pt. Aroma Denpasar). Int. J. Soc. Sci. Humanit. 2017, 1, 65–74. [Google Scholar] [CrossRef][Green Version]
- Khanta, F.; Srinuan, C. The realtionship between marketing mix, brand equity, lifestyle and atttude on a consumer’s private product brand purchasing decision. Afr. J. Hosp. Tour. Leis. 2019, 8, 1–14. [Google Scholar]
- Chou, S.-F.; Horng, J.-S.; Sam Liu, C.-H.; Lin, J.-Y. Identifying the critical factors of customer behavior: An integration perspective of marketing strategy and components of attitudes. J. Retail. Consum. Serv. 2020, 55, 102113. [Google Scholar] [CrossRef]
- Olson, E.L. ‘sustainable’ marketing mixes and the paradoxical consequences of good intentions. J. Bus. Res. 2022, 150, 389–398. [Google Scholar] [CrossRef]
- Philippines Statistics Authority Age and Sex Distribution in the Philippine Population (2020 Census of Population and Housing)|Philippine Statistics Authority|Republic of the Philippines. Available online: https://www.psa.gov.ph/content/age-and-sex-distribution-philippine-population-2020-census-population-and-housing (accessed on 19 April 2024).
- Philippines Statistics Authority Single Population in the Philippines (Results from the 2015 Census of Population)|Philippine Statistics Authority|Republic of the Philippines. Available online: https://psa.gov.ph/content/single-population-philippines-results-2015-census-population (accessed on 19 April 2024).
- Hair, J.F. Multivariate Data Analysis: An Overview. In International Encyclopedia of Statistical Science; Lovric, M., Ed.; Springer: Berlin/Heidelberg, Germany, 2011; pp. 904–907. [Google Scholar] [CrossRef]
- Tommasetti, A.; Singer, P.; Troisi, O.; Maione, G. Extended theory of planned behavior (ETPB): Investigating customers’ perception of restaurants’ sustainability by testing a structural equation model. Sustainability 2018, 10, 2580. [Google Scholar] [CrossRef]
- Cai, J.; Wohn, D.Y.; Mittal, A.; Sureshbabu, D. Utilitarian and hedonic motivations for live streaming shopping. In Proceedings of the 2018 ACM International Conference on Interactive Experiences for TV and Online Video 2018, Seoul, Republic of Korea, 26–28 June 2018. [Google Scholar]
- Martín-Consuegra, D.; Díaz, E.; Gómez, M.; Molina, A. Examining consumer luxury brand-related behavior intentions in a social media context: The moderating role of hedonic and utilitarian motivations. Physiol. Behav. 2019, 200, 104–110. [Google Scholar] [CrossRef] [PubMed]
- Hair, J.; Alamer, A. Partial least squares structural equation modeling (PLS-SEM) in Second language and education research: Guidelines using an applied example. Res. Methods Appl. Linguist. 2022, 1, 100027. [Google Scholar] [CrossRef]
- Sarstedt, M.; Hair, J.F.; Cheah, J.-H.; Becker, J.-M.; Ringle, C.M. How to specify, estimate, and validate higher-order constructs in PLS-SEM. Australas. Mark. J. 2019, 27, 197–211. [Google Scholar] [CrossRef]
- Fan, Y.; Chen, J.; Shirkey, G.; John, R.; Wu, S.R.; Park, H.; Shao, C. Applications of structural equation modeling (SEM) in Ecological Studies: An updated review. Ecol. Process. 2016, 5, 19. [Google Scholar] [CrossRef]
- Dash, G.; Paul, J. CB-SEM vs. PLS-SEM methods for research in Social Sciences and Technology forecasting. Technol. Forecast. Soc. Chang. 2021, 173, 121092. [Google Scholar] [CrossRef]
- Djimesah, I.E.; Okine, A.N.; Kissi Mireku, K. Influential factors in creating warning systems towards flood disaster management in Ghana: An analysis of 2007 northern flood. Int. J. Disaster Risk Reduct. 2018, 28, 318–326. [Google Scholar] [CrossRef]
- Kline, R.B. Principles and Practice of Structural Equation Modeling; The Guilford Press: New York, NY, USA, 2016. [Google Scholar]
- Henseler, J.; Ringle, C.M.; Sarstedt, M. A new criterion for assessing discriminant validity in variance-based structural equation modeling. J. Acad. Mark. Sci. 2014, 43, 115–135. [Google Scholar] [CrossRef]
- Hooper, D.; Coughlan, J.; Mullen, M.R. Structural equation modelling: Guidelines for determining model fit. Electron. J. Bus. Res. Methods 2008, 6, 53–60. [Google Scholar]
- Baumgartner, H.; Homburg, C. Applications of structural equation modeling in marketing and Consumer Research: A Review. Int. J. Res. Mark. 1996, 13, 139–161. [Google Scholar] [CrossRef]
- Tan, W.-K.; Huang, S.-Y. Why visit theme parks? A leisure constraints and perceived authenticity perspective. J. Retail. Consum. Serv. 2020, 57, 102194. [Google Scholar] [CrossRef]
- Bae, Y.; Moon, S.; Jun, J.; Kim, T.; Ju, I. The impact of consumers’ attitudes toward a theme park: A focus on Disneyland in the los angeles metropolitan area. Sustainability 2018, 10, 3409. [Google Scholar] [CrossRef]
- Buchmann, A.; Moore, K.; Fisher, D. Experiencing film tourism. Ann. Tour. Res. 2010, 37, 229–248. [Google Scholar] [CrossRef]
- Hu, L.; Bentler, P.M. Cutoff criteria for fit indexes in covariance structure analysis: Conventional criteria versus new alternatives. Struct. Equ. Model. A Multidiscip. J. 1999, 6, 1–55. [Google Scholar] [CrossRef]
- Zerva, K. Visiting authenticity on los angeles gang tours: Tourists backstage. Tour. Manag. 2015, 46, 514–527. [Google Scholar] [CrossRef]
- Goossens, C. Tourism Information and Pleasure Motivation. Ann. Tour. Res. 2000, 27, 301–321. [Google Scholar] [CrossRef]
- Park, K.-S.; Reisinger, Y.; Park, C.-S. Visitors’ motivation for attending theme parks in Orlando, Florida. Event Manag. 2009, 13, 83–101. [Google Scholar] [CrossRef]
- Ribeiro Coimbra, R.; Brito, C.M.; de Oliveira Sampaio, D. Hedonic and utilitarian motivations and their relationship with cultural dimensions, life satisfaction and the attributes of supermarkets: An International Study on Consumer Behavior. Cogent Bus. Manag. 2023, 10, 2202024. [Google Scholar] [CrossRef]
Disclaimer/Publisher’s Note: The statements, opinions and data contained in all publications are solely those of the individual author(s) and contributor(s) and not of MDPI and/or the editor(s). MDPI and/or the editor(s) disclaim responsibility for any injury to people or property resulting from any ideas, methods, instructions or products referred to in the content. |
© 2024 by the authors. Licensee MDPI, Basel, Switzerland. This article is an open access article distributed under the terms and conditions of the Creative Commons Attribution (CC BY) license (https://creativecommons.org/licenses/by/4.0/).