Article

Tube Drawing Process with Diameter Expansion for Effectively Reducing Thickness

1
Department of Mechanical and Intelligent Systems Engineering, The University of Electro-Communications, 1-5-1 Chofu Gaoka, Chofu-shi, Tokyo 182-8585, Japan
2
Miyazaki Machinery Systems Co., Ltd., 1 Nii, Kaizuka-shi, Osaka 597-8588, Japan
3
Akiyama Mechanical Engineering Consulting, 2-7-306 Tanaka Sekiden-cho, Sakyo-ku, Kyoto-shi, Kyoto 606-8203, Japan
*
Author to whom correspondence should be addressed.
Metals 2020, 10(12), 1642; https://doi.org/10.3390/met10121642
Submission received: 31 October 2020 / Revised: 24 November 2020 / Accepted: 4 December 2020 / Published: 6 December 2020
(This article belongs to the Special Issue Latest Hydroforming Technology of Metallic Tubes and Sheets)

Abstract

:
The present paper describes a tube drawing method with diameter expansion, which is herein referred to as “expansion drawing”, for effectively producing thin-walled tube. In the proposed method, the tube end is flared by pushing a plug into the tube, and the tube is then expanded by drawing the plug in the axial direction while the flared end is chucked. The forming characteristics and effectiveness of the proposed method were investigated through a series of finite element method (FEM) analyses and experiments. As a result of FEM analysis, the expansion drawing effectively reduced the tube thickness with a smaller axial load when compared with the conventional method. According to the experimental results, the thin-walled tube was produced successfully by the expansion drawing. Maximum thickness reduction ratios for a carbon steel (STKM13C) and an aluminum alloy (AA1070) were 0.15 and 0.29 when the maximum expansion ratios were 0.23 and 0.31, respectively. The above results suggest that the proposed expansion drawing method is effective for producing thin-walled tubes.

1. Introduction

Thin-walled tubes, which are used for various machine components, contribute to the reduction in size and weight of various machines. The thin-walled tube is manufactured from rather thick-walled raw tubes by multi-pass drawing, which is the conventional cold working forming process of tubes, that determines many properties of the tube, such as residual stress [1], dimensional precision [2,3], surface integrity [4], and strength [5]. However, many drawing passes are needed for manufacturing very-thin-walled tubes. This is because the tube tends to fracture due to large axial load in the drawing process when the thickness reduction is too large for one drawing pass. The production cost also increases with the increase in the number of drawing passes.
A number of technologies were proposed for manufacturing thin-walled tubes. The spinning process is effective for greatly reducing the tube thickness [6,7]. However, its productivity is low due to low feed rate of the process. Pilger rolling is another method for reducing the diameter and thickness of the tube, with an area reduction of more than 80% [8]. However, the productivity is also low because the tube is deformed incrementally by reciprocal movement of a pair of rolls. Therefore, an effective processing method, which realizes both effective thickness reduction and good productivity, should be developed. Tube expansion process is considered to be one of the methods for reducing wall thickness. The thickness reduces due to stretching in the hoop direction because the material deforms with constant volume. In general, tubes can be partially expanded by hydro forming or press forming for producing components with various shapes [9,10]. In addition, the tube expansion is also applied for joining tubes to other components [11], and for forming a well-bore tube [12]. Therefore, various fundamental studies about the tube expansion have been conducted numerically and experimentally [13,14,15,16]. On the other hand, there is little research about the production of thin-walled tube by expanding the whole length of the tube.
The present paper proposes a tube drawing method with diameter expansion for effectively manufacturing thin-walled tube. Figure 1 shows a schematic diagram of the proposed method. In the first step, the tube end is flared by pushing the plug in the axial direction, as shown in Figure 1a. In the second step, the tube was expanded by pushing the plug while the flared end is chucked, as shown in Figure 1b. Figure 2 compares the stress state of the tube wall during drawing with diameter shrinkage or expansion. In the expansion drawing, the tube wall stretches biaxially in the axial and hoop directions, and then a negative deviatoric stress in the thickness direction becomes larger than that in the conventional drawing with diameter shrinkage. Therefore, the thickness should be effectively reduced by resorting to a small drawing load.
The present study fundamentally investigated the forming characteristics and the effectiveness of the proposed method through a series of finite element method (FEM) analyses and experiments. First, the tube flaring was conducted, and the friction coefficient, μ, was estimated by comparing the FEM and experimental results. Based on the results for the tube flaring, FEM analysis of the expansion drawing was carried out to investigate the forming characteristics and the deformation mechanism, and the proposed method was compared with the conventional method. Finally, the forming limit, thickness reduction, ovality, and the thickness deviation were evaluated through a series of experiments.

2. Materials and Methods

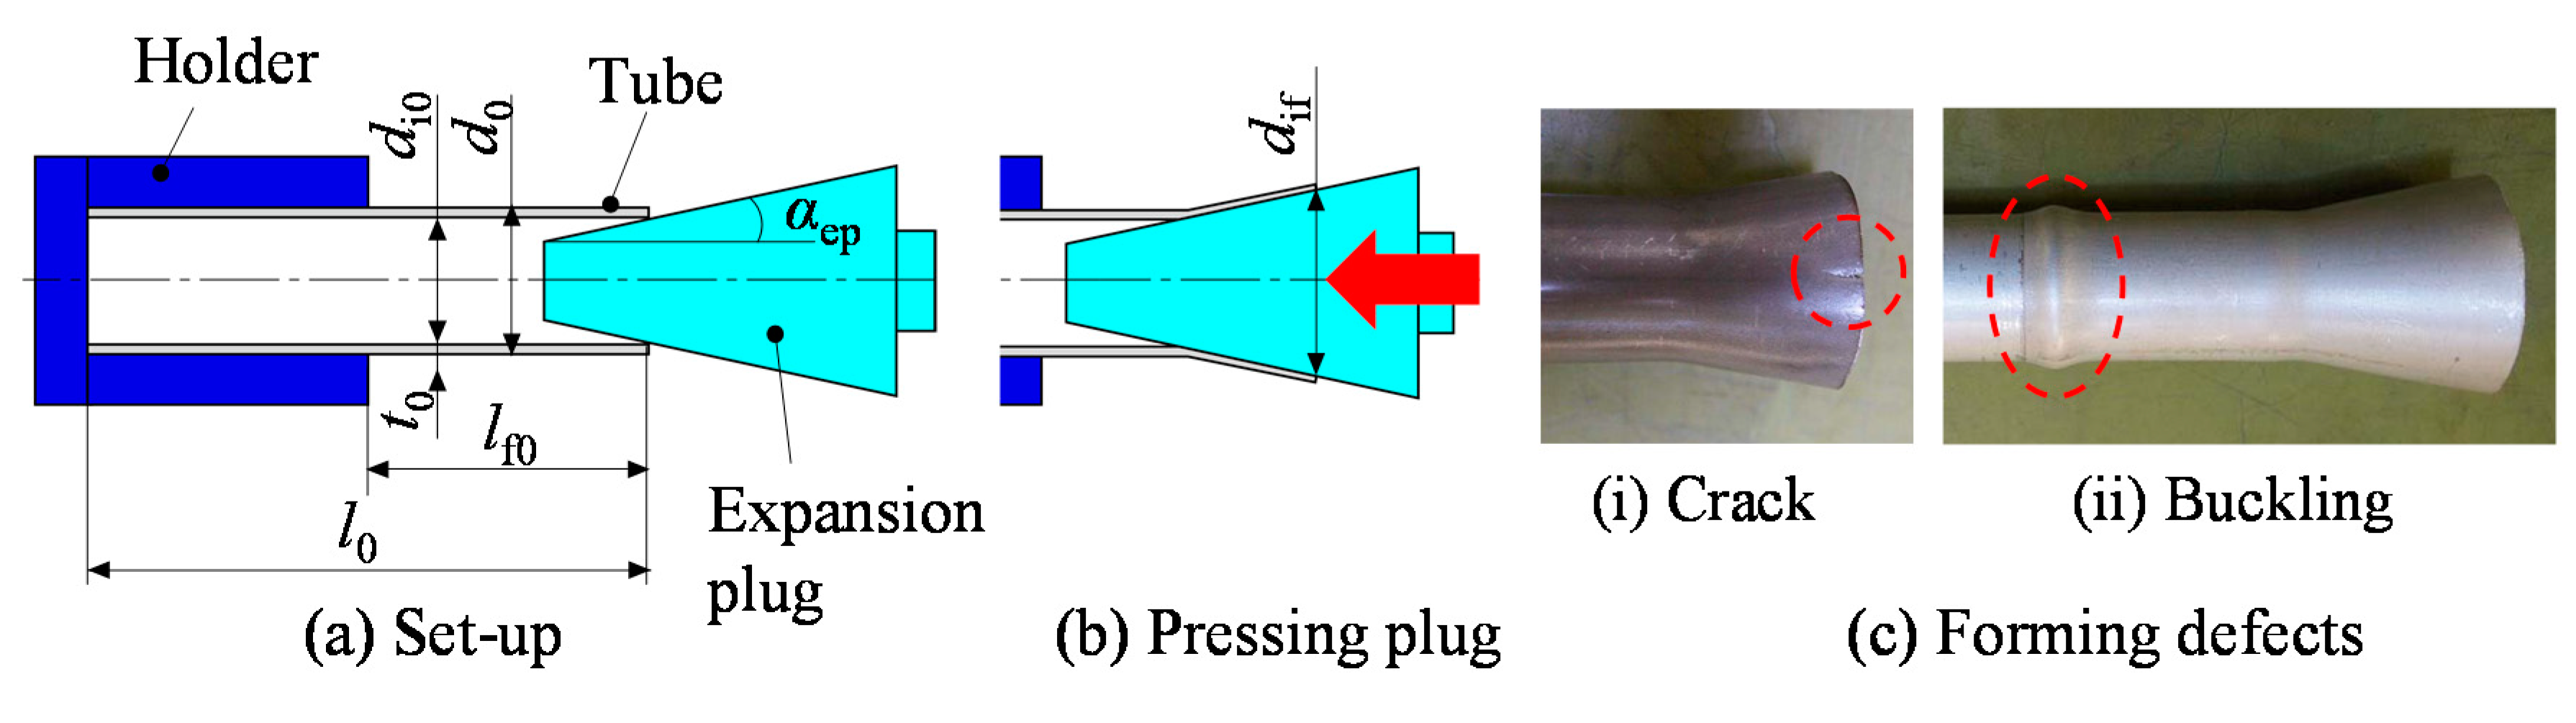
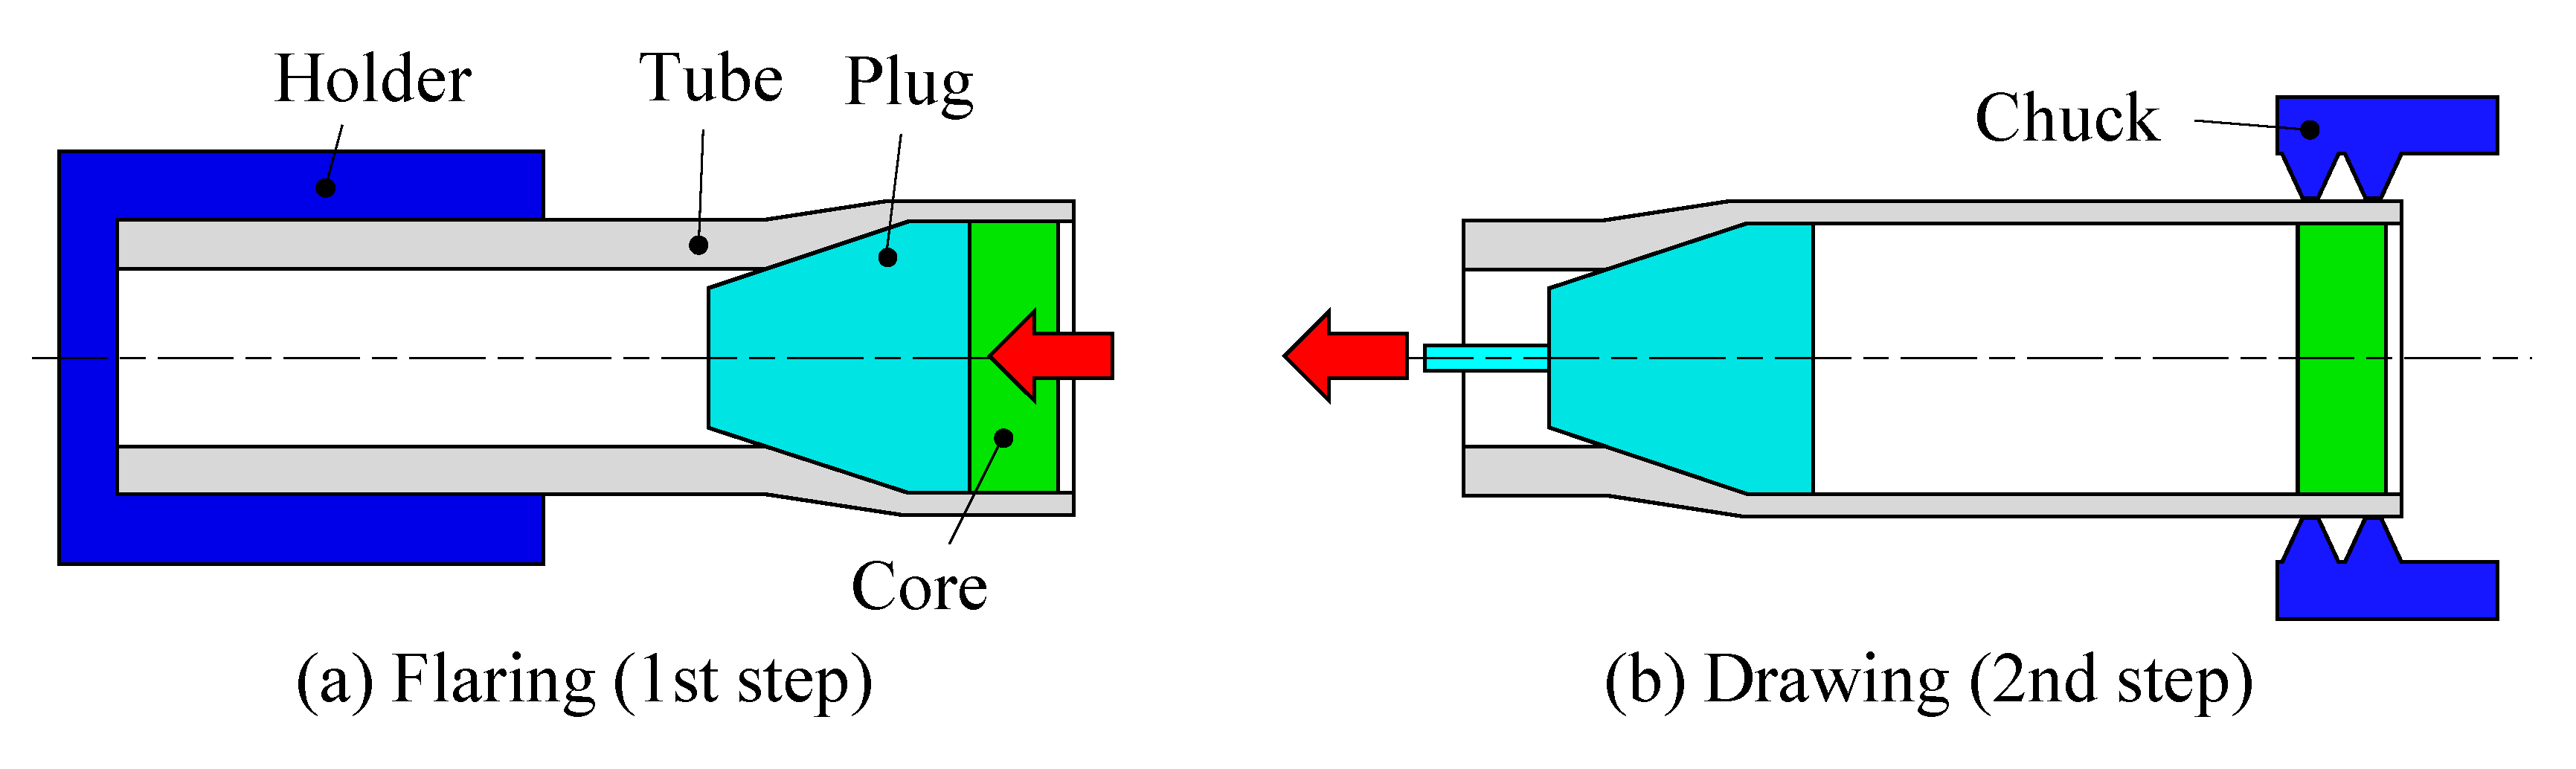
2.1. Method for Estimating Frictional Property by Tube Flaring

The friction coefficient μ between the tube and the expansion plug was investigated by comparison of the experimental and FEM result in the flaring process. Figure 3 shows a schematic diagram of the tube flaring experiment. One tube end was flared by pushing a conical plug, while the other end was fixed by a holder. The flaring ratio κf was defined by the equation
κ f   =   d if d i 0 d i 0
where di0 is the initial inner diameter of the tube. Typical forming defects in this experiment were crack and buckling, as shown in Figure 3c. The maximum flaring ratio κf_max, which indicates the flaring limit, was defined as the maximum value of κf before the buckling or the crack occurrence. In the experiment, a hydraulic universal testing machine was used to press the plug into the tube while the load was measured. The inner diameter dif of the flared end was measured every time the plug was pressed 2 mm in the axial direction, and the maximum value of dif before defect occurrence was used to calculate the maximum flaring ratio κf_max.
Figure 4 shows a schematic diagram of the FEM model for the tube flaring (FL-2D-Impl). An elastic-plastic analysis was carried out using the commercial code “ELFEN” which was developed by Rockfield Software Limited, Swansea, UK. The model is a two-dimensional axisymmetric model. An implicit scheme and four-node rectangular elements were adopted. The F-bar method was applied to the element to overcome volumetric locking [17]. In the analysis of the tube flaring, one tube end was flared by the plug being pressed until buckling occurred or until the plug reached the fixed portion, while the other end and the outer surface were fixed at the holder portion.
Table 1 shows the process conditions for the tube flaring in the FEM and the experiment. Two tube materials were tested: a carbon steel STKM13C (Japan Industrial Standard, JIS) and an aluminum alloy AA1070. Table 2 shows these material properties used for FEM analysis. The Hooke’s law and the von Mises yield criterion were adopted. The constraints were determined by the penalty function method. Figure 5 shows effective stress σeq vs. effective plastic strain εeq curves of the tubes. Here, the σeqεeq curves were obtained by tensile tests, and these curves were approximated by the Swift equation. FEM analysis was carried out under various friction coefficients μ, which ranged from 0.1 to 0.3. Here, μ between the tube and the plug was estimated by comparing the experimental flaring load P with that of the analysis for various μ.

2.2. Expansion Drawing Method and Conditions

FEM analysis of the drawing process was carried out in order to investigate the effectiveness of the proposed method over the conventional method. In addition, expansion drawing experiments were performed and the results were compared with those from FEM analysis. Figure 6 shows schematic diagrams of the FEM models for the drawing processes. Two-dimensional axisymmetric models, which are shown in Figure 6a,b, were used to compare the characteristics of the proposed method to those of the conventional drawing method with diameter shrinkage. An implicit scheme and four-node rectangular elements were adopted for the two-dimensional models. The F-bar method was applied to the element to overcome volumetric locking [9]. In expansion drawing analysis using the model (FD-2D-Impl), the expansion plug was displaced in the axial direction while fixing one tube end, as shown in Figure 6a. Analysis of plug drawing, which is the conventional method, was carried out using the model (PD-2D-Impl), as shown in Figure 6b. In this model, both the die and the plug were displaced in the axial direction, promoting the tube thickness reduction by ironing between the die and the plug. The target thickness g was controlled by changing the plug diameter dp while the die diameter dd was constant. In addition, a three-dimensional model (FD-3D-Expl), which is shown in Figure 6c, was used to consider the effect of initial thickness deviation in expansion drawing. An explicit scheme and eight-node hexahedral elements were adopted. The thickness deviation was reproduced by changing the center of axis of the outer surface in the x direction as compared to that of the inner surface.
Figure 7 shows a schematic diagram of the experiment for the expansion drawing. Tubes having ends that were previously flared were used in this experiment. The flared portion was chucked, and the plug was drawn in the tube axial direction using a hydraulic cylinder. Expansion ratio κd, thickness change ratio η, ovality ratio ω, and thickness deviation ratio λ were evaluated. Here, κd, η, ω, and λ were defined by the following equations:
κ d   =   d ep d i 0 d i 0
η   =   t t 0 t 0
ω   =   d max d min d ave
λ   =   t max t min t ave
where dep is the plug diameter, di0 is the initial tube inner diameter, and t0 and t are the tube thicknesses before and after the drawing, respectively. Here, dmax, tmax, dmin, tmin, dave, and tave are, respectively, the maximum, minimum, and averaged values of the diameter and the thickness in the hoop direction at one cross section. Figure 8 shows the measurement position of t in this experiment. t was measured at 45° intervals in the hoop direction and 10 mm intervals in the axial direction by using an ultrasonic thickness gauge “ECHOMETER 1061” which was produced by Nihon Matech Corporation, Shinjuku-ku, Japan.
Table 3 shows the conditions of the drawing processes. The materials properties were the same as those in the flaring analysis, which were shown in Table 2 and Figure 5. In expansion drawing, the plug diameter, dep, was varied in order to control the tube thickness t. In the plug drawing, t was controlled by changing the plug diameter, dp, while the die diameter, dd, was constant. The friction coefficient, μ, was set to 0.1 or 0.25 based on the result of flaring.

3. Results and Discussions

3.1. Identification of Friction Coefficient

Figure 9 shows a load-stroke diagram of the tube flaring. In the experiment, the load P increased with an increase in the stroke S, and P drastically decreased when the forming defect occurred. For both materials, STKM13C and AA1070, the maximum flaring ratio κf_max was 0.59. The forming defect of STKM13C was cracking, which is shown in Figure 3c(i), while the forming defect of AA1070 was buckling, which is shown in Figure 3c(ii). The load P vs. stroke S curve of FEM showed the same tendency as that of the experiment, and P increased with the increase in the friction coefficient μ. The experimental P vs. S curves fit the FEM P vs.S curves for μ = 0.1 and 0.25, in the cases STKM13C and AA1070, respectively. In the following FEM analysis of the drawing process, μ was set to 0.1 and 0.25 for STKM13C and AA1070, respectively.

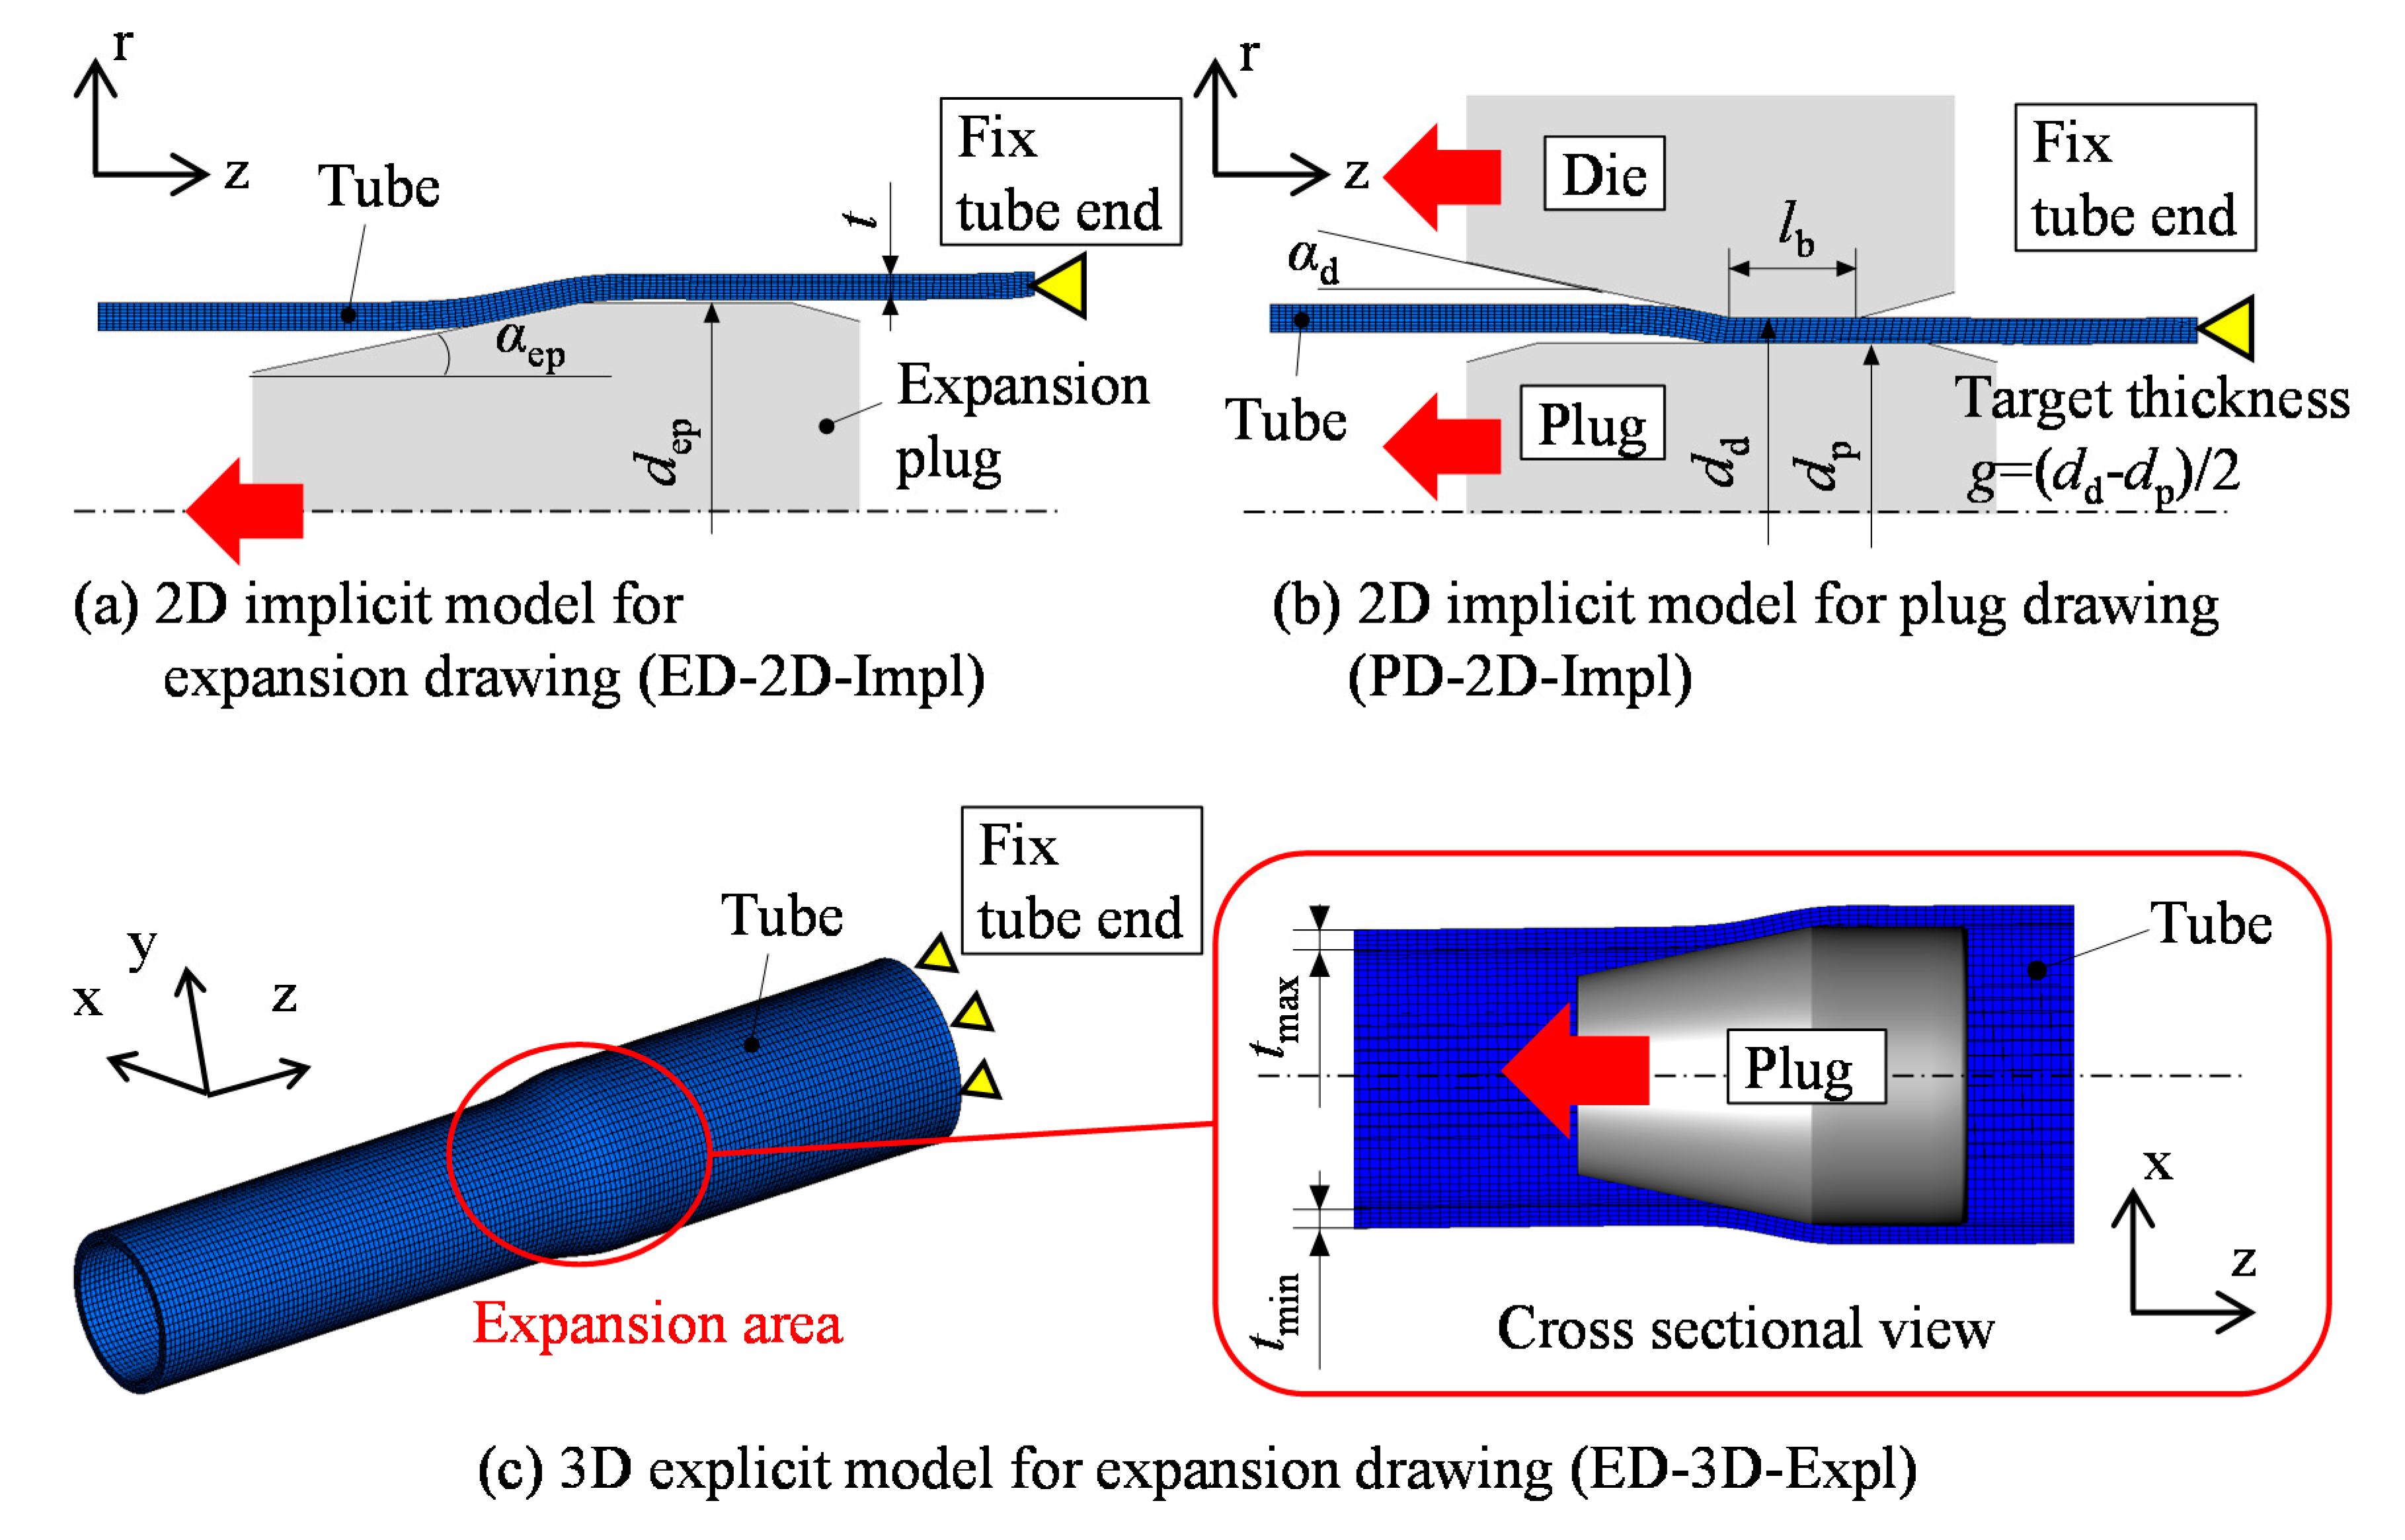
3.2. Investigation of Thickness Reduction Efficiency by FEM Analysis

FEM analysis with two dimensional models, which are shown in Figure 6a,b, was conducted to investigate the forming characteristics and the effectiveness of the expansion drawing, compared to the conventional drawing process with the diameter shrinkage. In this investigation, the material properties of STKM13C were adopted. Figure 10 shows the effect of the expansion ratio κd on the thickness reduction ratio γ, evaluated numerically and theoretically (assuming an axial strain εz = 0). Here, γ is equal to the negative value of the thickness change ratio η (i.e., γ = −η). Moreover, γ of FEM is the averaged value in a steady region of the drawing. Theoretical value of processed tube thickness tεz=0 was calculated from the following equation, which assumes that the cross-sectional area does not change, and the inner diameter expand to the plug diameter dep.
t ε z   =   0   =   4 t 0 ( d 0 - t 0 )   +   d ep 2     d ep 2
Theoretical value of γ was calculated using tεz=0. γ increased with the increase in κd, similarly to the theoretical value. Therefore, the tube mainly elongated in the hoop direction in this process. The effect of the initial tube thickness t0 on γ was small. The axial strain εz was considered to be small, and either the elongation or the shrinkage depended on the forming conditions, such as κd and t0. For example, when κd was over 0.15 and t0 = 2 mm, the value of γ obtained by FEM, was smaller than its theoretical value due to a shrank in the axial direction; while for t0 = 4 mm, the value of γ obtained by FEM was larger than the theoretical value due to an elongation in the axial direction.
Figure 11 shows the relationship between the thickness reduction ratio γ and the drawing load P. Here, γ of the expansion drawing was larger compared to that of the plug drawing. The result suggests that the expansion drawing requires a lower load, in comparison with the plug drawing, to reach the same thickness reduction. On the other hand, γ drastically increased when P reached a large value, namely, 96 and 114 kN for t0 = 2 and 4 mm, respectively, in the case of the plug drawing. Necking is considered to occur easily in this load region, leading to eventual tube fracture. A drastic increase of γ was not observed in the expansion drawing. Therefore, expansion drawing has the potential to improve the thickness reduction limit.
Figure 12 shows the relationship between the effective plastic strain εeq and the thickness reduction ratio γ. εeq increased with the increase in γ. This means that the tube work-hardened with the thickness reduction. εeq changed by the drawing method, although the effect of the tube initial thickness t0 on εeq was small. For the expansion drawing, εeq was smaller than that of the plug drawing when γ was small, and εeq came close to that of the plug drawing with the increase in γ.
Figure 13 shows the distribution of deviatoric stress and strain for each drawing process under the condition that the thickness reduction ratio γ was approximately 0.1, which are indicated by (i) and (ii) in Figure 11 and Figure 12. In the case of plug drawing, the tube wall thickened before ironing due to positive radial deviatoric stress σr’ related to the tube shrinking in the hoop direction. The drawing load P was made large by reducing the thickened tube wall, and the tube elongated in the axial direction. In the expansion drawing, the deformation zone was divided into two regions, which are [A] the diameter expansion, and [B] the axial stretching. In region [A], the tube is mainly stretched in the hoop direction, leading to tube wall thinning due to the negative radial deviatoric stress σr’. The axial stress σz was small because the inner surface was fixed by the frictional force between the tube and the expansion plug. Therefore, the axial deviatoric stress σz’ was negative, and the tube shrank in the axial direction. In region [B], the tube mainly stretched in the axial direction because the inner surface was not fixed by decreasing the frictional force with the expansion plug. Therefore, the thickness additionally decreased by axial elongation without changing the hoop length. Here, εz of the processed tube is determined by the amount of shrinkage and elongation in region [A] and [B]. In the conditions of Figure 13, the tube slightly shortened in the axial direction because the amount of shrinkage in region [A] was larger than the elongation in region [B].

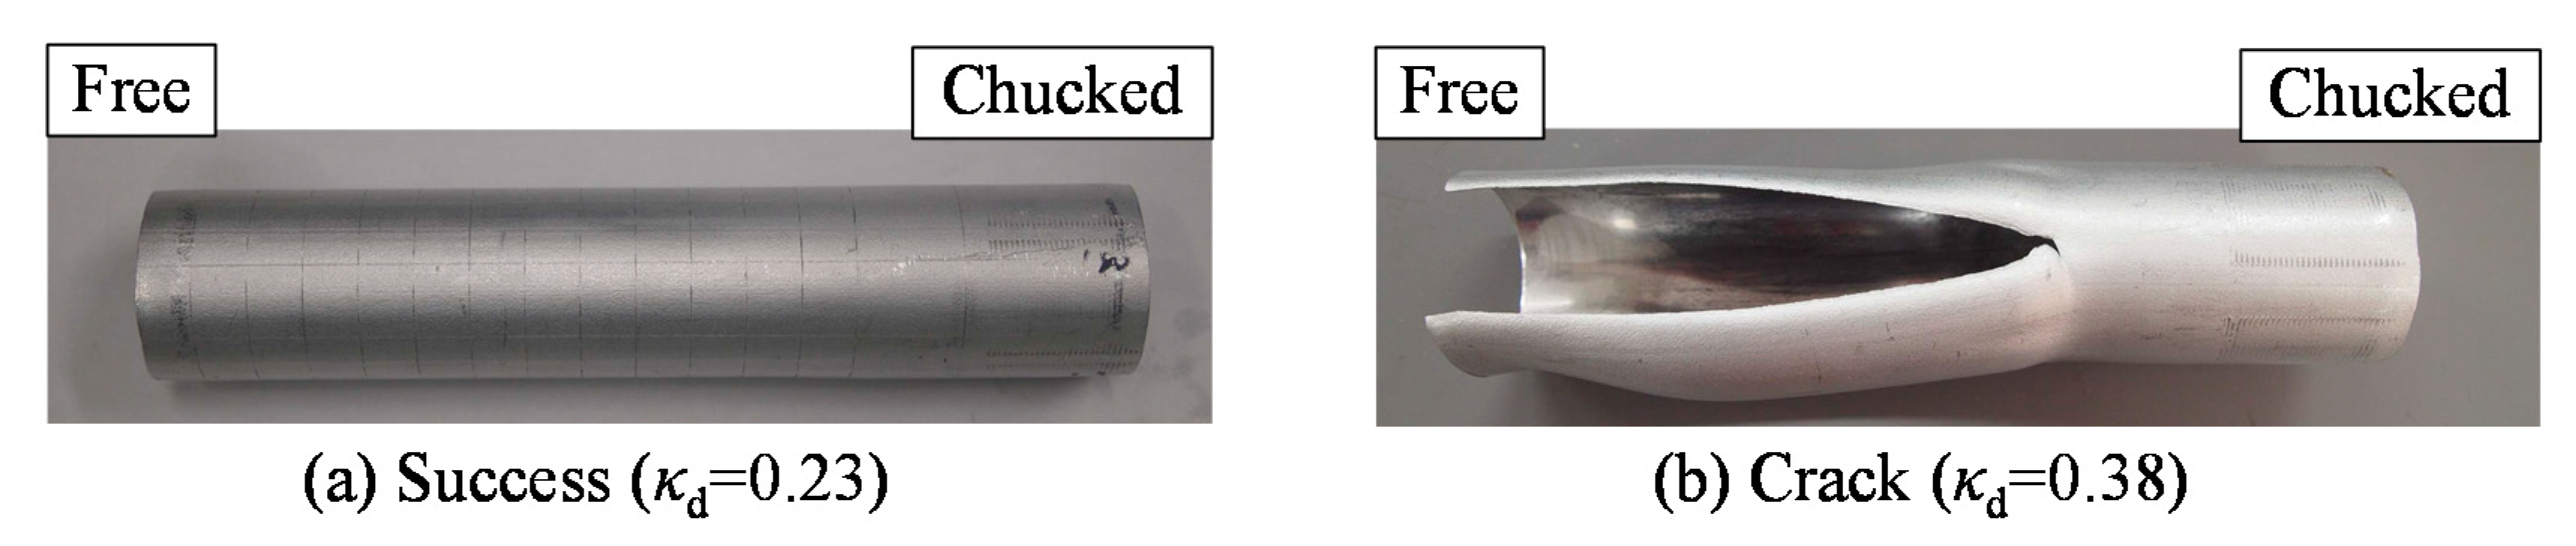
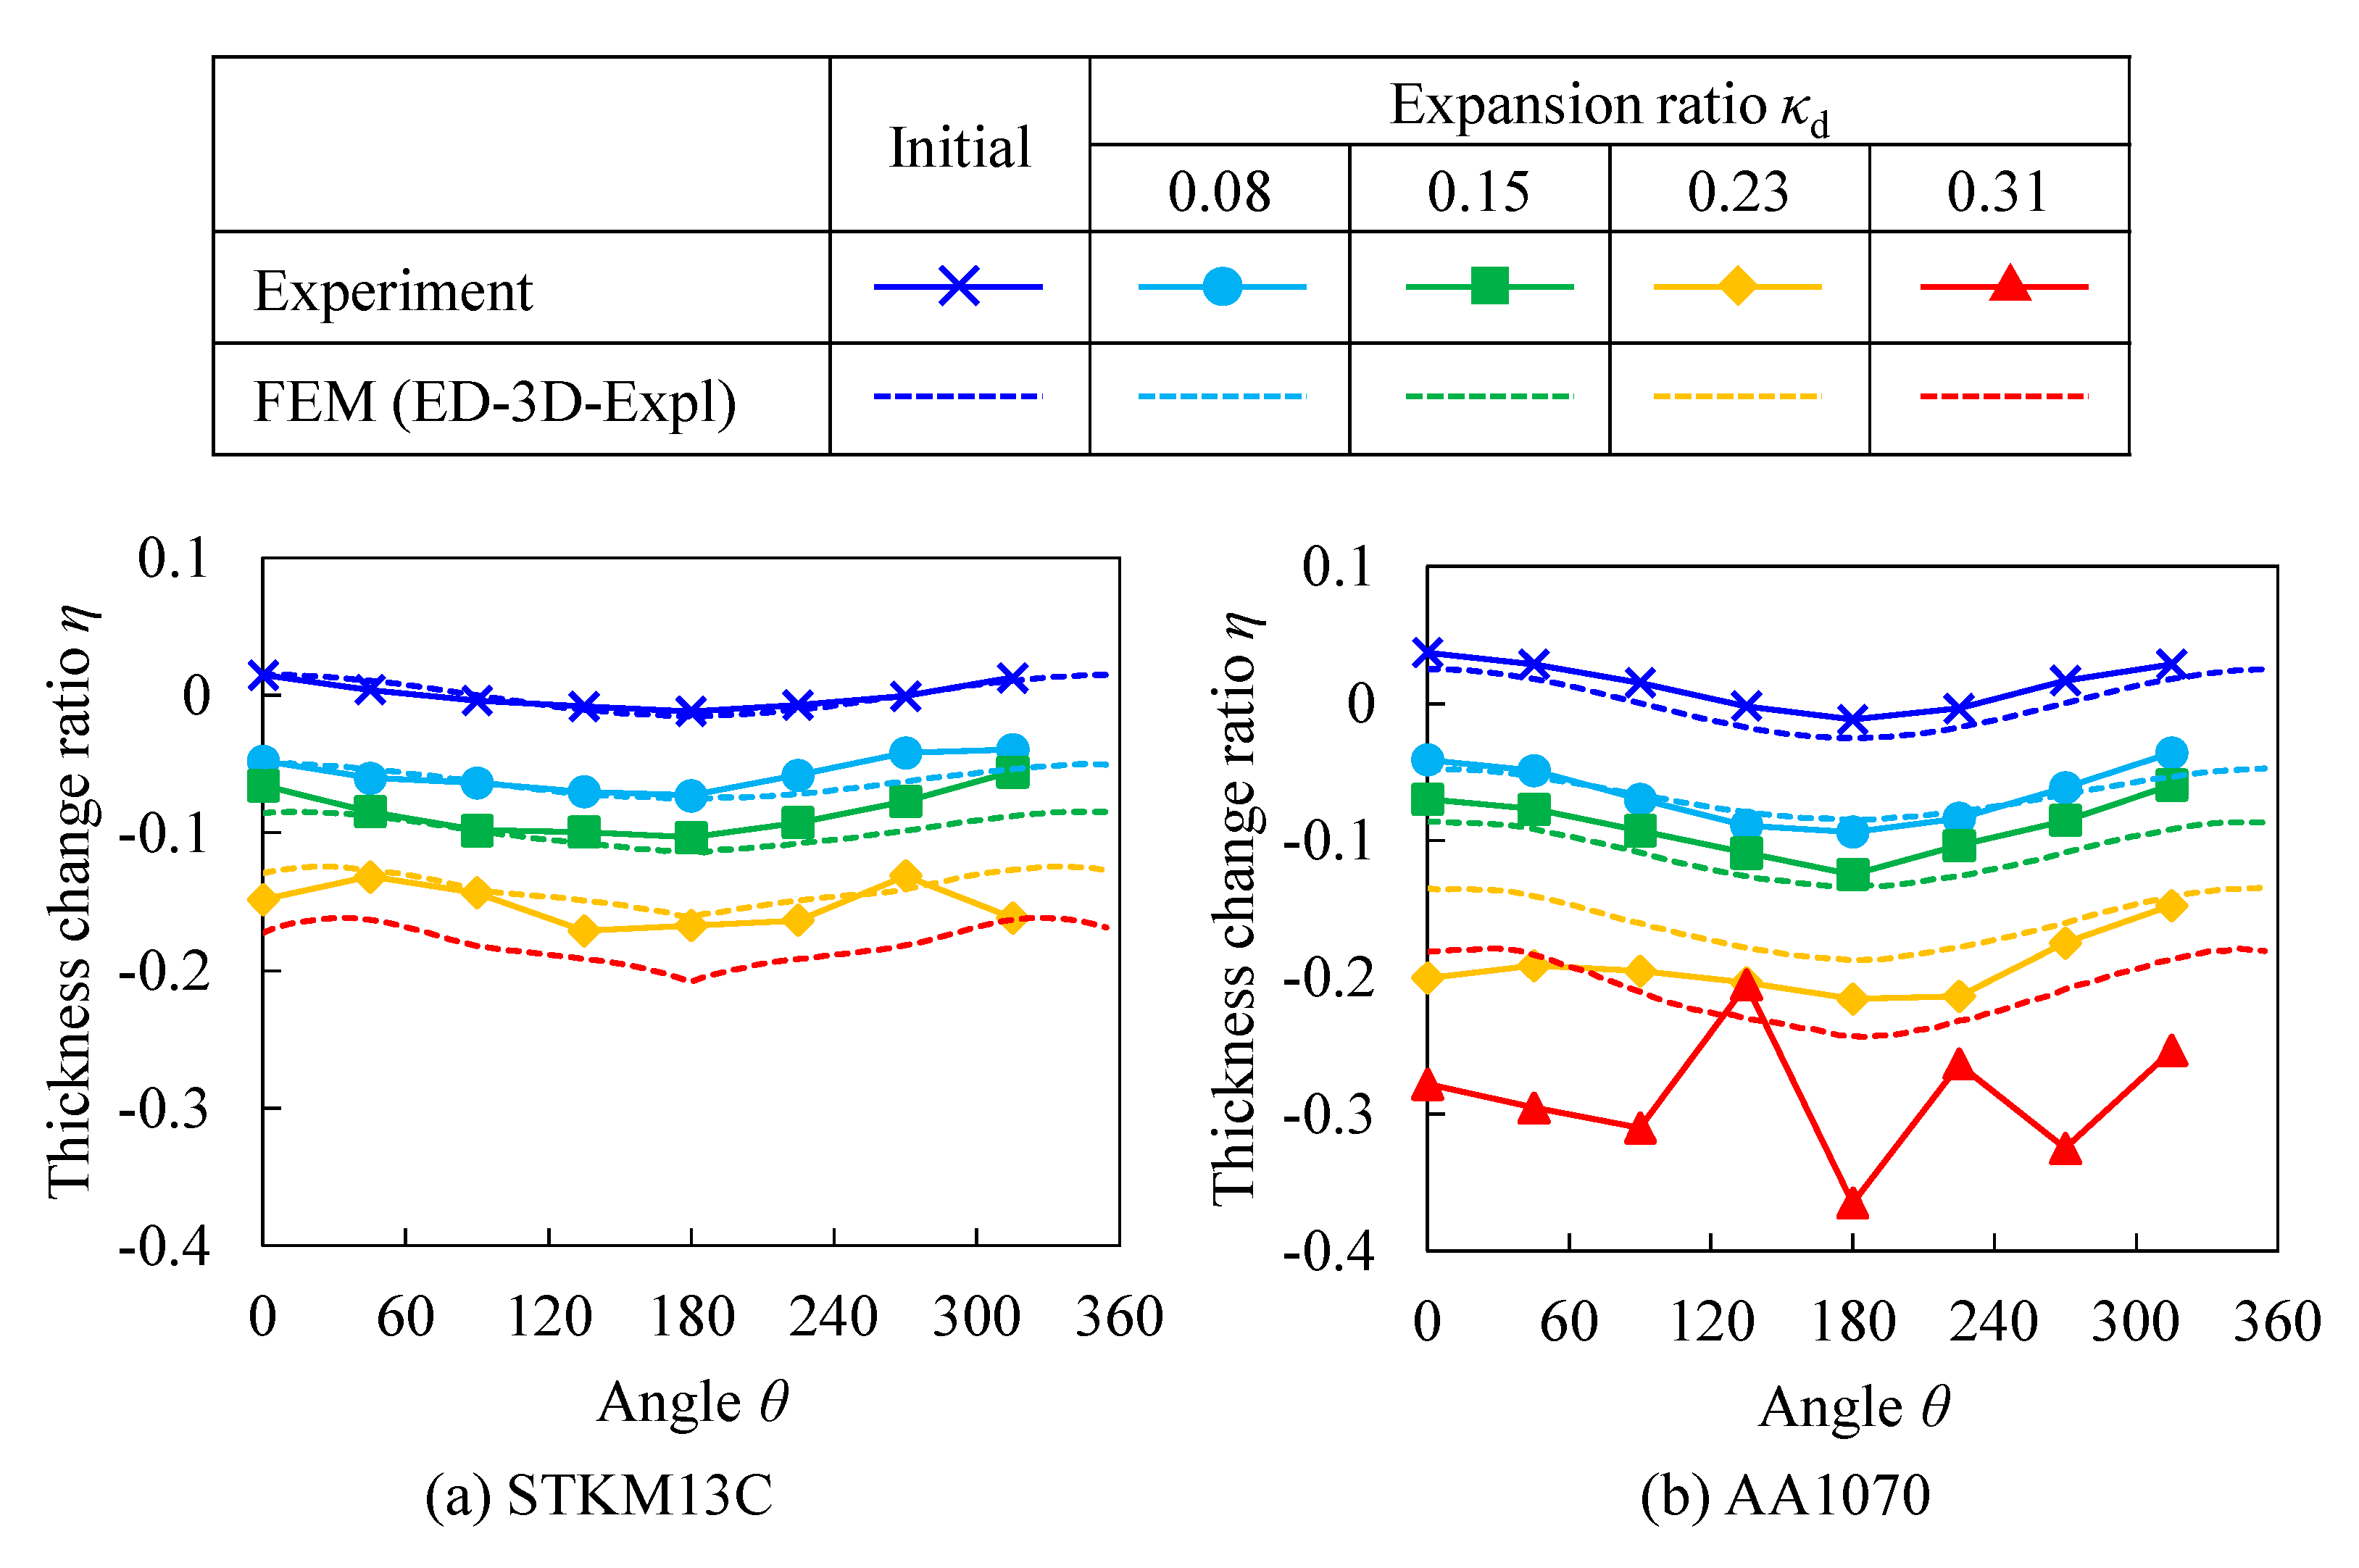
3.3. Experimental Investigation of Expansion Drawing

A series of experiments were conducted to investigate the formability on the expansion drawing, and the experimental results were compared to the FEM results. The FEM results were obtained using the models (ED-2D-Impl) and (ED-3D-Expl). STKM13C and AA1070 were used for the tube material in this investigation. Table 4 shows the feasibility of the drawing. The crack runs in the tube axial direction mainly due to the stretching in the hoop direction when the expansion ratio κd was too large, as shown in Figure 14. The maximum expansion ratio κd_max for producing a tube without a crack was 0.23 in the case of STKM13C and 0.31 in the case of AA1070. This is because STKM13C tube fractures easily due to a low elongation property, as shown in Figure 5. In addition, κd_max was lower than the maximum flaring ratio, κf_max, for both materials. Furthermore, since in the expansion drawing process, the axial tensile stress σz was larger than that of the flaring process, the tube wall easily cracked as a result of biaxial stretching.
Figure 15 shows the distribution of the thickness change ratio η in the tube axial direction. Here, η is the average value in the hoop direction for each axial position. The thickness t, reduced by drawing, is uniform, except for the portions, the lengths of which are lfr and lch, near the tube ends. In the experiment, the portion near the chucked side (lch) was mainly expanded in the flaring process, in which the axial stress σz is lower, resulting in a small thickness reduction. The length lch becomes longer with the increase in the expansion ratio κd, because the taper length of the plug becomes longer with the increase in the plug diameter dep. The portion near the chucked side (lch) did not appear in the FEM analysis because the flaring process was not reproduced in the model (ED-2D-Impl). At the portion near the free end (lfr), the thickness reduction was also low because σz was low during drawing.
Figure 16 shows the thickness reduction ratio γ at the axial middle portion of the drawn tube. Here, γ increased with the increase in the expansion ratio κd, reaching a maximum value of 0.29 when the κd of the AA1070 tube was 0.31 this experiment. In addition, γ of AA1070 was larger than that of STKM13C for each κd. This occurred because the AA1070 tube was strongly stretched in the axial direction by the large frictional force at region (B) in Figure 13. The experimental results almost fit the FEM results under the condition of κd = 0.1–0.23, although γ of the experiment was larger than that of the FEM analysis when the κd was 0.31. This is because local thinning occurred in the experiment.
The dimensional accuracy of the cross section of the tube was evaluated. Figure 17 shows the ovality ratio ω of the tube. ω was small and less than 1%, although ω slightly increased by the expansion drawing. This result suggests that the ovality of the tube, which is processed by the expansion drawing, is good. However, the thickness deviation appeared for any forming conditions. Figure 18 shows the distribution of the thickness change ratio η in the tube hoop direction, where η is the average value in the axial direction for each angle θ. The thickness variation in the initial tube was observed, and initial thickness deviation ratios λ were 0.03 and 0.05 for the STKM13C and AA1070 tubes, respectively, in this experiment. Therefore, these initial thickness deviation ratios were set to that of the model (ED-3D-Expl) in the FEM analysis. As shown in Figure 18, the thickness variation of the processed tube follows the same trend as that in the initial tube, and the experimental results approximately fit the FEM results at the expansion ratio κd of 0.08–0.15. On the other hand, the thickness variation showed a different tendency from the initial tube when the expansion ratio κd was 0.23–0.31 due to the occurrence of local thinning. In particular, large local thinning appeared in the cross section of the AA1070 tube under the condition of κd = 0.31, as shown in Figure 19b.
Figure 20 shows the effect of the expansion ratio κd on thickness deviation ratio λ, which slightly increased with the increase in κd, except in cases in which large local thinning occurred, as shown in Figure 19b. This is because the local deformation occurred easily at the thin side with the increase in κd. Figure 21 shows the distribution of effective plastic strain εeq at the cross section in the FEM analysis. The distribution of εeq was comparatively uniform when κd was 0.15, whereas εeq locally increased at the thin side when κd was 0.31. Based on this result, the expansion drawing does not improve the thickness deviation. On the other hand, λ could be improved by slightly form the tube by hollow sinking or plug drawing, which reduce the thickness variation [2], after the expansion drawing.

4. Conclusions

The present paper proposed a tube drawing method with diameter expansion, which is referred to herein as ‘expansion drawing’, for producing thin-walled tubes effectively. The forming characteristics and effectiveness of the proposed method were investigated through a series of finite element method (FEM) analyses and experiments. Carbon steel (STKM13C) and aluminum alloy (AA1070) tubes were used as the test materials. According to the FEM analysis results, the thickness decreased with an increase in the expansion ratio. In addition, the expansion drawing reduced the tube thickness by a small load, when compared to the case of plug drawing with diameter shrinkage, which is the conventional method. In the expansion drawing experiment, it was possible to successfully produce thin-walled tubes, although for large expansion ratios the tube cracked due to biaxial stretching in the axial and hoop directions. The thickness reduction of the tube increased with the increase in the expansion ratio in a similar manner for both the experimental and FEM results. The maximum thickness reduction ratio was 0.15 when the expansion ratio was 0.23 for STKM13C, and the maximum thickness reduction was 0.29 when the expansion ratio was 0.31 for AA1070. The ovality ratio was small and less than 1% for each condition. The increase in the thickness deviation by the expansion drawing was small, but the thickness deviation drastically increased when local thinning occurred at the tube wall due to the use of expansion ratios that were too large. Therefore, this ratio should be set appropriately to produce tubes with small thickness deviations.

Author Contributions

Conceptualization, S.K., T.K. and M.A.; methodology, S.K., H.K., T.K. and M.A.; software, S.K. and T.K.; validation, S.K. and H.K.; formal analysis, S.K.; investigation, S.K. and H.K.; resources, H.K., I.A. and Y.T.; data curation, S.K. and H.K.; writing—original draft preparation, S.K.; writing—review and editing, S.K., H.K., T.K., I.A., Y.T. and M.A.; visualization, S.K. and H.K.; supervision, S.K.; project administration, S.K.; funding acquisition, S.K., I.A. and Y.T. All authors have read and agreed to the published version of the manuscript.

Funding

This research was funded by Amada foundation, grant number AF-2018034.

Conflicts of Interest

The authors declare no conflict of interest.

References

  1. Kuboki, T.; Nishida, K.; Sakaki, T.; Murata, M. Effect of plug on levelling of residual stress in tube drawing. J. Mater. Process. Technol. 2008, 204, 162–168. [Google Scholar] [CrossRef]
  2. Kuboki, T.; Tasaka, S.; Kajikawa, S. Examination of working condition for reducing thickness variation in tube drawing with plug. In COMPLAS XIV, Proceedings of the XIV International Conference on Computational Plasticity: Fundamentals and Applications, Barcelona, Spain, 5–7 September 2017; CIMNE: Barcelona, Spain, 2017; pp. 63–71. [Google Scholar]
  3. Foadian, F.; Carradó, A.; Palkowski, H. Precision tube production: Influencing the eccentricity and residual stresses by tilting and shifting. J. Mater. Process. Technol. 2015, 222, 155–162. [Google Scholar] [CrossRef]
  4. Zhang, L.; Xu, W.; Long, J.; Lei, Z. Surface roughening analysis of cold drawn tube based on macro–micro coupling finite element method. J. Mater. Process. Technol. 2015, 224, 189–199. [Google Scholar] [CrossRef]
  5. Łuksza, J.; Burdek, M. The influence of the deformation mode on the final mechanical properties of products in multi-pass drawing and flat rolling. J. Mater. Process. Technol. 2002, 125–126, 725–730. [Google Scholar] [CrossRef]
  6. Prakash, R.; Singhal, R.P. Shear spinning technology for manufacture of long thin wall tubes of small bore. J. Mater. Process. Technol. 1995, 54, 186–192. [Google Scholar] [CrossRef]
  7. Chi, J.; Cai, Z.; Li, L. Optimization of spinning process parameters for long thin-walled cylinder of TC11 alloy based on processing map. Int. J. Adv. Manuf. Technol. 2018, 97, 1961–1969. [Google Scholar] [CrossRef]
  8. Abe, H.; Iwamoto, T.; Yamamoto, Y.; Nishida, S.; Komatsu, R. Dimensional accuracy of tubes in cold pilgering. J. Mater. Process. Technol. 2016, 231, 277–287. [Google Scholar] [CrossRef]
  9. Yasui, H.; Miyagawa, T.; Yoshihara, S.; Furushima, T.; Yamada, R.; Ito, Y. Influence of Internal Pressure and Axial Compressive Displacement on the Formability of Small-Diameter ZM21 Magnesium Alloy Tubes in Warm Tube Hydroforming. Metals 2020, 10, 674. [Google Scholar] [CrossRef]
  10. Tamura, S.; Iguchi, K.; Mizumura, M. Effect of Punch Shape on Multiprocess Tube Flaring for Eccentric Parts. J. Jpn Soc. Technol. Plast. 2019, 60, 182–186. (In Japanese) [Google Scholar] [CrossRef]
  11. Avalle, M.; Priarone, P.C.; Scattina, A. Experimental and numerical characterization of a mechanical expansion process for thin-walled tubes. J. Mater. Process. Technol. 2014, 214, 1143–1152. [Google Scholar] [CrossRef] [Green Version]
  12. Al-Abri, O.S.; Pervez, T. Structural behavior of solid expandable tubular undergoes radial expansion process–Analytical, numerical, and experimental approaches. Int. J. Solids Struct. 2013, 50, 2980–2994. [Google Scholar] [CrossRef] [Green Version]
  13. Seibi, A.C.; Barsoum, I.; Molki, A. Experimental and Numerical Study of Expanded Aluminum and Steel Tubes. Procedia Eng. 2011, 10, 3049–3055. [Google Scholar] [CrossRef]
  14. Karrech, A.; Seibi, A. Analytical model for the expansion of tubes under tension. J. Mater. Process. Technol. 2010, 210, 356–362. [Google Scholar] [CrossRef]
  15. Seibi, A.C.; Al-Hiddabi, S.; Pervez, T. Structural Behavior of a Solid Tubular Under Large Radial Plastic Expansion. J. Energy Resour. Technol. 2005, 127, 323–327. [Google Scholar] [CrossRef]
  16. Yang, J.; Luo, M.; Hua, Y.; Lu, G. Energy absorption of expansion tubes using a conical–cylindrical die: Experiments and numerical simulation. Int. J. Mech. Sci. 2010, 52, 716–725. [Google Scholar] [CrossRef]
  17. De Souza Neto, E.A.; Peric, D.; Dutko, M.; Owen, D.R.J. Design of simple low order finite elements for large strain analysis of nearly incompressible solids. Int. J. Solids Struct. 1996, 33, 3277–3296. [Google Scholar] [CrossRef]
Figure 1. Schematic diagram of drawing process with diameter expansion.
Metals 10 01642 g001
Figure 2. Stress state of tube wall during drawing with shrink and drawing with expansion.
Metals 10 01642 g002
Figure 3. Schematic diagram of flaring experiment.
Metals 10 01642 g003
Figure 4. Two-dimensional implicit model for flaring (FL-2D-Impl) for FEM analysis.
Metals 10 01642 g004
Figure 5. Effective stress σeq vs. effective plastic strain εeq curves of STKM13C and AA1070.
Metals 10 01642 g005
Figure 6. FEM models for drawing processes.
Metals 10 01642 g006
Figure 7. Schematic diagram of expansion drawing experiment.
Metals 10 01642 g007
Figure 8. Measurement position of thickness t in drawn tube.
Metals 10 01642 g008
Figure 9. Load P vs. stroke S diagram for tube flaring.
Metals 10 01642 g009
Figure 10. Effect of expansion ratio κd on thickness reduction ratio γ (STKM13C, 2D FEM).
Metals 10 01642 g010
Figure 11. Relationship between thickness reduction ratio γ and drawing load P (STKM13C, 2D FEM).
Metals 10 01642 g011
Figure 12. Relationship between effective plastic strain εeq and thickness reduction ratio γ (STKM13C, 2D FEM).
Metals 10 01642 g012
Figure 13. Distributions of deviatoric stress σz’ and σr’ and strain εz and εr for each drawing process (initial tube thickness, t0 = 2 mm).
Metals 10 01642 g013
Figure 14. Typical appearances of drawn tubes (AA1070).
Metals 10 01642 g014
Figure 15. Distribution of thickness change ratio η in axial direction by drawing process.
Metals 10 01642 g015
Figure 16. Effect of expansion ratio κd on thickness reduction ratio γ.
Metals 10 01642 g016
Figure 17. Effect of expansion ratio κd on ovality ratio ω.
Metals 10 01642 g017
Figure 18. Distribution of thickness change ratio η in hoop direction by drawing process.
Metals 10 01642 g018
Figure 19. Typical cross-sectional view of drawn tube (AA1070).
Metals 10 01642 g019
Figure 20. Effect of expansion ratio κd on thickness deviation ratio λ.
Metals 10 01642 g020
Figure 21. Distribution of effective plastic strain εeq at cross section of tube (AA1070).
Metals 10 01642 g021
Table 1. Process conditions for tube flaring.
TubeMaterialCarbon Steel (STKM13C)
Aluminum Alloy (AA1070)
Initial diameter d0 (mm)30
Initial thickness t0 (mm)2
Initial length l0 (mm)200
Initial flared length lf0 (mm)100
Element size for flaring region (FEM)8 elements in thickness
0.5 mm/div along the z axis
Expansion plugMaterialSKD11 (Experiment)
Rigid (FEM)
Half angle αep (°)12
Lubricant (Experiment)Stamping and Forming Lubricant G-3344
(Nihon Kohsakuyu Co., Ltd., Minato-ku, Japan)
Friction coefficient μ (FEM)0.1–0.3
Table 2. Material properties of tube materials (FEM).
PropertySTKM13CAA1070
Young’s modulus (GPa)20066
Poisson ratio0.30.34
Yield stress (MPa)63788
Swift equation σeq = F(εeq + ε0)nσeq = 725(εeq + 0.0032)0.023σeq = 121(εeq + 0.0013)0.048
Table 3. Process conditions for the expansion and plug drawing processes.
Tube
(FEM and experiment)
MaterialCarbon Steel (STKM13C)
Aluminum Alloy (AA1070)
Initial diameter d0 (mm)30
Initial thickness t0 (mm)2, 4
Initial length l0 (mm)Exp.200
2D FEM160
3D FEM170
Element size for flaring region (FEM)2D FEM0.5 mm/div along the z axis
8 elements in thickness
3D FEM1 mm/div along the z axis
4 elements in thickness
64 elements in hoop
Plug for expansion drawing
(FEM and experiment)
MaterialSKD11 (Experiment)
Rigid (FEM)
Half angle αep (°)12
Diameter dep (mm)
(Expansion ratio κd)
24–38
(0.07–0.46)
Die for plug drawing
(FEM)
MaterialRigid
Half angle αd (°)12
Diameter dd (mm)28
Bearing length lb (mm)9
Plug for plug drawing
(FEM)
MaterialRigid
Diameter dp (mm)
(Target thickness g (mm))
t0 = 2.0 mm24–25 (1.5–2.0)
t0 = 4.0 mm20–22 (3.0–4.0)
Lubricant (Experiment)Stamping and Forming Lubricant G-3344
(Nihon Kohsakuyu Co., Ltd., Minato-ku, Japan)
Friction coefficient μ (FEM)0.1 (STKM13C)
0.25 (AA1070)
Table 4. Feasibility of expansion drawing
MaterialExpansion Ratio κd
0.080.150.230.310.38
STKM13Csssc-
AA1070ssssc
s: Success, c: Crack.
Publisher’s Note: MDPI stays neutral with regard to jurisdictional claims in published maps and institutional affiliations.

