Article

Modelling the Elements Reaction–Diffusion Behavior on Interface of Ti/Al2O3 Composite Prepared by Hot Pressing Sintering

School of Materials Science and Engineering, University of Jinan, Jinan 250022, China
*
Authors to whom correspondence should be addressed.
Metals 2020, 10(2), 259; https://doi.org/10.3390/met10020259
Submission received: 29 November 2019 / Revised: 28 January 2020 / Accepted: 29 January 2020 / Published: 17 February 2020

Abstract

:
Element reaction–diffusion of Ti/Al2O3 composite which was fabricated at various sintering temperatures, holding times, and a sintering pressure of 30 MPa has been discussed in the present research. Results show that the thickness of the reaction layer of the Ti-Al2O3 interface was increased in exponential form in correspondence with the increase of the sintering temperature. Furthermore, according to analysis, the relationship between the thickness of the interface reaction layer, sintering temperature, and heat preservation time acquiring the kinetic equation of interfacial reaction of Ti/Al2O3 composite was d = 182.5exp(−6.6 × 10⁴/RT)t0.48 by linear fitting.

Graphical Abstract

1. Introduction

Ti and its alloys have been widely used in the field of aerospace, vehicle engineering, and biomedical engineering because of their low weight, high toughness, and outstanding corrosion resistance [1,2,3]. Al2O3 is one of the most useful ceramics due to its favorable physicochemical property and great economic benefits [4,5]. As we know, the strength of Al2O3 ceramics and its resistance to chemical and high-temperature corrosion are better than those of Ti. However, the densification weakness of Al2O3 is its low-breaking toughness. The combination of Ti and Al2O3, compared with titanium, has fatigue strength and corrosion resistance of the composite that is definitely improved, at the same time, because of the role of Ti, the toughness of the composite material is also guaranteed. Ti/Al2O3 composite is expected to be able to combine the advantages of the metal and ceramic material and expand their application in some special circumstances such as high temperature, high pressure, and a corrosive environment [6]. With this excellent feature, Ti/Al2O3 composites have potential applications in armor panels, brake pads for automobiles, and protective coatings for space shuttles. Interface bonding is an important index to evaluate the properties of composite materials, including Ti/Al2O3 composite [7,8].
The interface reaction between Ti and Al2O3 is easy to occur at high temperature while forming some brittle phases, such as TiAl and Ti3Al, which have severely impacted their interface structure and mechanical properties [9,10]. To some extent, it restricts the application prospects of Ti/Al2O3 composite in some fields. In order to study the Ti and Al2O3 under the condition of a high-temperature interface reaction mechanism, the scientific researchers have done a lot of research, mainly concentrated in Ti and Al2O3 interface reaction characteristics, composition and generate order, element diffusion distance, etc. Lu [11] had analyzed the forming process and composition of Ti/Al2O3 composite interface under different conditions. The results showed that Ti reacted with Al2O3 to form an interface layer of about 200 nm in thickness. The composition of interface phases were mainly: Ti, Al2O3, TiO, and Al in the metal state. Ji [12] studied the interface properties between Ti and Al2O3 under the condition of 1740 °C melting for 30 min, and the results illustrated that there was no clear interface reaction layer, but Ti3Al generated near the Ti side. Chaug [13] reported that TiO compound was formed at the interface of Ti and Al2O3 (001) under high vacuum. The chemical reaction between Ti and Al2O3 (112) surface was studied in the research of Selverian [14], TiO was generated at the interface. Therefore, it makes great sense to study and explore the mechanism of Ti-Al2O3 interface reaction. Our group have also done some relevant work. Wu [15] discussed the diffuse ability of various elements in Ti/Al2O3 composite, discovering that the diffusion pattern was basically Al entering into Ti, and O barely changed. Liu [16] furtherly studied the influence of sintering temperature on diffusion distance in the Ti/Al2O3 composites, deducing the kinetic equation between growth of the thickness and sintering temperature, meanwhile the formation mechanism of Ti-Al2O3 composite was also explained.
In this work, a model of interface reaction–diffusion of Ti/Al2O3 composite was established from the angle element diffusion dynamics, we discussed the relationship of Ti-Al2O3 reaction layer thickness between sintering temperature and soaking time. As is known that the reaction products TiAl and Ti3Al were both brittle phases in the Ti-Al2O3 system. How to control their generation was a meaningful and necessary work. Therefore, it was indispensable to realize the interface reaction between Ti and Al2O3 could further guide us to select the appropriate inhibitor to restrict the interface reaction, improving the mechanical properties of Ti/Al2O3 composite, which was also the innovation and purpose of the present study.

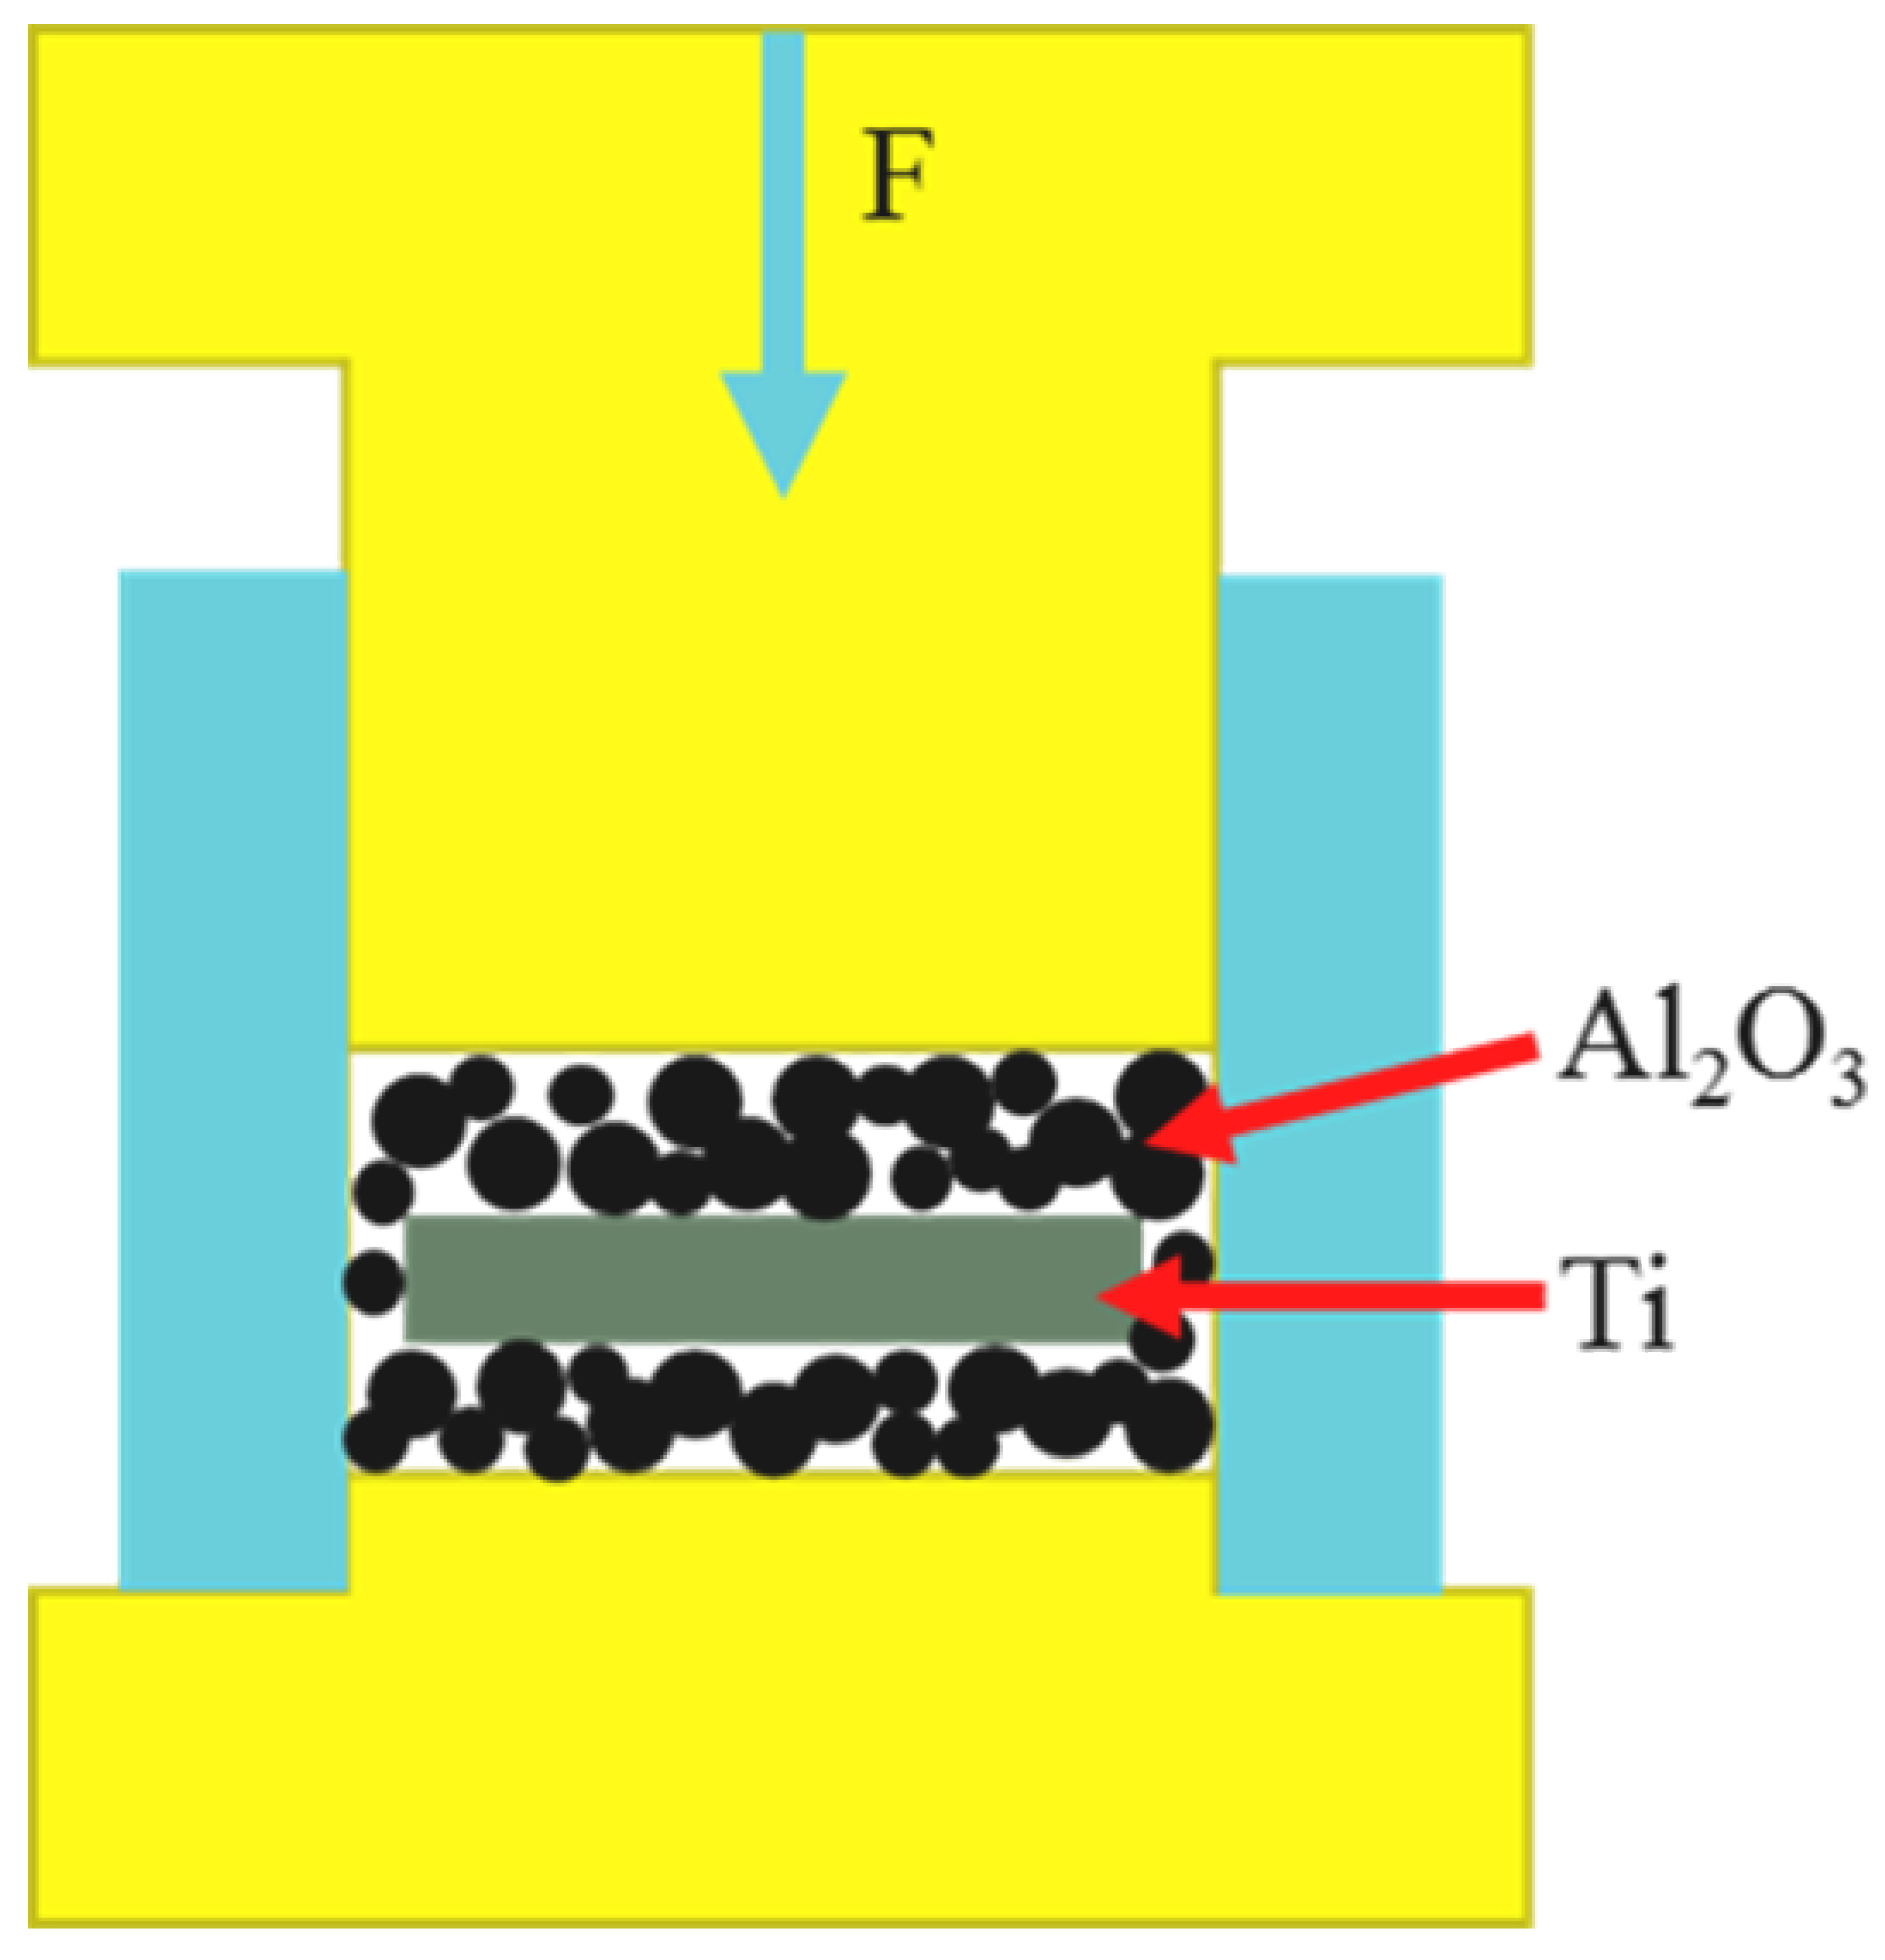
2. Experimental Methods

Al2O3 powder (≥99.8% pure, impurity: SiO2 < 0.1 wt.%, Fe2O3 < 0.03 wt.%, Na2O < 0.04 wt.%, diameter of 5 μm, Henan Changxing Co., Ltd, Zhengzhou, China) and Ti powder (≥99.6% pure, impurity: Fe < 0.02 wt.%, Si < 0.013 wt.%, Cu < 0.007 wt.%, diameter of 10 μm, Shanghai ST-Nano Science and Technology, Shanghai, China) were used as raw materials in this experiment. Laminated Ti/Al2O3 composites were prepared by burying Ti bar (compressed by Ti powder) with Al2O3 powder. The details were as follows: 2 g Ti powder was pressed into a bar with a size of 30 mm × 10 mm × 2 mm using a steel mold under the pressure of 30 MPa for 1min. After preparation, 15 g Al2O3 powder was spread on bottom of a graphite mold with the inner diameter of 45 mm. Then Ti bar (prepared before) was placed above the Al2O3 powder and covered by 15 g Al2O3 powder. The schematic diagram of this process was shown in Figure 1. The graphite mold filled with powders was sintered at 1250 °C, 1350 °C, 1400 °C, 1450 °C, and 1500 °C for different holding time (1.5 h, 2 h, 2.5 h, and 3 h, respectively) under a pressure of 30 MPa. The samples were taken out when cooling naturally to room temperature.
The microstructure, elements distribution and reaction layers of Ti/Al2O3 composites were analyzed by using scanning electron microscopy (SEM, FEI QUANTA FEG 250, Hillsboro, OR, USA) equipped with an energy dispersive spectroscopy (EDS).

3. Results and Discussion

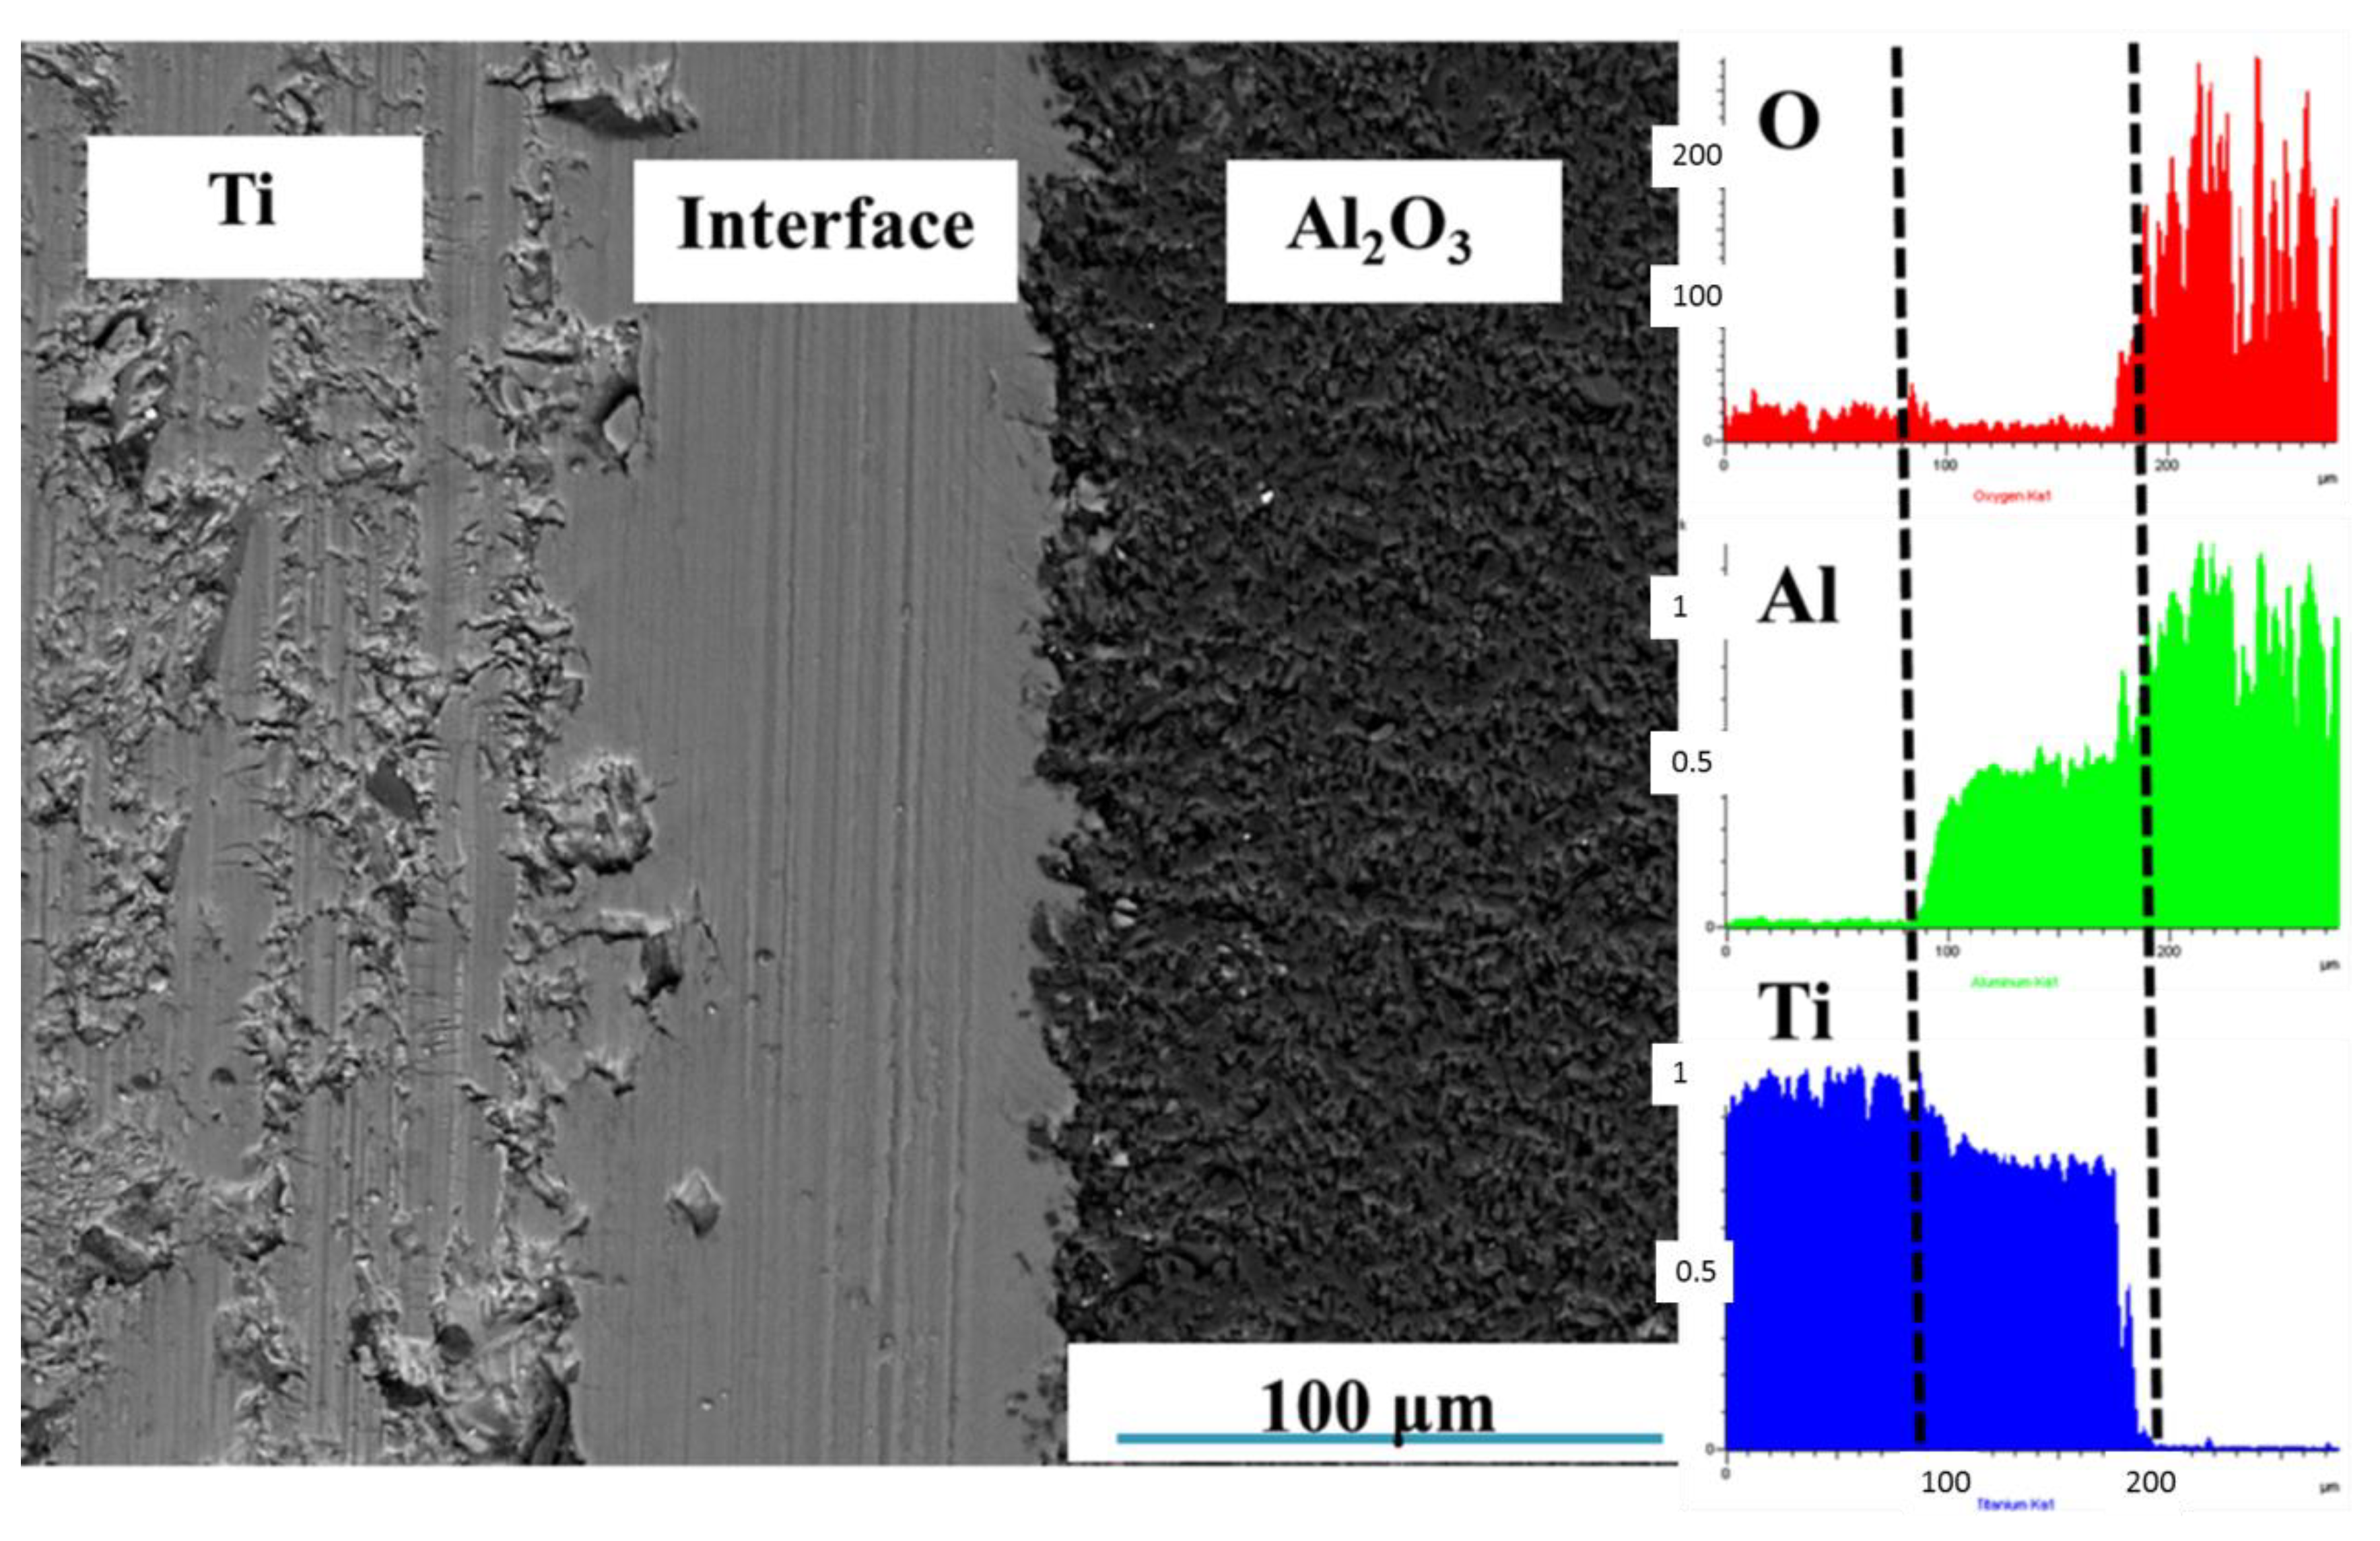
3.1. Effects of Sintering Schedule on Microstructure of Ti-Al2O3 Interface Reaction Layer

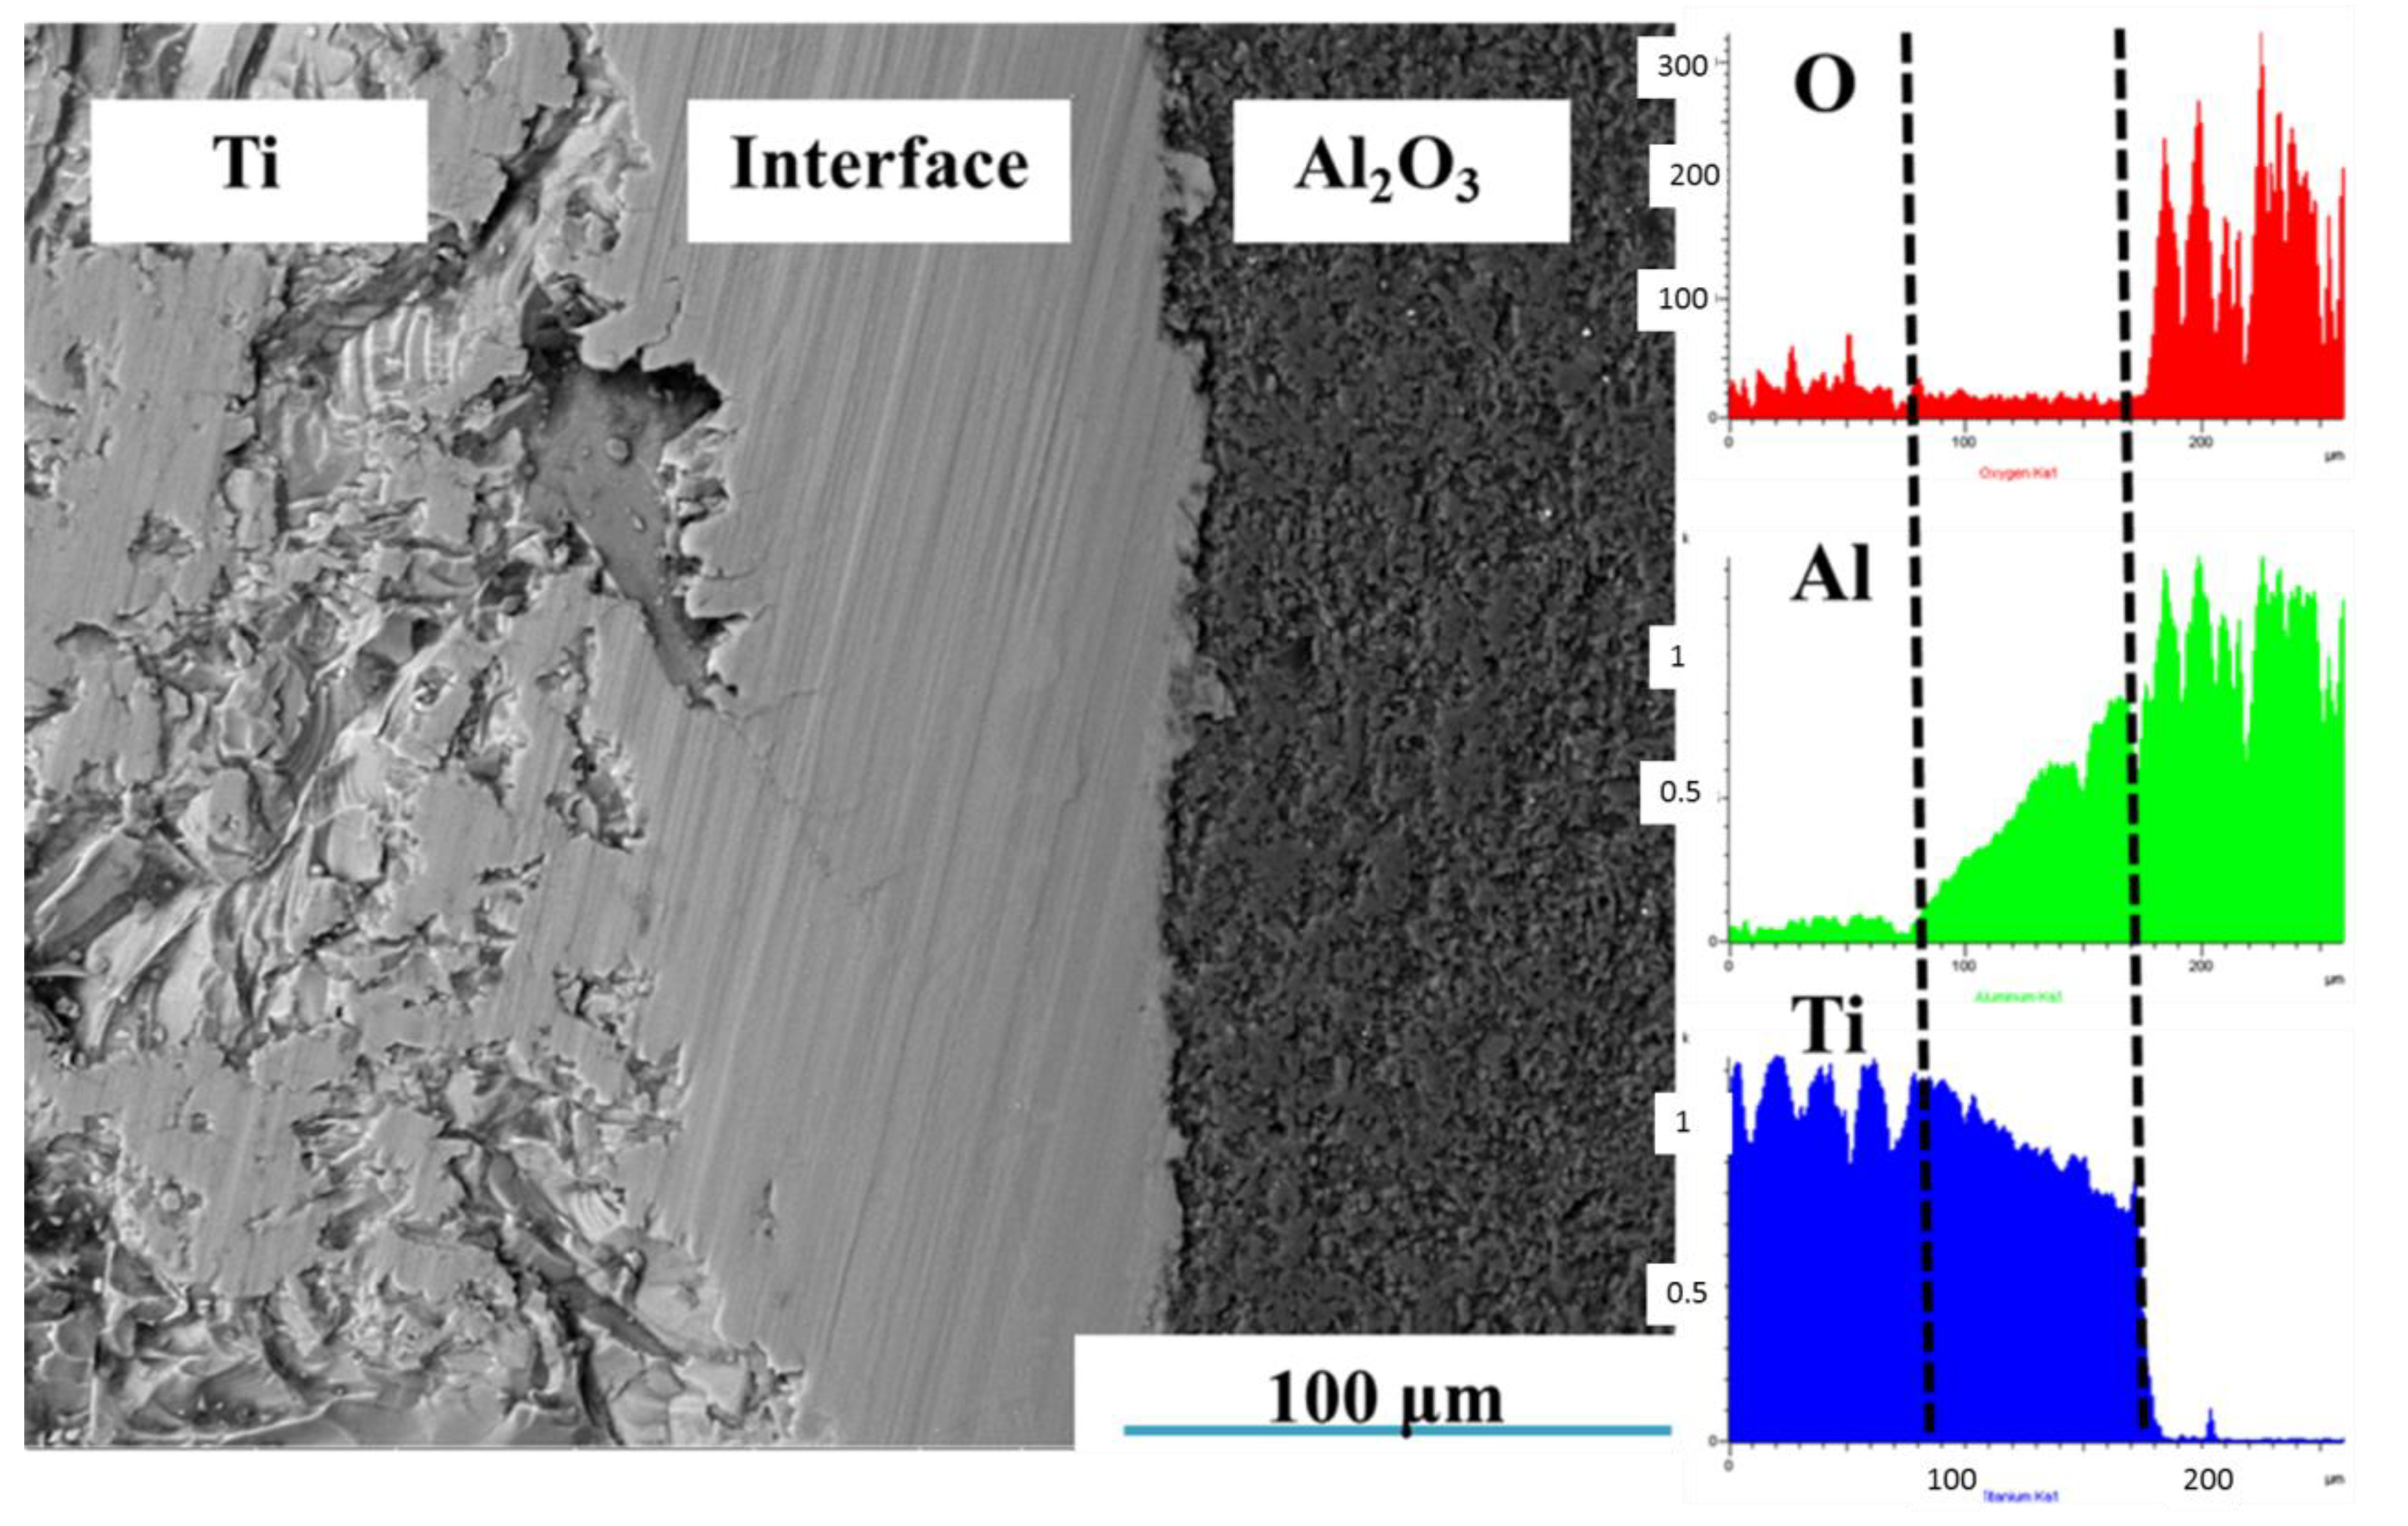
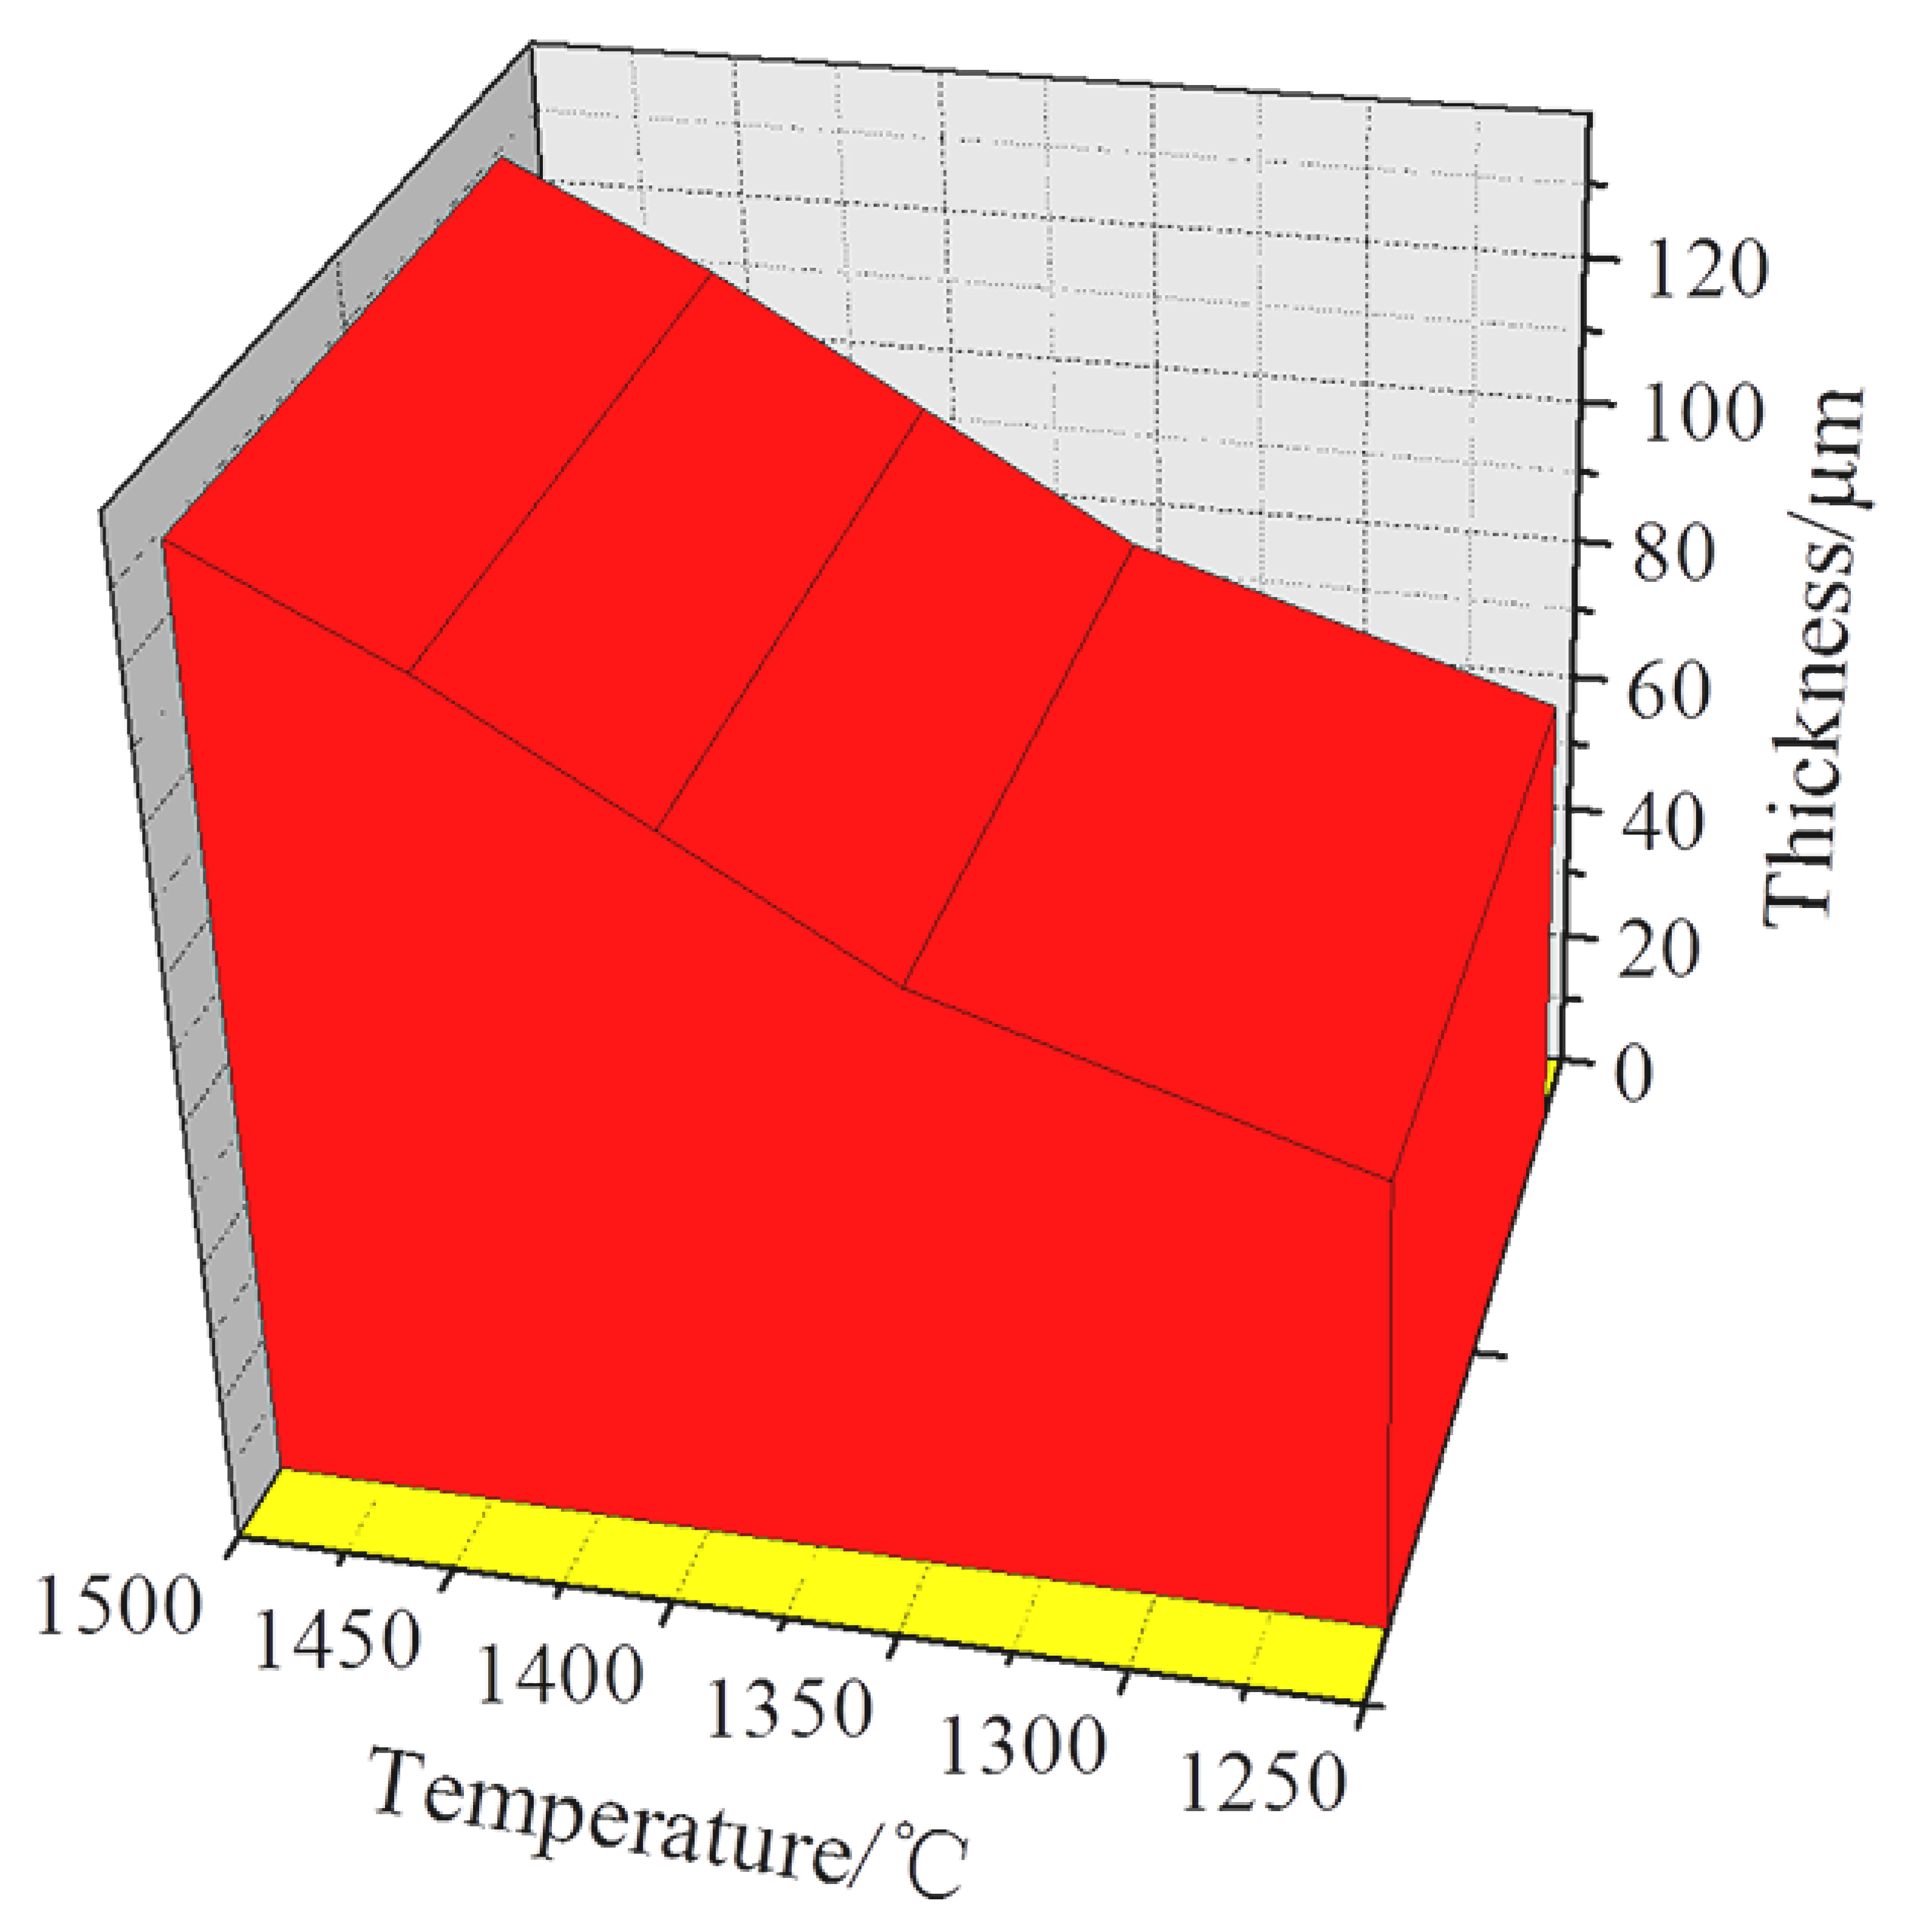
3.1.1. Effects of Sintering Temperature on Microstructure of Ti-Al2O3 Interface Reaction Layer

SEM images and EDS analysis for the interfaces of Ti/Al2O3 composite sintered at different temperature holding for 1.5 h were shown in Figure 2. It can be identified that the light and dark areas are Ti and Al2O3, respectively. The area between them is the interface reaction layer of Ti and Al2O3. With the increase of sintering temperature, the boundaries of the phases are becoming more and more obvious. Due to the increasingly violent interface reaction, the thickness of the interface reactions layer shows an increasing tendency. Furthermore, element distribution and microstructure of the interface reaction layer show obvious change. The above phenomena indicate that temperature is an important factor affecting the composition and structure of the Ti and Al2O3 interface.
In addition, it can be seen in Figure 2 that the visible reaction layer between the interfaces of Ti-Al2O3 in the sample prepared at 1250 °C can be observed. The closely combined reaction layer shows that interface reaction of Ti and Al2O3 starts to occur at this temperature. The EDS results show that a small quantity of Al and O element diffuses into Ti phase, and the average diffusion distance of Al element is about 63.1 μm. On the contrary, Ti element hardly spread into the Al2O3 phase. When the sintering temperature reaches 1350 °C, as shown in Figure 3, a clear line between Ti and Al2O3 phases can be observed. However, the boundary between the interface reaction layer and Ti is not so clear. The thickness of the interface reaction layer increases gradually with the increase to the sintering temperature. When the sintering temperature is up to 1400 °C, it can be observed from Figure 4 that the interface reaction layer is more compact. When the temperature rises to 1450 °C, the thickness of interface reaction layer continues to increase. When the temperature is 1500 °C, the average interface reaction layer is about of 123.4 μm. As shown in Figure 5, the sizes of Ti and Al2O3 grains become bigger than those in the samples prepared at the lower sintering temperature. It may be due to that high temperature (close to the melting point of Ti) that increases the diffusion and flow speed of Ti. The high temperature also causes the oversintering and abnormal grain growth [15].
According to the EDS results of Ti-Al2O3 interface reaction layers of samples prepared at different temperatures, the tendency of diffusion and distribution of different elements in the interface can be obtained. It can be seen that, the concentration of Ti element on the boundary of the interface reaction layer and the Al2O3 phase declines sharply and goes to practically zero. It means that the diffusion ability of Ti elements in the Al2O3 phase is very weak, and only a tiny amount of Ti element can effectively spread. In contrast, the concentration distribution of Al element shows a slow decreasing trend, which shows that Al element is able to diffuse into the Ti phase. As the diffusion distance increases, the concentration of Al element gradually decreased. O element exhibits weak diffusion ability on the interface reaction layer and shows the similar concentration changing trend with Ti element. Because almost all of the elements on the interface reaction layer are Ti and Al, except for a very small amount of O element, it can be inferred that the interface reaction layer is mainly composed of Ti-Al intermetallic compound.
As shown in Table 1, the average thickness of Ti-Al2O3 interface reaction layer of samples prepared at different sintering temperatures can be estimated according to SEM images and EDS results of Ti-Al2O3 interface (shown in Figure 2, Figure 3, Figure 4, Figure 5 and Figure 6). It is easy to see that the diffusion distance of Al element to the Ti phase and the thickness of the interface reaction layer increase significantly with increasing sintering temperature.
The analysis of microstructure on the interface reaction layer shows that the densification and associative property of Ti-Al2O3 interface improves with the increases to the sintering temperature. It is noteworthy that when the sintering temperature is 1500 °C, the density of the interface reaction layer declines obviously. It is due to the abnormal grain growth at high temperature, which brings some defects to the Ti phase and pores to the Al2O3 phase.

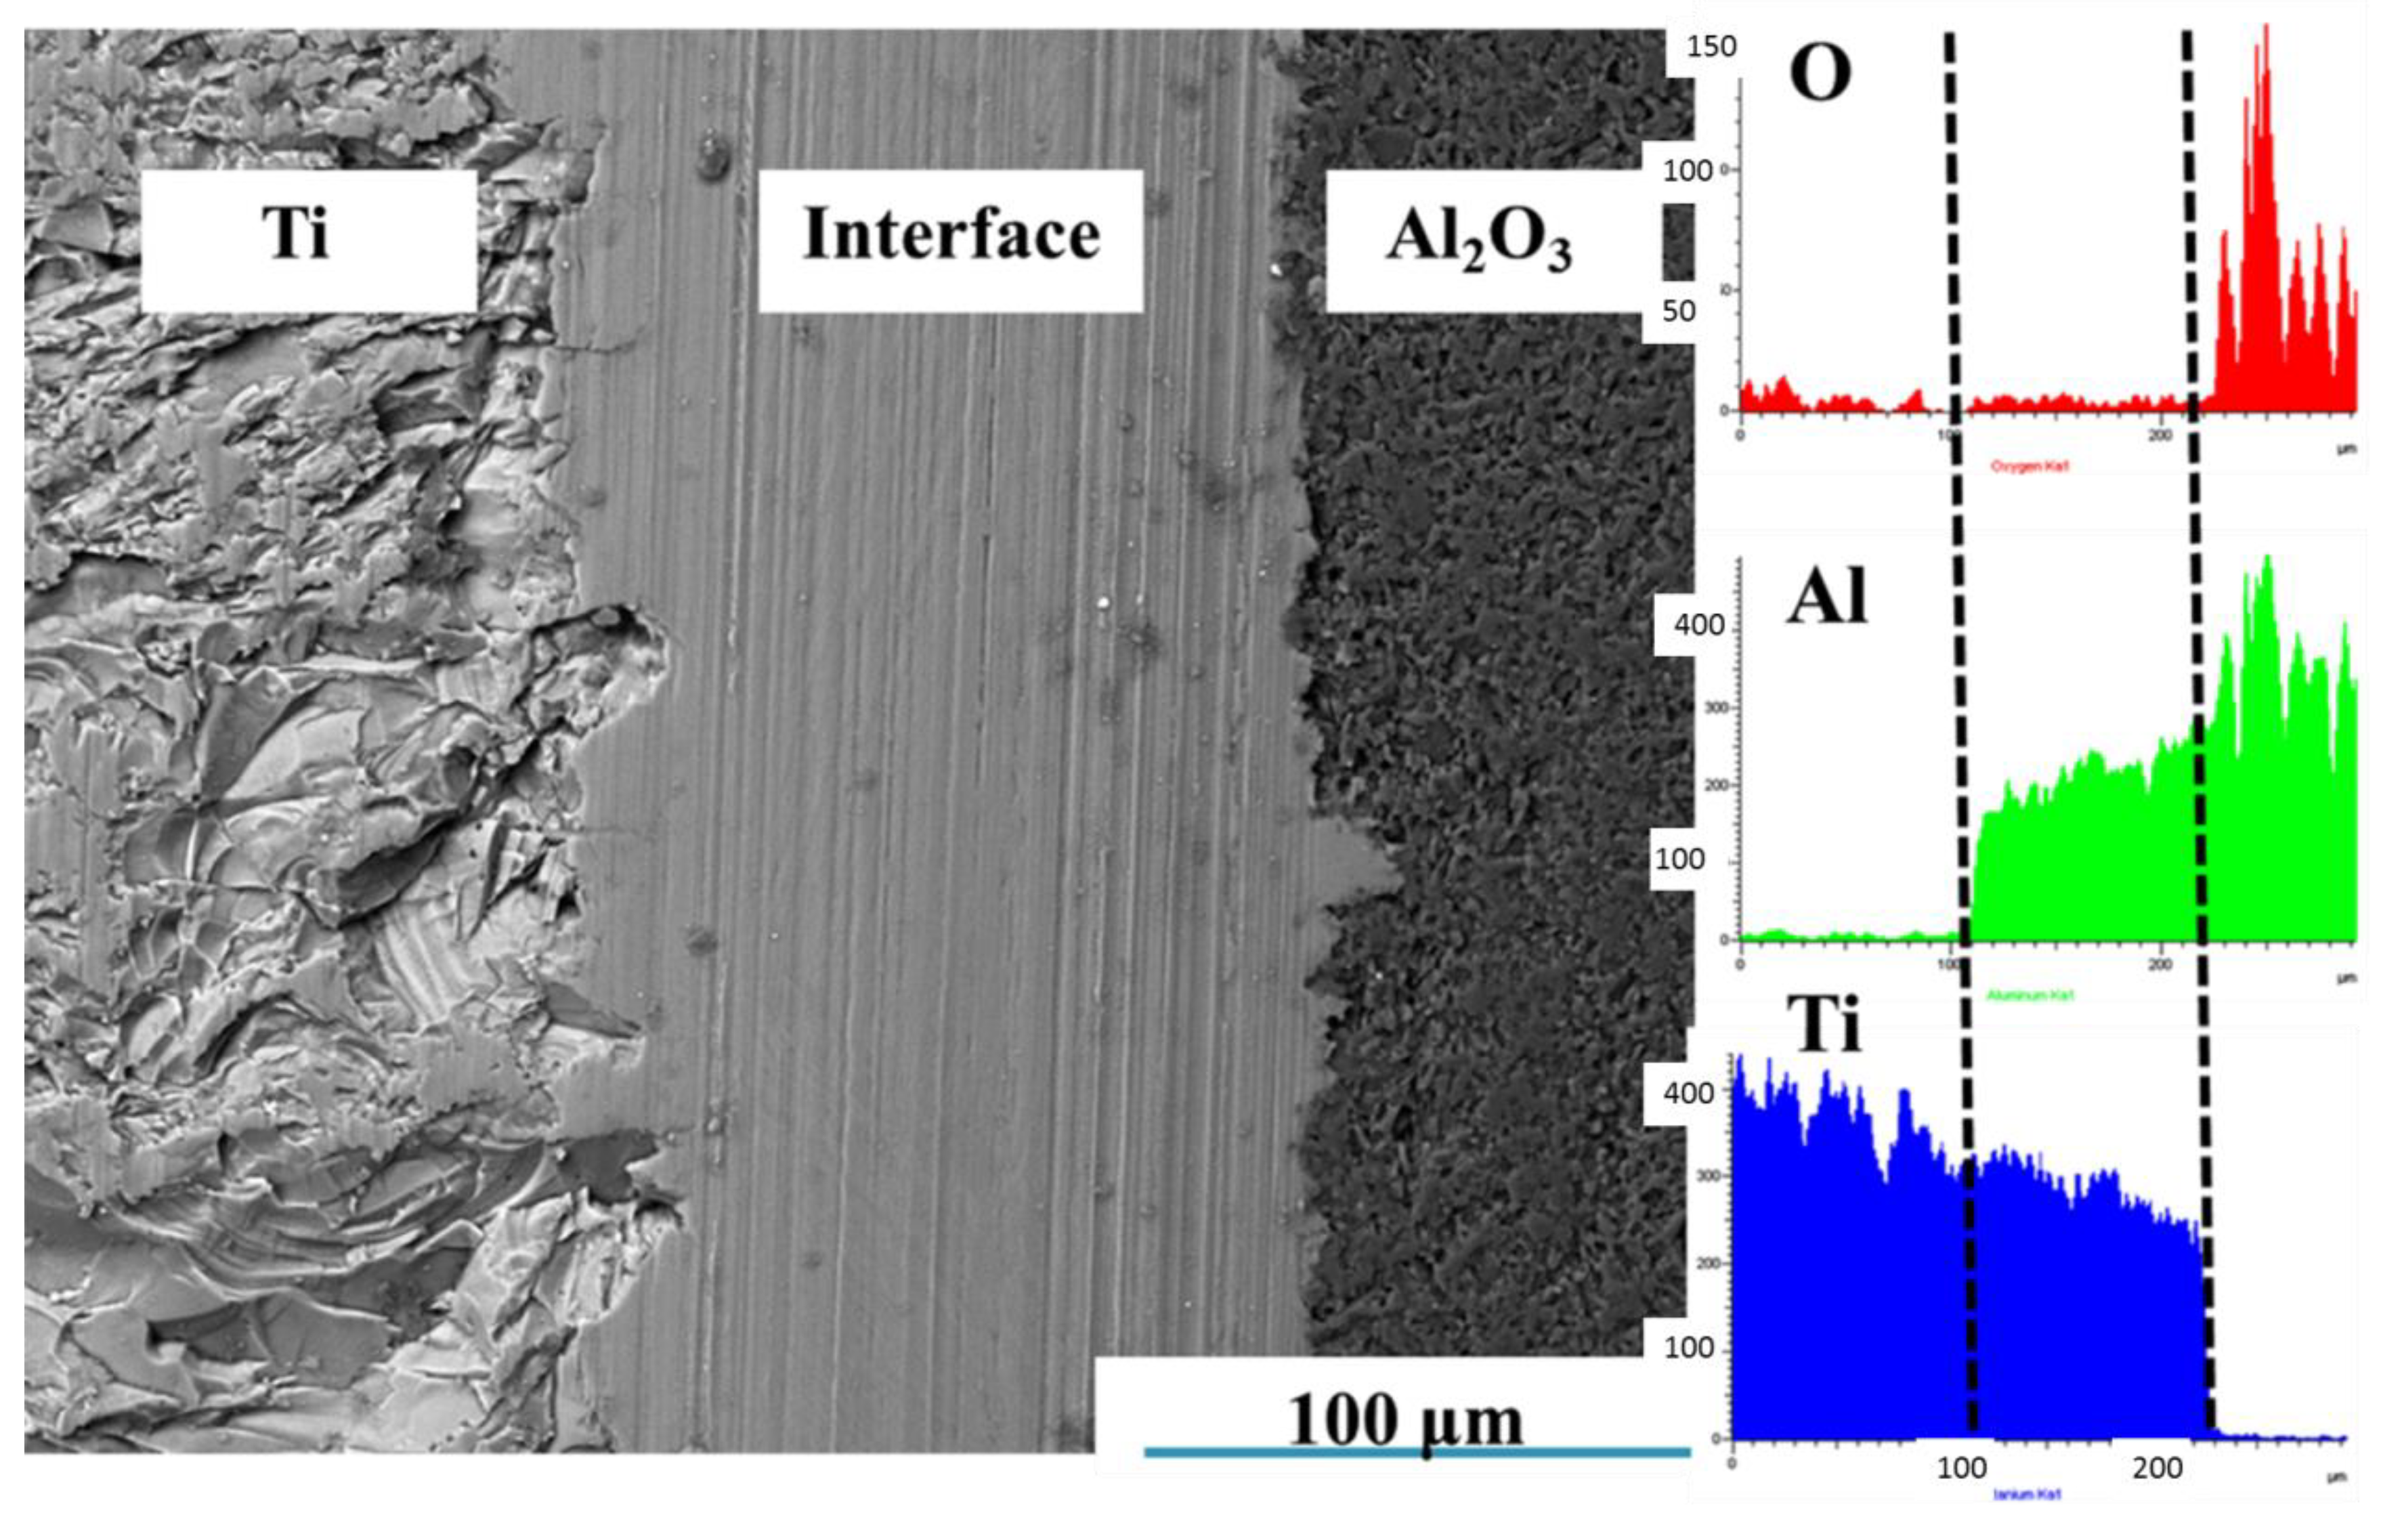
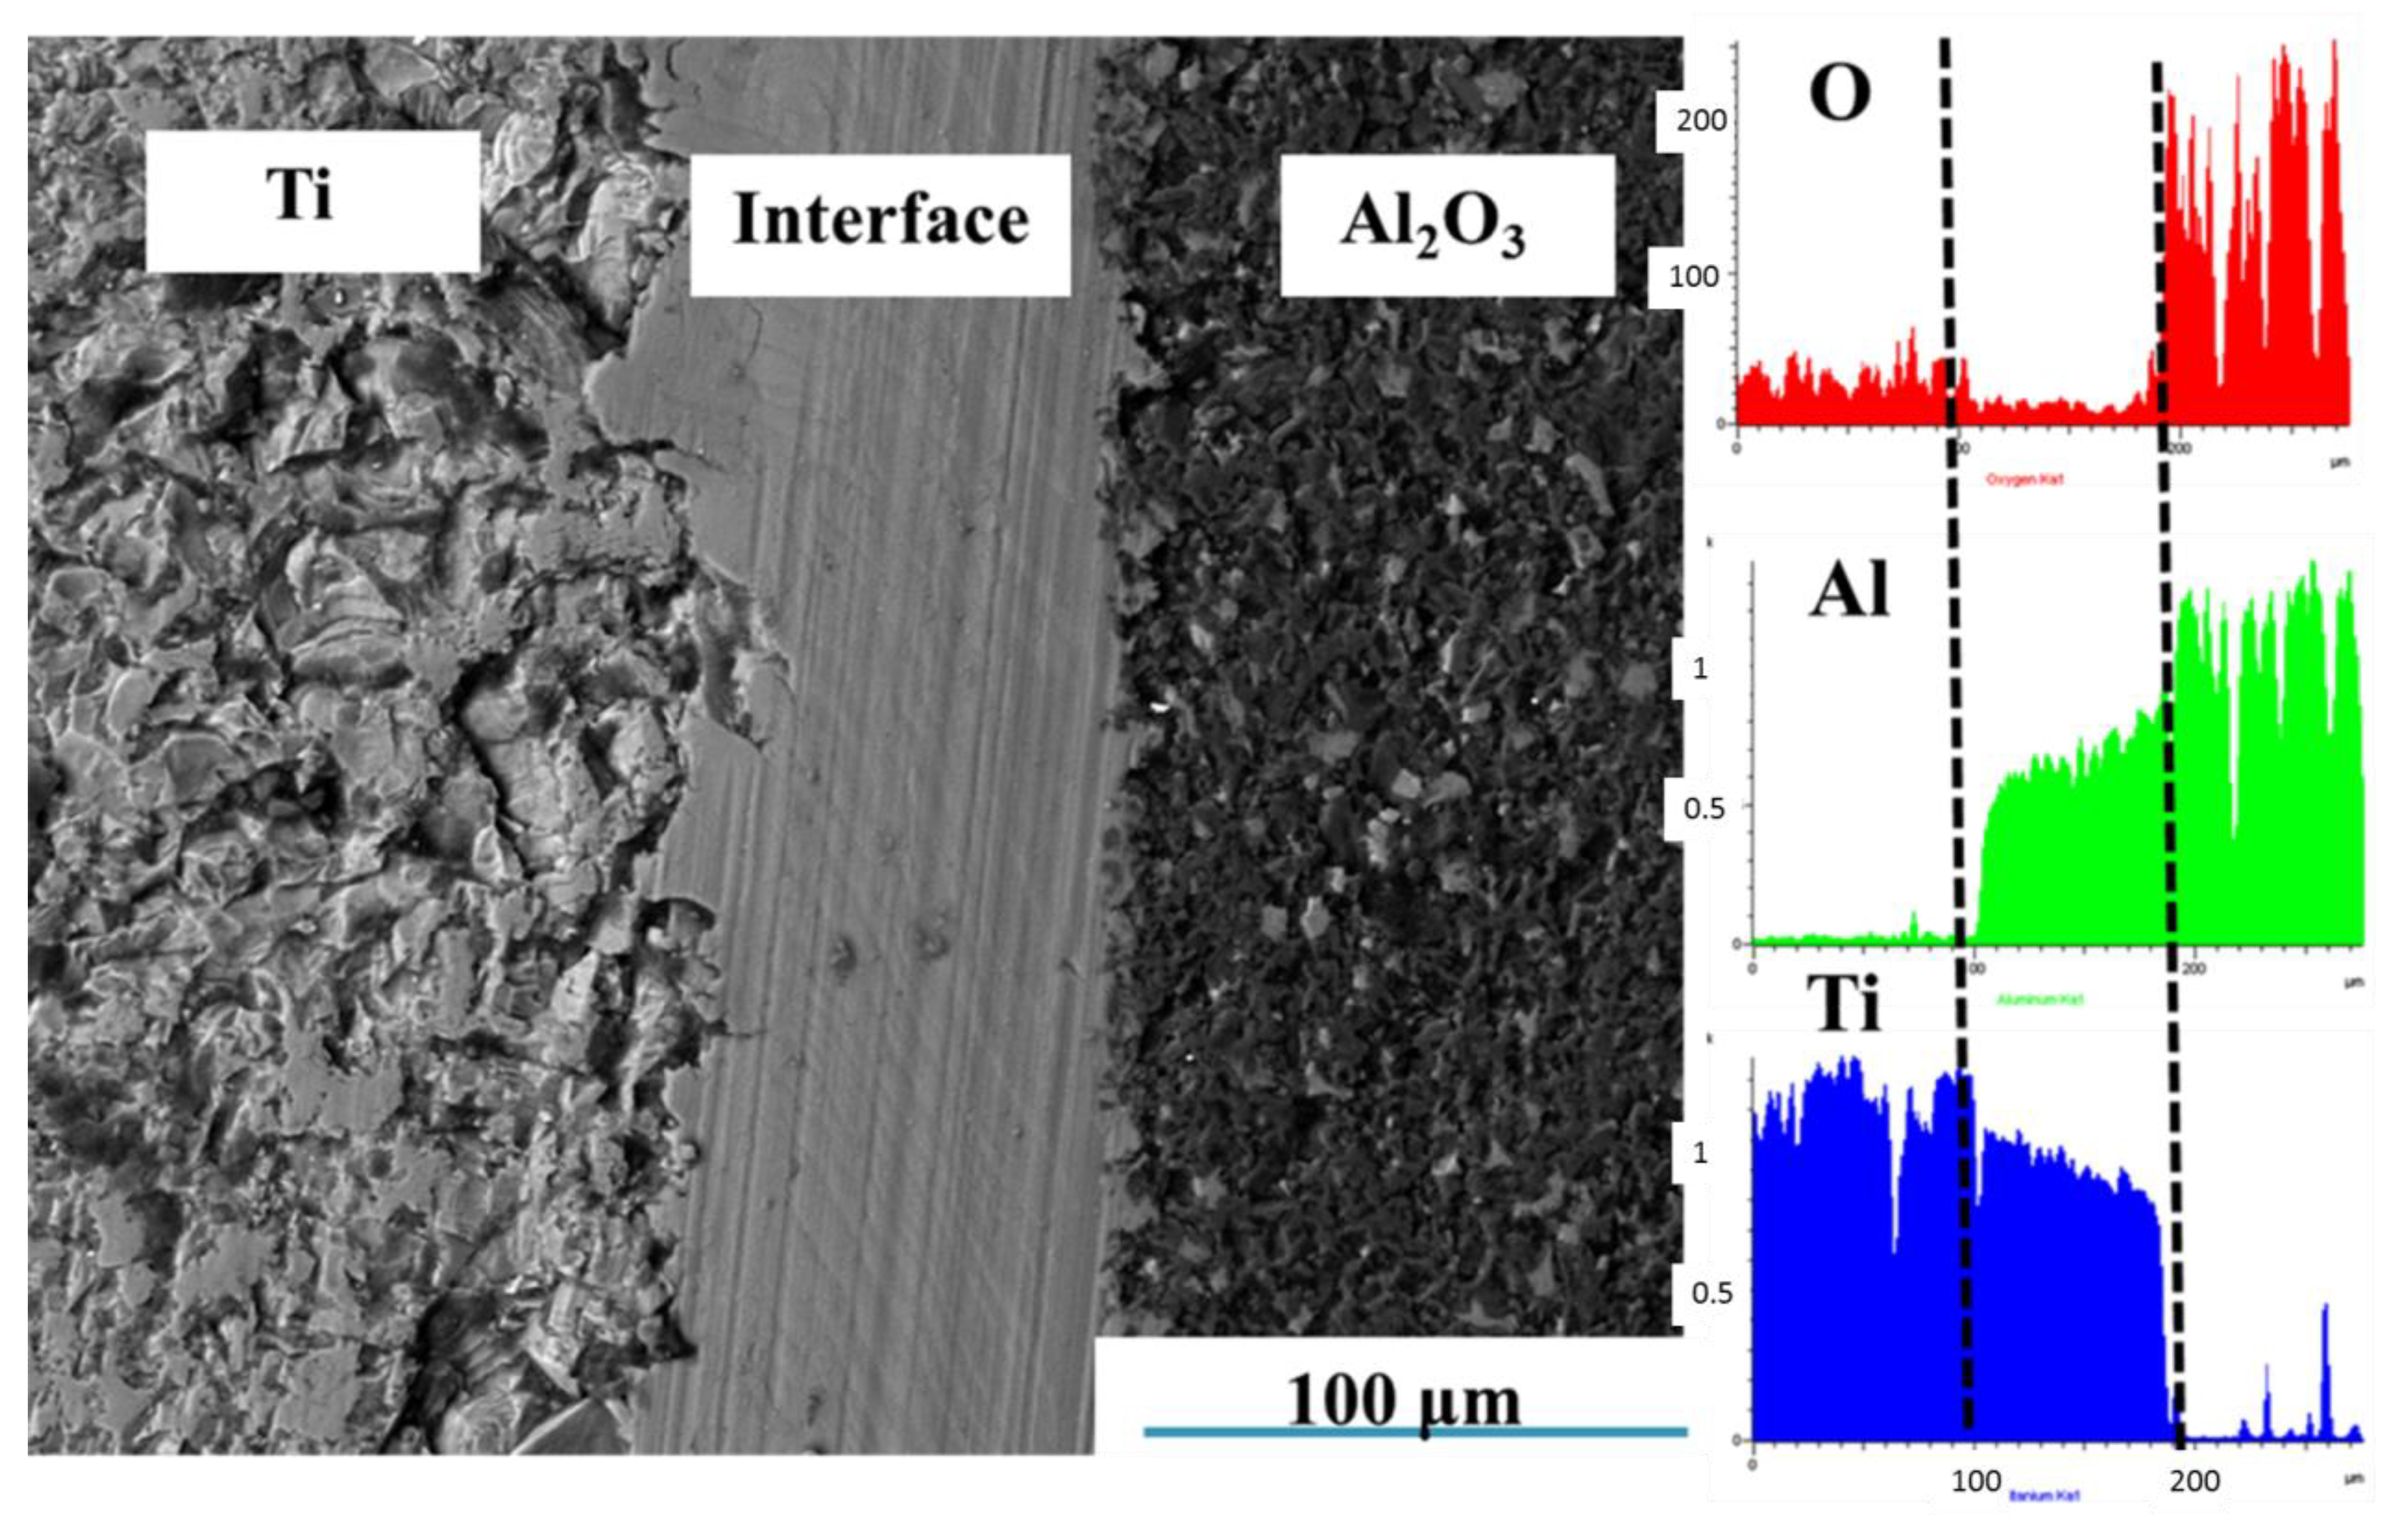
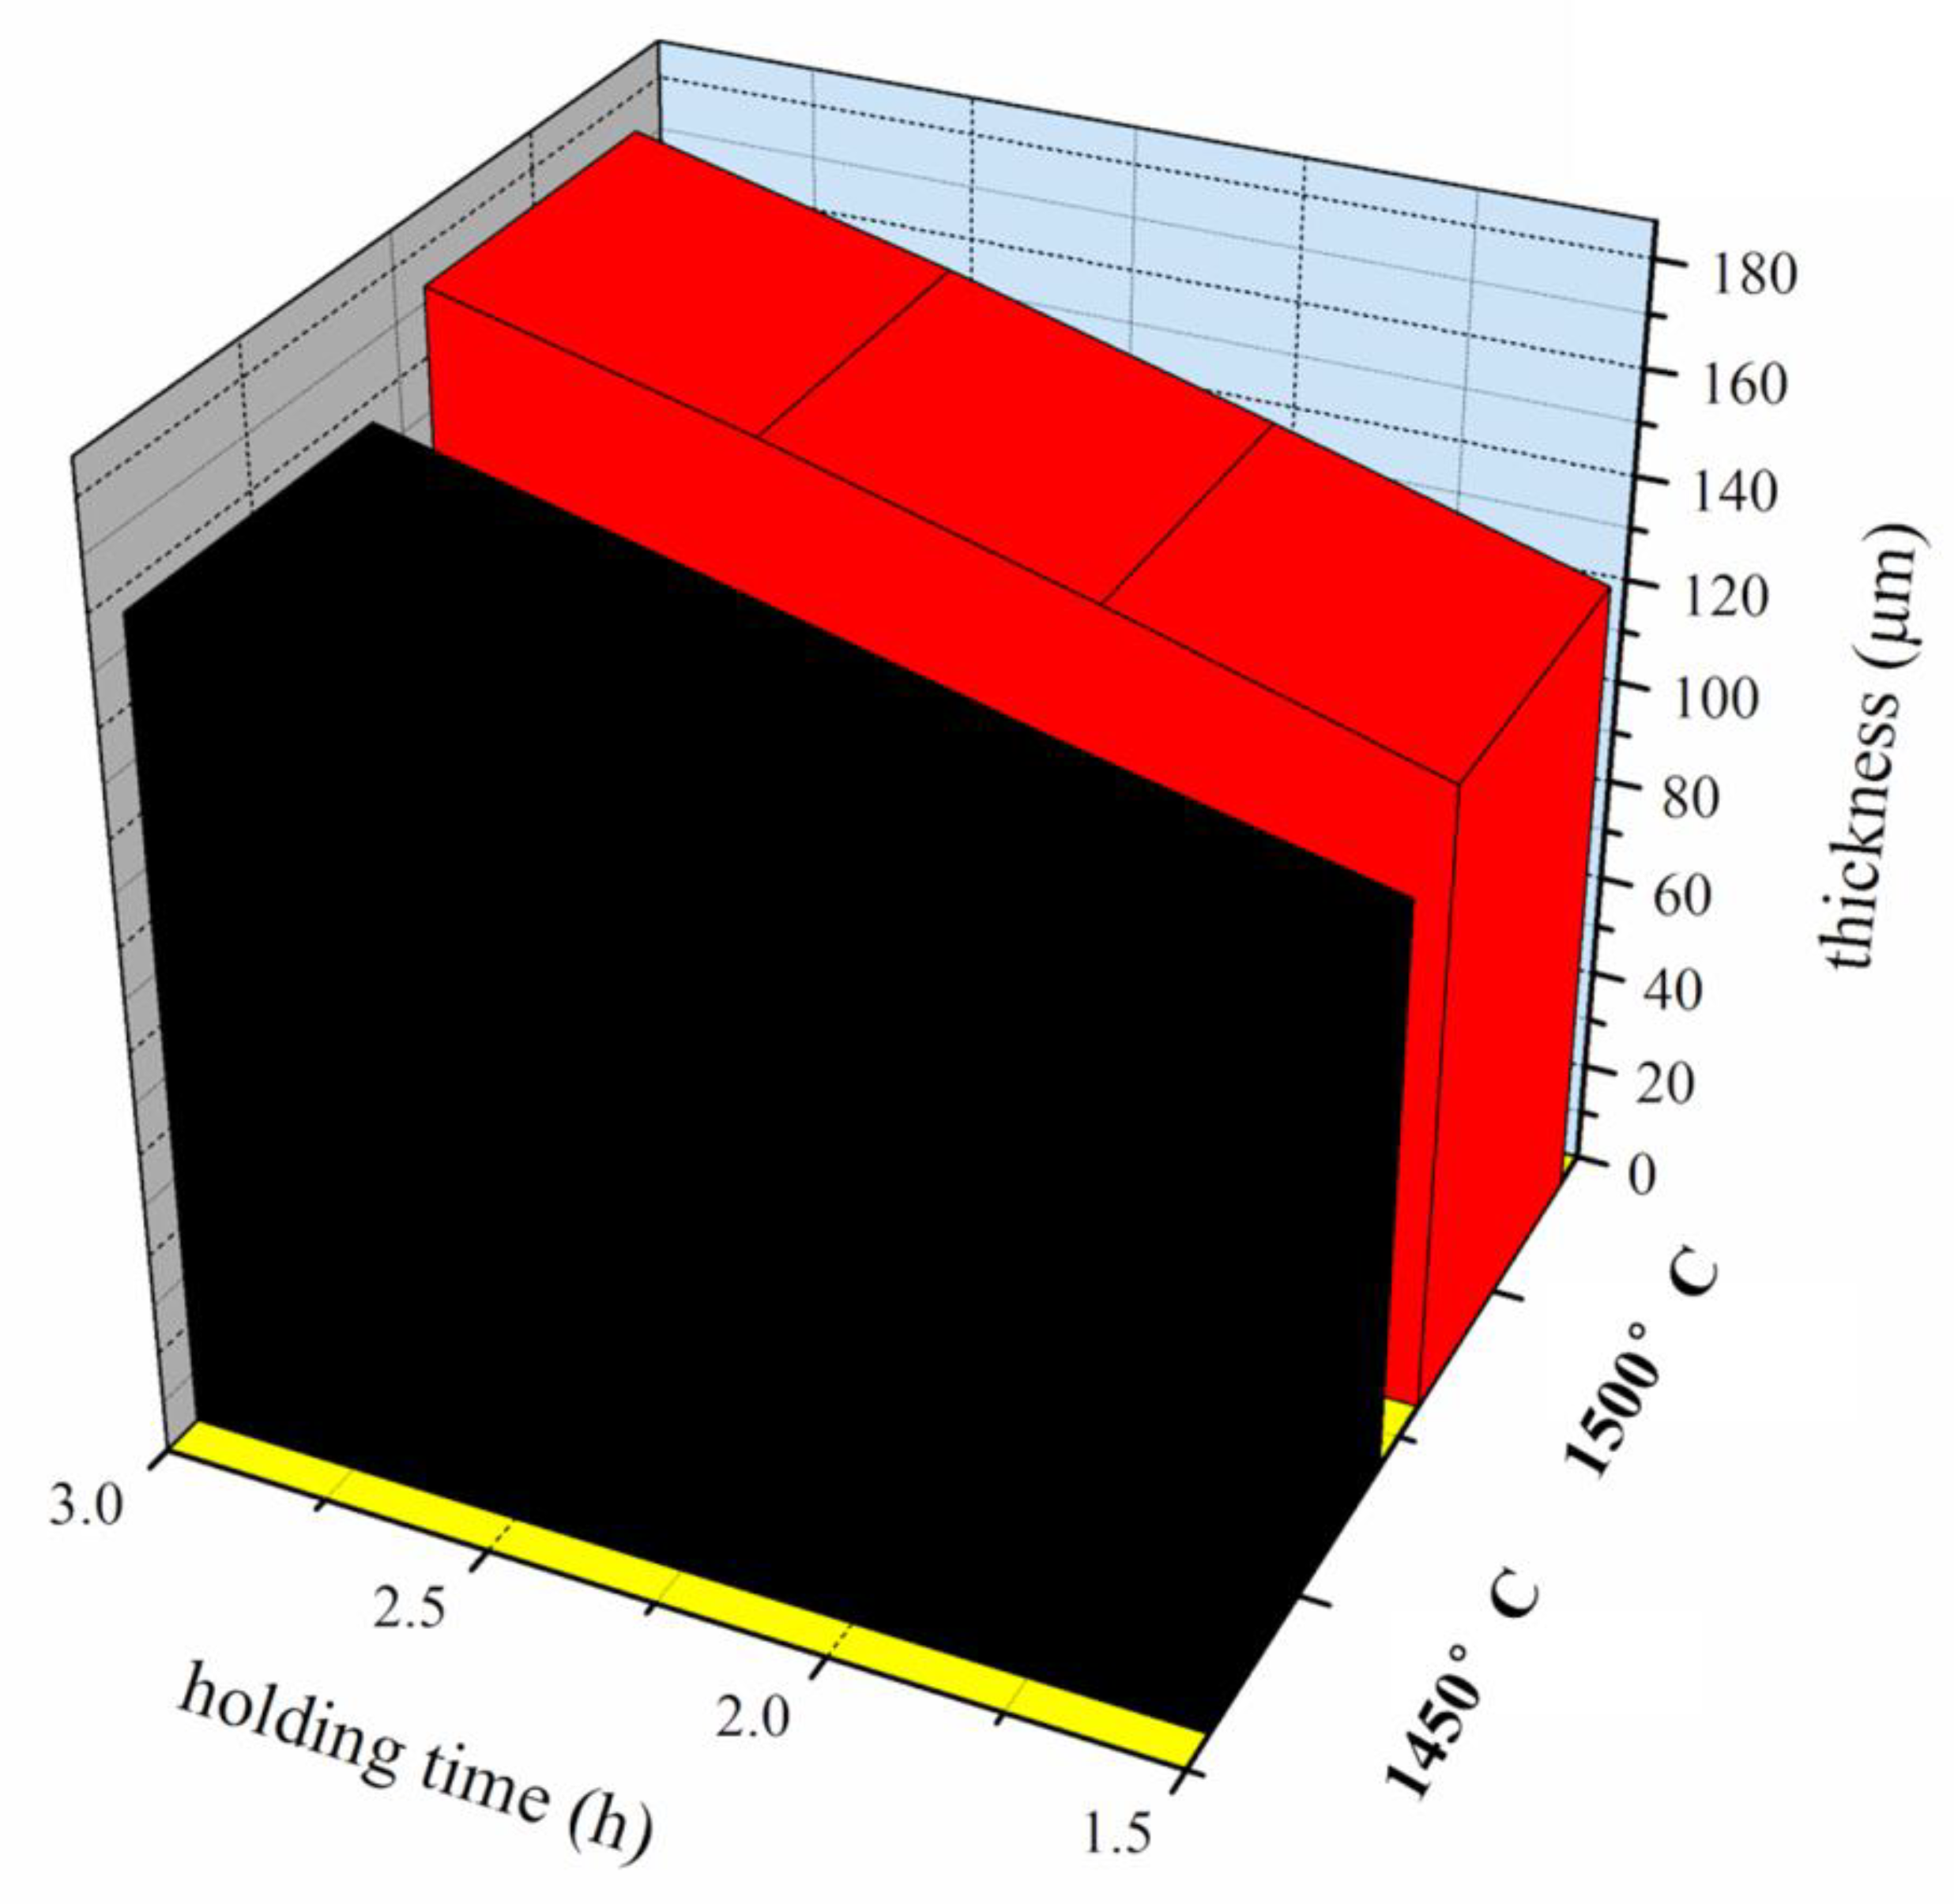
3.1.2. Effects of Holding Time on Microstructure of Ti-Al2O3 Interface Reaction Layer

In order to explore the effects of holding time on the extent of the Ti-Al2O3 interface reaction, the composites sintered at 1450 °C and 1500 °C for 2.5 h, 2 h, and 3 h have been prepared, respectively. SEM images and EDS analysis for the interfaces of Ti/Al2O3 composites sintered at 1450 °C for different holding times were shown in Figure 7, Figure 8 and Figure 9. It can be seen in the figures that the thickness of the interface reaction layer increases with improvements to the holding time. However the microstructure of the interface reaction layer has no significant change. Ti grains grow obviously when the holding time improves to 3 h.
The thickness of the Ti-Al2O3 interface reaction layer of samples prepared at 1450 °C and 1500 °C for different holding times was shown in Table 2. The average thickness of the interface reaction layer and the distance of element diffusion increases gradually along with the improvement to the holding time. It indicates that the reaction of the Ti-Al2O3 interface is promoted by extending the holding time. In addition, the average thickness of the interfacial reaction layer of the Ti-Al2O3 interface in the samples prepared at 1500 °C for different holding times is higher than that in the samples prepared at 1450 °C, which is in accordance with the results in Section 3.1.1.

3.2. Research on the Interface Reaction Kinetic of Ti/Al2O3 Composites

3.2.1. Calculation Method of Diffusion Coefficient

The thicker the reaction layer, the greater the diffusion distance of elements, the greater the reaction degree, and the corresponding element diffusion coefficient and reaction activation energy [16,17,18]. Most diffusions belong to unsteady diffusion processes with varying concentrations over time and can be represented by Fick’s second law [19,20]. According to analysis in Section 3.1, the thickness of reaction layer of Ti-Al2O3 interface increases with increasing sintering temperature and holding time. This phenomenon indicates that element diffusion on the interface changes along with the changes to location and time. This dynamic parameter of the unsteady state diffusion can be represented by the Fick’s second law. The law is shown as following:
C ( d , t ) t = D 2 C d 2 .
where C is element concentration, d is diffusion distance, D is diffusion coefficient, and t is diffusion time.
Assuming that the total number of particles in the crystal is unchanged, the expression of Gauss solutions for diffusion equation of Fick’s second law is as following:
C ( d , t ) = Q 2 π D t exp ( d 2 4 D t ) .
Taking the logarithm on both sides of the equal sign, Equation (2) can be written as follow:
ln C = ln Q 2 π D t d 2 4 D t .
If sintering temperature and holding time is given, ln Q 2 π D t becomes a constant. As a result, the relationship between ln C and d 2 is linear, and the slope can be expressed as tan α = 1 4 D t . Element diffusion coefficient D can be calculated as following equation:
D = 1 4 t tan α .
According to the empirical formula derived from the Fick’s second law, the element diffusion coefficient of the conventional diffusion reaction on solid can be calculated as the following formula [21]:
D = d 2 t .
The calculated value from the empirical Formula (4) is close to that from the Fick’s second law, and the calculating process is simpler. Therefore, the element diffusion coefficient on the interface in this work was calculated by this empirical formula.

3.2.2. Calculation of the Diffusion Coefficient of Every Element on the Interface Layer

Table 3 listed the diffusion coefficient of every element on the interface layer of Ti/Al2O3 composites prepared at different sintering temperatures based on the average thickness of interface reaction layer calculated from Formula (5) and Table 1.
It can be seen from the table above that the diffusion coefficient of Al element at the interface is the largest, indicating that it has the strongest diffusion ability, and the diffusion coefficient increases significantly with the increase of sintering temperature. In contrast, O element shows weak diffusion ability, which is about two orders of magnitude lower than Al element. The diffusion ability of Ti element is the weakest. When the sintering temperature is below 1250 °C, it is hard to observe the diffusion of Ti element, and no significant change was presented with rising temperatures.
Diffusion coefficient of elements at different sintering temperatures was shown in Figure 10. It can be seen from the figure that the diffusion coefficient of Al element is higher than that of O and Ti element. That was because at the high temperature period, Al2O3 will split up the dissociative [Al] and [O], the diffusibility of [Al] is better than [O], therefore major Al enters into the interface. The diffusion coefficient of Al element increases exponentially with increasing sintering temperature. However, the diffusion coefficient of Ti and O element has no obvious change. The diffusion coefficient of O and Ti element at 1350–1500 °C is enlarged as shown in Figure 10b. It can be seen that the diffusion coefficient of O element also increases rapidly with increasing sintering temperatures. The diffusion coefficient of Ti element increases slightly with an inconspicuous trend.

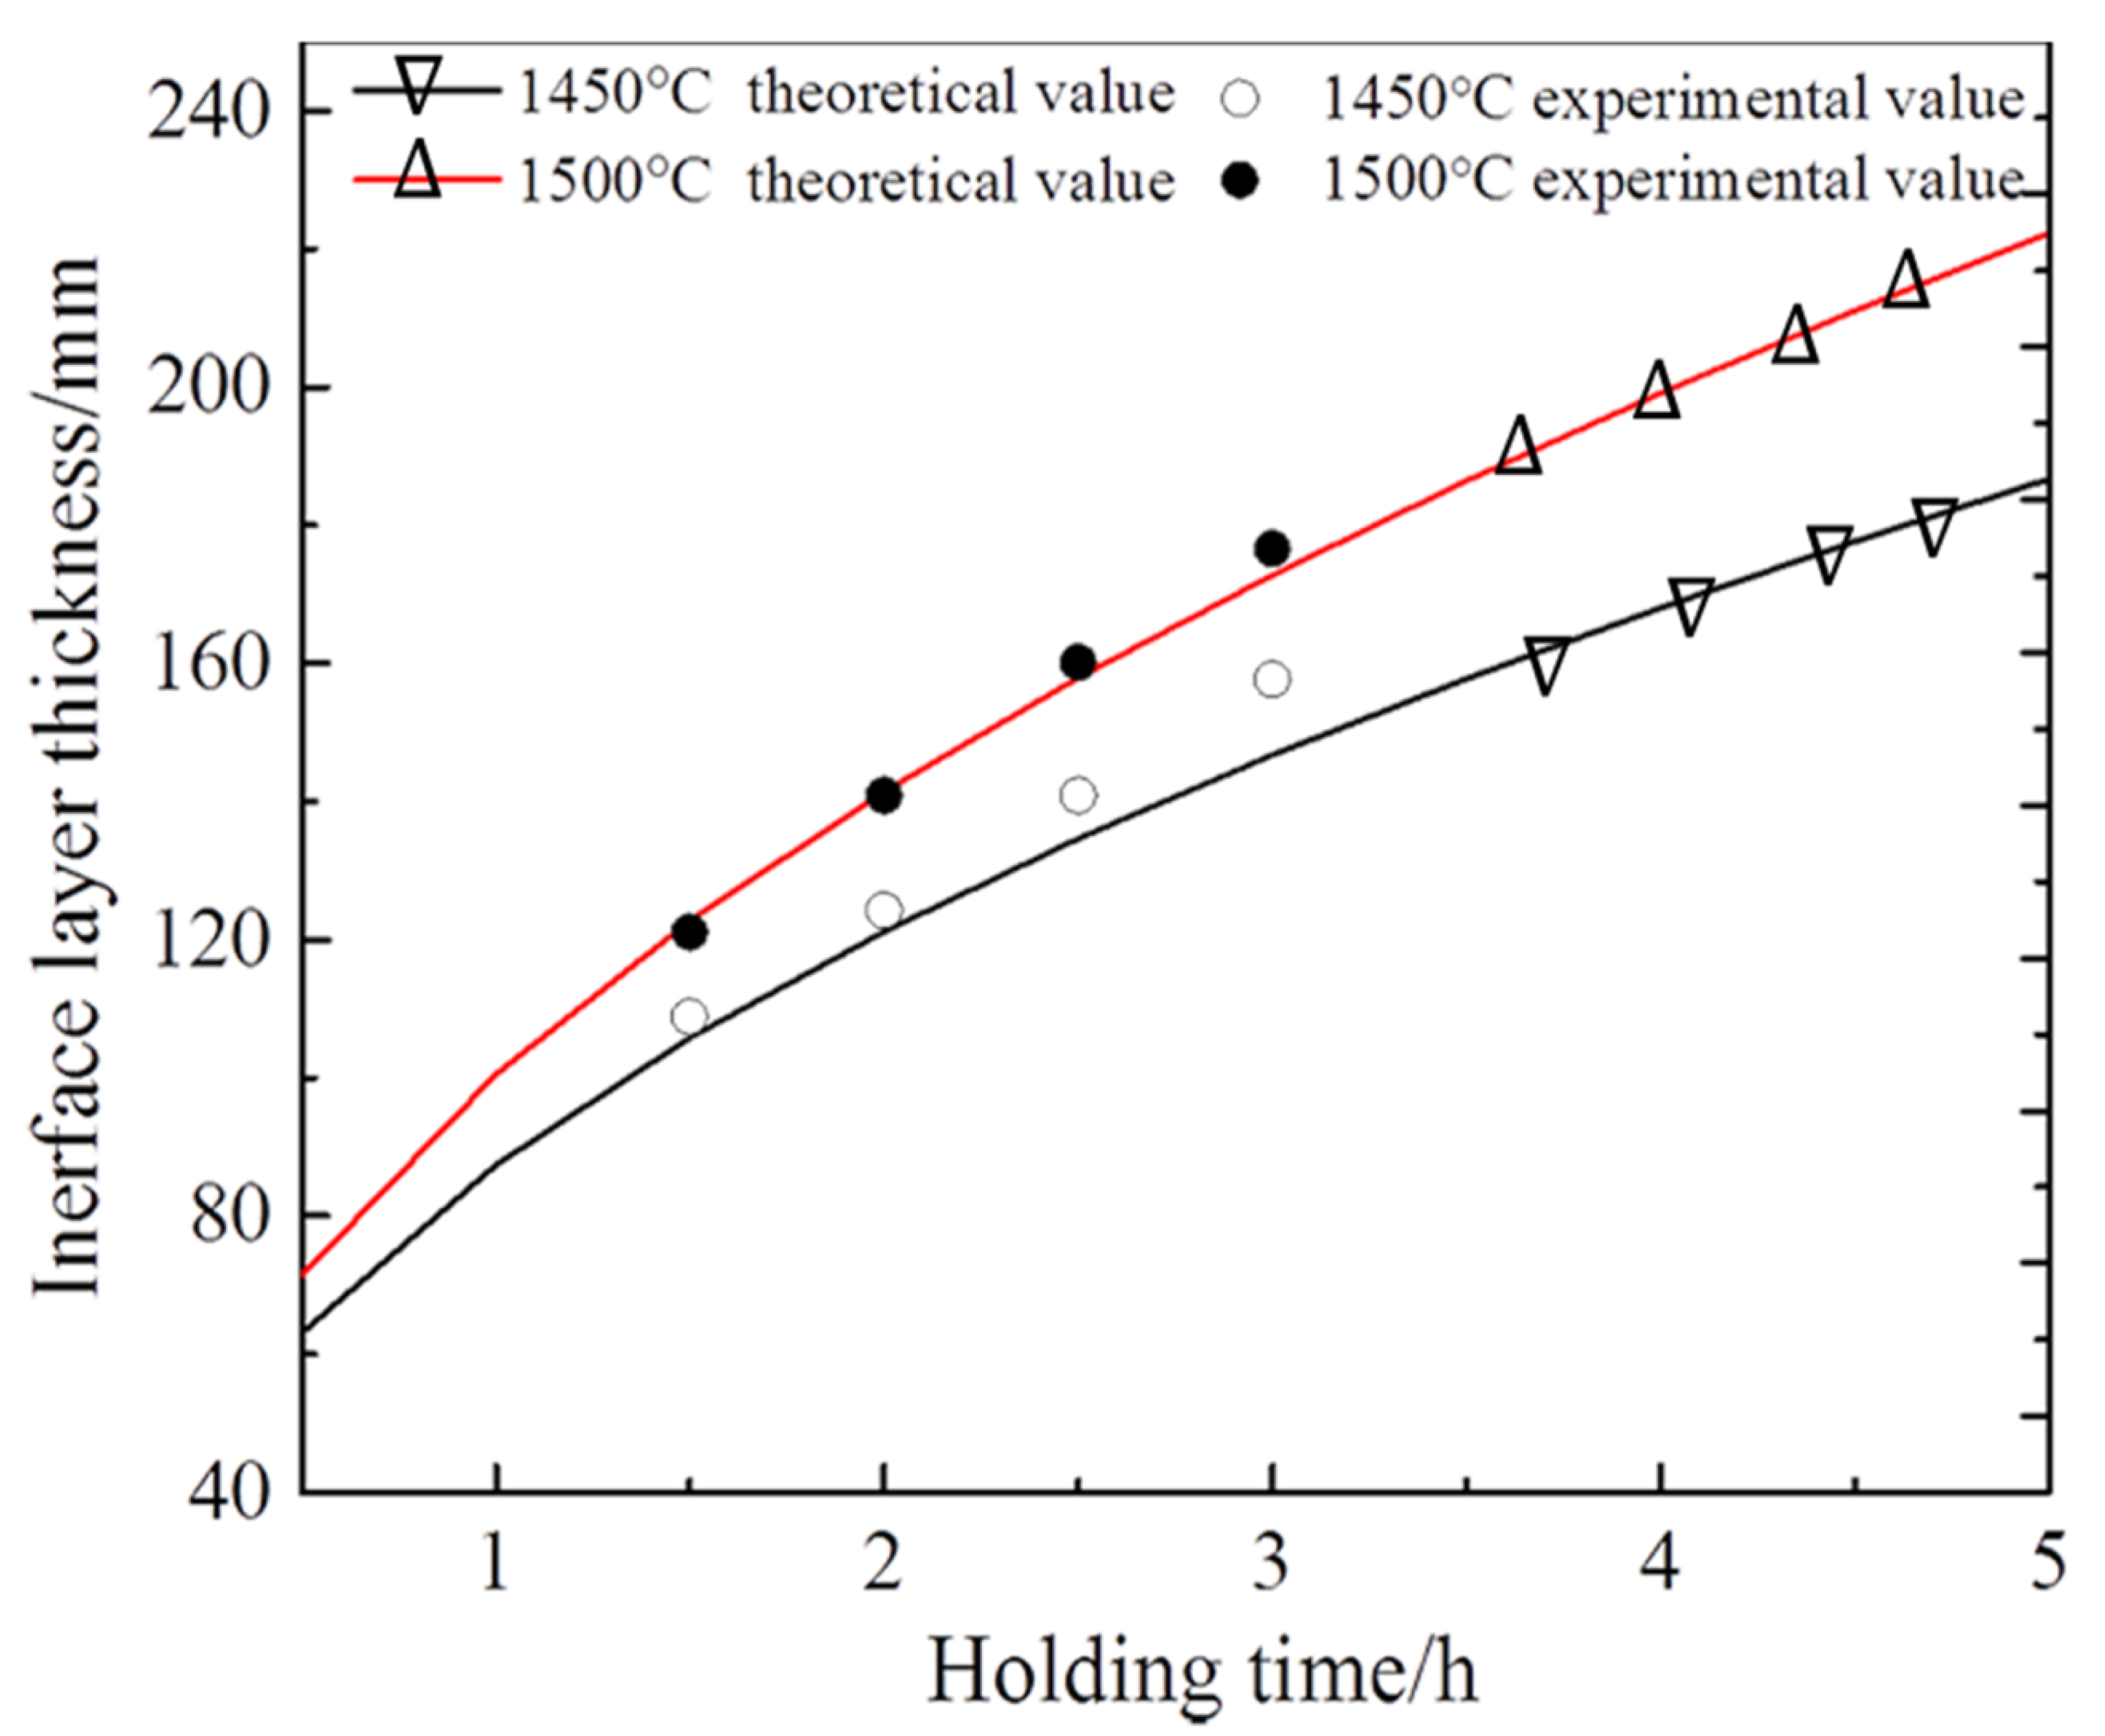
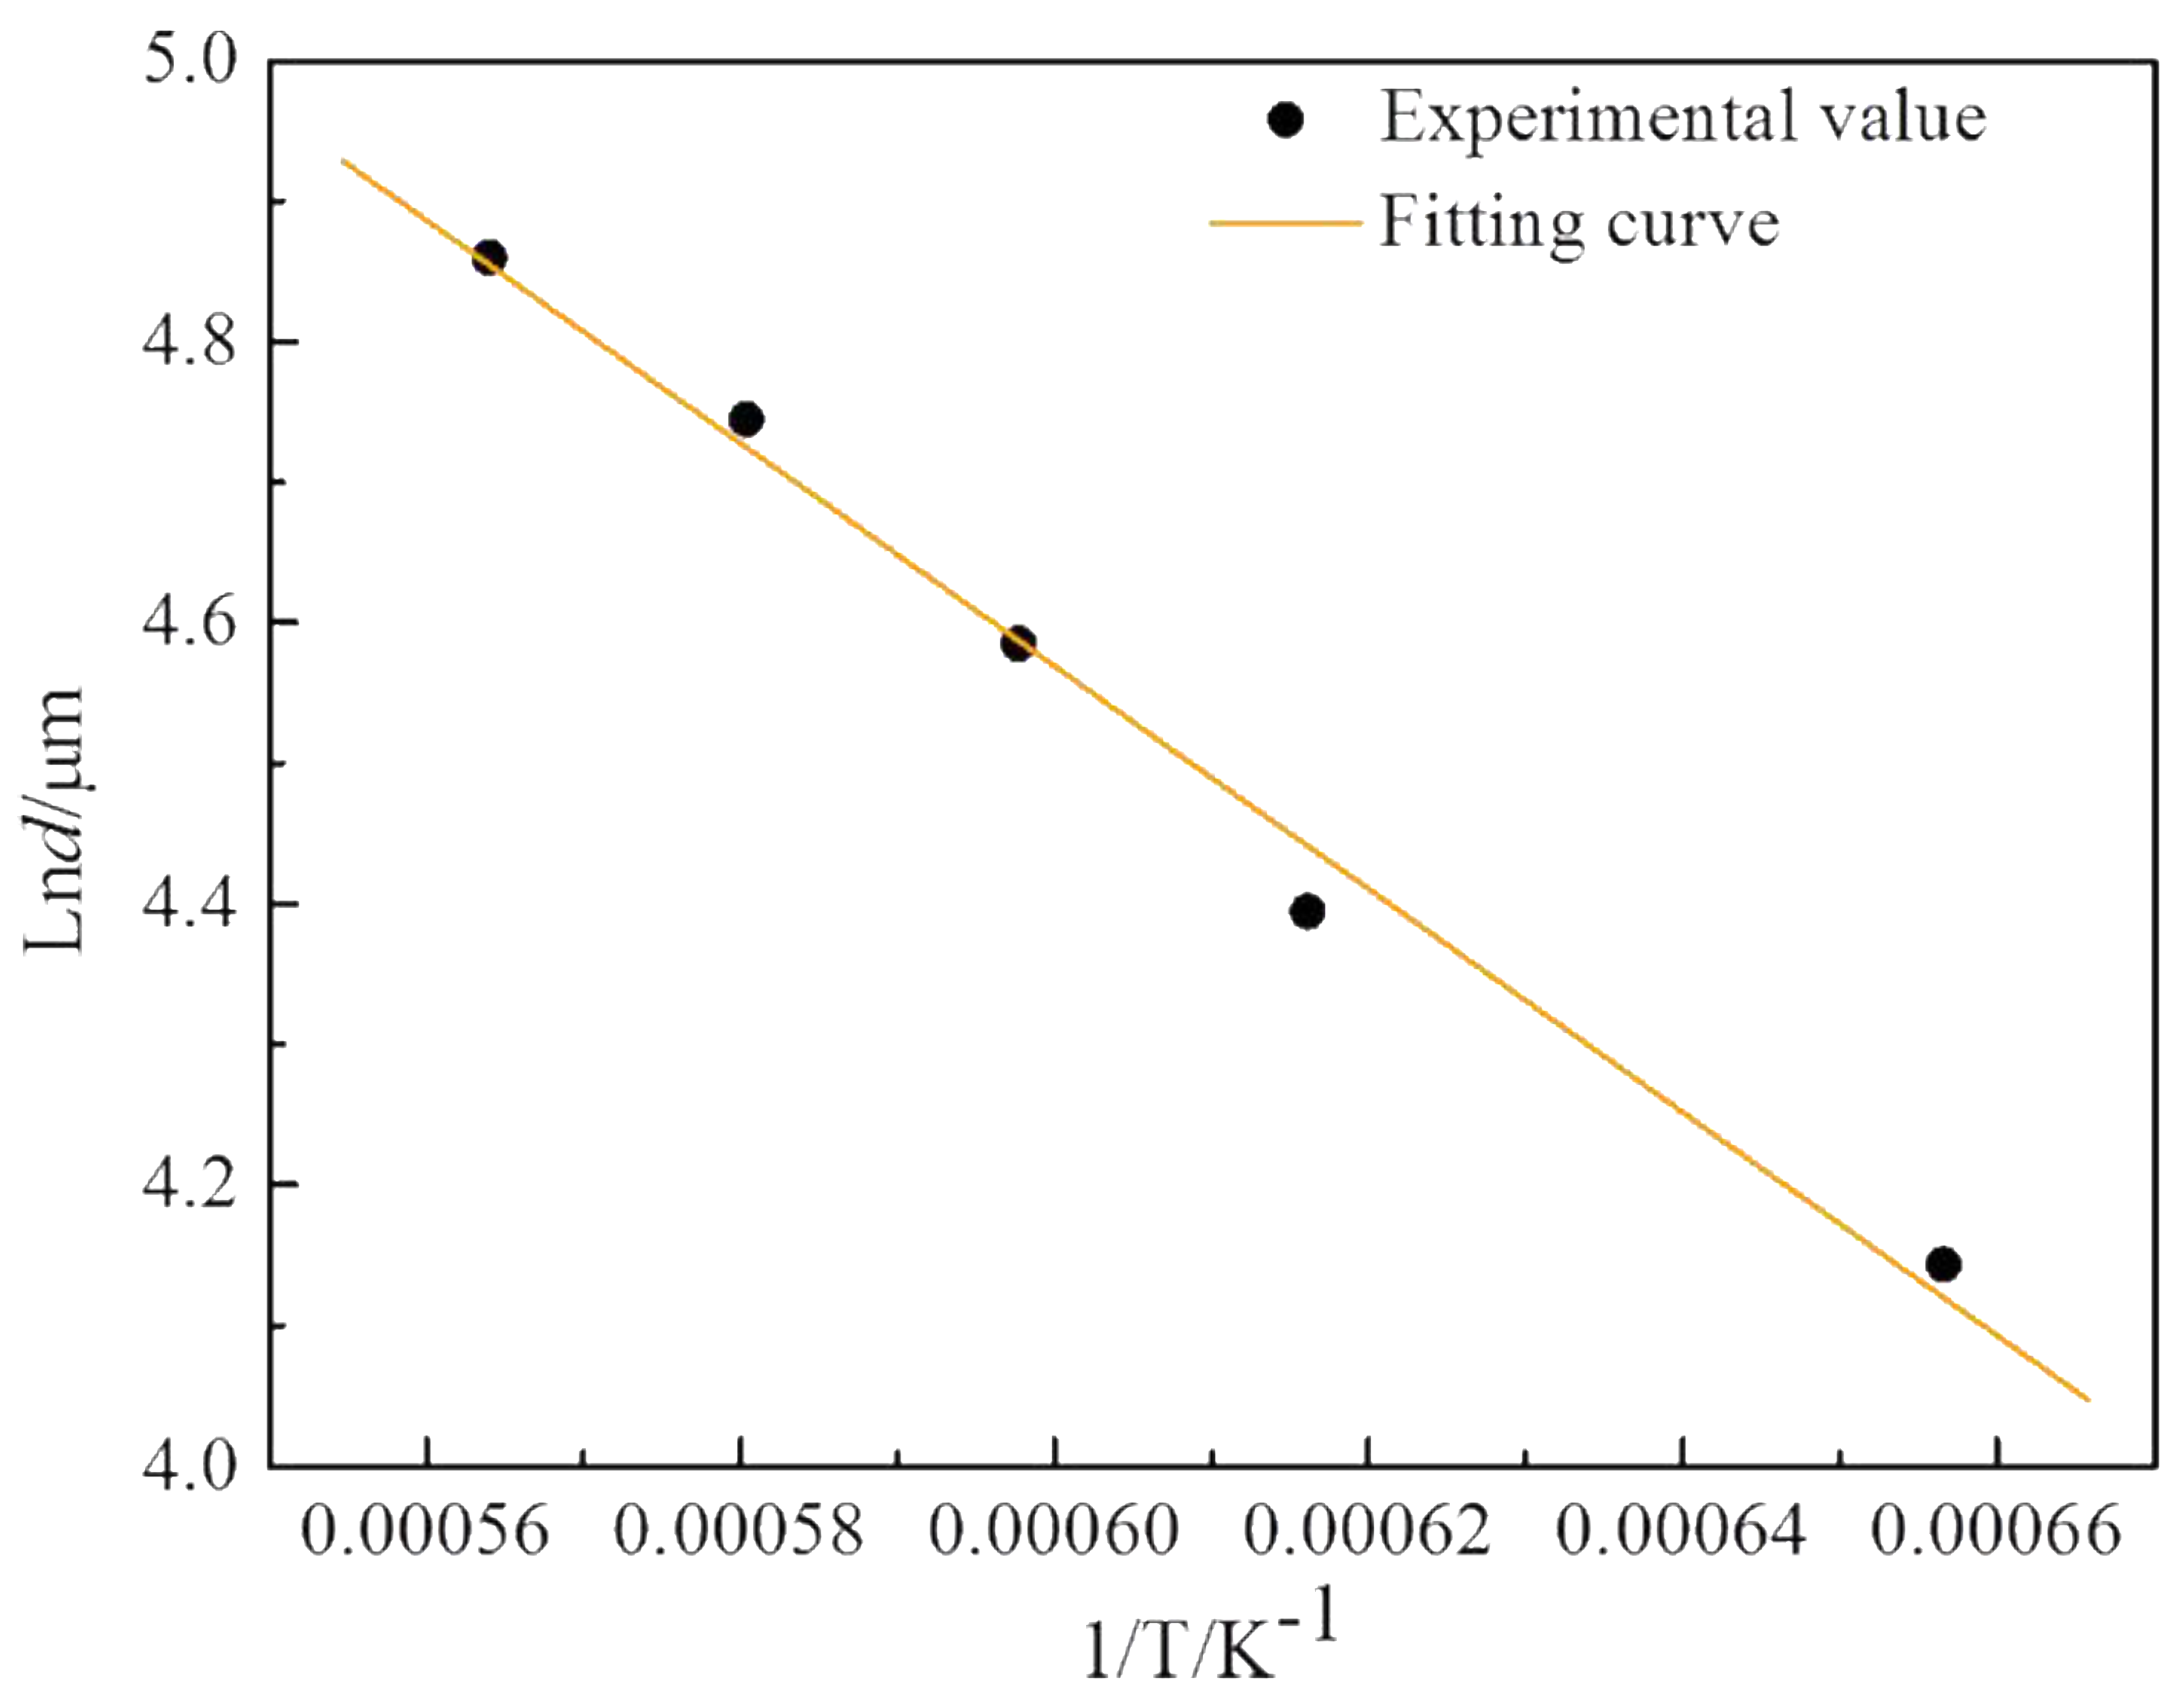
3.2.3. Kinetic Equations of Interface Layer Growth

Reaction kinetics is an important means to study the rate of chemical reaction and its influencing factors. In general, solid phase reaction should always be accompanied by migration of substances. As a typical reaction controlled by interface diffusion, the element diffusion rate on the interface of cermet is determined by the interface reaction rate [22].
The empirical equation explaining the relationship between time and thickness of the reaction layer derived by Fedorov and others, applying to solid phase diffusion reaction determined by diffusion rate, can be used to characterize the interface reaction kinetics of Ti/Al2O3 composites. The expression is as follows [23,24]:
d = K 0 exp ( E / R T ) t n
where d is thickness of interface reaction layer, t is time, K0 is the advance factor, R is the gas constant, E is activation energy of interface reaction, and n is reaction kinetics index.
The results of graphics process to the thickness of interfacial layer with the different sintering temperature and thermal insulation time based on Table 1 and Table 2, are shown in Figure 11 and Figure 12, respectively. It can be seen in the figures that the thickness of the interface reaction layer increases gradually with increasing sintering temperatures at the same holding time. The thickness of the interfacial reaction layer increases with the increase of holding time at the same sintering temperature, but the rate is relatively low. That means the effect of sintering temperatures on the interface reaction layer is more obvious than that of the holding time.
According to Equation (6), the relation of thickness of reaction layer and holding time can be supposed as follows:
d = K t n
where K is a constant of sintering temperature.
Taking the logarithm of both sides of Equation (7), it can be written as follows:
ln d = n ln t + ln K
where the slope of ln d and ln t is the reaction kinetics index n. The data of ln d and ln t at 1450 °C and 1500 °C is linear fitted, setting ln t as abscissa and ln d as ordinate, respectively. The equation fitted based on the data of 1450 °C is as following:
y = 0.47x + 0.61
The equation fitted based on the data of 1500 °C is as following:
y = 0.49x + 0.57
As shown in Figure 13, the relation of thickness of interfacial layer and holding time can be drawn when brings the slope of ln d and ln t , which is the reaction kinetics index n, to the Equation (7). It can be observed from the figure that the theoretical value is in good agreement with the experimental value.
Considering the experimental error, the average value (0.48) of the slope of Equations (9) and (10) was used as the reaction kinetics index n. At the same time, taking into consideration the effect of sintering temperature on the constant of sintering temperature K in Equation (7). Taking the logarithm of both sides of Equation (6) based on the relation of the thickness of reaction layer and time. It can be written as follows:
ln d = E R T + n ln t + ln K 0
It can be seen from Equation (11) that E R is the slope of 1/T, and n ln t + ln K 0 is the intercept. The unknown parameters in Equation (11) can be calculated when linear fits the data of ln d and 1/T at different sintering temperature for 1.5 h. The fitting result is shown in Figure 14, among which ln d is abscissa and 1/T is ordinate. The equation is as follows:
y = −7938.52x + 9.33
According to the fitting result, it can be calculated that E is 6.6 × 10⁴ kJ/mol and K0 is 182.5. When bringing them to Equation (6), kinetic equation of the thickness of interface reaction layer, sintering temperature and holding time can be written as following:
d = 182 . 5 exp   ( 6 . 6 × 10 4 / R T ) t 0 . 48

4. Conclusions

(1) The average thickness of reaction layer of Ti-Al2O3 interface is 63.1 μm at 1250 °C. The degree of densification of the interface and the thickness of the interface reaction layer increase exponentially with the increase of sintering temperature. The average thickness of the reaction layer of Ti-Al2O3 interface reaches 123.4 μm when the sintering temperature is 1500 °C. It can be proved by the diffusion coefficient of each element on the interface calculated by the empirical equation. The diffusion coefficient of Al element is higher than that of O and Ti element. The diffusion coefficient of Al element increases exponentially with the increase of sintering temperature. The interface reaction layer is mainly formed by the diffusion of Al elements.
(2) The relation of the thickness of the interface reaction layer, sintering temperature, and holding time of Ti/Al2O3 composite has been studied. The kinetic equation of the interface reaction of Ti-Al2O3 interface is concluded by linear fitting the data from the experiment. The equation is as follows: d = 182.5exp (−6.6 × 10⁴/RT) t0.48.

Author Contributions

Conceptualization, G.S. and L.Z.; methodology, Z.W.; software, L.Z.; validation, G.S., L.Z. and Z.W.; formal analysis, G.S.; investigation, L.Z.; resources, Z.W.; data curation, L.Z.; writing—original draft preparation, L.Z.; writing—review and editing, G.S.; visualization, Z.W.; supervision, Z.W.; project administration, Z.W.; funding acquisition, Z.W. All authors have read and agreed to the published version of the manuscript.

Funding

National Natural Science Foundation of China Grant No. 51872118. Natural science foundation of shandong province Grant ZR2019MEM055.

Acknowledgments

The authors appreciate the financial support from the National Natural Science Foundation of China under Grant No. 51872118. The authors also appreciate the financial support from under ZR2019MEM055 of Natural science foundation of Shandong province.

Conflicts of Interest

The authors declare no conflict of interest.

References

  1. Yan, S.; Song, G.L.; Li, Z.; Wang, H.; Zheng, D.; Cao, F.; Horynova, M.; Dargusch, M.S.; Zhou, L. A state-of-the-art review on passivation and biofouling of Ti and its alloys in marine environments. J. Mater. Sci. Technol. 2018, 34, 421–435. [Google Scholar] [CrossRef]
  2. Han, G.; Lu, X.; Xia, Q.; Lei, B.; Yan, Y.; Shang, C.J. Face-centered-cubic titanium-A new crystal structure of Ti in a Ti- 8Mo-6Fe alloy. J. Alloys Compd. 2018, 748, 943–952. [Google Scholar] [CrossRef]
  3. Wu, B.T.; Pan, Z.X.; Li, S.Y.; Cuiuri, D.; Ding, D.H.; Li, H.J. The anisotropic corrosion behaviour of wire arc additive manufactured Ti-6Al-4V alloy in 3.5% NaCl solution. Corros. Sci. 2018, 137, 176–183. [Google Scholar] [CrossRef]
  4. Çomaklı, O.; Yazıcı, M.; Yetim, T.; Yetim, A.F.; Çelik, A. Effect of Ti amount on wear and corrosion properties of Ti-doped Al2O3 nanocomposite ceramic coated CP titanium implant material. Ceram. Int. 2018, 44, 7421–7428. [Google Scholar] [CrossRef]
  5. Zhang, L.; Wang, Z.; Wu, J.Y.; Shi, G.P.; Xu, H.Q. Comparison of the homemade and commercial graphene in heightening mechanical properties of Al2O3 ceramic. Ceram. Int. 2017, 43, 2143–2149. [Google Scholar] [CrossRef]
  6. Shi, G.P.; Zhang, L.; Wang, Z.; Li, L.; Zhai, P.; Li, Q.G. Effects of Nb doping on the mechanical properties and interfacial reactions of Ti/Al2O3 composites. Ceram. Int. 2018, 44, 14913–14919. [Google Scholar] [CrossRef]
  7. Guo, X.Y.; Zhang, Y.; Jung, Y.G.; Li, L.; Knapp, J.; Zhang, J. Ideal tensile strength and shear strength of ZrO2(111)/Ni(111) ceramic-metal interface: A first principle study. Mater. Des. 2016, 112, 254–262. [Google Scholar] [CrossRef] [Green Version]
  8. Ali, M.; Knowles, K.M.; Mallinson, P.M.; Fernie, J.A. Microstructural evolution and characterization of interfacial phases in Al2O3/Ag-Cu-Ti/Al2O3 braze joints. Acta Mater. 2015, 96, 143–158. [Google Scholar] [CrossRef]
  9. Feng, S.; Wang, Z.; Shi, G.P.; Ma, Y.; Liu, L.H. Phase Analysis and Mechanical Properties of Ti/Al2O3 Composite Prepared by Hot Pressing. Rare Met. Mater. Eng. 2013, 42, 392–395. [Google Scholar]
  10. Shi, G.P.; Wang, Z.; Liu, H.H.; Wang, C.G. Influence of Y2O3 addition on the Ti/Al2O3 cermets by hot pressing sintering. J. Alloys Compd. 2014, 628, 413–415. [Google Scholar] [CrossRef]
  11. Lu, H.; Bao, C.L.; Shen, D.H.; Zhang, X.J. Study of the Ti/Al2O3 interface. J. Mater. Sci. 1995, 30, 339–346. [Google Scholar] [CrossRef]
  12. Ji, H.X.; Jones, S.; Marquis, P.M. Characterization of the interaction between molten titanium alloy and Al2O3. J. Mater. Sci. 1995, 30, 5617–5620. [Google Scholar] [CrossRef]
  13. Chaug, Y.S.; Chou, N.J.; Kim, H. Interaction of Ti with fused silica and sapphire during metallization. J. Vac. Sci. Technol. 1987, 5, 1288–1292. [Google Scholar] [CrossRef]
  14. Selverian, J.H.; Ohuchi, F.S.; Bortz, M.; Notis, M.R. Interface reactions between titanium thin films and (112) sapphire substrates. J. Mater. Sci. 1991, 26, 6300–6308. [Google Scholar] [CrossRef]
  15. Wu, C.; Wang, Z.; Li, Q.G.; Shi, G.P.; Ma, G.P.Y.; Liu, L.H. Fabrication of laminated Ti/Al2O3 composite by vacuum hot-pressing sintering. J. Ceram. Soc. Jpn. 2014, 122, 222–225. [Google Scholar] [CrossRef] [Green Version]
  16. Liu, M.J.; Wang, Z.; Wu, J.Y.; Li, Q.G. Ti/Al2O3 interfacial diffusion: Kinetic equation for growth of reaction layer and formation mechanism. J. Alloys Compd. 2015, 652, 260–265. [Google Scholar] [CrossRef]
  17. Liu, M.J.; Wang, Z.; Luan, X.W.; Wu, J.Y.; Li, Q.G. Effects of CeO2 and Y2O3 on the interfacial diffusion of Ti/Al2O3 composites. J. Alloys Compd. 2016, 656, 929–935. [Google Scholar] [CrossRef]
  18. Wu, B.H. Research on Reaction Mechanism and Diffusion Reaction Kinetics of Ti/Al. Master’s Thesis, Harbin Institute of Technology, Harbin, China, 5 June 2013. [Google Scholar]
  19. Cui, Y.W.; Xu, G.L.; Chen, Y.; Tang, B.; Li, J.S.; Zhou, L. Computational diffusion kinetics and its applications in study and design of rare metallic materials. Chin. Sci. Bull. 2013, 58, 3680–3691. [Google Scholar] [CrossRef]
  20. Zeng, Y.W. Basic Science of Inorganic Materials; Wuhan University of Technology Press: Wuhan, China, 2011. [Google Scholar]
  21. Zhou, P.Y. Theoretical Mechanics; Science Press: Beijing, China, 2012. [Google Scholar]
  22. Helmut, M. Diffusion in Solids; World Book Publishing House: Beijing, China, 2014. [Google Scholar]
  23. Luo, G.L.; Acoff, V.L. Using cold roll bonding and annealing to process Ti/Al multi-layered composites from elemental foils. Mater. Sci. Eng. A 2004, 379, 164–172. [Google Scholar] [CrossRef]
  24. Yao, W.; Wu, A.P.; Zou, G.S.; Ren, J.L. Formation process of the bonding joint in Ti/Al diffusion bonding. Mater. Sci. Eng. A 2008, 480, 456–463. [Google Scholar]
Figure 1. Schematic diagram of Ti/Al2O3 composite prepared by the powder stacking method.
Metals 10 00259 g001
Figure 2. Scanning electron microscopy (SEM) images and line scanning analysis of the interface at 1250 °C holding for 1.5 h.
Metals 10 00259 g002
Figure 3. SEM images and line scanning analysis of the interface at 1350 °C holding for 1.5 h.
Metals 10 00259 g003
Figure 4. SEM images and line scanning analysis of the interface at 1400 °C holding for 1.5 h.
Metals 10 00259 g004
Figure 5. SEM images and line scanning analysis of interface at 1450 °C holding for 1.5 h.
Metals 10 00259 g005
Figure 6. SEM images and line scanning analysis of the interface at 1500 °C holding for 1.5 h.
Metals 10 00259 g006
Figure 7. SEM images and line scanning analysis of the interface at 1450 °C with a holding time of 2 h.
Metals 10 00259 g007
Figure 8. SEM images and line scanning analysis of the interface at 1450 °C with a holding time of 2.5 h.
Metals 10 00259 g008
Figure 9. SEM images and line scanning analysis of interface at 1450 °C with holding time of 3 h.
Metals 10 00259 g009
Figure 10. Diffusion coefficients of elements at different sintering temperatures: (a) diffusion coefficients of Al, O, Ti; (b) diffusion coefficients of O, Ti.
Metals 10 00259 g010
Figure 11. Relationship between sintering temperature and the interfacial layer thickness.
Metals 10 00259 g011
Figure 12. Relationship between holding time and the interfacial layer thickness.
Metals 10 00259 g012
Figure 13. The relationship between the interface layer thickness and the holding time at different sintering temperatures.
Metals 10 00259 g013
Figure 14. The relationship between ln d and 1/T.
Metals 10 00259 g014
Table 1. Interfacial reaction layer thickness at different sintering temperatures.
Sintering Temperature (°C)Holding Time (h)Average Thickness (μm)
12501.563.1
13501.581.4
14001.598.6
14501.5112.3
15001.5123.4
Table 2. Interface reaction layer thickness at different holding time.
Sintering Temperature (°C)Holding Time (h)Average Thickness (μm)
14501.5112.3
2.0126.2
2.5141.3
3.0156.5
15001.5123.4
2.0141.3
2.5158.7
3.0173.6
Table 3. Elements diffusion coefficient of Ti/Al2O3 composites interface at different sintering temperatures.
Sintering Temperature (°C)DAl (cm2∙s−1)DO (cm2∙s−1)DTi (cm2∙s−1)
12507.37 × 10−94.71 × 10⁻¹¹-
13501.23 × 10−81.85 × 10−101.67 × 10⁻¹¹
14001.80 × 10−83.63 × 10−104.17 × 10⁻¹¹
14502.46 × 10−85.22 × 10−104.62 × 10⁻¹¹
15003.09 × 10−87.07 × 10−104.81 × 10⁻¹¹

