Article

Microstructural Evolution and Mechanical Behavior of an Al-6061 Alloy Processed by Repetitive Corrugation and Straightening

1
Departamento de Ciencia e Ingeniería de Materiales, EEBE-Universitat Politècnica de Catalunya, 08019 Barcelona, Spain
2
Instituto de Investigaciones en Materiales, Universidad Nacional Autónoma de México, Circuito Exterior S/N, Cd. Universitaria, A.P. 70-360, Coyoacán 04360, Ciudad de México, Mexico
3
Instituto de Investigaciones en Metalurgia y Materiales, Universidad Michoacana de San Nicolás de Hidalgo, Edificio U, Av. Francisco Múgica s/n, CU, Morelia 58000, Michoacán, Mexico
4
Laboratoire Procédés et Ingénierie Mécanique et Matériaux, CNRS UMR 8006, ENSAM-CNAM, 151, Bd de l’Hôpital, 75013 Paris, France
*
Author to whom correspondence should be addressed.
Metals 2020, 10(4), 489; https://doi.org/10.3390/met10040489
Submission received: 12 February 2020 / Revised: 3 April 2020 / Accepted: 3 April 2020 / Published: 8 April 2020

Abstract

:
The repetitive corrugation and straightening process is a severe plastic deformation technique that is particularly suited to process metallic sheets. With this technique, it is possible to develop nano/ultrafine-grained structured materials, and therefore, to improve some mechanical properties such as the yield strength, ultimate tensile strength, and fatigue lifetime. In this study, an Al-6061 alloy was subjected to the repetitive corrugation and straightening process. A new corrugation die design was proposed in order to promote a heterogeneous deformation into the metallic sheet. The evolution of the mechanical properties and microstructure obtained by electron backscatter diffraction of the alloy showed a heterogeneous distribution in the grain size at the initial cycles of the repetitive corrugation and straightening process. Uniaxial tensile tests showed a significant increase in yield strength as the number of repetitive corrugation and straightening passes increased. The distribution of the plastic deformation was correlated with the hardness distribution on the surface. The hardness distribution map matched well with the heterogeneous distribution of the plastic deformation obtained by finite element simulation. A maximum average hardness (147 HV) and yield strength (385 MPa) was obtained for two repetitive corrugation and straightening cycles sample.

1. Introduction

The 6xxx series alloys are mainly used in the aircraft and automotive industry due to the good balance between mechanical strength, corrosion properties, and density. The main mechanism for improving the strength of this alloy has been by precipitation hardening [1], but more recently, an alternative way of enhancing the mechanical properties is through the production of an ultrafine grain structure by severe plastic deformation (SPD). Currently, different SPD processes attain a considerable grain refinement, such as equal channel angular pressing (ECAP), high-pressure torsion (HPT), accumulative roll bonding (ARB), repetitive corrugation and straightening (RCS), and constrained groove pressing (CGP) [2,3,4,5]. The ARB, CGP, and RCS are designed for manufacturing sheet-shape ultrafine-grained materials. The ARB process consists of a repetitive procedure of cutting, stacking, and roll bonding between two sheets [5,6]. The CGP and RCS techniques consist in bending and straightening the workpiece without a significant change in the cross-section, the main difference between these techniques is that in the CGP, the dies are designed to constrain the elongation in the transversal or width directions during the pressing, while in the RCS any constraint is permitted. Several Cu and some Al alloys have been processed by RCS, showing an improvement on the mechanical properties due to the grain refinement [7].
Based on early reports, different routes intended to get a homogenous strain in alloys processed by RCS have been reported, but the investigated alloys showed a systematically significant loss of ductility, which limited their application [7]. Thangapandian et al. [8] studied the effect of the corrugation profile on grain refinement in an AA 5083 alloy. Where they compare three different die profiles (semi-circular, flat grooved, and V-grooved). The maximum number of passes was reached with the semi-circular profile (15 passes corresponding to ε ≈ 4.2) before the fracture took place. With the semi-circular profile, the maximum strength was observed after the 6th RCS pass, where the ultimate tensile strength (UTS) and ductility reached 180 MPa and 1.7%, respectively. It worth mentioning that a reduction of 48.5% in the ductility in comparison to the initial condition was observed. Rajinikanth et al. [9] studied the effect of RCS in pure Al and Al-0.25Sc alloy, an increase of Brinell hardness of ~150% and ~67% in the pure Al and Al-0.25Sc alloy, respectively, was observed.
It has been proposed that by means of the generation of a deformation gradient in the microstructure, a combination of high strength and ductility can be achieved. This was done by a confined grain growth of the nanostructure, created by means of the SPD technique [10,11]. For that purpose, Mirab et al. [10] employed a derivation of the RCS process, called repetitive corrugation and straightening by rolling (RCSR), which was developed by Mirsepasi et al. [12]. They reported the production of a non-uniform grain size distribution in pure aluminum, in which the yield strength (YS) increased from 21 MPa to 52 MPa after 1 cycle, reaching the maximum YS of 82 MPa at 8 cycles. It was also reported that the ductility drastically decreased in the first cycle (~17%), but a gradual improvement at 20 cycles was observed, reaching a ductility rather close to that of the annealed condition (~38%) [10].
From the above, the objective of this study was to explore a new die geometry that could improve the severe plastic deformation process in metal sheets. This, with the idea that the generation of a nanostructure could promote better mechanical properties. The effects of the die design in terms of the heterogeneous deformation distribution and a possible loss in ductility for the Al samples was studied. Additionally, the correlation between the mechanical properties and microstructure of the RCS processed material are also discussed.

2. Materials and Methods

Commercial Al-6061 sheets of 0.9 mm in thickness were cut with the following dimensions: 120 mm × 110 mm (Table 1). A solid solution heat treatment at 803 K for two hours was applied, then the sample was water-quenched, followed by an aging treatment at 453 K for 18 h [13]. The employed RCS die-set is based on two intercepting sinusoidal profile and two flat dies made of D2 tool steel. The semicircular profile avoids the stress concentration in comparison to the V-groove profile according to the results obtained by Thangapandian et al. [8]. On the other hand, the sinusoidal profile is clearly smoother than V-groove profile and rather similar to the semicircular profile. Therefore, it is thought that such a profile introduces less stress concentration points (Figure 1a). The RCS process was carried out with a 10-ton hydraulic press at room temperature with a pressing speed of 1 mm/min. The processing route that defines a cycle consists of two corrugation passes and two straightening passes, with a rotation of 90 degrees (along the normal direction) between each pass (Figure 1b) and a rotation of 180 degrees (along the reference direction) between each cycle. With 180 degrees rotation, a higher deformation without fracture was achieved, this is due to the alternation between the tensile and compressive stress on the upper surface. The material was successfully processed up to four-cycles (ε ≈ 3); for further cycles, the material presented fracture. The RCS specimens showed X-shaped groove marks on the surface, these kind of marks are characteristic of the process. They cannot be neglected, as they might have a negative effect on the material surface smoothness. This process was discussed in detail in reference [14].
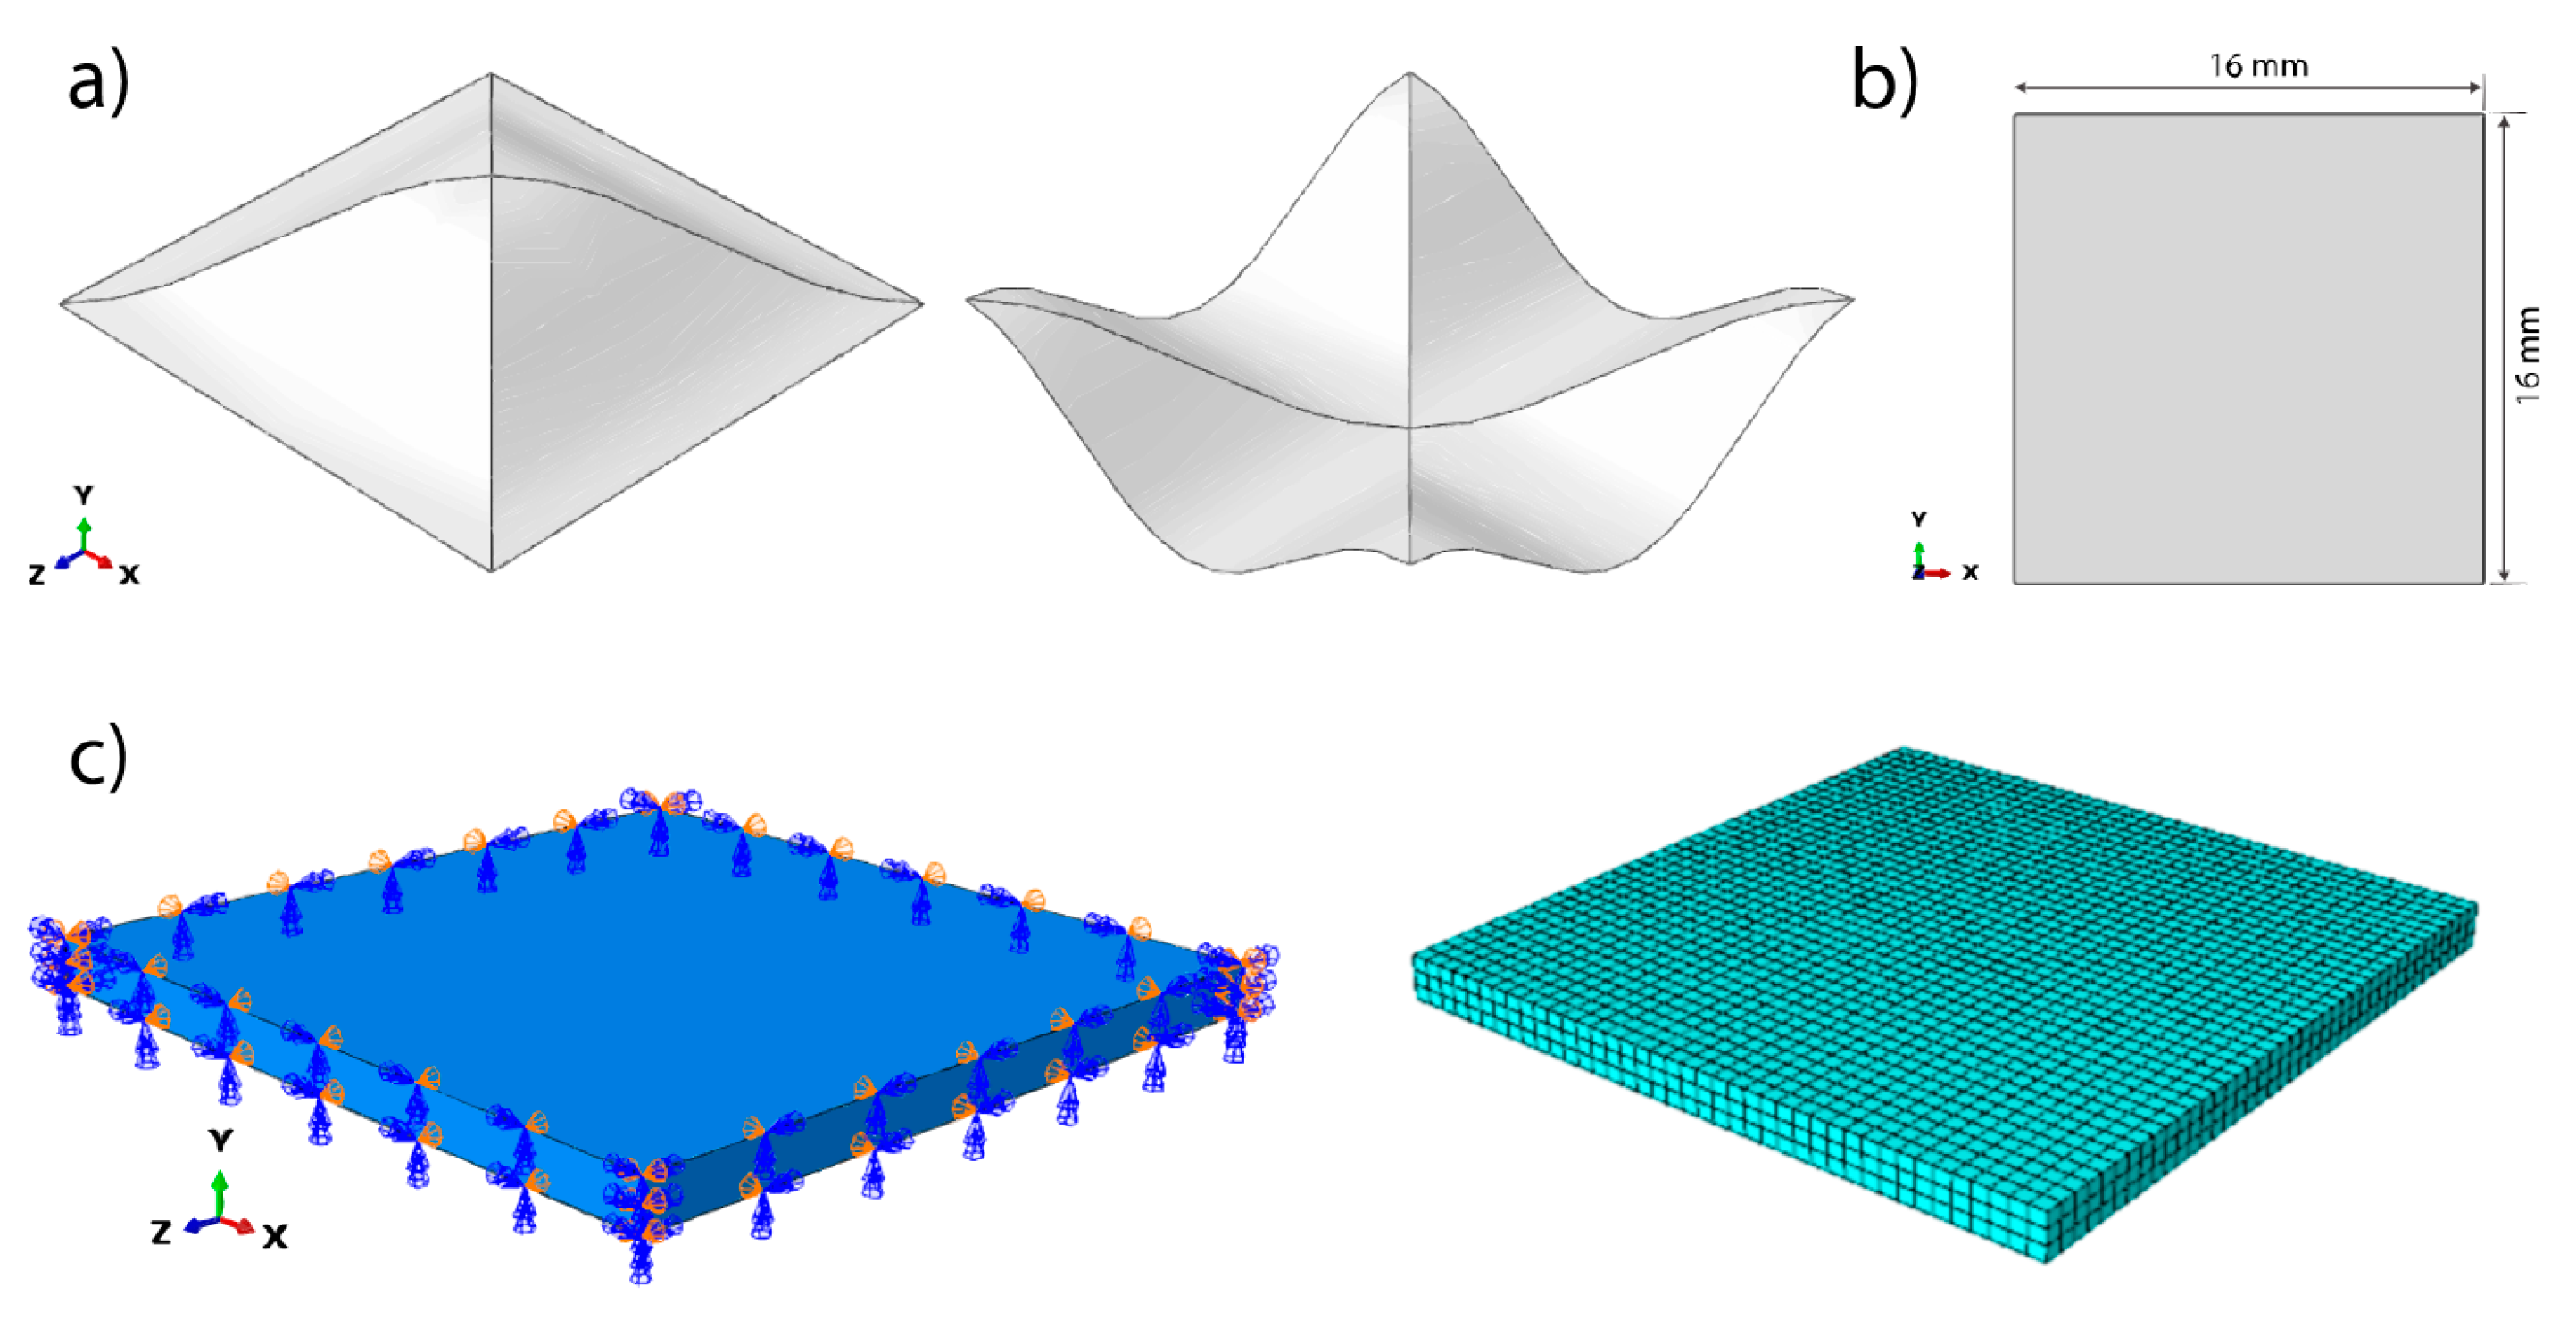
Each cycle of the RCS process introduces an effective strain to the sample equal to 0.8 in the most deformed zones; this was calculated by finite element simulation in Abaqus/Explicit (Figure 2). In this model, the corrugation and flattening dies were considered discrete rigid and the sample deformable. For the workpiece symmetry, XSYMM and ZSYMM restrictions were applied, as is shown in Figure 2c. The dimensions of the modelled metal sheet were 16 × 16 × 0.9 mm3. The material properties were considered as elasto-plastic. The constitutive relation used to model the plastic behavior of the material in the simulation was the Hollomon equation (σ = 445 × ε0.069). For the simulation, values used for the density, Young modulus, and Poisson’s ratio were 2.7 g/cm3, 70 GPa, and 0.33, respectively. The friction coefficient between the dies and the sample was 0.6, with a tangential behavior. The C3D8R and R3D4 elements in 3D stress state were used for the sample and die, respectively. The material mesh element size was 0.3 mm.
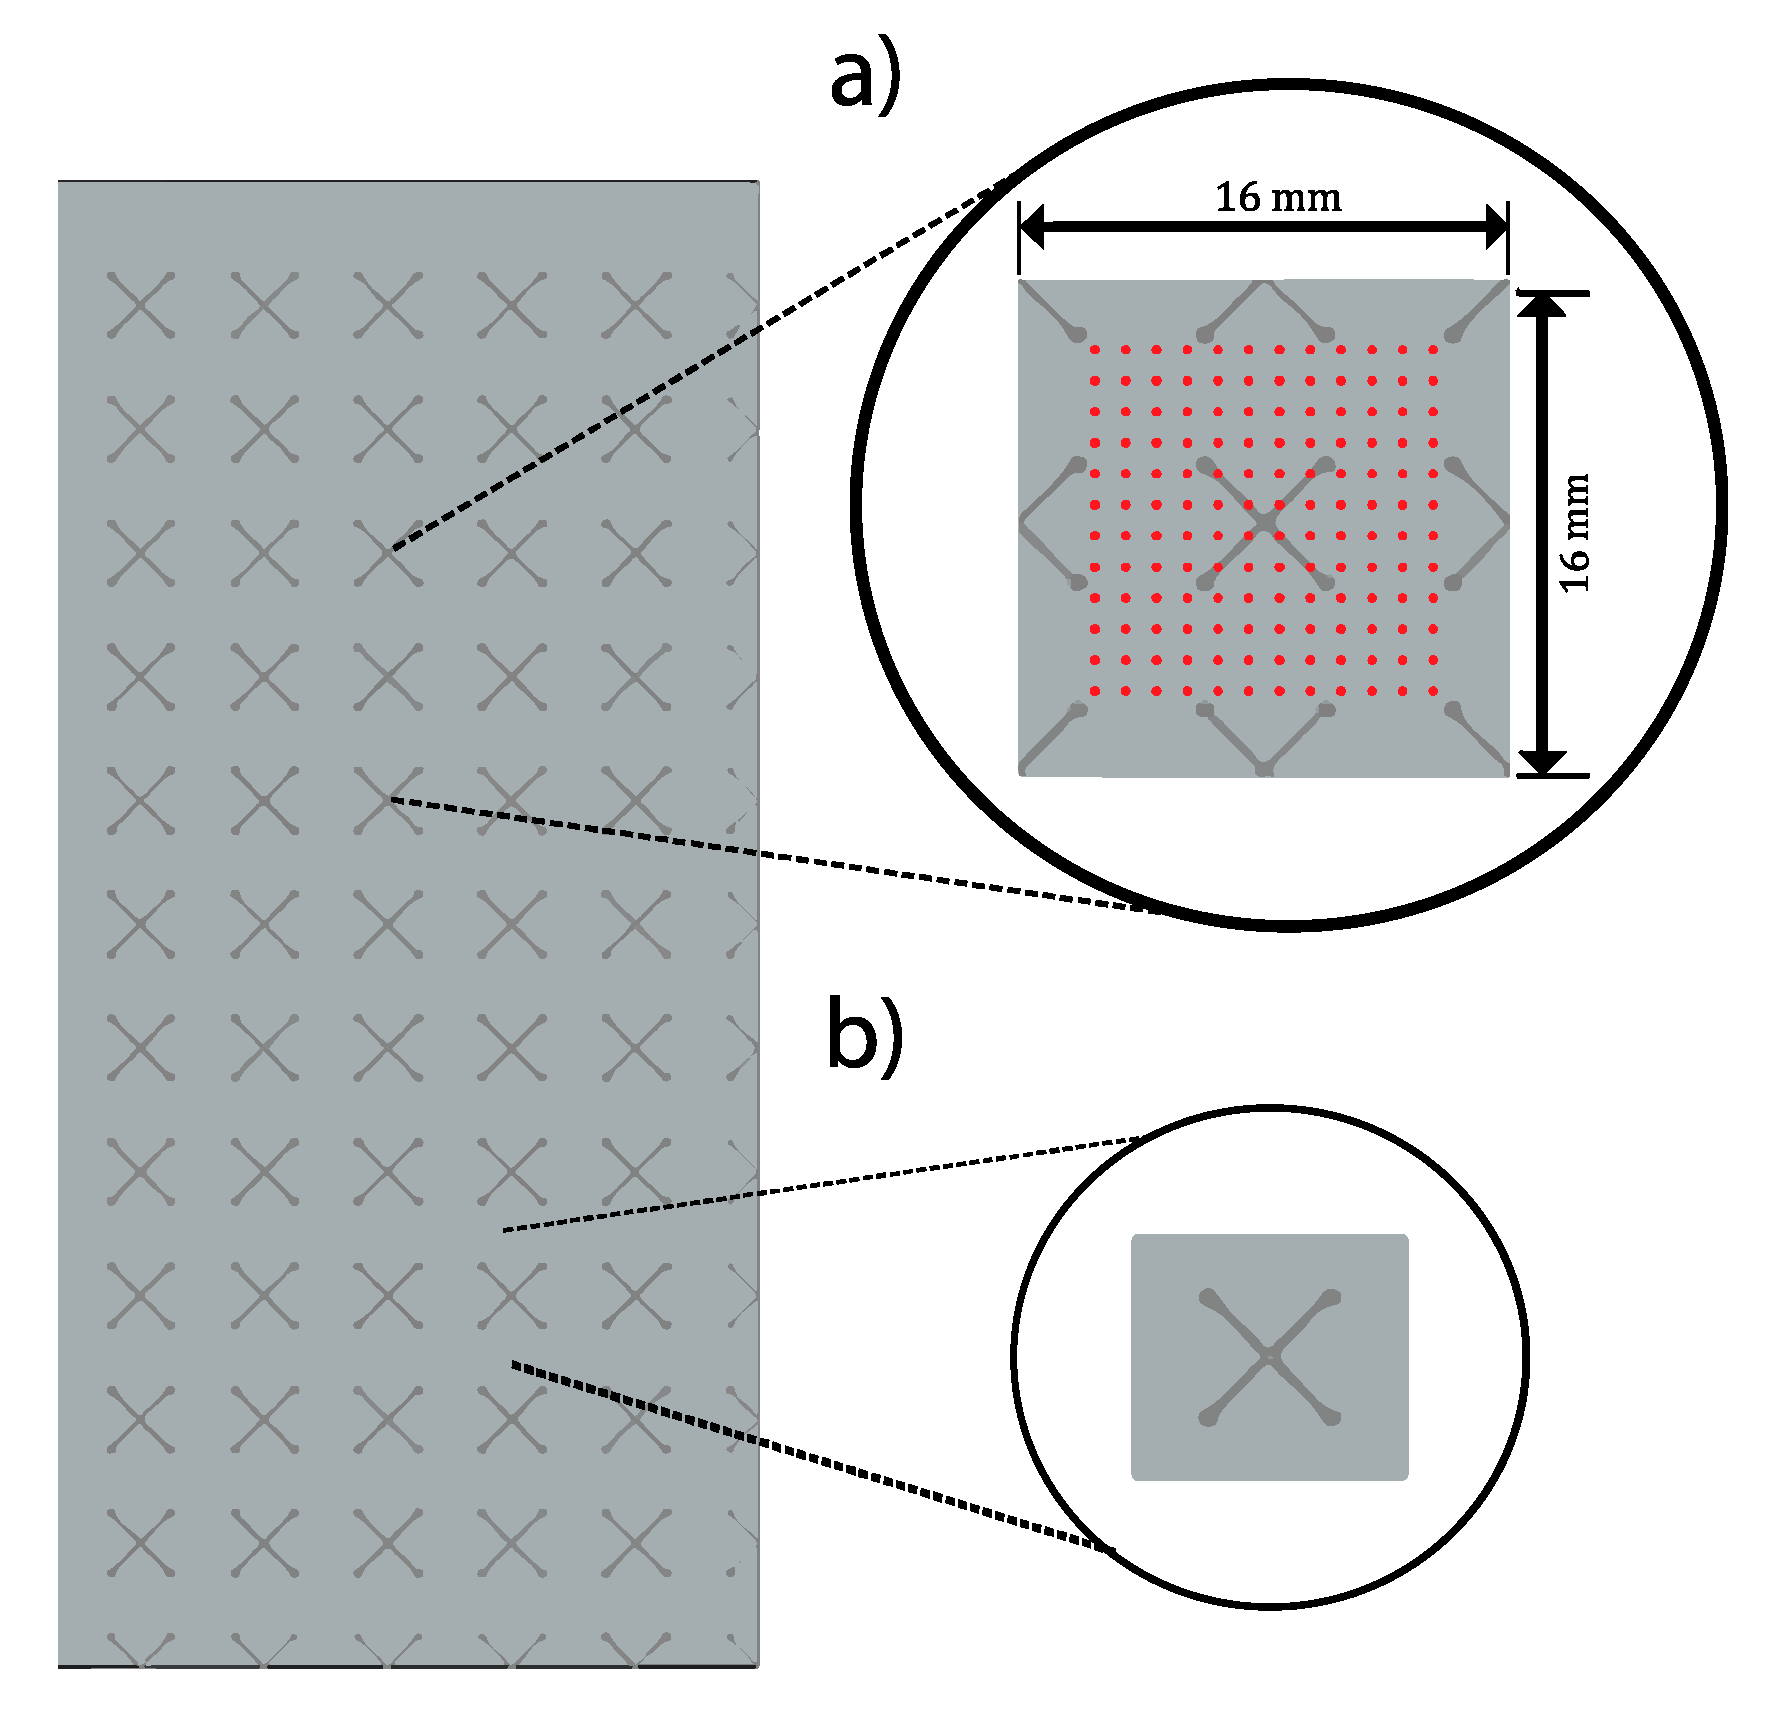
Vickers microhardness maps were carried out with a load of 100 g and a holding time of 10 s in a matrix of 16 mm × 16 mm with a Shimadzu microhardness machine (Shimadzu, Kyoto, Japan). The analyzed zone for hardness mapping is shown in Figure 4a. The specimens were mechanically grounded and polished until mirror-finish prior to measurements. The microhardness and tensile tests were performed for the initial condition, one, two, and four-cycles. The hardness value was taken from an average of 256 indentations for the processed samples and 36 for the initial condition. The RCS samples were cut based on the ASTM-E8M standard (Figure 3). Tensile tests were carried out using an INSTRON tensile testing machine (Instron, Norwood, MA, USA) with an engineering strain rate of 2.77 × 10⁻⁴ s−1. The microstructure of the processed specimens was characterized by scanning electron microscopy (SEM) using a microscope JEOL JSM-7001F (Jeol, Tokyo, Japan) equipped with electron backscatter diffraction (EBSD) system. The EBSD samples were mechanically ground and finished with 0.05 μm colloidal silica suspension. The selected zone for EBSD characterization is shown in Figure 4b.

3. Results and Discussion

The finite element simulation showed a considerable degree of heterogeneity of the equivalent plastic strain (PEEQ) on the surface and the cross-section after the first cycle of the RCS process (Figure 5). Since PEEQ is a scalar variable that is used to represent the materials’ inelastic deformation, then it contains the initial value of equivalent plastic strain plus any additional equivalent plastic strain due to plastic straining during the analysis. The PEEQ contrast difference between the upper and lower face diminished for further cycles due to the 180° rotation in the workpiece. The material flipping over did help to reach a PEEQ up to ε~3 (four-cycles) because of the interchange of the tensile stress on the top surface. In the previous test, the material reached only two-cycles without the 180° rotation. The PEEQ ratio between the least and most deformed zone, for the first cycle, was more than two orders of magnitude. For two, three, and four-cycles, the most deformed zones were almost 15, 18, and 14 times higher than the least deformed zone, respectively. It is thought that this increase in heterogeneity, for the first and third cycles, is a consequence of the 180° rotation in the workpiece, as there is a gradient in the PEEQ in the transversal section.
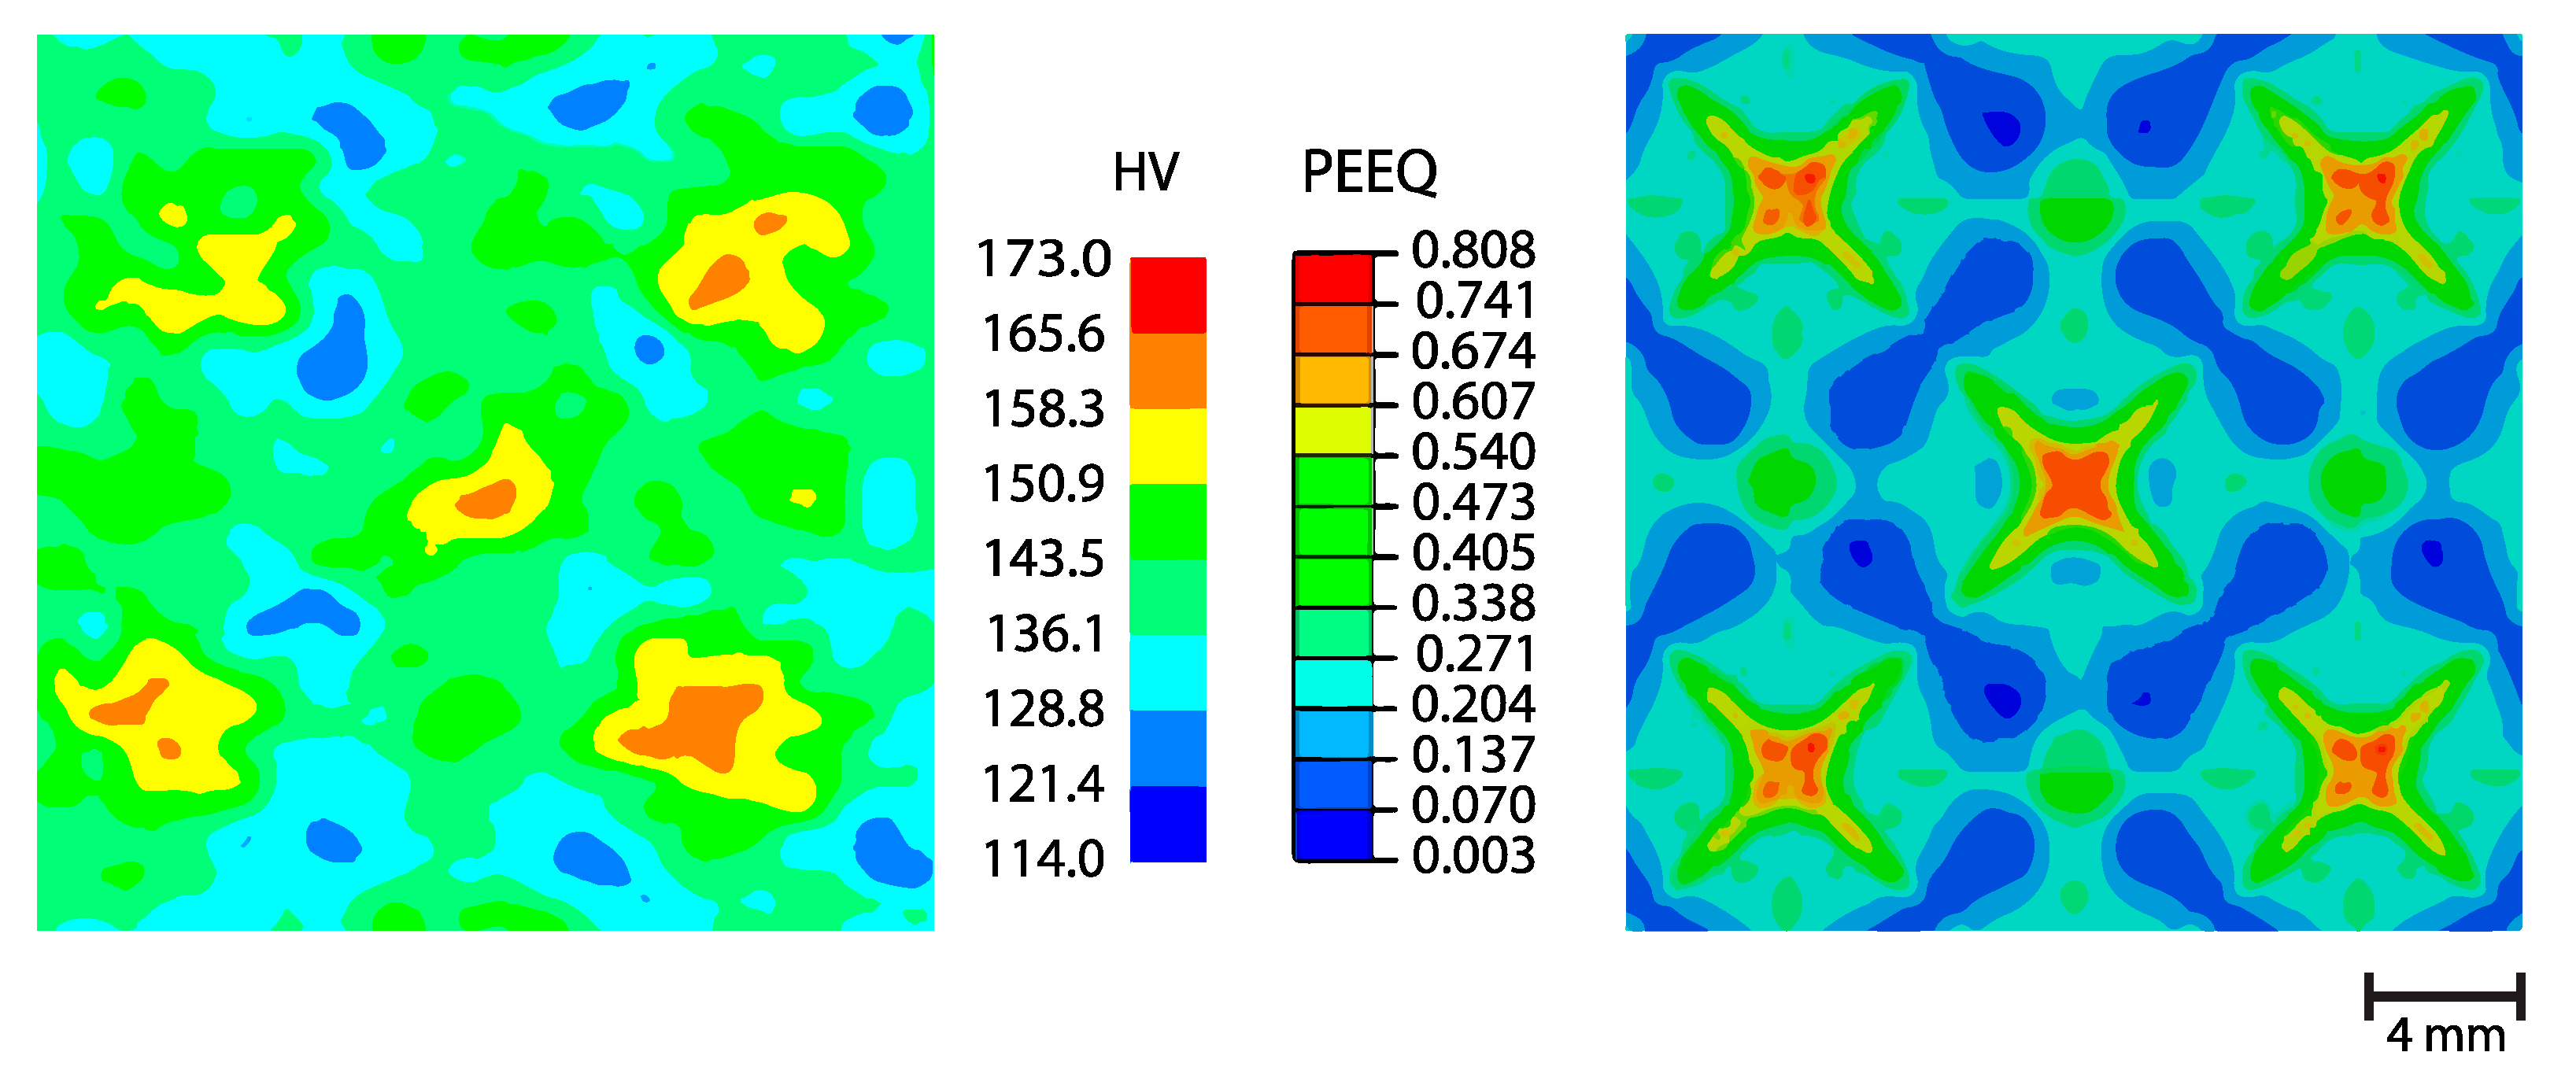
For the first cycle, a correlation in the distribution of the X-pattern between the PEEQ and the hardness distributions was observed (Figure 6). For further cycles, a slight difference in the pattern appeared and could be attributed to the reduction of thickness in the sample preparation and/or the manual alignment during the RCS process. A pronounced scatter in the hardness values was observed as a function of the RCS cycles, showing values ranging from 120 HV to 164 HV and 120 HV to 180 HV for one and four-cycles, respectively (Figure 6).
From the evolution of the microhardness with the RCS process (Figure 7), a logarithmic behavior of the microhardness was observed. The sample subjected to two-cycles (ε~1.6) showed a maximum hardness average value of 147 HV, then, for four passes (ε~3), it dropped slightly to 144 HV. When comparing the hardness of the T6 condition (120 HV) and the highly deformed samples (147 HV), a significant difference was observed, showing a hardness rise of 22% [15]. This increase was also higher than that for the ARB process, where after five-cycles (ε~4), a maximum value of 132 HV was reported [16].
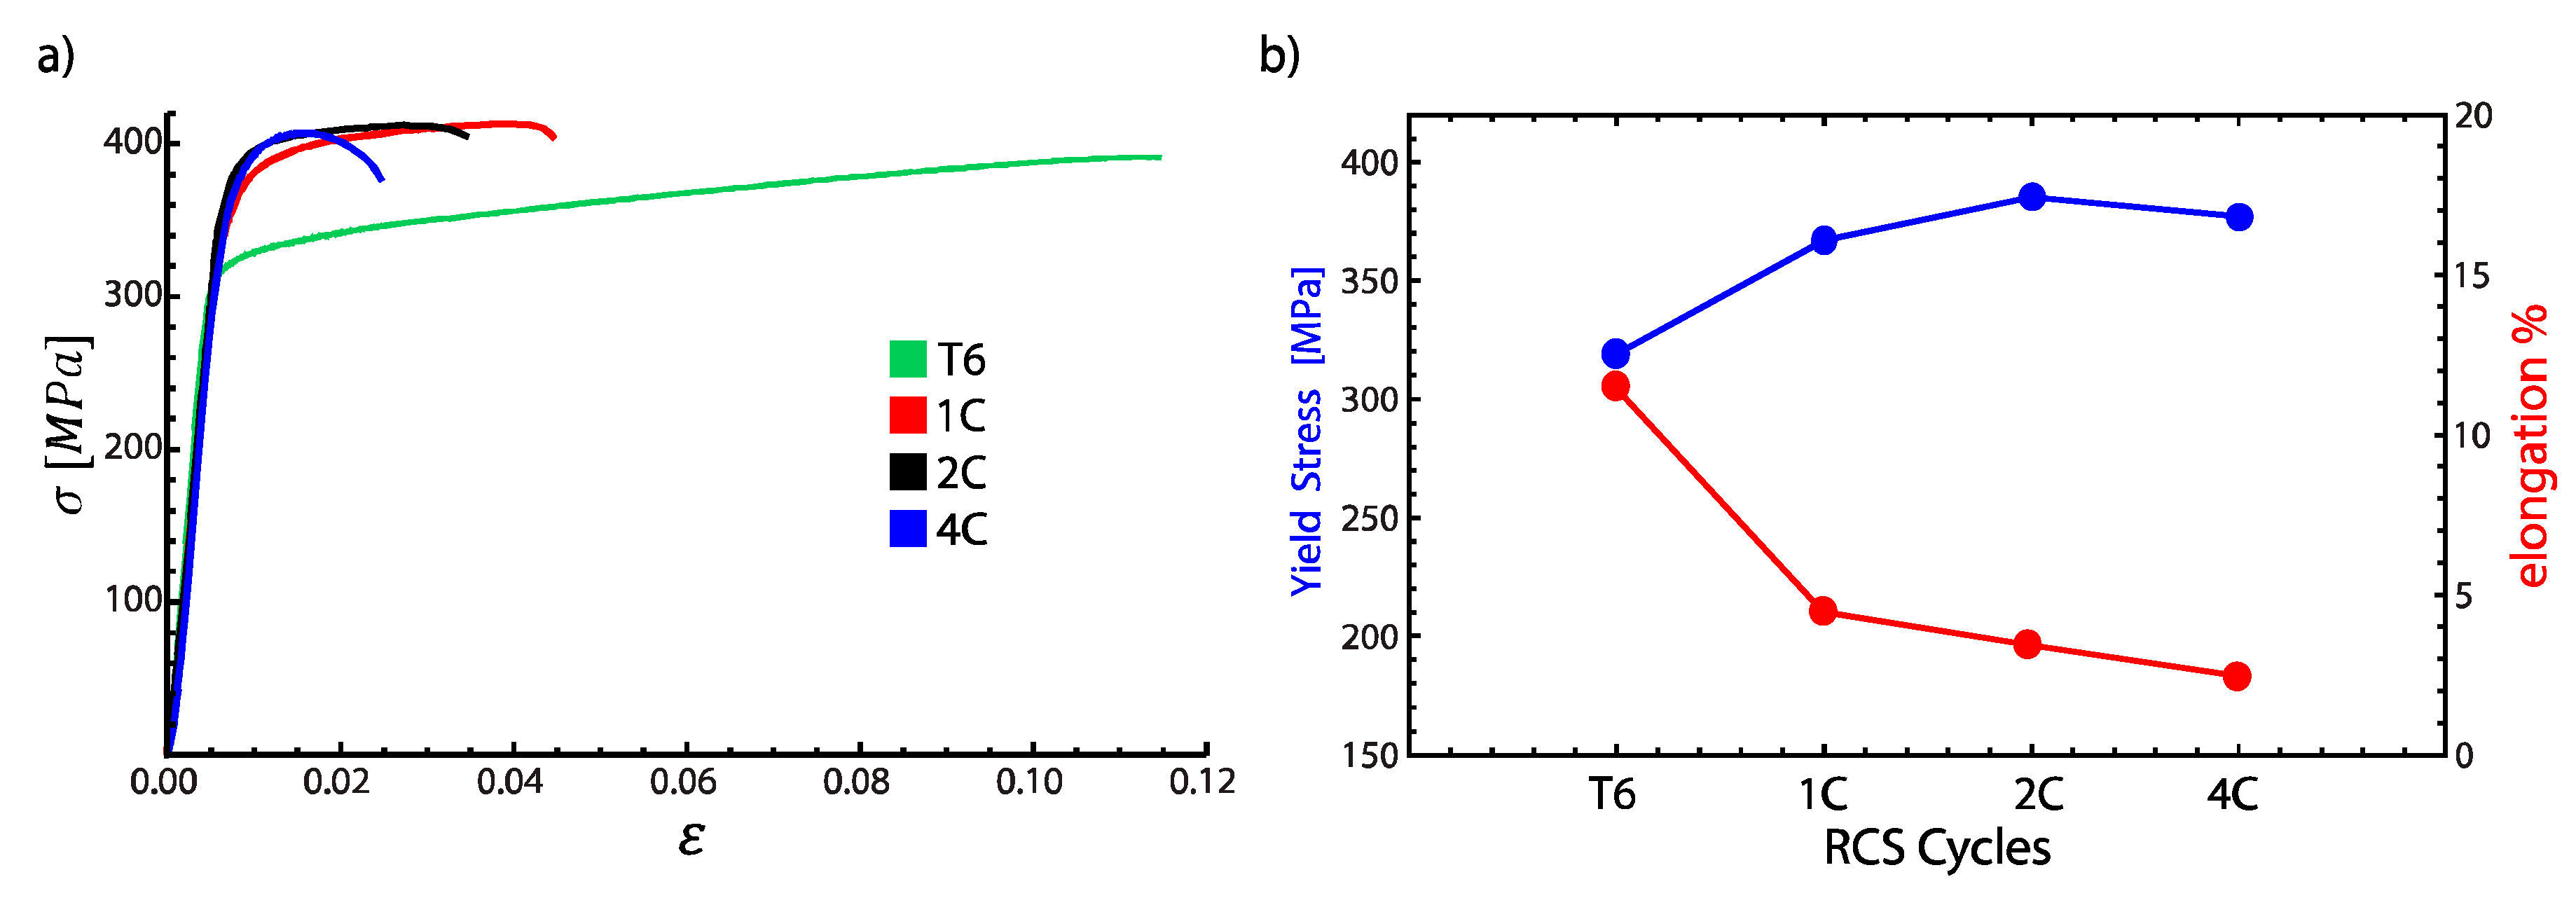
The stress-strain curve for the initial condition and 1, 2, and 4 cycles are displayed in Figure 8a. For the initial condition, the UTS value was 391 MPa. Then, a slight increase of 5% was observed, reaching a value of 413 MPa for further cycles and remained constant until the four-cycles. The yield strength (YS) and elongation versus the number of cycles are displayed in Figure 8b. Analogously to the hardness tests, it can be observed that in the first cycle, the highest increase in the YS is obtained, increasing from 319 MPa to 367 MPa, while the elongation was drastically reduced from 11.5% to 4.5%. The maximum strength was found for two-cycles with a value of 385 MPa and a ductility of 3.5%. Finally, a slight reduction in YS was observed for four-cycles (4P) with a value of 377 MPa. The decrease of the hardness value and YS in the fourth cycle could be related to the dislocation density reduction by dynamic recovery [17,18]. When comparing the obtained values with those reported for the commercial alloy AA6061-T6 in the literature, the yield strength was 315 MPa and the ultimate tensile strength was 348 MPa. Therefore, there is an increment of 22% and 18%, respectively [19].
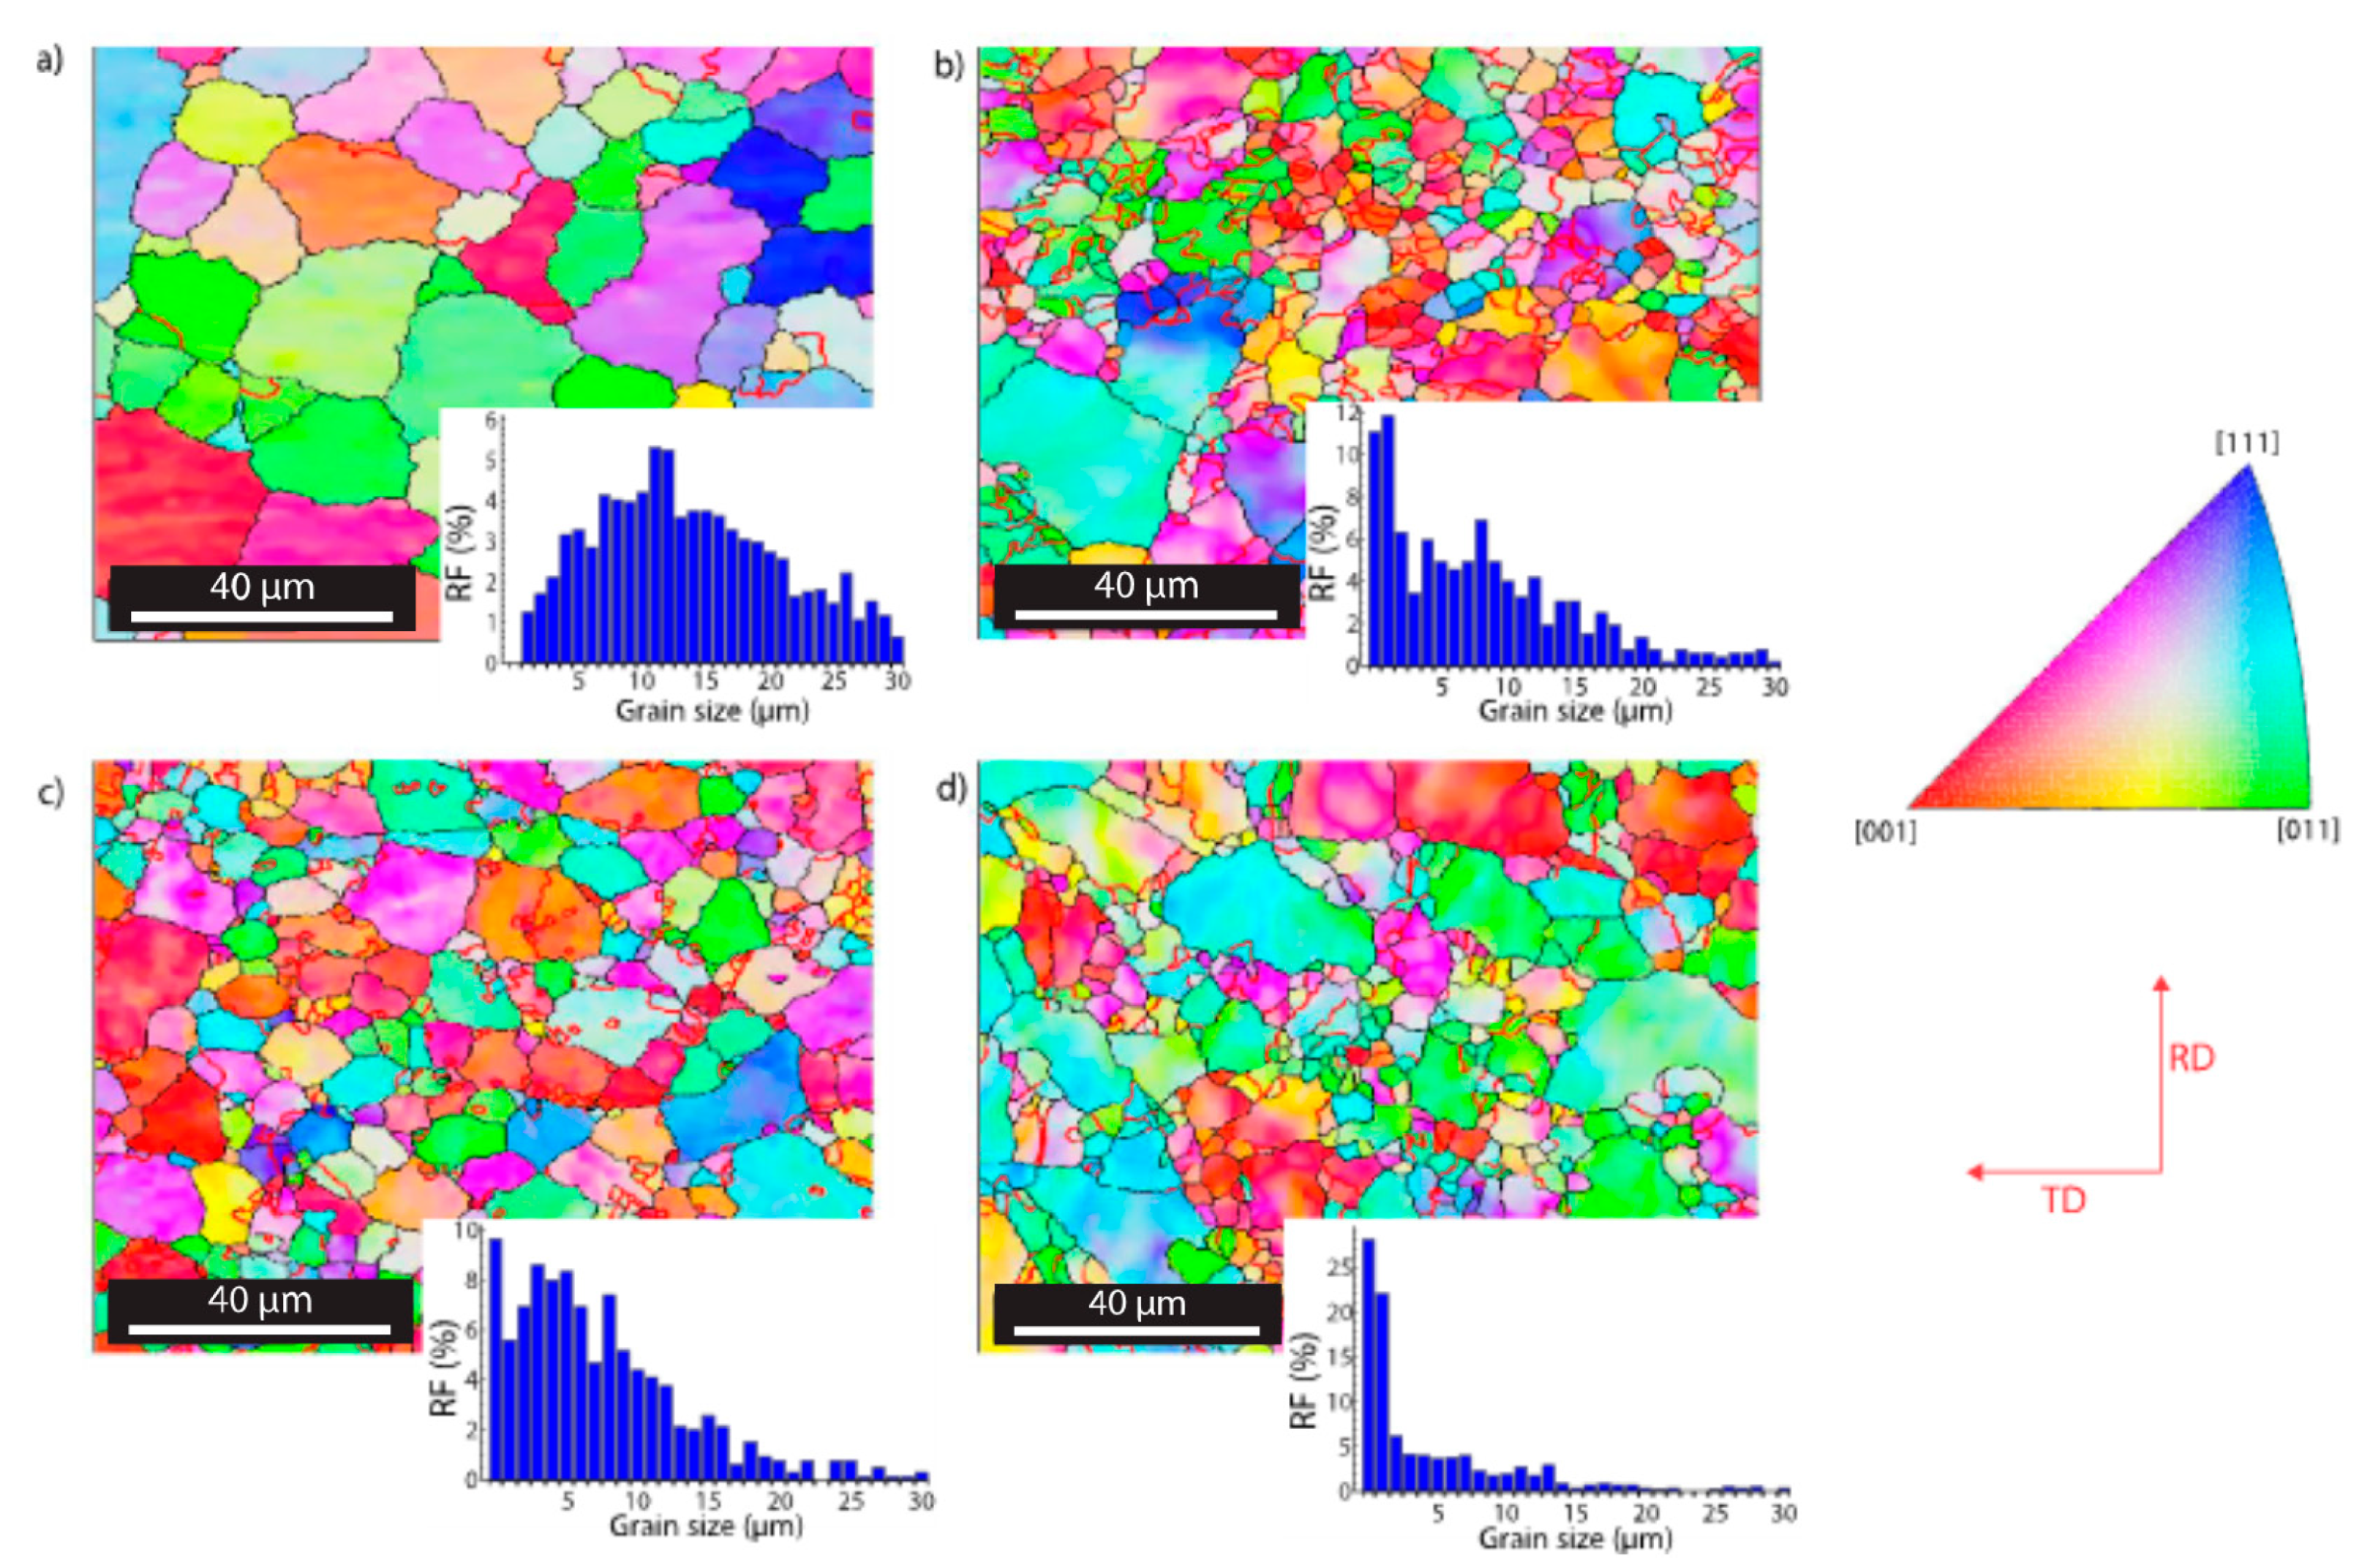
The EBSD orientation map for the different RCS cycles is shown in Figure 9. Grain misorientation between 5° to 15° was considered as low angle grain boundaries, whereas misorientation above 15° was taken as high angle grain boundaries. For orientation imaging, the standard grain boundaries are shown in black. The subgrains are shown in red (misorientation below 5°). The colours of the EBSD map represent the orientation of the grains with respect to the external z-axis that is shown in the color key scale (Figure 9) [20]. For the initial condition (Figure 8a), the material has an average grain size of 17 μm. In the first cycle, considerable grain refinement was achieved, reducing the average grain size down to 9 μm (Figure 9b), for the second cycle down to 8 μm (Figure 9c) and finally for four cycles 6.3 μm (Figure 9d). The grain size distribution histogram for the initial condition showed a gaussian profile, for the subsequent cycles, an evolution from the normal to lognormal distribution occurred. Most of the grains in all the processed conditions showed a grain size less than 5 μm. The EBSD technique allowed visualizing the plastic strain in the microstructure, taking the misorientation as a parameter related to the deformation.
The RCS process generated significant changes in the misorientation of the grain boundaries. Such misorientation for the initial condition is shown in Figure 10a, where few sub-grain boundaries (<5°) were observed; this is considered as “normal” for the annealed condition. After one RCS cycle, a substantial increase in the sub-grain boundaries was observed (Figure 10b). As the PEEQ increased, they tended to evolve from sub-grains (<5°) to low angle grain boundaries (5–15°) (Figure 10c). Finally, for the last cycle, the generation of new grains with high angle boundaries (>15°) was observed (Figure 10d). This behavior has not yet been reported for the RCS process in aluminium, but it was described in aluminium alloys processed by Equal Channel Angular Pressing (ECAP) [21]. When comparing ECAP literature reports with this study [21], a similar distribution of the misorientation was observed with less than half of the deformation; this could be a peculiarity of this RCS die design and process.
In summary, the new die design generated zones with high deformation concentration, alternated with low deformation zones, reaching an equivalent plastic strain between 0.003 and 0.808 for the first cycle. With this design, the 6061 in T6 condition material was able to be processed for up to four-cycles without any apparent fracture. After two-cycles, the mechanical properties were enhanced by the proposed die design, increasing the yield strength and Vickers hardness 21% and 22.5%, respectively. Another improvement of the process was the grain size reduction, here, the average grain size of the as-received sample was 17 mm and after the four-cycles it dropped down to 6.3 mm. The distribution of the grain size started with a Gaussian profile in the initial condition, and then a lognormal profile for the last condition (four-cycles) was observed, indicating the generation of a large amount of sub-grains. The improvement of the mechanical properties was a consequence of the localization of the grain refinement in the highest deformed zones and intergranular misorientation.

4. Conclusions

Considering the new corrugation die design proposed in this work, and the resulting microstructure and mechanical properties, the following can be concluded:
(1) Based on the results of the finite element simulation. An equivalent plastic strain of 0.808 was reached after the first RCS cycle.
(2) No fracture was observed for up to four-cycles.
(3) The mechanical properties were enhanced. The maximum yield strength and Vickers hardness improvement were for the two-cycles condition. These were higher than those reported by conventional heat treatments, for the same alloy
(4) The initial grain size dropped considerably after the four-cycles, with grain size distribution showing a Gaussian profile for the initial condition and a lognormal profile for four-cycles condition.
(5) The improvement of the mechanical properties was a consequence of the localization of the grain refinement in highly deformed zones and intergranular misorientation.

Author Contributions

Supervision, G.G.; conceptualization, G.G. and I.A.F.; investigation, S.E. and M.E.; formal analysis, S.E, G.G., I.A.F., C.B., and J.M.C.; resources, G.G., I.A.F., J.M.C., and C.B.; writing—original draft; S.E. writing—review and editing, I.A.F and G.G. All authors have read and agreed to the published version of the manuscript.

Funding

This research was funded by PAPIIT-UNAM through project IN107917.

Acknowledgments

The authors gratefully acknowledge the valuable technical support provided by A. Tejeda, E. Hernández, C. Casas and J. Romero. S.E acknowledges for the scholarship from CONACyT (No. 450358) and the financial support from PAEP-UNAM and FI AGAUR 2019 FI-B 00172. J.M.C. thanks CONACYT for partial funding of his sabbatical leave at UMSNH.

Conflicts of Interest

The authors declare no conflict of interest.

References

  1. Bobruk, E.V.; Kazykhanov, V.U.; Murashkin, M.Y.; Valiev, R.Z. Enhanced Strengthening in Ultrafine-Grained Al-Mg-Si Alloys Produced via ECAP with Parallel Channels. Adv. Eng. Mater. 2015, 17, 1733–1737. [Google Scholar] [CrossRef]
  2. Valiev, R.Z.; Islamgaliev, R.K.; Alexandrov, I.V. Bulk nanostructured materials from severe plastic deformation. Prog. Mater. Sci. 2000, 45, 103–189. [Google Scholar] [CrossRef]
  3. Yu, H.; Su, L.; Lu, C.; Tieu, K.; Li, H.; Li, J.; Godbole, A.; Kong, C. Enhanced mechanical properties of ARB-processed aluminum alloy 6061 sheets by subsequent asymmetric cryorolling and ageing. Mater. Sci. Eng. A 2016, 674, 256–261. [Google Scholar] [CrossRef] [Green Version]
  4. Huang, J.; Zhu, Y.T.; Alexander, D.J.; Liao, X.; Lowe, T.C.; Asaro, R.J. Development of repetitive corrugation and straightening. Mater. Sci. Eng. A 2004, 371, 35–39. [Google Scholar] [CrossRef]
  5. Shin, D.H.; Park, J.J.; Kim, Y.S.; Park, K.T. Constrained groove pressing and its application to grain refinement of aluminum. Mater. Sci. Eng. A 2002, 328, 98–103. [Google Scholar] [CrossRef]
  6. Hosseini, E.; Kazeminezhad, M. Implementation of a constitutive model in finite element method for intense deformation. Mater. Des. 2011, 32, 487–494. [Google Scholar] [CrossRef]
  7. Sunil, B.R. Repetitive Corrugation and Straightening of Sheet Metals. Mater. Manuf. Process. 2015, 30, 1262–1271. [Google Scholar] [CrossRef]
  8. Thangapandian, N.; Balasivanandha Prabu, S.; Padmanabhan, K.A. Effects of die profile on grain refinement in Al-Mg alloy processed by repetitive corrugation and straightening. Mater. Sci. Eng. A 2016, 649, 229–238. [Google Scholar] [CrossRef]
  9. Rajinikanth, V.; Arora, G.; Narasaiah, N.; Venkateswarlu, K. Effect of repetitive corrugation and straightening on Al and Al-0.25Sc alloy. Mater. Lett. 2008, 62, 301–304. [Google Scholar] [CrossRef]
  10. Mirab, S.; Nili-Ahmadabadi, M.; Khajezade, A.; Jafarian, H.R. Correlation between poly-modal grain size and peculiar mechanical properties of pure aluminum deformed by RCSR process. Mater. Sci. Eng. A 2017, 700, 416–424. [Google Scholar] [CrossRef]
  11. Orlov, D.; Todaka, Y.; Umemoto, M.; Tsuji, N. Formation of bimodal grain structures in high purity Al by reversal high pressure torsion. Scr. Mater. 2011, 64, 498–501. [Google Scholar] [CrossRef]
  12. Mirsepasi, A.; Nili-Ahmadabadi, M.; Habibi-Parsa, M.; Ghasemi-Nanesa, H.; Dizaji, A.F. Microstructure and mechanical behavior of martensitic steel severely deformed by the novel technique of repetitive corrugation and straightening by rolling. Mater. Sci. Eng. A 2012, 551, 32–39. [Google Scholar] [CrossRef]
  13. Ozturk, F.; Sisman, A.; Toros, S.; Kilic, S.; Picu, R.C. Influence of aging treatment on mechanical properties of 6061 aluminum alloy. Mater. Des. 2010, 31, 972–975. [Google Scholar] [CrossRef]
  14. Ezequiel, M.; Figueroa, I.A.; Elizalde, S.; Cabrera, J.M.; Braham, C.; Morin, L.; Gonzalez, G. Numerical and experimental study of a 5754-aluminum alloy processed by heterogeneous repetitive corrugation and straightening. J. Mater. Res. Technol. 2019, 1–7. [Google Scholar] [CrossRef]
  15. Kim, W.J.; Kim, J.K.; Park, T.Y.; Hong, S.I.; Kim, D.I.; Kim, Y.S.; Lee, J.D. Enhancement of strength and superplasticity in a 6061 Al alloy processed by equal-channel-angular-pressing. Metall. Mater. Trans. A Phys. Metall. Mater. Sci. 2002, 33, 3155–3164. [Google Scholar] [CrossRef]
  16. Rezaei, M.R.; Toroghinejad, M.R.; Ashrafizadeh, F. Effects of ARB and ageing processes on mechanical properties and microstructure of 6061 aluminum alloy. J. Mater. Process. Technol. 2011, 211, 1184–1190. [Google Scholar] [CrossRef]
  17. Sakai, T.; Belyakov, A.; Kaibyshev, R.; Miura, H.; Jonas, J.J. Dynamic and post-dynamic recrystallization under hot, cold and severe plastic deformation conditions. Prog. Mater. Sci. 2014, 60, 130–207. [Google Scholar] [CrossRef] [Green Version]
  18. Bacca, M.; Hayhurst, D.R.; McMeeking, R.M. Continuous dynamic recrystallization during severe plastic deformation. Mech. Mater. 2015, 90, 148–156. [Google Scholar] [CrossRef] [Green Version]
  19. Jenix Rino, J.; Balasivanandha Prabu, S.; Padmanabhan K., A. On the influence of repetitive corrugation and straightening on the microstructure and mechanical properties of AA 8090 Al-Li alloy. Arch. Civ. Mech. Eng. 2018, 18, 280–290. [Google Scholar]
  20. Totten, G.E.; MacKenzie, D.S. (Eds.) Handbook of Aluminum; Marcel Dekker, Inc: New York, NY, USA, 2003; ISBN 0824704940. [Google Scholar]
  21. Cabibbo, M.; Evangelista, E.; Scalabroni, C. EBSD FEG-SEM, TEM and XRD techniques applied to grain study of a commercially pure 1200 aluminum subjected to equal-channel angular-pressing. Micron 2005, 36, 401–414. [Google Scholar] [CrossRef] [PubMed]
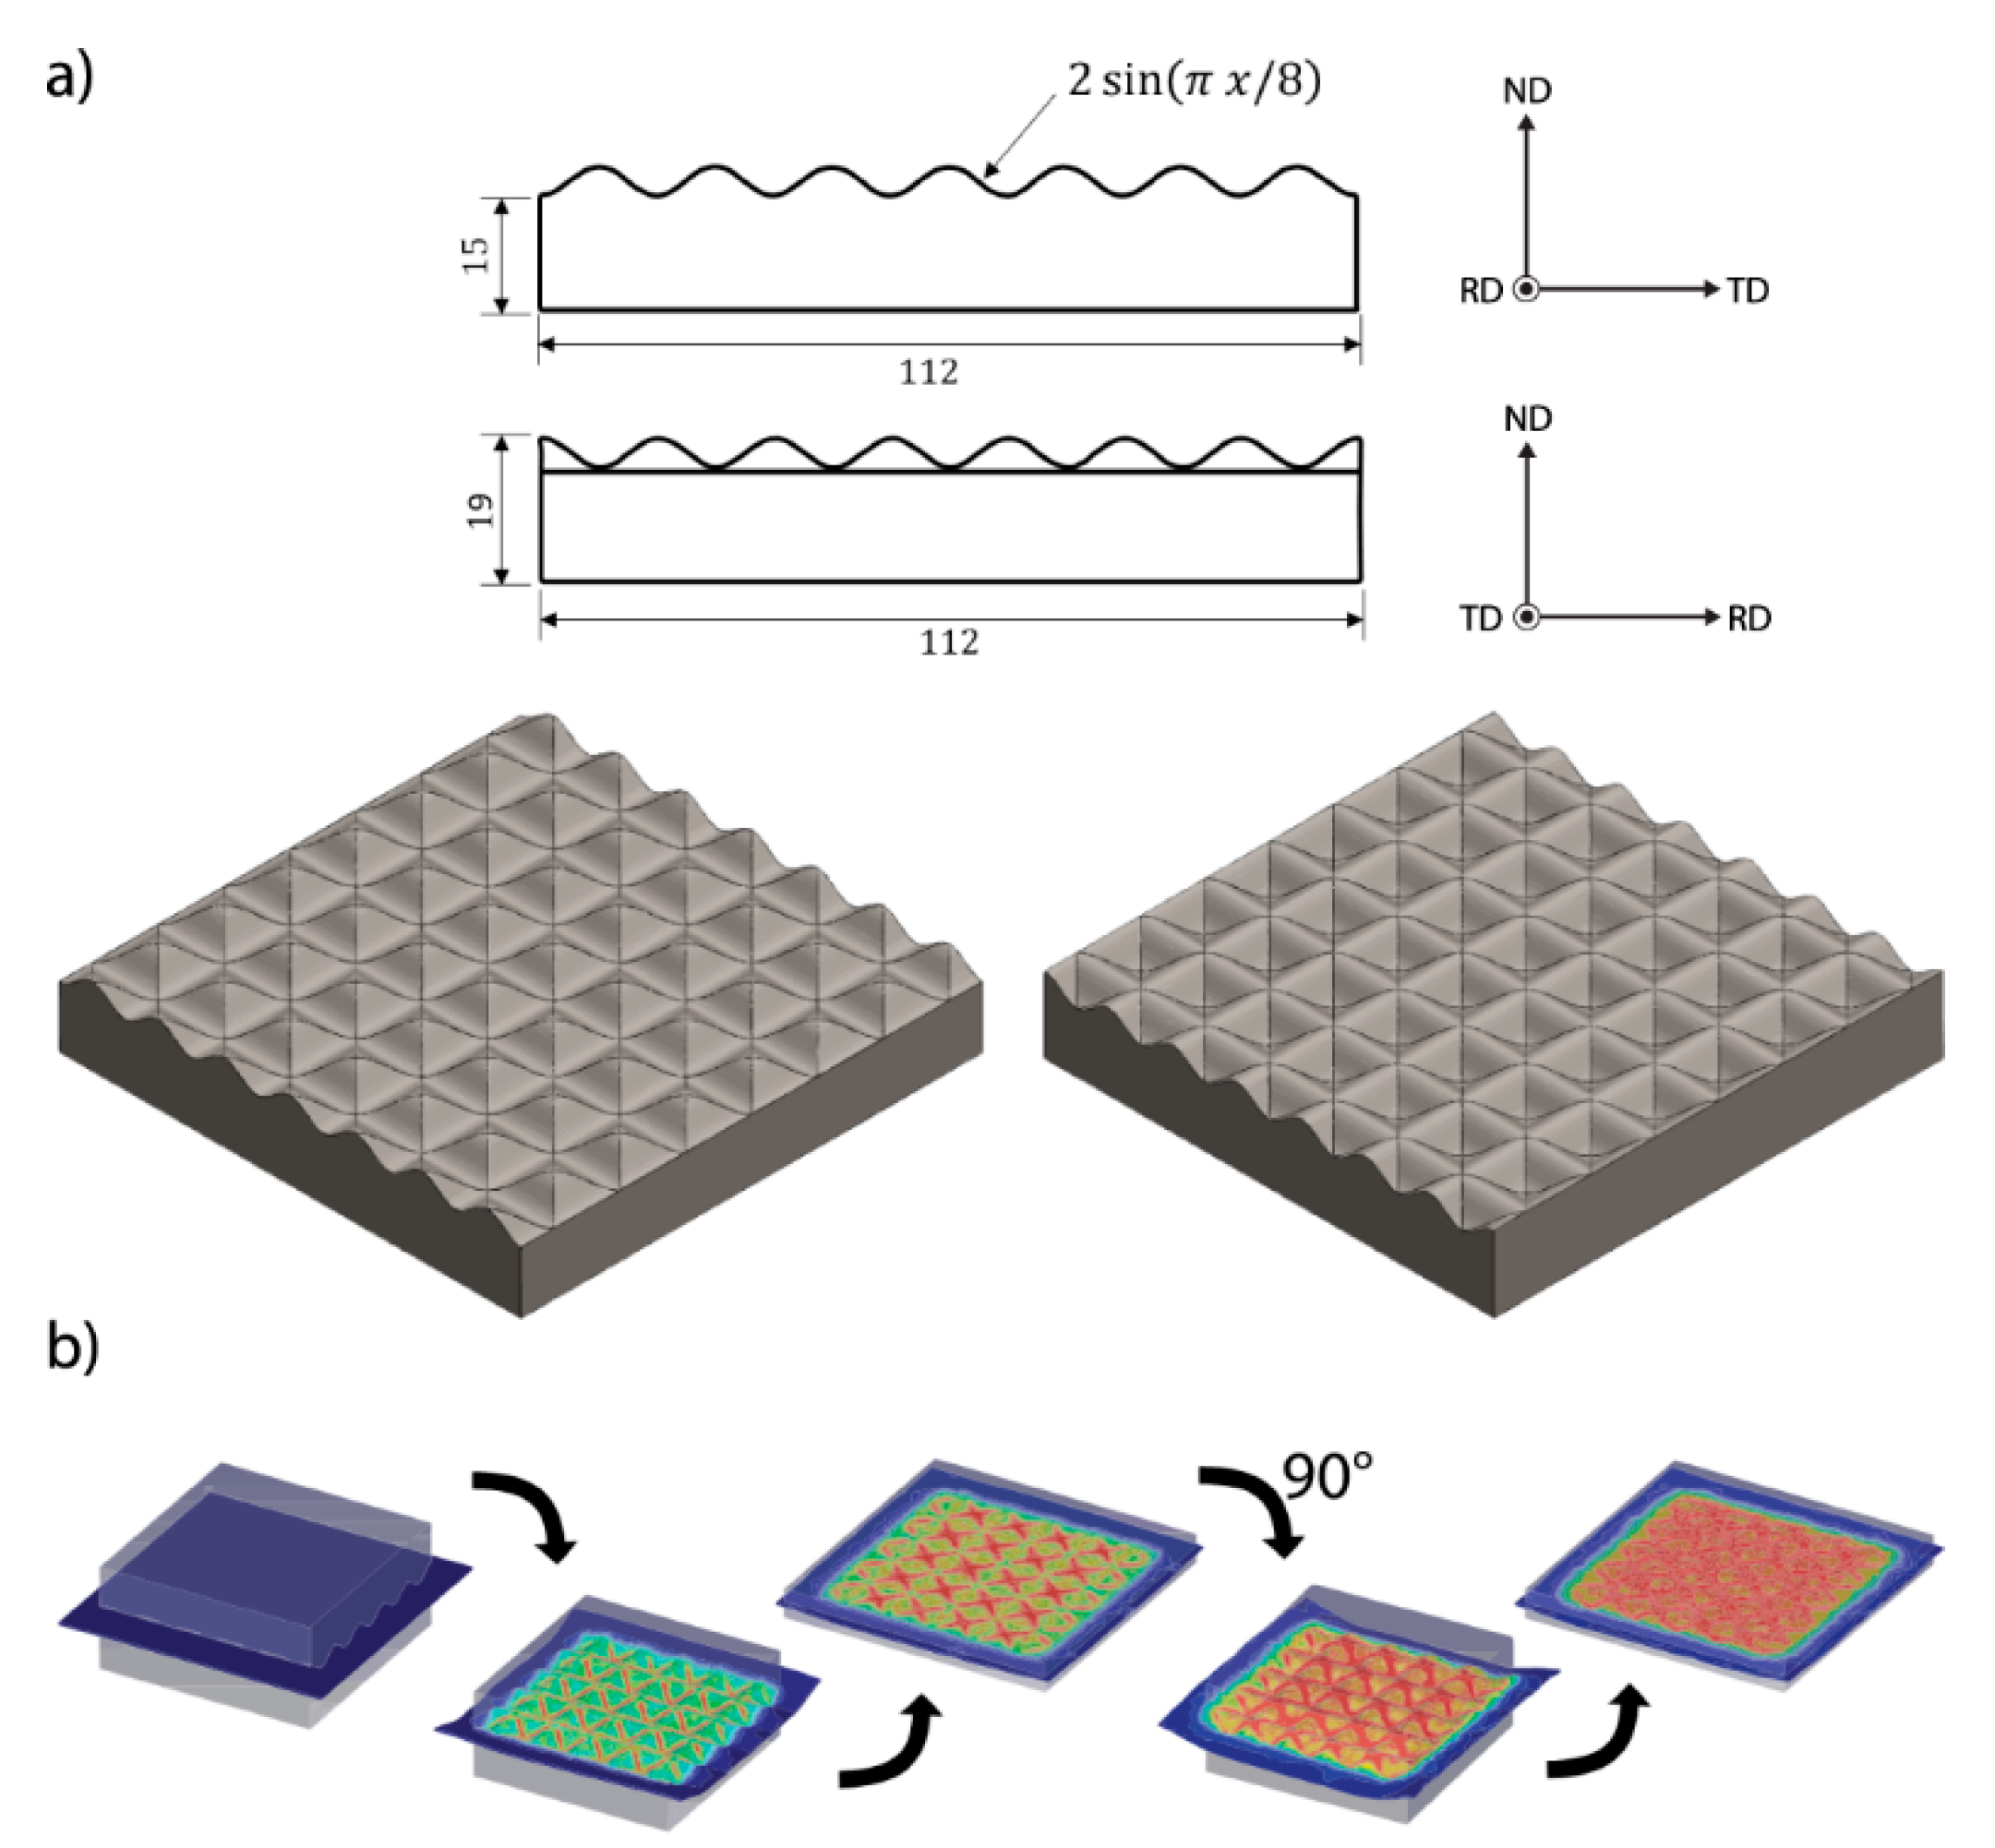
Figure 1. (a) Die profile (“x” represents the distance in mm). (b) Passes that compose one cycle of repetitive corrugation and straightening (RCS). The semicircular profile avoids stress concentrations in comparison to the V-groove profile, being clearly smoother. This profile introduces less stress concentration points.
Metals 10 00489 g001
Figure 2. Assembly parts of the numerical simulation of (a) the die, (b) the sample, (c) symmetry of the boundary conditions. The finite element simulation showed that for each RCS process cycle, an effective strain of 0.8, in the most deformed zones of the sample, was applied.
Metals 10 00489 g002
Figure 3. Dimensions of the specimens for the tensile test in mm. The tensile samples were cut based on the ASTM-E8M standard and the experiments were carried out at 2.77 × 10⁻⁴ s−1.
Metals 10 00489 g003
Figure 4. Analysis zone of the (a) hardness mapping, (b) SEM scan. The mapping was carried out with a load of 100 g and a holding time of 10 s. The test was performed for the initial condition, one, two, and four-cycles, with an average of 256 indentations for the processed and 36 for the initial condition samples.
Metals 10 00489 g004
Figure 5. Equivalent plastic strain calculated by FEA simulation for one, two, three, and four cycles. The difference in the equivalent plastic strain (PEEQ) contrast, between the sample upper and lower face, is rather evident.
Metals 10 00489 g005
Figure 6. Comparison between hardness distribution and equivalent plastic strain for one-cycle condition. This hardness distribution result shows the highly deformed zone in the sample.
Metals 10 00489 g006
Figure 7. Evolution of the Vickers Microhardness as a function of the RCS cycles, a logarithmic behavior is clearly observed.
Metals 10 00489 g007
Figure 8. (a) Flow curve evolution through the RCS process, (b) Evolution of the yield strength as a function of the RCS cycles. In both plots, the reduction in ductility and the gain of yield strength (YS) due to the RCS process is observed.
Metals 10 00489 g008
Figure 9. Electron backscatter diffraction (EBSD) orientation maps with grain size histogram (RF% means relative frequency) for (a) initial condition, (b) one RCS cycle, (c) two RCS cycles, (d) four RCS cycles. These results showed the RCS effect on the grain size distribution.
Metals 10 00489 g009
Figure 10. Grain boundaries classification map with misorientation histogram for (a) initial condition, (b) one RCS cycle, (c) two RCS cycles, (d) four RCS cycles. Here, it was observed the correlation between the misorientation boundaries and the RCS cycles.
Metals 10 00489 g010
Table 1. Composition of the Al-6061 alloy obtained by X-ray fluorescence.
ElementSiFeCuMnMgCrZnTiAl
wt% nominal0.4−0.80.70.15−0.40.150.8−1.20.04−0.30.250.15balance
wt% real0.770.240.160.031.030.070.030.02balance