Abstract
The objective of this study is to investigate the impact behavior of iron-based composites reinforced with boron carbide (B4C) particles and in-situ synthesized iron borides (Fe2B/FeB). The composite specimens (Fe/B4C) were fabricated by hot-pressing under a pressure of 250 MPa at 500 °C, and sintered at a temperature of 1000 °C. The effects of the reinforcement ratio on the formation of in-situ borides and impact behavior were investigated by means of different volume fractions of B4C inside the iron matrix: 0% (un-reinforced), 5%, 10%, 20%, and 30%. Drop-weight impact tests were performed by an instrumented Charpy impactor on reinforced and un-reinforced test specimens. The results of the impact tests were supported with microstructural and fractographical analysis. As a result of in-situ reactions between the Fe matrix and B4C particles, Fe2B phases were formed in the iron matrix. The iron borides, formed in the iron matrix during sintering, heavily affected the hardness and the morphology of the fractured surface. Due to the high amount of B4C (over 10%), porosity played a major role in decreasing the contact forces and fracture energy. The results showed that the in-situ synthesized iron boride phases affect the impact properties of the Fe/B4C composites.
1. Introduction
Metal matrix composites (MMCs) are preferred in machine elements and constructive structures working under many loading types, with their high specific strength, high wear resistance, and advanced thermal properties. Particle-reinforced composites are advanced materials with the potential to provide improved properties, progressively used in the automotive, aircraft, and space industries, as well as in civil and defense applications. Structures made of particle-reinforced MMCs are dependent on their reinforcement properties, such as particle sizes, particle geometries, and particle contents in the composites when considering the composite characteristics and fabrication process [1,2].
Composite materials are usually exposed to impact damages in different environments. For that reason, problems associated with impact damages are limiting the design criteria for composite materials [3]. The response of the composites can be affected by different failure modes, such as microstructure properties, crack initiation and propagation, and damage type of the reinforcement particles [4,5].
The low-velocity impact and Charpy tests have been used for many years as fast and economical comparison tools to determine the energy absorption, notch sensitivity, and impact fracture behavior of materials for qualitatively comparing different composite structures and assessing their fabrication and service conditions [6,7,8]. Most of the studies were focused on aluminum- and magnesium-based composites, while little attention has been given to the development of iron matrix composites produced by the powder metallurgy method. The use of iron and its alloys as a matrix in composite materials is very important for wear and corrosion resistance. Besides, they have a higher stiffness, strength, and toughness when compared with aluminum- or magnesium-based composites. MMCs, iron-based composites, and alloyed steels were examined in some studies for fracture characteristics and impact behavior [9,10,11,12,13].
The powder metallurgy method can produce unique microstructures and compositions required for hard composite materials. However, it is well known that powder metallurgy composites are influenced by an inherent porosity after the pressing and sintering. Pores act as stress and crack originators under several impact loadings [5,6,14].
Boron carbide (B4C) is an excellent material with a wide range of application areas, such as the chemical industry, metallurgy, hardening of metal surfaces, cutting tools and abrasives, and space and armor applications. In some studies that are in close scope, boron carbide with added iron matrix materials has been investigated by means of the structure formation and the growth mechanism of iron borides in boriding treatments. Boriding is a well-known surface hardening process based on the formation of intermetallic Fe2B and FeB phases, which occurs as a result of the reaction between iron and boron atoms. Regarding composite materials, their strength and hardness can be improved by the presence of intermetallic phases and compounds [15].
The basic advantage of iron borides is that in certain amounts they enhance the hardness and strength of iron-based materials with hard Fe2B or FeB phases. The formation of iron borides in the internal structure can be achieved by in-situ reactions.
Regarding the MMCs, the interface between reinforcement and the metallic matrix plays an important role in the mechanical properties, as the load has to be transferred from matrix to reinforcement through the interface. If the interface is weak, the composite will perform poorly during service conditions. Besides, microcrack initiation and the damage of materials in particle-reinforced composites is often associated with interfacial bonding, which can occur in the chemical reactions of reinforcement and the matrix through the diffusion of atoms. The in-situ reactions at the interface lead to a strong bond between the iron matrix and the B4C particles eventually turned into iron borides.
The preferred method to add boron to the iron structure is the use of boron carbide powder containing boron elements. B4C particles are the main source of FeB and Fe2B phases, distributed homogeneously and throughout the structure. As a result of the reaction between boron and many elements in the periodic table, a wide range of borides are formed [16,17]. Small additions of boron have a positive effect on the mechanical properties of powder metallurgy steels during the densification stage of sintering [18]. The iron-rich liquid phase is formed between the ceramic particles, and the FeB phase is formed after solidification [19]. At sintering temperatures up to 1100 °C, the Fe2B and FeB phases begin to form around boron carbide due to the reaction between iron and boron, resulting in an almost complete breakdown of the B4C particles and the formation of graphite inside a porous and borided zone [16,20]. Increasing the sintering temperature (1000–1100 °C) leads to the formation of the liquid phase, and the sintering process is accelerated [20]. Regarding the solid-state sintering, only solid phases are present at the sintering temperature. However, in liquid phase sintering, small amounts of liquid phase are present. The reaction between Fe and B4C at 1000 °C leads to the release of free carbon and the formation of the FeB phase according to the reaction B4C + 4Fe = 4FeB + C. The iron particles react with the free carbon and, possibly, with carbon that originated from the boron carbide to form the FeC or Fe2C carbides. When carbon exceeds the limit of solubility, iron carbide is formed as the second phase [21]. Depending on the duration and temperature of the sintering process, the boron content, and the chemical composition, a single phase (Fe2B) or two intermetallic phases (Fe2B, FeB) are formed by the diffusion of boron atoms into the metallic materials [22]. In addition, the Fe-B phase diagram has two eutectics—one is present at 1177 °C, 3.8% boron content, and the second is seen at 1497 °C, 18.5% B [23]. Fe2B grows in low carbon and low alloy steels with a saw-tooth morphology and possesses a high degree of hardness (1600–1800 HV) [24,25,26]. Firstly, acicular Fe2B crystals grow on the metal surface, and then the FeB phase is formed, which is harder (1800–2400 HV), comparatively brittle, and contains more boron atoms [27]. These relevant studies have investigated the diffusion mechanisms of boron into the internal structure of composites. However, their mechanical behavior under the different strains they are exposed to under service conditions have not been examined. There are insufficient studies to clarify the influence of intermetallic boride phases on the impact responses of iron-based composites reinforced by B4C particles. Therefore, the purpose of this study is to determine the relation of the microstructure and impact behavior of Fe/B4C composites, as well as their micromechanical properties.
In this context, the main contributions of this paper are: (i) fabrication of Fe/B4C composites by the hot-pressing powder metallurgy method; (ii) investigation of the microstructural properties influenced by iron boride phases formed in situ; and (iii) evaluating the impact behavior and fractographical morphology of the different volume fractions of reinforcement.
2. Materials and Methods
2.1. Preparation of Composite Test Specimens
Commercial Fe and B4C powders were used as the matrix and reinforcement, respectively, for the fabrication of composites. From the point of view of the reaction between the iron and boron carbide powders, the selected particle sizes of both powders were nominally similar to promote high diffusion rates between iron and boron carbide. The iron particles, manufactured by AEE (Atlantic Equipment Engineers, (Upper Saddle River, NJ, USA), were mixtures of irregular angular shape and flake geometry with a median particle size () of 28.6 µm. The particles of B4C powder, manufactured by AEE, showed an irregular polygonal and angular morphology with a median particle size () of 30.8 µm. The particle size distributions of the raw powders were determined by a laser diffraction particle-size analysis (Mastersizer 3000, Malvern Panalytical Ltd, Malvern, UK). The results of the particle size distributions are listed in Table 1. The supplied information about the powders was presented in SEM images, seen in Figure 1.

Table 1.
Particle size distributions of the raw powders.
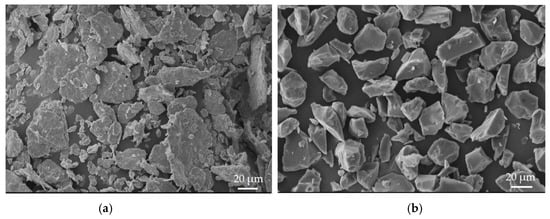
Figure 1.
Scanning electron microscopy (SEM) images of the raw powders: (a) irregular and flake iron powders; (b) irregular polygonal and angular boron carbide particles.
According to the SEM analysis, no flocculation or aggregates were observed inside the powders. It was found that the Fe powder had a high purity, of 99.8%, and that the B4C powder had a purity of 99.7%, as measured by a chemical characterization and impurity analysis with Wavelength Dispersive X-ray (WDX) and X-ray Fluorescence (XRF).
Before hot-pressing, mixtures of Fe + B4C powders were weighed with precision scales to provide four different volume fractions () of determined reinforcement percentages (un-reinforced, Fe + 5 vol.%, 10 vol.%, 20 vol.%, and 30 vol.% B4C) for 55 mm × 55 mm × 10 mm dimensions. The mixing of powders was carried out in different plastic containers for 1 h with a velocity of 100 rpm in the Turbula-T2F mixer (WAB-GROUP, Muttenz, Switzerland). The weights of the matrix and reinforcement powders were determined according to the rule of Mixture Equation (1), which requires that the total volumes of all composite specimens be constant.
where v is the volume fraction, M is the mass, ρ is the density, Vc is the volume of composite specimen, and subscripts m and r refer to the matrix and the reinforcement, respectively.
2.2. Fabrication of Test Specimens
The AISI H13 hot work tool steel die, which has a square hole with a dimension of 55 mm × 55 mm, was used for the fabrication of composites. The powder mixture was manually laid in the square die after the mixing process was completed. The compacting pressure was applied at room temperature using a uniaxial hydraulic press (max 250 tons). When a pressure of 250 MPa was applied, the heating of the die commenced simultaneously from the outer surface of the die, using a spiral heater. The compacting process shown in Figure 2 was carried out in a protective argon environment. Compacted composites were taken out of the die at room temperature after heating at 500 °C for 30 min under a constant pressure of 250 MPa. Before the sintering process, the compacted composite specimens were cut into pieces of 55 mm × 10 mm × 10 mm by wire erosion to obtain standard impact test specimens. The sintering treatments of the composite specimens were carried out in a high-temperature tubular furnace (Protherm PTF 18/75/300, Protherm, Ankara, Turkey) at 1000 °C for 30 min and 60 min under an argon environment. The heating rate was adjusted to 8 °C/min and then cooled to room temperature under the native conditions in the furnace. The composite specimens were encoded as follows: R0T30—un-reinforced composite (100 vol.% Fe) sintered for 30 min; R5T60—reinforced with a volume fraction of 5 vol.% B4C and sintered for 60 min, etc.
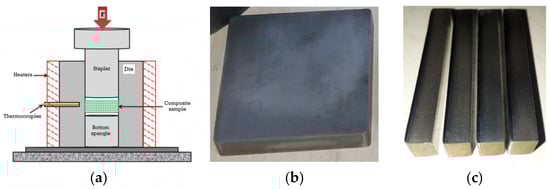
Figure 2.
(a) Schematic fabrication method of composite specimens under hot-pressing in a square die; fabricated composite specimen: (b) compacted Fe + 10% B4C after hot-pressing (55 mm × 55 mm × 10 mm); (c) sliced and sintered (60 min, 1000 °C) un-notched test specimens (55 mm × 10 mm × 10 mm).
2.3. Microstructural and Micromechanical Investigation
Microstructural evaluations were carried out using an optical microscope (Jenavert SL100, Carl Zeiss AG, Oberkochen, Germany) with 25–50× magnification, following the etching of polished surfaces—etched with a 5% nital solution. The formation and distribution of related phases were examined by X-ray diffraction (XRD) analysis, using the Bruker AXS D8 advance diffractometer (Bruker, Billerica, MA, USA) with Cu-Kα radiation (λ = 1.5417 Å), with an applied operating voltage of 25 kV and a current of 35 mA, and by SEM-EDX analysis, using the Carl Zeiss EVO LS10 scanning electron microscope (Carl Zeiss AG, Oberkochen, Germany) with SE1 detectors (secondary electron detectors) under high vacuum conditions, with an accelerating voltage of 25 kV.
The porosity of the sintered composites was determined by the Archimedes method using the Precisa XB 220A precision scale (Precisa Gravimetrics AG, Dietikon, Switzerland). For the rule of mixture, Equation (1) was used to calculate the theoretical density, and porosity was calculated using theoretical and actual density values.
After a metallographic analysis, macro- and microhardness were determined from cross-section surfaces with a Vickers indenter, using the Struers Duramin-5 hardness tester (Struers, Ballerup, Denmark). Five measurements were performed for each specimen to obtain the average hardness by applying a load of 2 kg (HV2) for 5 s. A 25 g (HV0.025) load was also applied to determine the hardness of the iron boride phases at the microscale.
2.4. Charpy Impact Test Setup
Powder metallurgy test specimens were prepared as un-notched, in accordance with the ASTM E23 and ASTM B925 standards. Charpy impact tests were carried out on the low-velocity drop weight test device (CEAST Fractovis Plus, Instron, Norwood, MA, USA) at room temperature. Blocks of composites were cut into slices by wire erosion and freely supported on anvils of the Charpy impact fixture, as shown schematically in Figure 3. The Charpy fixture and impactor are fully suited to the ASTM-E23 standards. The impactor head hit the specimen surface perpendicular to the powder-compacting direction.
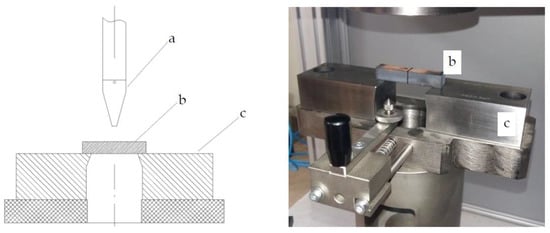
Figure 3.
Impact test setup: (a) impactor; (b) un-notched test specimen; (c) Charpy fixture.
Impact parameters were held constant for all impact tests, and the average room temperature was recorded as 21 °C. The weight of the impactor was 5.284 kg, and the height of the specimen surface was 579 mm. The impactor velocity was set at 3.37 m/s, with a resultant energy of 30 J. Energy losses due to air resistance and bearing friction were disregarded due to their small contribution. The anti-rebound system was activated, and repetitive impact tests were implemented on three different specimens with the same compositions under the same test conditions. An acquisition system (DAS16000) was used for monitoring and recording the contact force (N)−time (ms) data coming from the impactor, which was instrumented with a force transducer until the fracture occurred. The contact force values were reported by taking the average of three impact test data.
The kinetic energy change of the impactor head was determined in the time interval at which the contact force started and ended. The difference in the energy value just before the first contact of the impactor head with the test specimen (initial energy of impactor) and after breakage occurred indicates the fracture energy of the specimen.
3. Results and Discussion
3.1. Microstructure Observations
Figure 4 shows the optical micrographs of hot press-compacted Fe/B4C composites (0 vol.%, 5 vol.%, 10 vol.%, 20 vol.%, and 30 vol.% B4C) before the sintering process. The breakage of B4C particles was observed over the 5 vol.% B4C reinforced composites seen in Figure 4c–e, which might have occurred during the mixing or compacting stages.
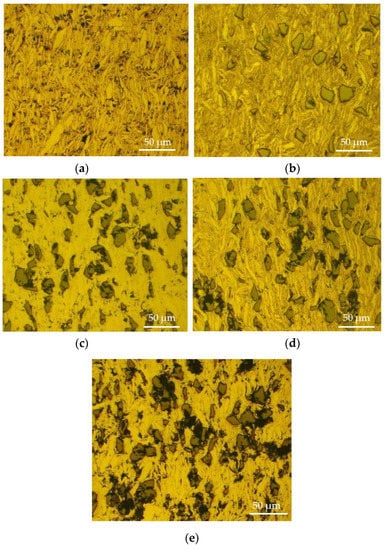
Figure 4.
Optical micrographs of unsintered Fe/B4C composites: (a) 100 vol.% Fe; (b) Fe + 5 vol.% B4C; (c) Fe + 10 vol.% B4C; (d) Fe + 20 vol.% B4C; (e) Fe + 30 vol.% B4C.
Figure 5 shows the optical microstructure images of the composites after the sintering process. The boundaries of the iron particles were more apparent after 60 min of sintering in the un-reinforced specimens (Figure 5b). Porosity formations are seen as dark black areas which increased with the reinforcement.
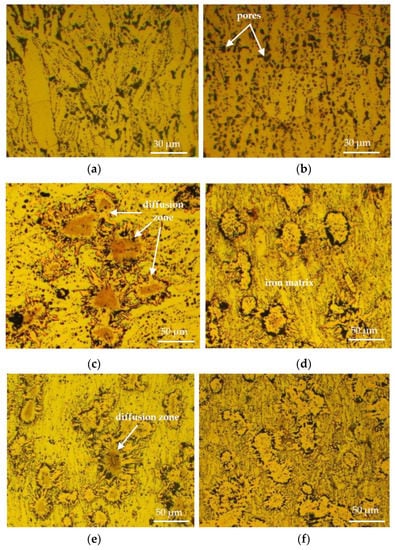
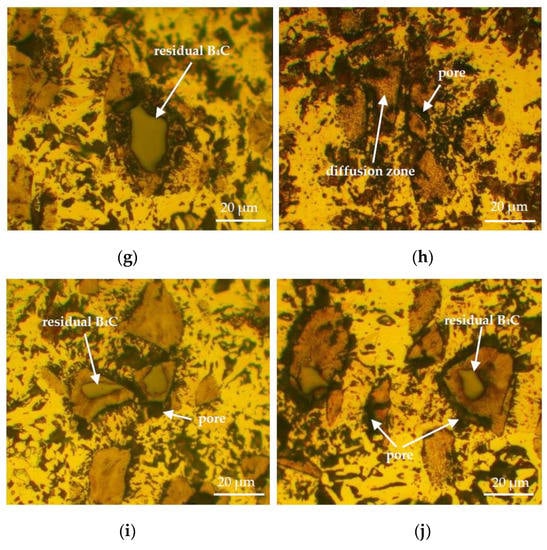
Figure 5.
Optical micrographs of sintered Fe/B4C specimens: un-reinforced iron composites sintered for (a) 30 min and (b) 60 min (R0T30, R0T60); Fe + 5 vol.% B4C sintered for (c) 30 min and (d) 60 min (R5T30, R5T60); Fe + 10 vol.% B4C sintered for (e) 30 min and (f) 60 min (R10T30, R10T60); Fe + 20 vol.% B4C sintered for (g) 30 min and (h) 60 min (R20T30, R20T60); Fe + 30 vol.% B4C sintered for (i) 30 min and (j) 60 min (R30T30, R30T60).
One of the remarkable microstructure observations was the formation of irregular and acicular (needle-shaped) diffusion zones, as seen in the composite specimens of Figure 5c–f and Figure 6, formed as a result of the diffusion of boron atoms into the iron matrix during sintering. In particular, distinctive formations were observed in 5 vol.% and 10 vol.% B4C reinforced composites. These in-situ reinforcement phases originated from the B4C particles and randomly scattered close to the boundaries of the B4C particles in the matrix. A similar situation was observed by Turov et al. [16].
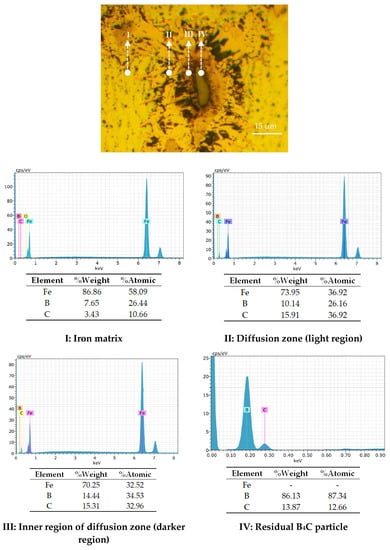
Figure 6.
Energy-dispersive X-ray spectroscopy (EDS) analyses for the Fe + 10 vol.% B4C (60 min sintered) composite throughout the iron matrix (I) and different points of the diffusion zone (II–IV).
Figure 5g–j shows the partial decomposition of B4C particles, which remained in residual form at the center of the diffusion zone, above the 5% volume fractions of reinforcement. Larger B4C particles remained in residual form in the structure.
In powder metallurgy, solid state diffusion plays a major role in the formation and growth of interfacial bonding, formed by the dissolution or reaction of the B4C particles and the iron matrix.
B4C particles break down below 1100 °C, and the iron boride phases form at the interface between B4C and iron. Depending on the duration and temperature of the sintering process, the boron content, and the particle size, a single phase (Fe2B) or two intermetallic phases (Fe2B, FeB) are formed by the diffusion of boron atoms into the iron based materials [20,21,22]. The solubility of boron in steel is higher than 0.004 percent at 1000 °C, and the rate of diffusion is about the same as that of carbon [28]. When the maximum solubility of boron in iron is reached, a solid state solution will be formed, because the solubility of boron in iron is limited. If the amount of boron in iron exceeds the solubility limit, boron cannot enter the iron lattice. The over-reinforcement or diffusion of boron will result in precipitation in the structure, generating an insoluble residue [29].
Residual or unreacted B4C particles act as a barrier to the diffusion of boron, resulting in residual particles. These particles are discontinuous and cause a preferential crack initiation between particle-matrix interfaces under tension or bending forces.
Energy-dispersive X-ray Spectroscopy (EDS) analysis, performed at different points of the diffusion zone (I–IV) (Figure 6), confirmed the presence of FeB and Fe2B phases, which formed during the reaction between Fe and B4C. Boron contents decreased from the origin of diffusion (or residual B4C particles) to the iron matrix. The EDS analysis revealed that the darker regions of the diffusion zone contained more boron (B) atoms, probably due to the existence of an FeB-intensive phase (Figure 6III), whereas the Fe2B phase is more dominant in the relatively light-colored region (Figure 6II). The XRD analysis, shown in Figure 7, revealed that the composites comprise the Fe2C and iron boride phases (Fe2B and FeB). In particular, the intensive Fe2B phase was observed in the Fe + 30 vol.% B4C composite.
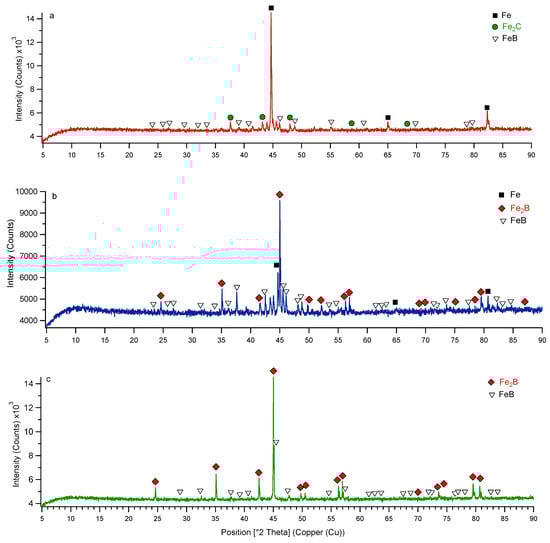
Figure 7.
X-ray Diffraction (XRD) spectrum of the 60 min sintered (a) Fe + 10 vol.% B4C; (b) Fe + 20 vol.% B4C; (c) Fe + 30 vol.% B4C composites.
As seen in Figure 8, enhanced porosity was observed as the reinforcement increased, and sintering duration did not have a noticeable effect on porosity. It was concluded that the reinforcement ratio was the effective factor for porosity. The differences between the iron and B4C particle geometries increased the voids. This difference may occur during the compaction stage; in particular, it can be more effective at high reinforcement ratios. Harder B4C powder has a greater effect on the compression behavior of the mixture, as a higher ratio of B4C is more resistant to compressibility than the iron powder. Another reason for the porosity was the dissociation of boron carbide particles from the contacted iron matrix after sintering the Fe-B4C powder mixtures, defined as diffusion porosity [29]. The increase of porosity also reduces the fracture energy, as it reduces the cross-sectional area exposed to fracture.
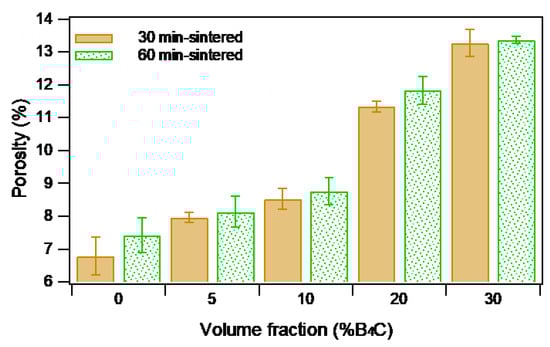
Figure 8.
Change in the porosity (%P) after the sintering process as a function of the reinforcement ratio.
A gradual increase was seen in the macrohardness of composites with increasing reinforcement ratio (Figure 9). The maximum hardness was measured as 447 HV for the R20T60 specimen. In particular, the increment of hardness became more prominent after the 10 vol.% B4C reinforcement ratio. A similar tendency was observed for the 30 min sintered composites, while the hardness of the 60 min sintered specimens was slightly higher than that of the 30 min sintered composites. The rising tendency of hardness values slowed down after the 20 vol.% reinforcement ratio for the 60 min-sintering composite. In addition to the porosity in the microstructure, possible changes in the grain sizes had an effect on the macrohardness values. Increased sintering duration may also have led to increased boride phases in the internal structure and, consequently, increased hardness.
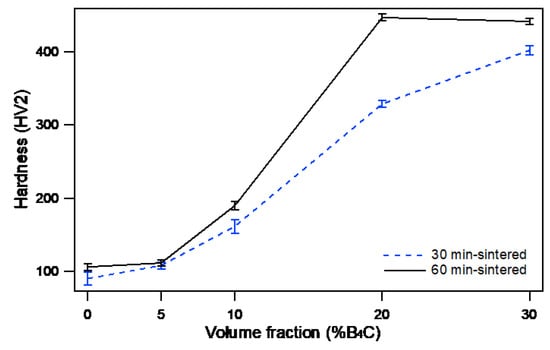
Figure 9.
Comparison of the macrohardness of un-reinforced and Fe/B4C composites with varied durations of sintering.
Hardness differences of the matrix and diffusion zones were demonstrated by the Vickers microhardness measurements (HV0.025). The variations of hardness and the traces of the Vickers indenter can be seen in Figure 10. The hardness varies throughout the diffusion zone, with the lowest value in the matrix and the highest one on the the B4C particles. The average hardness of the iron matrix was measured in the range of 84−102 HV0.025, while the diffusion zone was 5–7 times higher than the matrix as 540−640 HV0.025. Ozdemir et al. [22] reported that the hardness of boride on the pure iron was over 1700 HV0.01, and the hardness of pure iron was about 130 HV0.01. Nowacki et al. [25] found that the hardness of Fe-Fe2B phases changed across a wide range (150−1500 HV5), in which the proportion of the Fe2B phase increased (1800 HV0.1) as the total hardness of the specimen increased. [26].
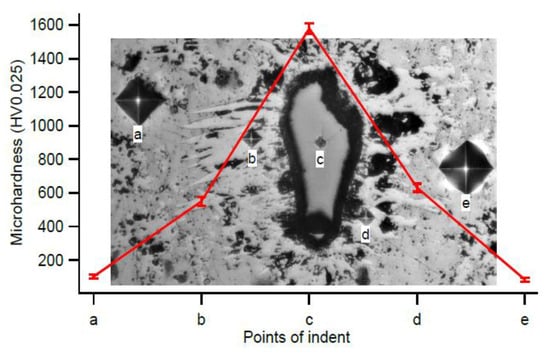
Figure 10.
Microhardness distribution of the Fe + 10 vol.% B4C (30 min sintered) composite throughout the matrix and diffusion zone (HV0.025).
3.2. Impact Behavior
The force−time alteration of repeated impact tests followed almost the same trend as the one seen in Figure 11 for 60 min sintered composites. The time axis in the contact force graph shows the time interval between the first contact of the impactor with the specimen surface and the moment when the specimen is broken. This characteristic period, which is defined as the “contact time” or “time to fracture”, was considered as the time until the specimen fractured. When the force−time graph was examined, it was clearly seen that the contact time values are different from each other. The contact time is mostly dependent on the composition of the specimens. It is noteworthy that the contact time is significantly reduced in highly reinforced specimens. The fracturing of the specimens at different contact times under the same impact loading is related to the different velocities of crack propagation along cross-sections with the same thickness. When considering the brittle composite, a higher velocity of the crack results in a lower contact time.
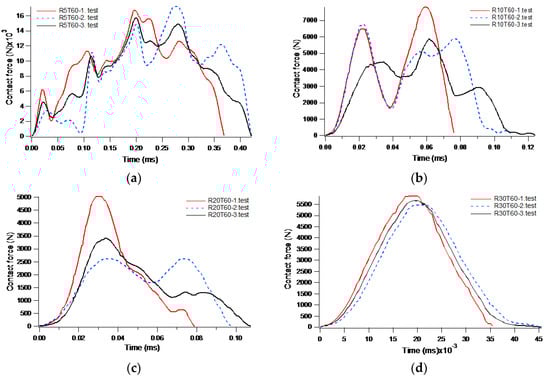
Figure 11.
Contact force versus time (F−t) curves after repeating impact tests of composites sintered for 60 minutes: (a) Fe + 5 vol.% B4C (R5T60); (b) Fe + 10 vol.% B4C (R10T60); (c) Fe + 20 vol.% B4C (R20T60); (d) Fe + 30 vol.% B4C (R30T60).
In the contact-force time histories it can be seen that the peak levels differ for each experiment. The multiaxial stresses and different crack propagation mechanisms constituted the fundamental differences for the variation of the force−time curves with a different number of peaks. The maximum peak point of the force−time curve was appointed as the maximum force (fracture force) of the tested specimen. At the maximum contact force, a crack occurred and progressed throughout the surface. With some exceptions, the contact force decreased after the maximum peak value in the decreasing cross-sectional area that resisted to the fracture of the specimen.
Lower peak values, occurred before and after the maximum contact forces are noteworthy in Figure 12a–e, respectively. The main reason was the change of direction of the crack’s propagation along the cross-section plane. The macrophoto analyses of fractured surfaces demonstrate this non-planar wave-shaped surface. Contactless friction and gaps between the tested specimens, the impactor and the fixture also affected the trend of the curve.
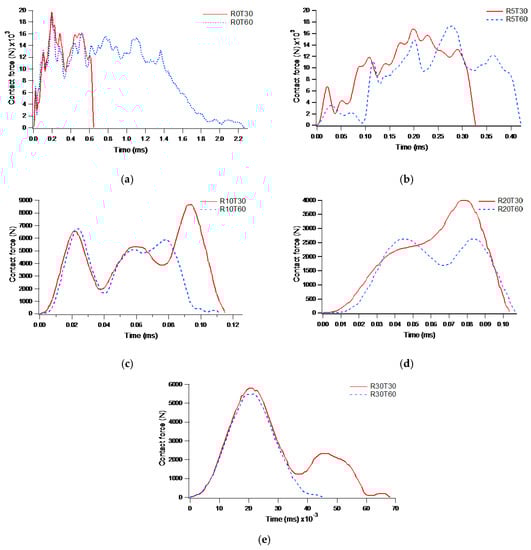
Figure 12.
Variation of contact force versus time (F−t) curves for: (a) un-reinforced iron specimen sintered for 30 min and 60 min (R0T30, R0T60); (b) Fe + 5 vol.% B4C sintered for 30 min and 60 min (R5T30, R5T60); (c) Fe + 10 vol.% B4C sintered for 30 min and 60 min (R10T30, R10T60); (d) Fe + 20 vol.% B4C sintered for 30 min and 60 min (R20T30, R20T60); (e) Fe + 30 vol.% B4C sintered for 30 min and 60 min (R30T30, R30T60).
The effect of sintering duration on the contact force−time behavior (F-t) is presented in Figure 12. A longer duration of sintering caused a negative effect on the fracture force values. While the relatively ductile iron matrix separated as a result of intensive plastic deformation, the breaking mechanism of the harder iron matrix with borided zones was fractured in brittle type. The number of peaks before fracture was reduced when the reinforcement content was increased. Hardness is commonly used for characterizing the brittleness of materials. Composite specimens gain the brittle character with the increase of hardness. The fracturing of brittle materials under dynamic loading results in a higher crack velocity, and fractured surfaces usually start out as relatively smooth surfaces. A brittle fracture can normally be identified by the smoothness of the fractured surface. When the fractured surface is smooth and perpendicular to the applied load, this is strong evidence that the fracture has a brittle component or phase that is also reflected in the force−time curve.
The profile of the contact force curve changed according to the different cases of crack propagation, depending on whether it passed over the borided zone, pores, B4C particles or the iron matrix. The behavior of the crack was affected by the internal structure of the composites. Since the brittle and ductile regions have different separation mechanisms under loading, the progress of the crack in these regions was also variable, resulting in a fluctuation of the force−time curve. The brittle fracture has been identified by a higher crack propagation velocity when compared with ductile fractures, where the contact times decreased considerably with increasing reinforcement.
A schematical representation of the crack propagation throughout the cross-section of the tested specimens and the effects of the microstructure on the force−time curve is seen in Figure 13.
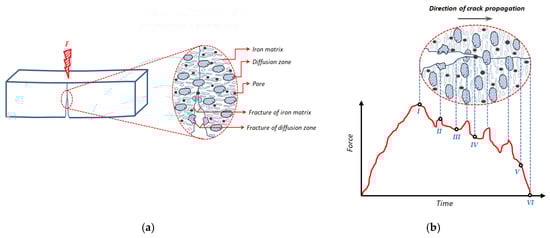
Figure 13.
Representation of: (a) the propagation of cracks throughout the cross-section of the composite specimen; (b) the effect of the microstructure on the contact force−time curve.
The crack, formed at point (I), continued to progress in the structure. When the hard borided zone at point (II) was reached, the resistance to fracture increased momentarily. At point (III), the crack propagation was smoother when it passed the matrix, corresponding to low force values, and these became even lower when it passed through a pore at point (IV). The reduction of the cross-sectional area, as the crack continued to propagate, caused a rapid decrease in the contact force (V) and the test specimen to break completely (VI).
The variation of the impactor energy is presented in Figure 14. According to the graphs, it was seen that the increase of sintering duration had a negative effect on the fracture energy values, particularly at higher volume fractions.
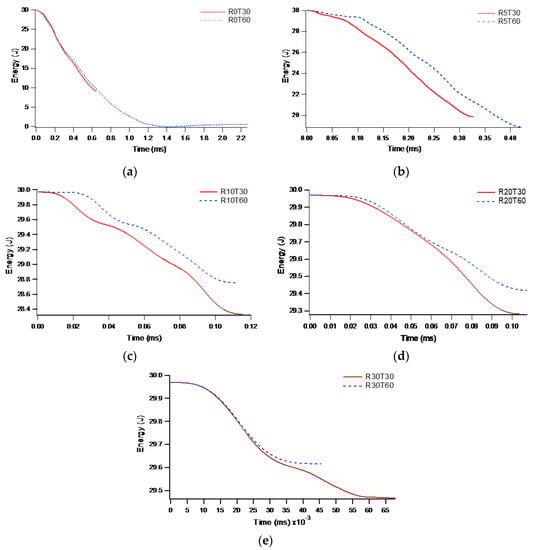
Figure 14.
Variation of energy versus time (E−t) curves of impactor for: (a) un-reinforced iron specimen sintered for 30 min and 60 min (R0T30, R0T60); (b) Fe + 5 vol.% B4C sintered for 30 min and 60 min (R5T30, R5T60); (c) Fe + 10 vol.% B4C sintered for 30 min and 60 min (R10T30, R10T60); (d) Fe + 20 vol.% B4C sintered for 30 min and 60 min (R20T30, R20T60); (e) Fe + 30 vol.% B4C sintered for 30 min and 60 min (R30T30, R30T60).
The comparison of the contact force and the impactor energy variations for all the tested specimens sintered under the same conditions is presented in Figure 15 and Figure 16. The maximum force values and impactor energies exhibited different behaviors for different volume fractions. Energy differences were defined by the symbols E1, E2, E3, E4, and E5 for volume fractions of 0%, 5%, 10%, 20%, and 30% B4C, respectively, for 30 minute sintered specimens, as shown in Figure 15b.
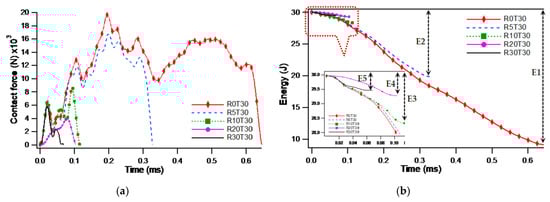
Figure 15.
Comparison of 30 min sintered test specimens for: (a) contact force−time (F−t); (b) energy-time (E−t) curves of impactor; the inset is a magnification of the region indicated by the red dashed line.
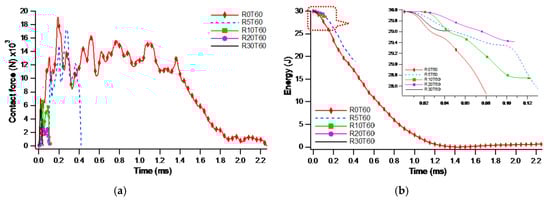
Figure 16.
Comparison of 60 min sintered test specimens for: (a) contact force−time (F−t); (b) energy−time (E−t) curves of impactor; the inset is a magnification of the region indicated by the red dashed line.
Figure 17 shows the category plots of maximum contact forces and fracture energy with respect to the reinforcement ratios and sintering duration. Both the maximum force and the absorbed energy values decreased with increasing volume fractions for each sintering duration.
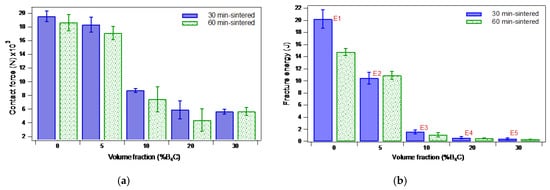
Figure 17.
Comparison of un-reinforced Fe and Fe/B4C composites with varied durations of sintering: (a) maximum contact forces; (b) fracture energy.
Un-reinforced specimens (100 vol.% Fe) had the highest fracture energy for both sintering durations. In particular, the reduction in fracture energy was greater for composites with a volume fraction above 5% B4C.
3.3. Fractographical Analysis
According to the macrophotos of flank and upper surfaces in Figure 18, the fractured surfaces referred to a brittle-type fracture which appeared to be granular and shiny. The propagation of the crack appeared to be of irregular morphology, increased with the reinforcement ratios. The irregular crack propagation was induced by the presence of various obstacles in the structure, such as different hardness zones and the inhomogeneous distribution of boride phases and residual particles. During the propagation, a crack changes direction when faced with these different zones. Regarding the fractured surfaces, the un-reinforced specimen had a planar surface, while the composites showed a wavy profile, as seen in Figure 18’s upper surfaces.
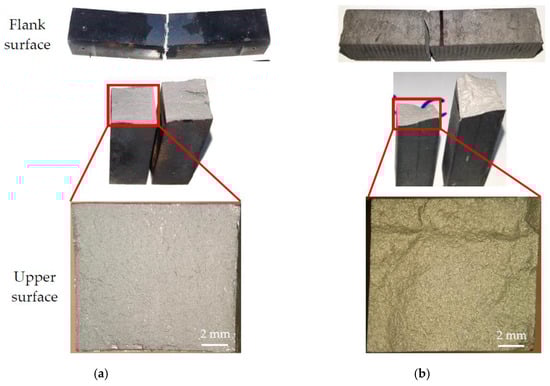
Figure 18.
Images of the fractured test specimens from the flank and upper surfaces: (a) un-reinforced (R0T60); (b) Fe + 20 vol.% B4C (R20T60) composite.
The cracks have propagated neither in the centreline of the specimens nor throughout the flank surface, as seen in Figure 18. Microcrack initiation and the propagation of cracks were very sensitive to the location of the notch in the composite specimens. The crack first started at the high stress concentration notch, exposed to tensile loading, and then extended to the spreading zone. Non-planar crack propagation and the growth path of the crack also influenced the impact behavior of the composites. The difference between the start point of the crack and the centreline of the specimen, where the impactor contacted the composite on the same axis, caused specimens to sufer damages at different energy levels and contact forces, which was the cause of the standard deviation.
The difference in the fracture morphologies of the iron matrix and the diffusion zone are shown in SEM images (Figure 19, Figure 20, Figure 21 and Figure 22). The nature of the fracture mode changed from ductile to brittle as the reinforcement ratio increased, even at low volume fractions (5% and 10% B4C), as shown in Figure 20 and Figure 21a.
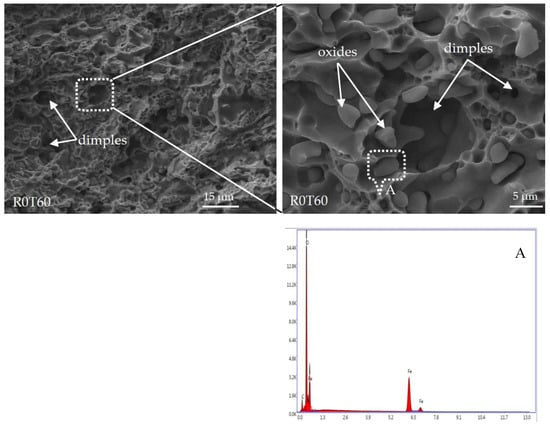
Figure 19.
SEM images of the fractured surface from the 60 min sintered un-reinforced test specimen (100 vol.% Fe), and EDX spectrum of the region of A indicated by the white dashed line.
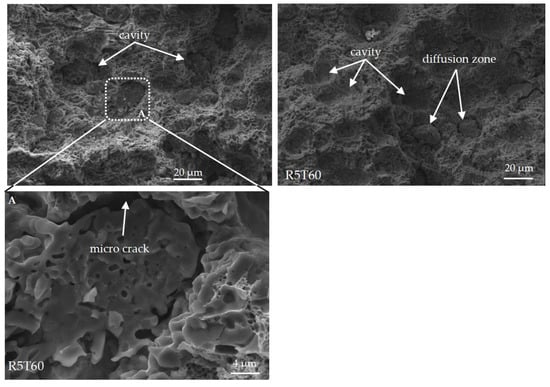
Figure 20.
SEM images of fractured surfaces from the 60 min sintered Fe + 5 vol.% B4C test specimen, A: the magnified region of the white dashed line.
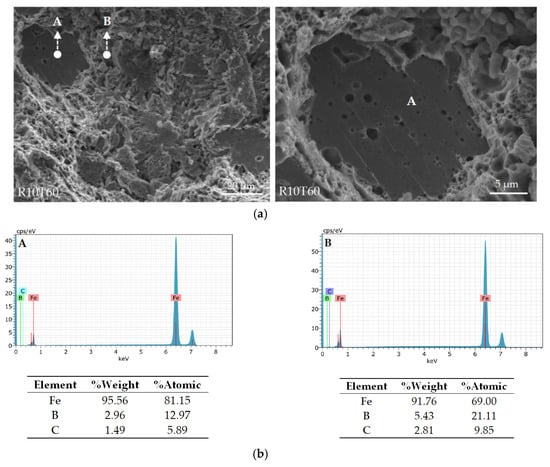
Figure 21.
(a) SEM images of fractured surfaces from the 60 min sintered Fe + 10 vol.% B4C test specimen; (b) EDS analysis of the points indicated by the dashed arrow line in (a): A iron matrix and B borided zone.
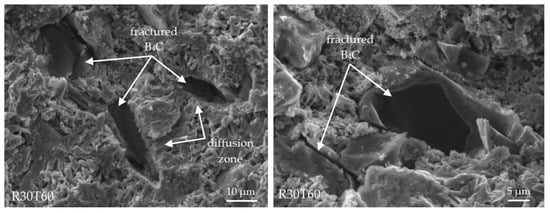
Figure 22.
SEM images of fractured surfaces from the 60 min sintered Fe + 30 vol.% B4C test specimen.
The fracture surface of the un-reinforced specimen is characterized by the presence of intensive dimples, as shown in Figure 19. Dimples were observed randomly on the fracture surface, and fracture damage occurred as a result of the combining of these dimples during crack propagation. In addition, oxide formations with a spherical geometry were also observed in the SEM images and proved with EDX analysis, as seen in Figure 19. These oxides, which may be formed during surface polishing processes, are difficult to distinguish from oxides formed during the fabrication process of specimens and come from raw powder.
It was observed that distinctive cavities occurred when the diffusion zones separated from the matrix surface (Figure 20). If a crack is obstructed by a well-bonded matrix, diffusion zones, or residual particles, it tends to remain constant or to spread around the particle or diffusion zone. If the interfacial adhesion is strong between the matrix and the reinforcement particle interface, damage will occur by breaking the harder regions in the composites. Microcracks were also observed around hard diffusion zones, as confirmed by the SEM images of the R5T60 specimen in Figure 20 (Area A). The magnified region of A in Figure 20 refers to the transgranular fracture of the hard diffusion zone, which encircled the microcrack. In Figure 21, point A refers to a brittle-type fracture with a sharp crack in the iron matrix. The EDS analysis also revealed the difference between the borided zone and the iron matrix on the fractured Fe + 10% B4C test specimen seen in Figure 21b.
Figure 22 shows the fracture surfaces of the R30T60 specimen. The diffusion zones can be easily distinguished in the fractured surface around residual B4C particles with their acicular- and columnar-shaped morphology. Residual B4C particles fractured and broke into pieces under impact loading, as seen in Figure 22. Residual particles and such fracture types were not observed in composites reinforced below 20 vol.% B4C.
4. Conclusions
In this study, the effects of in-situ synthesized boride phases on the impact behavior of iron-based B4C particle-reinforced composites were investigated. Fabrication and comprehensive metallographic characterizations were performed. Low-velocity impact tests were conducted and their mechanical behavior was examined in detail.
By analyzing the obtained results, the important findings of this study can be summarized as follows:
- (1)
- Boride phases formed in the internal structure significantly increased the hardness of the composites; on the other hand, the fracture force and impact energy decreased. An increased sintering duration may also lead to increased boride phases and consequently increases hardness, whereas it caused a negative effect on the fracture force values.
- (2)
- B4C composites reinforced over 20 vol.% had residual B4C particles, surrounded by the diffusion zones. These B4C particles fractured and broke into pieces after the impact tests.
- (3)
- The crack propagation and fractured surface morphologies were affected by the distribution and the presence of diffusion zones, porosity, and the residual B4C particles. When the bonding between the newly formed phases and the matrix was stronger, fracture occurred by the breaking of residual particles.
- (4)
- Residual B4C particles acted as an impurity factor and caused stress accumulation in the higher volume fractions, while the borided zones led to the strengthening of the interfacial bonding.
- (5)
- The determination of the upper limit of the reinforcement ratio is crucial to achieve the best impact properties, i.e., those that do not allow the formation of residual particles due to an impairment of the mechanical properties.
Author Contributions
The authors collaborated with each other to obtain high-quality research work. F.N. performed the material and procedure selection, analyzed the data, and designed the structure of this paper. M.H. was responsible for the fabrication of test specimens, metallographic preparation, and microstructure characterization of test specimens. He also performed the analysis of the data and designed the structure of this paper. All authors have read and agreed to the published version of the manuscript.
Funding
This research was funded by Erciyes University Scientific Research Projects Coordination Unit, grant number FOA-2014-4997, and the Scientific and Technological Research Council of Turkey (TUBITAK), grant number 117M542.
Acknowledgments
The authors are grateful for the financial support of the Erciyes University Scientific Research Projects Coordination Unit and Scientific and Technological Research Council of Turkey (TUBITAK). The authors are also thankful to Afşin Alper Cerit for help in the development of the experimental setup, and for useful discussions throughout the progress of this work.
Conflicts of Interest
The authors declare no conflicts of interest.
References
- Su, Y.; Ouyang, Q.; Zhang, W.; Li, Z.; Guo, Q.; Fan, G.; Zhang, D. Composite structure modeling and mechanical behavior of particle reinforced metal matrix composites. Mater. Sci. Eng. A 2014, 597, 359–369. [Google Scholar] [CrossRef]
- Safri, S.N.A.; Sultan, M.T.H.; Yidris, N.; Mustapha, F. Low Velocity and High Velocity Impact Test on Composite Materials-A Review. Int. J. Eng. Sci. 2014, 3, 50–60. [Google Scholar]
- Sjoblom, P.O.; Hartness, J.T.; Cordell, T.M. On Low-Velocity Impact Testing of Composite Materials. J. Compos. Mater. 1998, 22, 30–52. [Google Scholar] [CrossRef]
- Straffelini, G.; Molinari, A.; Danninger, H. Impact notch toughness of high-strength porous steels. Mater. Sci. Eng. A 1999, 272, 300–309. [Google Scholar] [CrossRef]
- Straffelini, G. Impact Fracture Toughness of Porous Iron and High-Strength Steels. Metall. Mater. Trans. A 2000, 31, 1443–1451. [Google Scholar] [CrossRef]
- Şahin, Ö.S.; Güneş, A.; Aslan, A.; Salur, E.; Karadağ, H.B.; Akdemir, A. Low-Velocity Impact Behavior of Porous Metal Matrix Composites Produced by Recycling of Bronze and Iron Chips. Iran. J. Sci. Technol. Trans. Mech. Eng. 2017, 43, 53–60. [Google Scholar] [CrossRef]
- Ratto, P.J.J.; Ansaldi, A.F.; Fierro, V.E.; Agüera, F.R.; Villar, H.N.A.; Sikora, J.A. Low Temperature Impact Tests in Austempered Ductile Iron and Other Spheroidal Graphite Cast Iron Structures. ISIJ Int. 2001, 41, 372–380. [Google Scholar] [CrossRef][Green Version]
- Hufenbach, W.; Ibraim, F.M.; Langkamp, A.; Böhm, R.; Hornig, A. Charpy impact tests on composite structures–An experimental and numerical investigation. Compos. Sci. Technol. 2008, 68, 2391–2400. [Google Scholar] [CrossRef]
- Toktaş, G.; Tayanç, M.; Toktaş, A. Effect of matrix structure on the impact properties of an alloyed ductile iron. Mater. Charact. 2006, 57, 290–299. [Google Scholar] [CrossRef]
- Shahabodin, E.; Saeedi, H.M.; Reza, B.H.; Naser, E. Effect of Iron on the wetting, sintering ability, and the physical and mechanical properties of Boron Carbide composites: A review. Int. J. Refract. Met. Hard Mater. 2016, 57, 78–92. [Google Scholar] [CrossRef]
- Dudrová, E.; Kabátová, M. Fractography of Sintered Iron and Steels. Powder Metall. Prog. 2008, 8, 59–75. [Google Scholar]
- Shanmugasundaram, D.; Chandramouli, R. Tensile and impact behaviour of sinter-forged Cr, Ni and Mo alloyed powder metallurgy steels. Mater. Des. 2009, 30, 3444–3449. [Google Scholar] [CrossRef]
- Ozden, S.; Ekici, R.; Nair, F. Investigation of impact behaviour of aluminium based SiC particle reinforced metal–matrix composites. Compos. Part A Appl. Sci. Manuf. 2007, 38, 484–494. [Google Scholar] [CrossRef]
- Gustafsson, G.; Nishida, M.; Häggblad, H.Å.; Kato, H.; Jonsén, P.; Ogura, T. Experimental studies and modelling of high-velocity loaded iron-powder compacts. Powder Technol. 2014, 268, 293–305. [Google Scholar] [CrossRef]
- Montealegre-Melendez, I.; Arevalo, C.; Ariza, E.; Perez-Soriano, E.M.; Rubio-Escudero, C.; Kitzmantel, M.; Neubauer, E. Analysis of the Microstructure and Mechanical Properties of Titanium-Based Composites Reinforced by Secondary Phases and B4C Particles Produced via Direct Hot Pressing. Materials 2017, 10, 1240. [Google Scholar] [CrossRef] [PubMed]
- Turov, Y.V.; Khusid, B.M.; Voroshnin, L.G.; Khina, B.B.; Kozlovskii, I.L. Gas transport processes in sintering of an iron-boron carbide powder composite. Sov. Powder Metall. Ceram. 1989, 28, 618–622. [Google Scholar] [CrossRef]
- Üçisik, A.H.; Bindal, C. Fracture toughness of boride formed on low-alloy steels. Surf. Coat. Technol. 1997, 94–95, 561–565. [Google Scholar] [CrossRef]
- Korol’kov, V.V.; Kibak, B. Sintering mechanism of iron powder with microadditions of boron. Powder Metall. Met. Ceram. 1997, 36, 470–473. [Google Scholar] [CrossRef]
- Aizenshtein, M.; Mizrahi, I.; Froumin, N.; Hayun, S.; Dariel, M.P.; Frage, N. Interface interaction in the B4C/(Fe–B–C) system. Mater. Sci. Eng. A 2008, 495, 70–74. [Google Scholar] [CrossRef]
- Turov, Y.V.; Khusid, B.M.; Voroshnin, L.G.; Khina, B.B.; Kozlovskii, I.L. Structure formation in sintering iron-boron carbide powder composite. Powder Metall. Ceram. 1993, 32, 465–470. [Google Scholar]
- Mizrahi, I.; Raviv, A.; Dilman, H.; Aizenshtein, M.; Dariel, M.P.; Frage, N. The effect of Fe addition on processing and mechanical properties of reaction infiltrated boron carbide-based composites. J. Mater. Sci. 2007, 42, 6923–6928. [Google Scholar] [CrossRef]
- Ozdemir, O.; Usta, M.; Bindal, C.; Ucisik, A.H. Hard iron boride (Fe2B) on 99.97wt% pure iron. Vacuum 2006, 80, 1391–1395. [Google Scholar] [CrossRef]
- Abenojar, J.; Velasco, F.; Martinez, M.A. Influence of carbon and aluminium additions on the Fe–10% B(wt.) system. J. Mater. Process. Technol. 2003, 143–144, 28–33. [Google Scholar] [CrossRef]
- Campos, I.; Torres, R.; Ramírez, G.; Ganem, R.; Martínez, J. Growth kinetics of iron boride layers: Dimensional analysis. Appl. Surf. Sci. 2006, 252, 8662–8667. [Google Scholar] [CrossRef]
- Nowacki, J.; Klimek, L. Structure and properties of Fe-Fe2B cermets. J. Mater. Sci. 1992, 27, 3651–3656. [Google Scholar] [CrossRef]
- Nowacki, J.; Klimek, L. The mechanism of reaction sintering of iron-iron boride cermets. J. Mater. Sci. 1993, 28, 3939–3944. [Google Scholar] [CrossRef]
- Martini, C.; Palombarini, G.; Carbucicchio, M. Mechanism of thermochemical growth of iron borides on iron. J. Mater. Sci. 2004, 39, 933–937. [Google Scholar] [CrossRef]
- Busby, P.E.; Warga, M.E.; Wells, C. Diffusion and Solubility of Boron in Iron and Steel. J. Met. 1953, 5, 1463–1468. [Google Scholar] [CrossRef]
- Bagliuk, G. Properties and Structure of Sintered Boron Containing Carbon Steels. In Sintering—Methods and Products; Shatokha, V., Ed.; InTech: London, UK, 2012; pp. 249–266. [Google Scholar]


© 2020 by the authors. Licensee MDPI, Basel, Switzerland. This article is an open access article distributed under the terms and conditions of the Creative Commons Attribution (CC BY) license (http://creativecommons.org/licenses/by/4.0/).