A Numerical Study of the Effect of Isotropic Hardening Parameters on Mode I Fatigue Crack Growth


Abstract
:1. Introduction
2. Elastic–Plastic Material Model
3. Numerical Model
4. Results
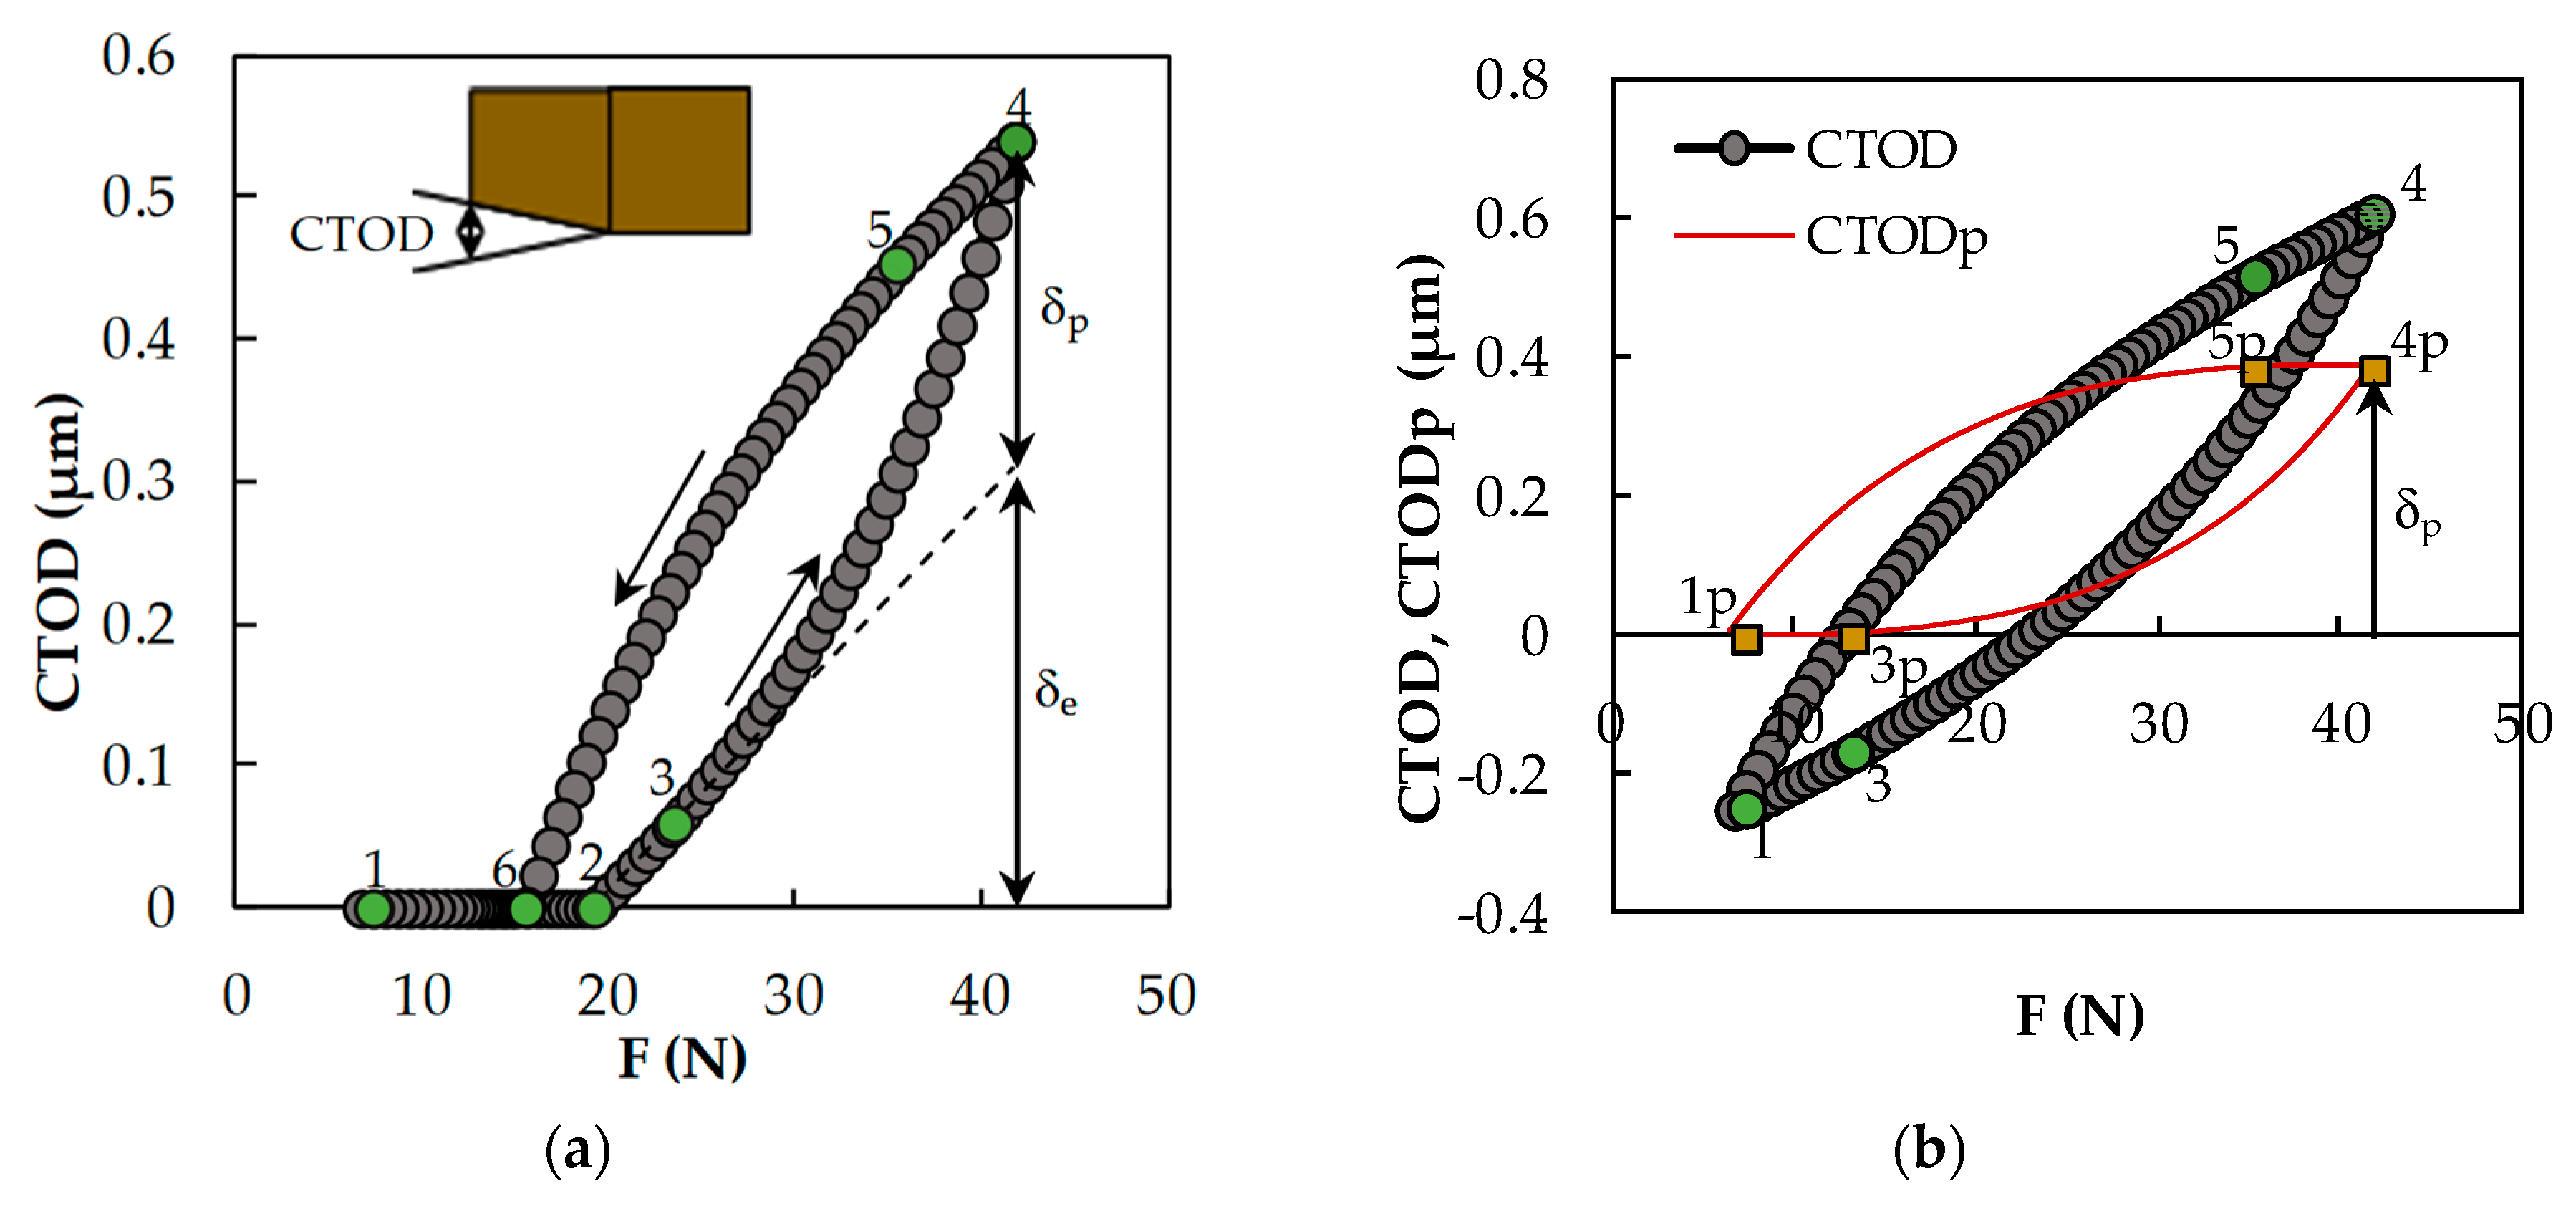
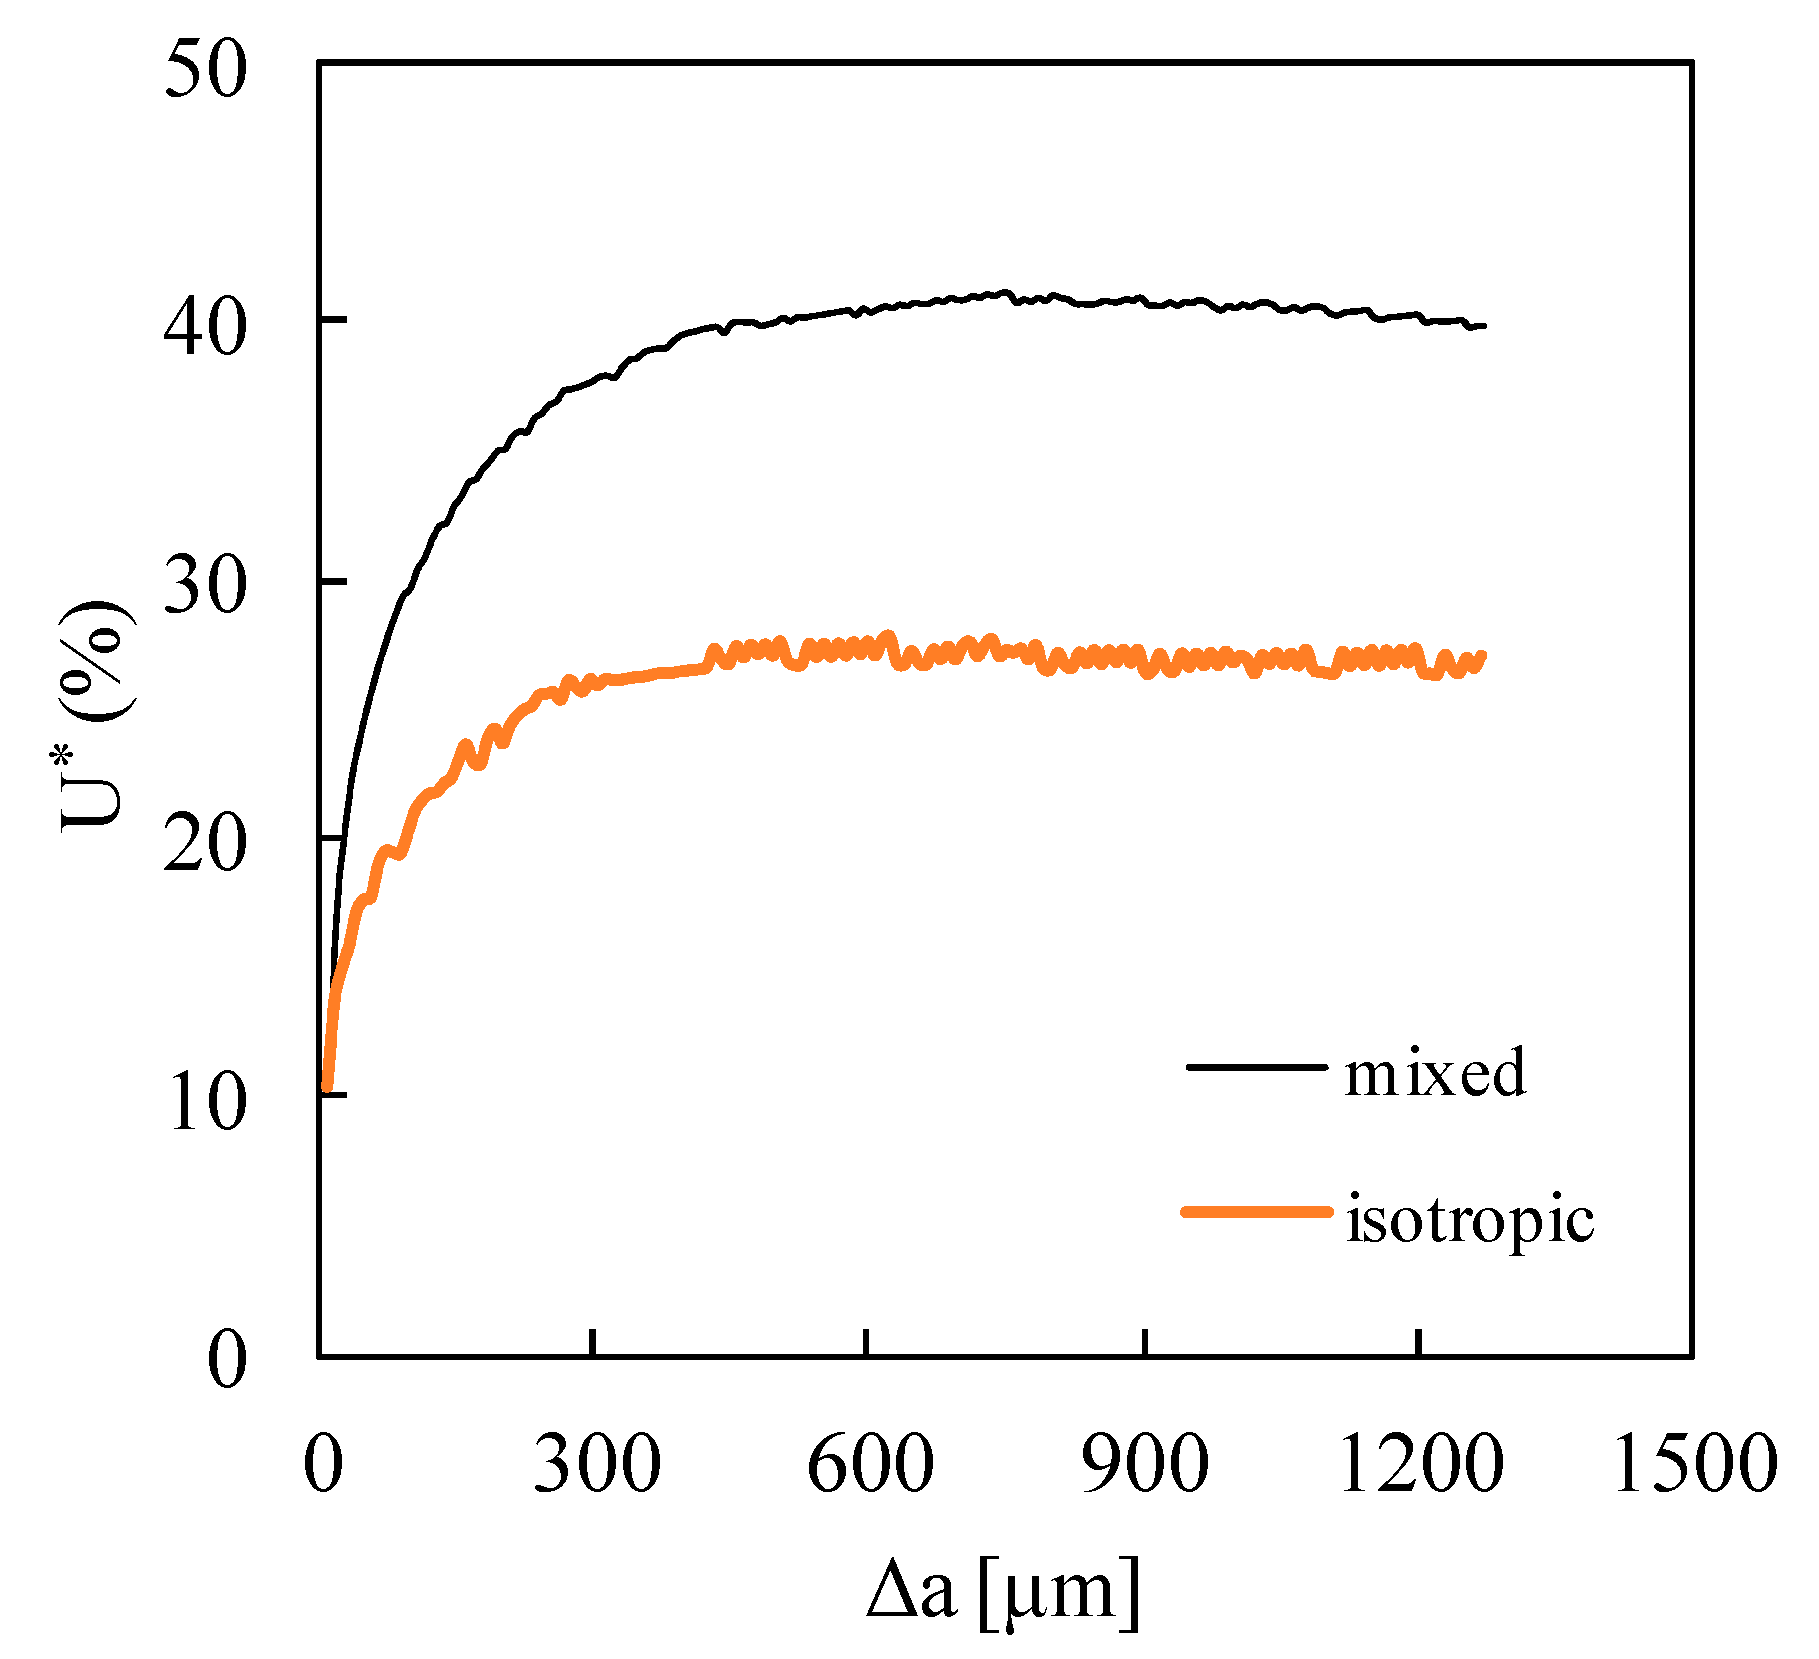
4.1. Typical Curves
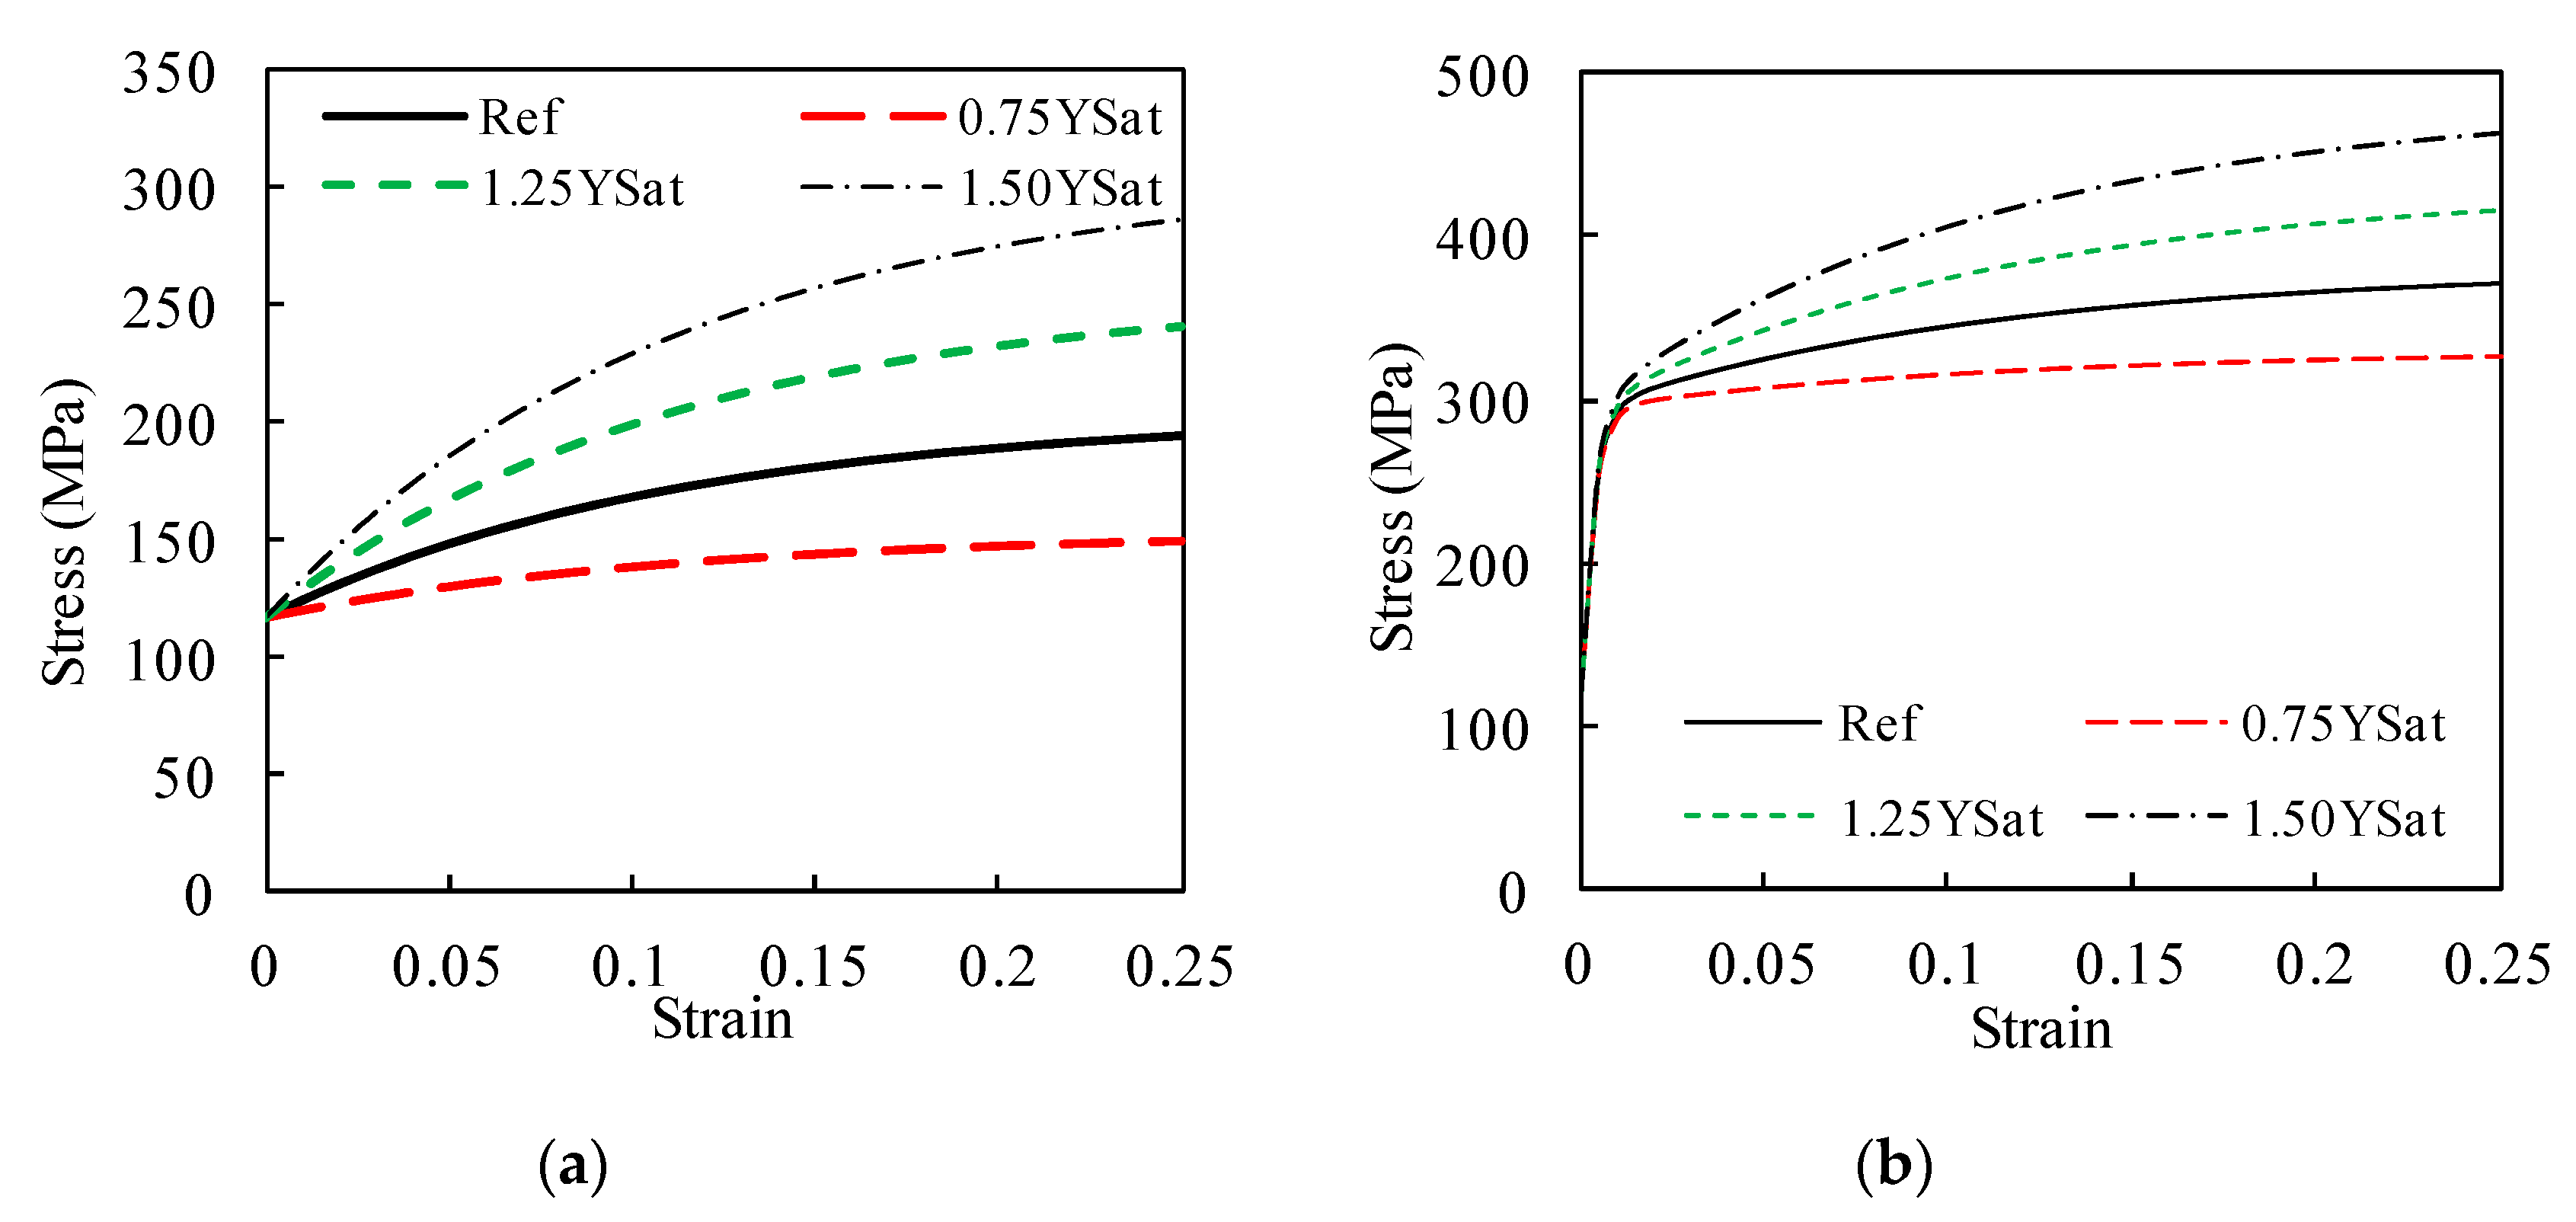
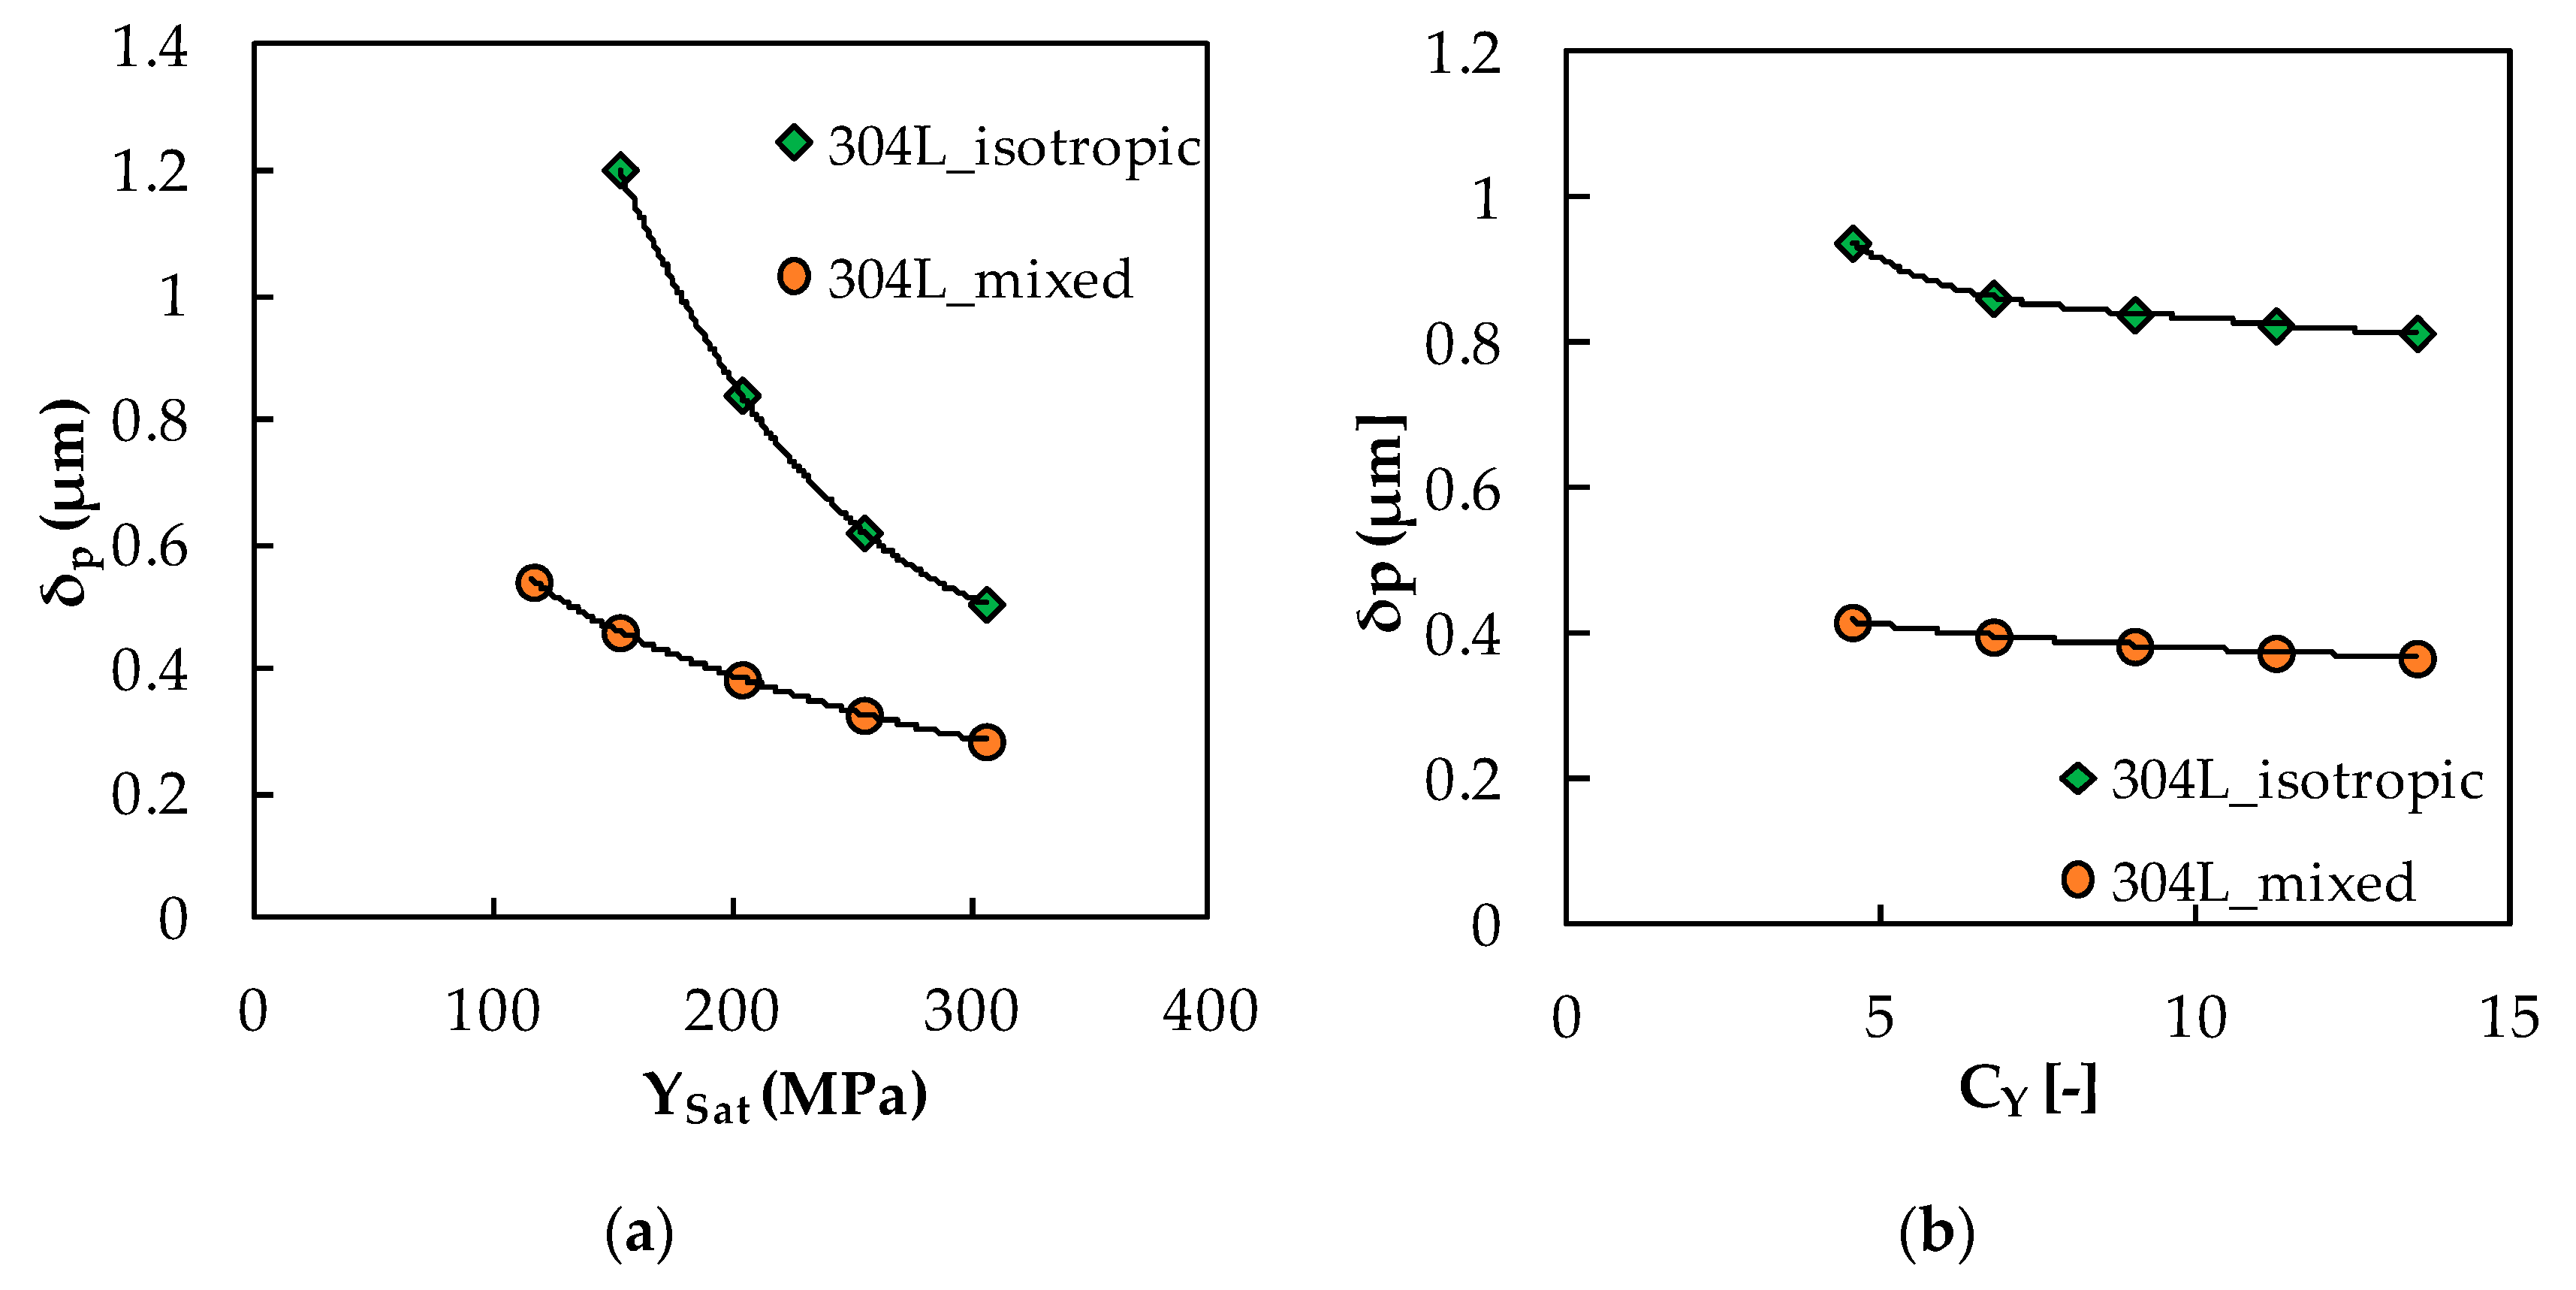
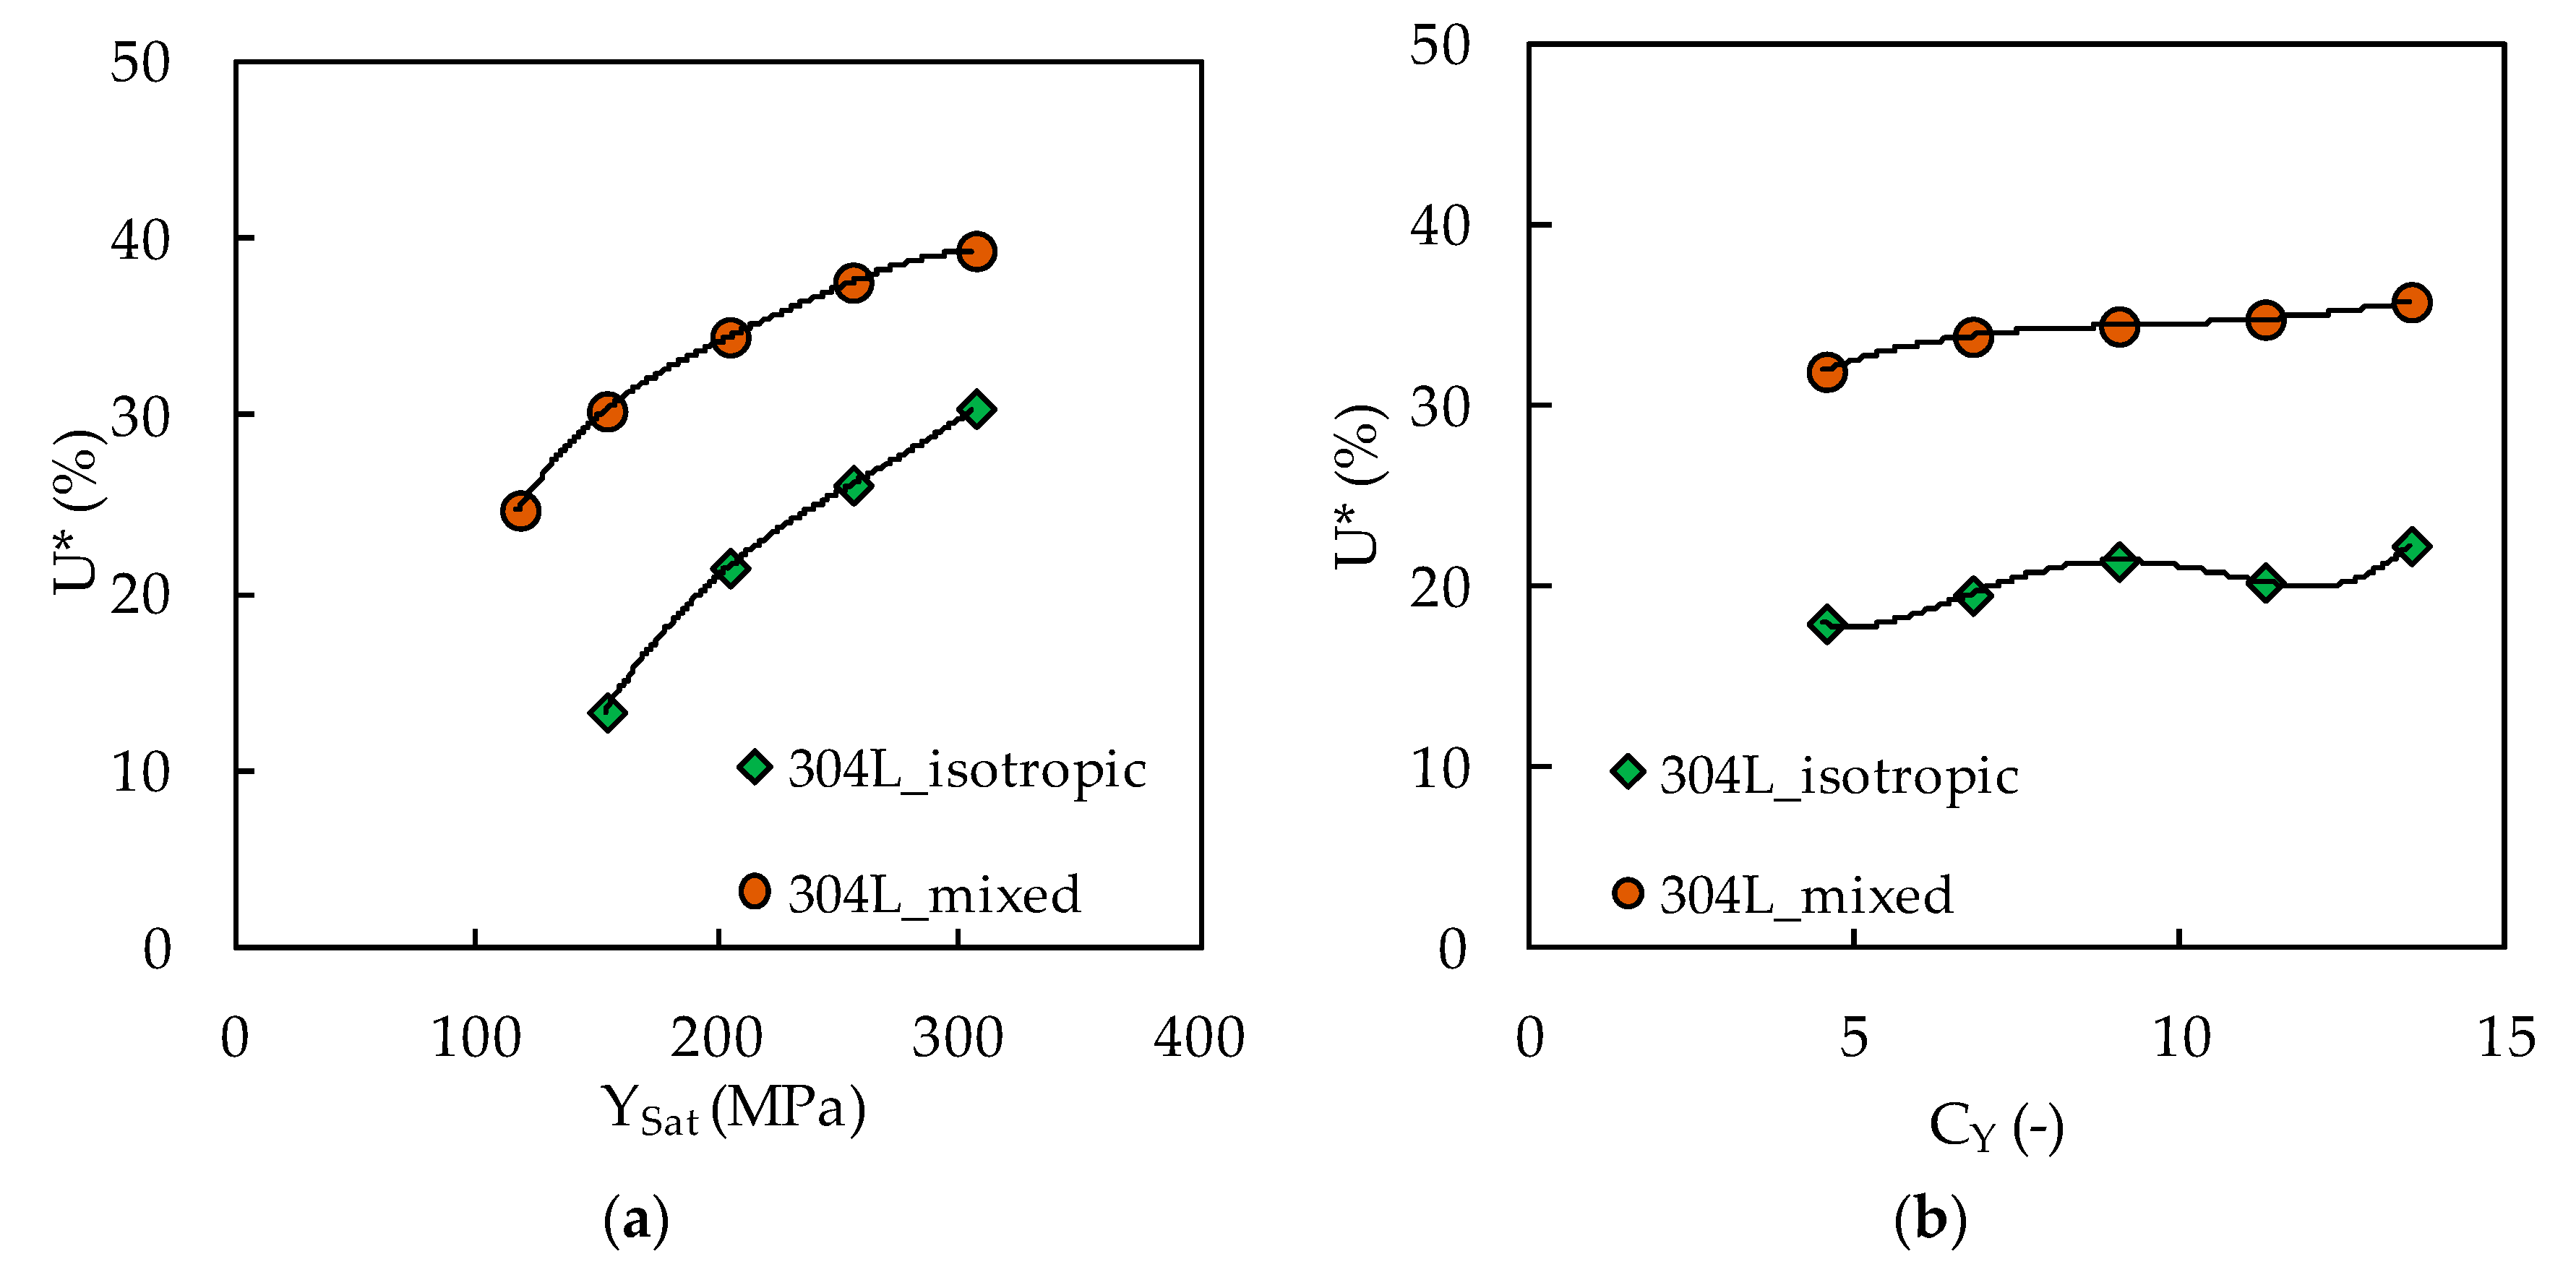
4.2. Effect of YSat and CY without Crack Closure
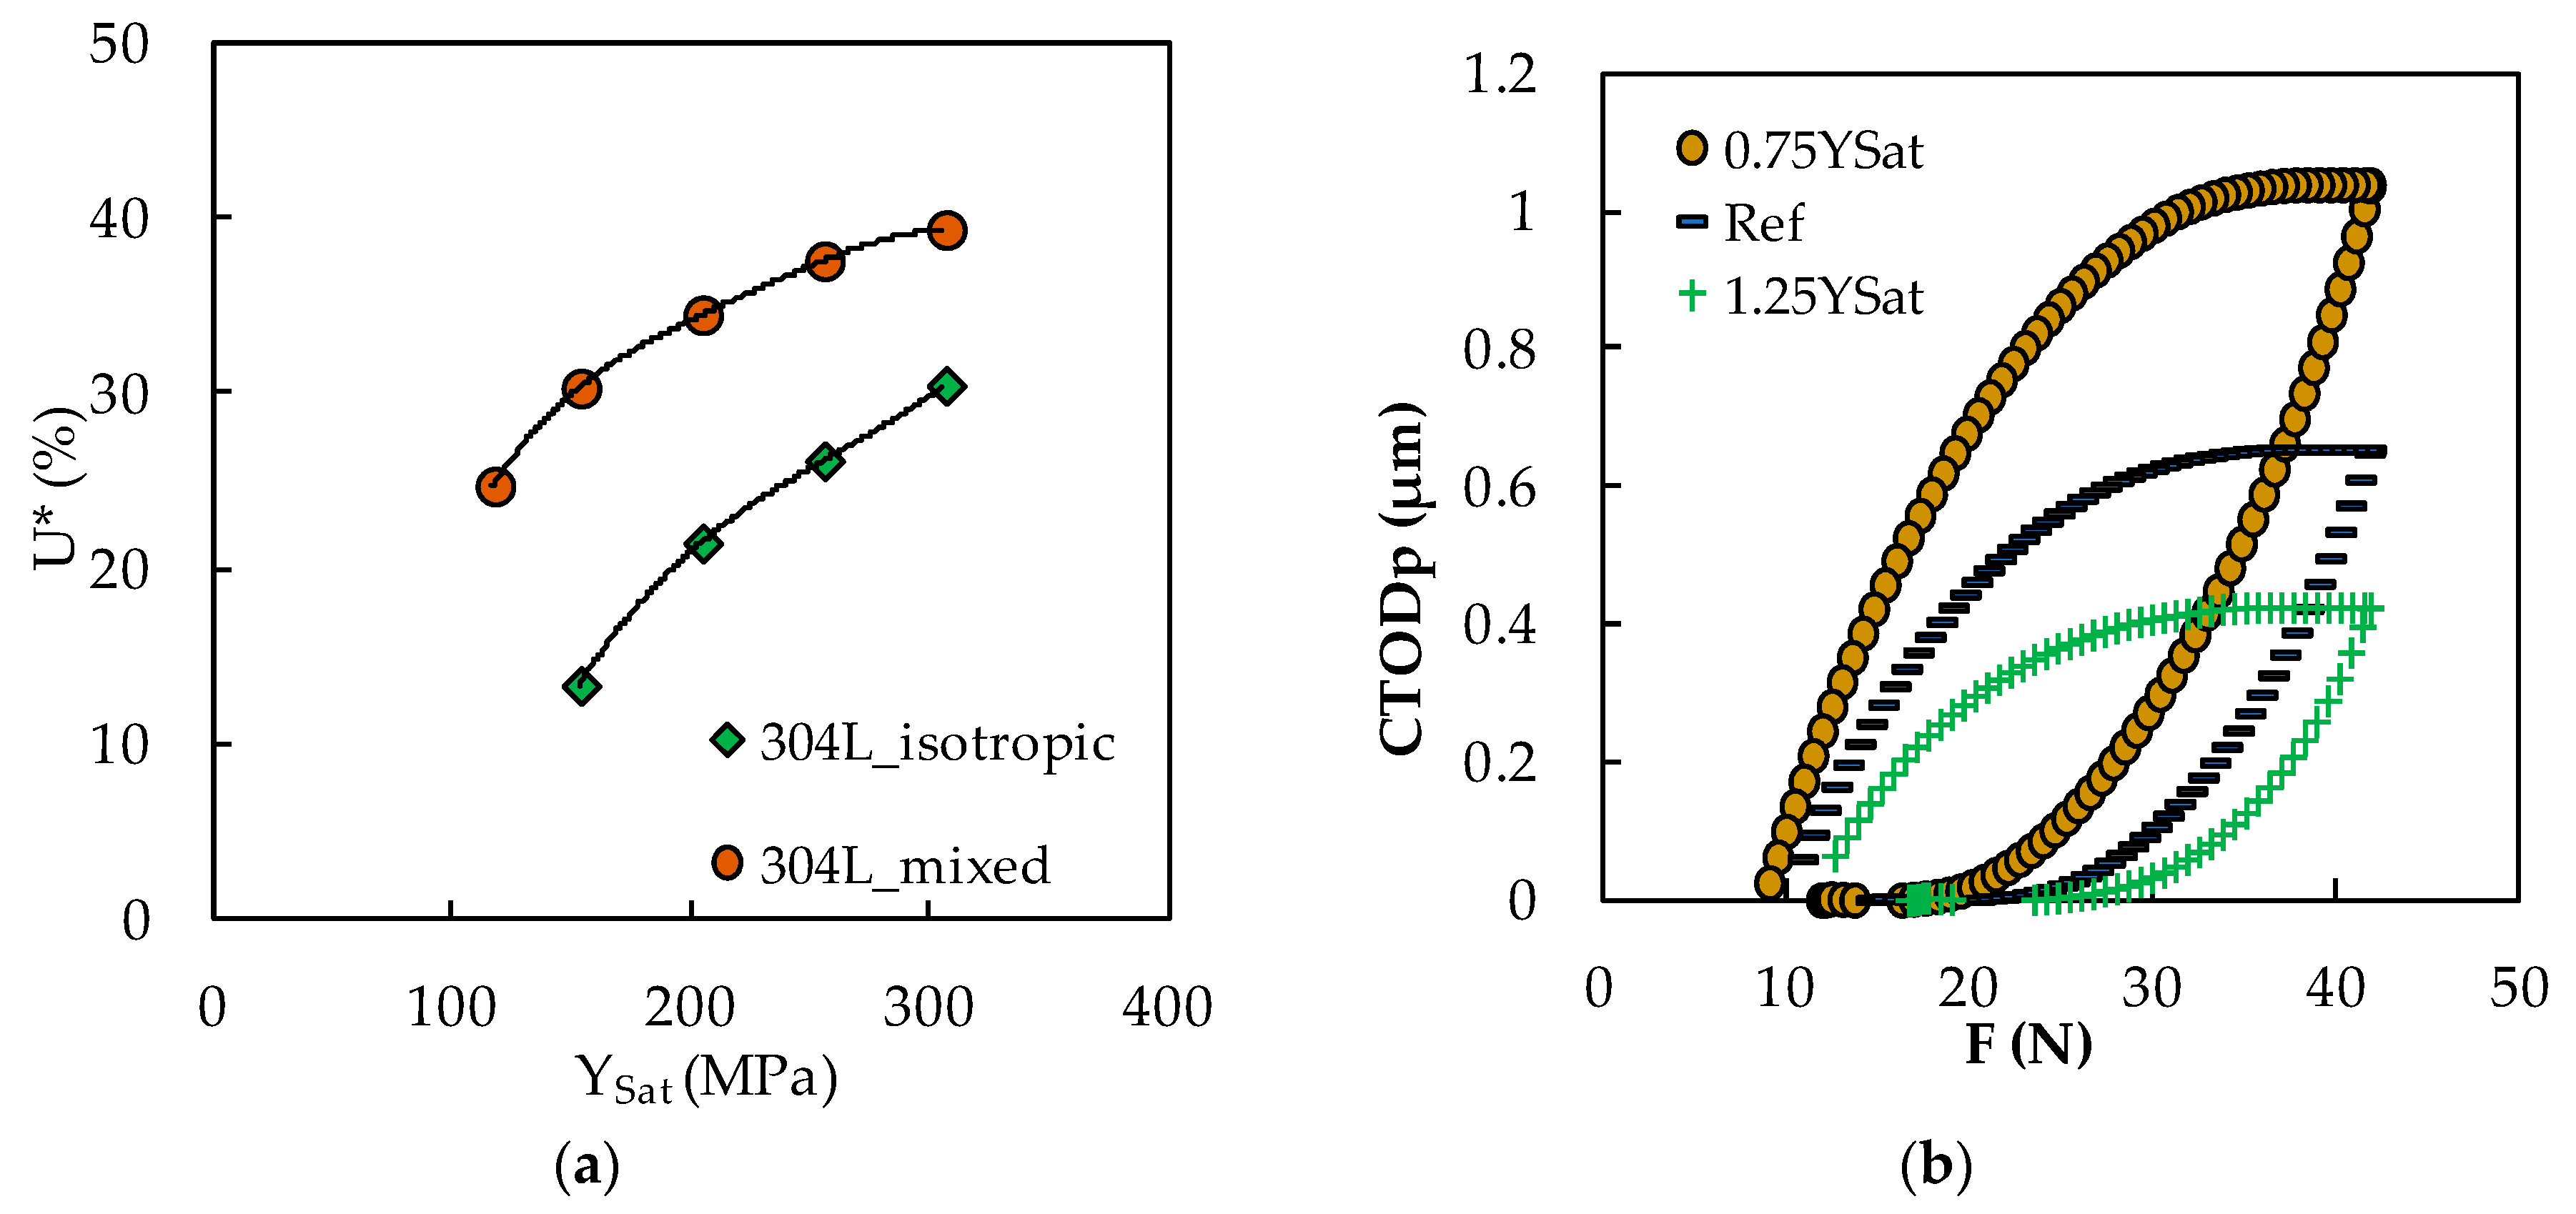
4.3. Effect of YSat and CY with Crack Closure
5. Conclusions
Author Contributions
Funding
Conflicts of Interest
References
- Pelloux, R.M. Crack extension by alternating shear. Eng. Fract. Mech. 1970, 1, 697–704. [Google Scholar] [CrossRef]
- Nicholls, D.J. The relation between crack blunting and fatigue crack growth rates. Fatigue Fract. Eng. Mater. Struct. 1994, 17, 459–467. [Google Scholar] [CrossRef]
- Schwalbe, K.H. Comparison of several fatigue crack propagation laws with experimental results. Eng. Fract. Mech. 1974, 6, 325–341. [Google Scholar] [CrossRef]
- Jablonski, D.A.; Carisella, J.V.; Pelloux, R.M. Fatigue crack propagation at elevated temperature in solid solution strengthened superalloys. Metall. Trans. A 1977, 8, 1893–1900. [Google Scholar] [CrossRef]
- Chand, S.; Garg, S.B.L. Crack propagation under constant amplitude loading. Eng. Fract. Mech. 1985, 21, 1–30. [Google Scholar] [CrossRef]
- Skelton, R.P.; Vilhelmsen, T.; Webster, G.A. Energia Criteria and cumulative damage during fatigue crack growth. Int. J. Fatigue 1998, 20, 641–649. [Google Scholar] [CrossRef]
- Clavel, M.; Pineau, A. Fatigue behaviour of two Nickel-base alloys I: Experimental results on low cycle fatigue, fatigue crack propagation and substructures. Mater. Sci. Eng. 1982, 55, 157–171. [Google Scholar] [CrossRef]
- Liu, H.W. Fatigue crack growth by crack tip cyclic plastic deformation: The unzipping model. Int. J. Fract. 1989, 39, 63–77. [Google Scholar] [CrossRef]
- Liu, H.W.; Liu, D. A quantitative analysis of structure sensitive fatigue crack growth in steels. Scr. Met. 1984, 18, 7–12. [Google Scholar] [CrossRef]
- Carpinteri, A. Crack Growth Resistance in Non-Perfect Plasticity: Isotropic Versus Kinematic Hardening. Appl. Fract. Mech. 1985, 4, 117–122. [Google Scholar] [CrossRef]
- Martínez-Pañeda, E.; Fleck, N.A. Crack Growth Resistance in Metallic Alloys: The Role of Isotropic Versus Kinematic Hardening. J. Appl. Mech. 2018, 85, 1–6. [Google Scholar] [CrossRef] [Green Version]
- Pommier, S.; Bompard, P. Bauschinger effect of alloys and plasticity-induced crack closure: A finite element analysis. Fatigue Fract. Eng. Mater. Struct. 2000, 23, 129–139. [Google Scholar] [CrossRef]
- Tong, J.; Lin, B.; Lu, Y.-W.; Madi, K.; Tai, Y.H.; Yates, J.R.; Doquet, V. Near-tip strain evolution under cyclic loading: In situ experimental observation and numerical modelling. Int. J. Fatigue 2015, 71, 45–52. [Google Scholar] [CrossRef]
- Paul, S.K.; Tarafder, S. Cyclic plastic deformation response at fatigue crack tips. Int. J. Press. Ves. Pip. 2013, 101, 81–90. [Google Scholar] [CrossRef]
- Bahloul, A.; Bouraoui, C. The overload effect on the crack-tip cyclic plastic deformation response in SA333 Gr 6 C-Mn steel. Appl. Fract. Mech. 2019, 99, 27–35. [Google Scholar] [CrossRef]
- Camas, D. Numerical Study of The Three-Dimensional Behaviour of Plasticity Induced Crack Closure Phenomenon in Bi-Dimensional Specimens. Ph.D. Thesis, University of Málaga, Málaga, Spain, 2013. [Google Scholar]
- González-Herrera, A.; Zapatero, J. Influence of minimum element size to determine crack closure stress by the finite element method. Eng. Fract. Mech. 2005, 72, 337–355. [Google Scholar] [CrossRef]
- González-Herrera, A.; Zapatero, J. Numerical study of the effect of plastic wake on plasticity-induced fatigue crack closure. Fatigue Fract. Eng. Mater. Struct. 2009, 3218, 249–260. [Google Scholar] [CrossRef]
- Antunes, F.V.; Rodrigues, S.M.; Branco, R.; Camas, D. A numerical analysis of CTOD in constant amplitude fatigue crack growth. Theor. Appl. Fract. Mech. 2016, 85, 45–55. [Google Scholar] [CrossRef]
- Antunes, F.V.; Branco, R.; Prates, P.A.; Borrego, L. Fatigue crack growth modelling based on CTOD for the 7050-T6 alloy. Fatigue Fract. Eng. Mater. Struct. 2017, 40, 1309–1320. [Google Scholar] [CrossRef]
- Vasco-Olmo, J.M.; Díaz, F.A.; Antunes, F.V.; James, M.N. Characterisation of fatigue crack growth using digital image correlation measurements of plastic CTOD. Appl. Fract. Mech. 2019, 101, 332–341. [Google Scholar] [CrossRef]
- Antunes, F.V.; Borges, M.F.; Prates, P.; Branco, R.; Oliveira, M. Effect of yield stress on fatigue crack growth. Frat. Integrità Strutt. 2019, 13, 9–19. [Google Scholar] [CrossRef] [Green Version]
- Borges, M.F.; Antunes, F.V.; Prates, P.A.; Branco, R.; Vojtek, T. Effect of Young’s modulus on Fatigue Crack Growth. Int. J. Fatigue 2019, 105375. [Google Scholar] [CrossRef]
- Frederick, C.O.; Armstrong, P.J. A mathematical representation of the multiaxial Bauschinger effect. Mater. High Temp. 2007, 24, 1–26. [Google Scholar] [CrossRef]
- Voce, E. The relationship between stress and strain for homogeneous deformation. J. Inst. Met. 1948, 74, 537–562. [Google Scholar]
- Prates, P.A.; Oliveira, M.C.; Fernandes, J.V. On the equivalence between sets of parameters of the yield criterion and the isotropic and kinematic hardening laws. Int. J. Mater. 2015, 8, 505–515. [Google Scholar] [CrossRef]
- Prates, P.A.; Pereira, A.F.G.; Sakharova, N.A.; Oliveira, M.C.; Fernandes, J.V. Inverse strategies for identifying the parameters of constitutive laws of metal sheets. Adv. Mater. Sci. Eng. 2016. [Google Scholar] [CrossRef] [Green Version]
- Antunes, F.V.; Ferreira, M.S.C.; Branco, R.; Prates, P.; Gardin, C.; Sarrazin-Baudoux, C. Fatigue crack growth versus plastic CTOD in the 304L stainless steel. Eng. Fract. Mech. 2019, 214, 487–503. [Google Scholar] [CrossRef]
- Menezes, L.F.; Teodosiu, C. Three-dimensional numerical simulation of the deep drawing process using solid finite elements. J. Mater. Proc. Technol. 2000, 97, 100–106. [Google Scholar] [CrossRef] [Green Version]
- Oliveira, M.C.; Alves, J.L.; Menezes, L.F. Algorithms and strategies for treatment of large deformation frictional contact in the numerical simulation of deep drawing process. Arch. Comput. Method Eng. 2008, 15, 113–162. [Google Scholar] [CrossRef] [Green Version]


| Reference | Model | Comments |
|---|---|---|
| Pelloux [1] | E—Young’s modulus Y0—Yield stress | |
| Nicholls [2] | - | |
| Schwalbe [3] | εf—failure strain n—hardening exponent | |
| Jablonski [4] | n = 10 ν—Poisson’s ratio | |
| Chand and Garg [5] | KIc—fracture toughness R—stress ratio | |
| Skelton et al. [6] | Wc—critical value of density of cumulative energy | |
| Clavel and Pineau [7] | β = 0.25 Clavel and Pineau β = 0.02 (1−ν2) Liu [8] | |
| Liu and Liu [9] | ΔKth—fatigue threshold |
| Material | Hooke’s Law | Voce Law | Armstrong–Frederick Law | ||||
|---|---|---|---|---|---|---|---|
| SS304L Mixed Hardening [28] | E (GPa) | ν (–) | Y0 (MPa) | YSat (MPa) | CY (–) | CX (–) | XSat (MPa) |
| Reference | 196 | 0.3 | 117 | 204 | 9.00 | 300 | 176 |
| 0.50YSat | 196 | 0.3 | 117 | 204 | 9.00 | 300 | 176 |
| 0.75YSat | 196 | 0.3 | 117 | 102 | 9.00 | 300 | 176 |
| 1.25YSat | 196 | 0.3 | 117 | 153 | 9.00 | 300 | 176 |
| 1.50YSat | 196 | 0.3 | 117 | 255 | 9.00 | 300 | 176 |
| 0.50CY | 196 | 0.3 | 117 | 204 | 4.50 | 300 | 176 |
| 0.75CY | 196 | 0.3 | 117 | 204 | 6.75 | 300 | 176 |
| 1.25CY | 196 | 0.3 | 117 | 204 | 11.25 | 300 | 176 |
| 1.50CY | 196 | 0.3 | 117 | 204 | 13.50 | 300 | 176 |
| SS304L Purely Isotropic | E (GPa) | ν (–) | Y0 (MPa) | YSat (MPa) | CY (–) | CX (–) | XSat (MPa) |
| Reference | 196 | 0.3 | 117 | 204 | 9.00 | 0 | 0 |
| 0.75YSat | 196 | 0.3 | 117 | 153 | 9.00 | 0 | 0 |
| 1.25YSat | 196 | 0.3 | 117 | 255 | 9.00 | 0 | 0 |
| 1.50YSat | 196 | 0.3 | 117 | 306 | 9.00 | 0 | 0 |
| 0.50CY | 196 | 0.3 | 117 | 204 | 4.50 | 0 | 0 |
| 0.75CY | 196 | 0.3 | 117 | 204 | 6.75 | 0 | 0 |
| 1.25CY | 196 | 0.3 | 117 | 204 | 11.25 | 0 | 0 |
| 1.50CY | 196 | 0.3 | 117 | 204 | 13.50 | 0 | 0 |
© 2020 by the authors. Licensee MDPI, Basel, Switzerland. This article is an open access article distributed under the terms and conditions of the Creative Commons Attribution (CC BY) license (http://creativecommons.org/licenses/by/4.0/).
Share and Cite
Borges, M.F.; Antunes, F.V.; Prates, P.A.; Branco, R. A Numerical Study of the Effect of Isotropic Hardening Parameters on Mode I Fatigue Crack Growth. Metals 2020, 10, 177. https://doi.org/10.3390/met10020177
Borges MF, Antunes FV, Prates PA, Branco R. A Numerical Study of the Effect of Isotropic Hardening Parameters on Mode I Fatigue Crack Growth. Metals. 2020; 10(2):177. https://doi.org/10.3390/met10020177
Chicago/Turabian StyleBorges, M. F., F. V. Antunes, P. A. Prates, and R. Branco. 2020. "A Numerical Study of the Effect of Isotropic Hardening Parameters on Mode I Fatigue Crack Growth" Metals 10, no. 2: 177. https://doi.org/10.3390/met10020177
APA StyleBorges, M. F., Antunes, F. V., Prates, P. A., & Branco, R. (2020). A Numerical Study of the Effect of Isotropic Hardening Parameters on Mode I Fatigue Crack Growth. Metals, 10(2), 177. https://doi.org/10.3390/met10020177