Abstract
Our study will be focused on stainless steel AISI 304—carbon steel ASTM A105 joints obtained by rotary friction welding and on their fatigue corrosion behavior in different testing environments. As a first thing, the joints will be characterized by microscopy and electrochemical techniques. The manuscript will then describe the optimization of the experimental setup and the validation of the testing procedure. After that, the fatigue behavior of the joints will be tested in different aggressive environments. This study pointed out that it is possible to build a simple and low-cost setup for the study of fatigue corrosion behavior of dissimilar joints while exploiting in situ electrochemical measurements to follow the fatigue corrosion process.
1. Introduction
The possibility of joining distinct materials is a very attractive opportunity in the assembly and design of high-performance components for high-duty technological applications, such as in the automotive or in the aeronautic field [1]. Many of the structural elements in pressure vessels, spacecraft, and transport applications, as well as in offshore and nuclear structures are made of welded joints [2,3,4]. The coupling of different materials is very intriguing as it is possible to take advantage of the best properties of each material and build components with good structural and lightweight characteristics, but, on the other hand, it represents a challenge because new phenomena, arising from their interaction, must be taken under consideration [5]. Dissimilar joints can be realized using different techniques, such as threading or the use of adhesives [6], but the production rate and life expectancy of these joints is not so high. High-performance joints can be obtained exploiting solid-state welding methods [7], such as rotary friction welding (RFW) and linear friction welding (LFW) [8,9]. Friction welding (FW) techniques allow coupling dissimilar materials, such as metals, ceramics, polymers, and composites [10,11,12] that cannot be joined by conventional fusion welding techniques, operating at temperatures lower than the melting point of the materials being welded together. Despite all these positive aspects, it is necessary to point out that FW techniques could affect the material composition and structure and could also cause the precipitation of brittle phases [13] as well as the formation of cracks [13,14]. Friction welding is exploited using the relative motion of the two pieces pressed against each other, thus producing the needed heat by the conversion of mechanical energy into thermal energy, without any external heat input [6]. Rotation speed, applied load, and welding time are the main process parameters to be considered [5,6,15]. These can be adjusted to reach the plastic temperature range close to the interface where atomic diffusion happens and metallurgical bonds form. Austenitic stainless steel-steel joints are very common and possess a good combination of mechanical properties, formability, weldability, and resistance to corrosion [16,17,18]. Many studies are present in the literature about the microstructural characteristics, phase formation at the interface, and tensile properties of these type of joints, but only few data are present about extensive fatigue studies and fatigue corrosion investigations.
Our study will be focused on stainless steel AISI 304—carbon steel ASTM A105 joints. The AISI 304 grade stainless steel has good mechanical properties and high corrosion resistance [19], ASTM A105 carbon steel has attractive properties such as high strength, good wear resistance, and affordable cost. In many applications, dissimilar welded joints play a key structural role and they are often subjected to cyclic stresses. Such loading could lead to worrisome fatigue failure and to catastrophic failure as well [20]. Therefore, it is necessary to evaluate the integrity of the joints and deeply study their mechanical properties, especially fatigue resistance [20] and failure modes. The design of fatigue experiment could be very challenging because fatigue behavior does not only depend on the chosen material, but it is also dependent on the sample’s geometrical features (sharp edges, notches) [21,22,23] and post-welding treatments [24,25], that could influence surface roughness and create preferential cracking points. When considering the integrity of structural components, such as dissimilar metal welded joints (DMWJ), it is important to take under consideration the effect of the environment and the role of corrosion in the cracking mechanisms and failure of these components. Cracking caused by a combination of environmental, mechanical, and metallurgical variables is commonly referred to as “environmental cracking” [26] and could manifest in fatigue corrosion (FC), stress corrosion cracking (SCC), and hydrogen embrittlement [27]. FC is the result of the combined action of an alternating or cyclic stress and a corrosive environment; the fatigue process is thought to cause the rupture of the protective passive film, upon which corrosion is accelerated [28]. Contrary to a pure mechanical fatigue, there is no fatigue limit load in corrosion-assisted fatigue. SCC is the cracking induced from the combined influence of tensile stress and a corrosive environment; the required tensile stresses may be in the form of external applied stresses or in the form of residual stresses set up as a result of machining, deformation, welding, and grinding [29,30]. Hydrogen embrittlement is a type of deterioration that could be linked to corrosion processes: It usually involves the diffusion of hydrogen into the crystal lattice of metallic component subjected to tensile stress and it could even cause cracking and catastrophic brittle failure [30]. Conditions favorable to corrosion fatigue could also lead to stress-corrosion cracking phenomena and to hydrogen embrittlement, therefore the transition between these environmental cracking processes is not so sharp and many features are shared between them. Corrosion can happen in a huge variety of conditions and it can develop in a large variety of forms. It is then necessary to investigate the behavior of structural components in the realistic conditions in which corrosion can develop, such as their behavior in fatigue and fatigue corrosion tests. Fatigue and corrosion interact in a complex manner, failure can occur at different mode and times, and the component damage can be never described as the simple sum of the two effects.
Only sporadic experiments were conducted about the study of fatigue behavior in an aggressive environment of hybrid joints between dissimilar materials. Considering the large range of potential applications, the testing of stainless steel-steel joints could be both interesting from a scientific point of view and improve economic sustainability. The main aim of this work is to develop a method to characterize fatigue and fatigue corrosion behavior of dissimilar friction welded joints. The experimental setup development and validation of the testing procedure will be the crucial point of this work. This paper will include a description of how the specimen geometry and the testing setup were developed to obtain robust measurements. Then, the effectiveness of the testing method will be probed in different experimental conditions.
2. Materials and Methods
Dissimilar rotary friction welded joints were realized using AISI304 stainless steel and ASTM A105 medium-low carbon steel. The two alloys chemical composition, according to the international standards [31,32], is reported in Table 1.

Table 1.
Chemical composition of AISI 304 and ASTM A105 alloys.
The samples were produced by Tomet MECHANICS (Castelgomberto, Vicenza, Italy) joining a 21 mm diameter rod of ASTM A105 steel with an 18 mm diameter rod of AISI304 stainless steel. The samples were produced through the rotary friction welding technique. The as-provided samples needed further turning operations to achieve a shape suitable to be tested in fatigue experiments. The samples were lathe machined and then grinded until reaching a surface roughness value of about 2 μm (Ra). The final design of the samples was developed after preliminary tests in a universal testing machine (UTM), starting from the one suggested by the UNI EN ISO 11782-1 standard [33]. The specimen cross section in the welded area was reduced to about one third of the original so as to avoid influences of surface defects and to reduce the load bearing capability within the allowable ranges of the UTM used during fatigue testing. The weld is located approximately in the middle of the investigated cylindrical volume, having 6 mm diameter cross section and 10 mm length. A large fillet radius and a smooth bevel transition up to the 12 mm diameter of the cross section in the gripping regions was realized, in order to avoid the risk of failure localization at the fillet’s base. The recess in the shaft was made in order to ease the sealing of the electrochemical cell. A sketch of the final sample geometry is reported in Figure 1.
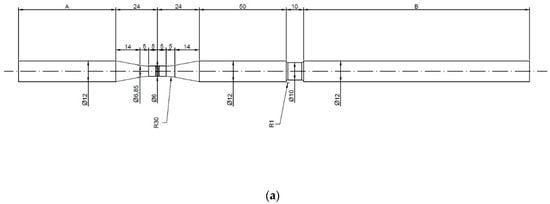
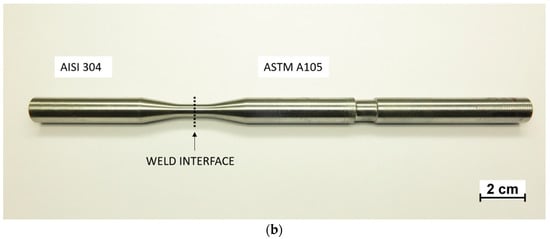
Figure 1.
(a) Selected specimen design for fatigue tests (unit: mm); (b) image of the as-made sample.
The morphology and internal structure of the welded joints were studied by optical and electron microscopy, by means of Nikon SMZ25 stereomicroscope (Nikon Instruments, Amstelveen, The Netherlands) and JEOL IT300 scanning electron microscope (SEM, Jeol Ltd., Akishima, Tokyo, Japan), respectively. Moreover, optical and SEM observations were employed in the failure mechanism and failure analysis assessment. Energy dispersive X-ray spectrometry (EDS) measurements, carried out using a Bruker “Quantax Micro-XRF” analyser (Bruker, Billerica, MA, USA), were useful to gain further information on the composition of the samples and the distribution of the different alloying elements. Micro-hardness tests were carried out using a Vickers digital micro-hardness tester (Model FM-310, Future tech, Kawasaki, Japan) along the weld joint. A load of 200 g was applied for a duration of 10 s. The measurements are the average of three repetitions.
Electrochemical analyses were performed to determine the corrosion resistance of the two different alloys and study their electrochemical behavior. Cyclic potentiodynamic measurements were carried out using a potentiostat PARSTAT 2273 (Princeton Applied Research, Oak Ridge, TN, USA) in a three-electrode configuration where the reference electrode (RE) was an Ag/AgCl sat. (+207 mV SHE) electrode and the counter electrode (CE) was a platinum wire. The testing solution was a 3.5 wt% NaCl solution. As a first thing, the free corrosion potential (Ecorr) was determined. Then potentiodynamic measurements were exploited, starting from a potential value of (E = Ecorr − 0.1 V) and going into anodic polarization. The test was stopped when the potential reached the breakdown potential for samples showing a passivity state. The scanning rate was set to be 0.166 mV/s.
The fatigue and fatigue corrosion behavior of the dissimilar friction welded joints was studied performing fatigue tests in different conditions: The samples were tested in air (F), in an aggressive solution with no imposed potential (fatigue corrosion (FC)), in an aggressive solution with a negative imposed potential (cathodically protected fatigue corrosion (FC-P)), and in an aggressive solution with a positive imposed potential (accelerated fatigue corrosion (FC-A)). The fatigue tests were performed on an Instron 8800 universal testing machine (Instron, Norwood, MA, USA) with a TRIO RT3 control system. The specimens were axially loaded in tension, with stress ratio (minimum over maximum stress in a cycle) R = 0.1. A 4 Hz sine wave was chosen to perform the tests, a trade-off aimed at making detectable the environmental effects on the fatigue behavior in a reasonable testing time. The tests were stopped at the specimen’s failure or after two million fatigue cycles, as the samples were considered run outs. As a first thing, fatigue in air tests were performed.
In order to exploit corrosion fatigue tests and apply a given potential to the specimens, it was necessary to develop an easy-to-build electrochemical cell, paying attention not to interfere with the fatigue tests and to avoid electrical contact between the samples and the testing apparatus. The design of the cell accounted for various factors, such as the ease to be built, to be operated, and to be replaced as well. The possibility of easily building and replacing the cell allows performing customizable tests. Figure 2 shows a sketch of the electrochemical cell and a photograph of the experimental setup.
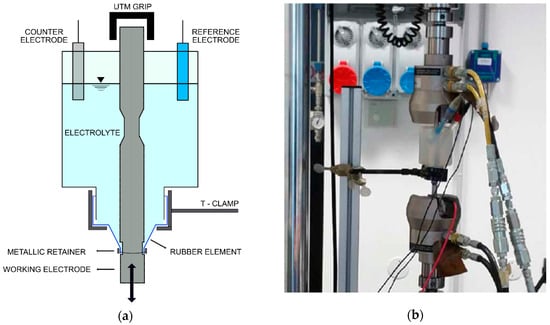
Figure 2.
(a) Electrochemical cell design; (b) photograph of the experimental setup.
The first challenge to be overcome arose since the hydraulic actuator of all UTMs available in the lab displaces the bottom grip of the specimen holder, thus making it impossible to position the cell on the bottom grip of the UTM. This problem was solved by providing the electrochemical cell an external support, realized with a T structure anchored on the bottom plate of the UTM and provided with an adjustable prong clamp. The second challenge consisted of guaranteeing a static waterproof seal between the cell and the specimen; very compliant polymeric elastic tubular elements were fixed to the cell and the specimen using mechanical retainers (steel cable ties). As a solution container, a polyethylene (PE) 200 mL flask three times wider in diameter with respect to the specimen was chosen. Holes were cut in the cap of the flask and in the bottom of the flask to allow the specimen to pass through. Two small holes were provided in the flask to support the electrodes without the need to use external supports.
The electrochemical cell, mounted around the specimen, was also useful to perform reference electrochemical measurements and thus interpret the time-current data that will be collected during corrosion fatigue experiments. These measurements were carried out with the same parameters used in the electrochemical characterization of the samples. After that it was possible to exploit fatigue tests in the presence of an aggressive environment, as described in Table 2.
Table 2.
Testing parameters of fatigue tests.
Regarding the FC-P test, the imposed potential was chosen in order to have a complete cathodic protected material [34,35]. This choice could also prove very useful to verify the effectiveness of cathodic protection in the presence of an increased hydrogen production due to the cathodic reduction of water. In FC-A testing the imposed potential has a value comparable to the stainless-steel breakdown potential observed experimentally. The applied potential during fatigue tests was used to hinder or enhance corrosion phenomena.
After all the tests were completed, a detailed microscopic analysis of the specimens was carried out in order to gain further insights on the failure mechanisms of the joints in different conditions.
3. Results and Discussion
3.1. Morphological and Metallographic Analysis
Figure 3 shows a SEM micrograph of the welded specimen interface. On the left the AISI 304 stainless steel, on the right side the ASTM A105 carbon steel. The interface between the two materials is not straight and continuous, but there is a gradual intermixing of the two steels, due to the rotary friction welding process. In addition to that, it is possible to highlight the presence of some black precipitates in the carbon steel side. The composition of the precipitates is not constant, but they are mainly composed of carbon, sulphur, molybdenum, and manganese.
Figure 3.
Scanning electron microscopy image of the welded specimen interface.
Figure 4 shows optical micrographs of the specimen interface. Welding defects, such as porosities and cracks are not present, thus underlining the good quality of the welding process. The dissimilar joint microstructure can be classified in three different regions. The first region, astride the interface and with an extension of 470 μm on either side of the interface, is the fully plastically deformed region. This region contains very fine small recrystallized grains of ferrite and perlite [36]. It is well known that pressure used to join the materials results in recrystallization leading to a grain refinement in the central region of the weld [37]. The second region is constituted by an area of the sample which underwent a partial plastic deformation; here the grains are larger than in the first region near the interface, but their shape is modified and stretched along the load axial direction. Its structure is constituted by ferrite and perlite, as already reported for medium-carbon steels which underwent rotary friction welding processes [38]. The extension of this area is 1500 μm. The third area is represented by the undeformed base material microstructure, consisting of ferrite and perlite.
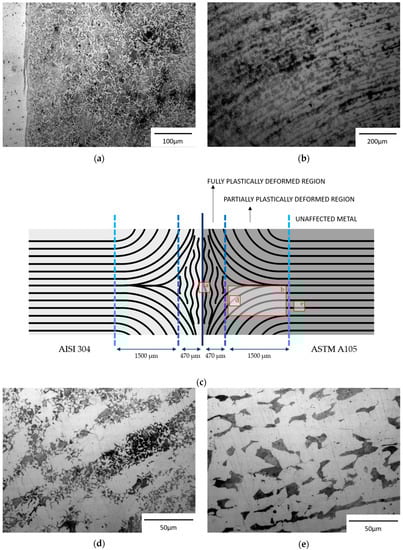
Figure 4.
Optical images of the welded sample microstructures. (a) Interface region (AISI 304 on the left side and ASTM A105 on the right side of the interface); (b) intermediate region; (c) schematic representation of the sample; (d) intermediate region at high magnification; (e) base metal.
Figure 5 shows the longitudinal hardness measurements distribution of the test specimen. Hardness was measured across the weld interface, from 2.0 mm left and right on the AISI 304 and ASTM A105 metals.
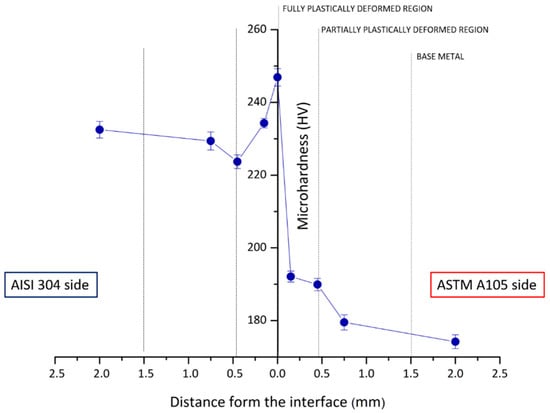
Figure 5.
Vickers hardness distribution through the weld interface.
A maximum hardness of 247 HV has been obtained at the weld interface. The increase in hardness at the welding interface is probably due to friction and oxidation processes which take place during welding processing. Similar hardness measurements were obtained by [36] for the AISI 304 stainless steel base metal and for the weld interface of AISI 304 stainless steel—mild steel friction welded joints. Other studies [13,39] report also higher values for dissimilar joints with 304 stainless steel.
3.2. Electrochemical Analysis
Electrochemical analyses of the plain AISI 304 specimen, plain ASTM A105 specimen, and welded specimen are useful to set up the electrochemical parameters during the corrosion fatigue tests and to discuss the obtained results. Figure 6 shows the potentiodynamic polarization scans of all the samples taken under consideration.
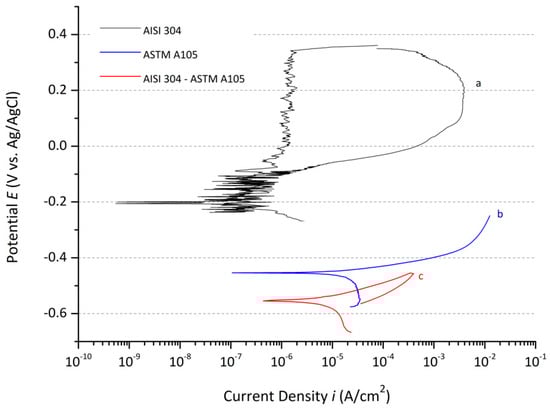
Figure 6.
Potentiodynamic polarization curves in a 3.5 wt% NaCl solution of: (a) AISI 304; (b) ASTM A105; (c) welded AISI304—ASTM A105.
The curve (a), relative to the AISI 304 specimen, starts in the cathodic region, it reaches the corrosion potential (−0.206 V vs. Ag/AgCl) and then, it goes through the passivation region, where an increase of the potential does not imply a variation of the current density. When the breakdown potential is reached (+0.355 V vs. Ag/AgCl) the curve rapidly deviates to higher values of the current density and corrosion takes place. Beyond this potential the pitting phenomenon is stable, and the material is not able to reform a permanent passivity layer anymore. The return scan clearly highlights the hysteresis phenomenon, that implies no immediate repassivation of the metal surface, in fact it is necessary to reach a potential lower than the breakdown potential for the passive layer to onset again. The curve (b) represents the linear polarization curve of the ASTM A105 specimen. At the lowest potential values, it is possible to identify the cathodic region under diffusion control, due to the oxygen reduction. After passing the corrosion potential of the material (−0.454 V vs. Ag/AgCl) the anodic current starts to arise. The corrosion rate of the carbon steel specimen increases with the potential, as typical of an alloy in an active state and no passivation tendency. The curve (c) represents the potentiodynamic polarization curve of the welded AISI 304—ASTM A105 sample. The shape of the curve is very similar to the one of the ASTM A105 specimen, but the corrosion potential is shifted to lower values (−0.554 V vs. Ag/AgCl). The electrochemical situation is very complex, as the sample is constituted by three different zones: The stainless steel region, the carbon steel region, and the welding area, which has a different composition with respect to the plain steels. A galvanic coupling between AISI 304 and ASTM A105 with the increase of anodic current density due to increase of corrosion rate of carbon steel was expected. The presence of a mixed phase with modification of the microstructure seems to further worsen the specimen behavior. This fact can be explained considering that the welding process produced phases with a different composition with detrimental effects on the corrosion response.
3.3. Fatigue Testing
The results obtained by the fatigue testing of welded AISI304—ASTM A105 samples under different conditions: Fatigue in air (F), fatigue corrosion (FC), protected fatigue corrosion (FC-P), and accelerated fatigue corrosion (FC-A) are plotted in Figure 7. Fatigue tests started in such a way that the first tests were carried out at stress levels near but lower than the tensile strength (580 MPa) of the stainless steel [40] and carbon steel (min. 485 MPa) [41]. The stress levels were also selected to have single test durations less than 50 h each.
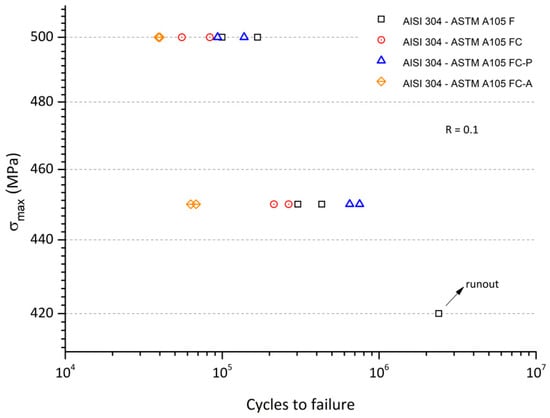
Figure 7.
S-N curves for AISI304—ASTM A105 welded specimens under different testing conditions.
The fatigue tests in air (F) were carried out at three different loading conditions. The most severe loading condition resulted in a lower number of cycles to failure whereas the progressive reduction of the loading led to longer sample lives. The specimen tested at the lower stress level has survived two million cycles, thus suggesting a transition from finite life regime to a fatigue limit. A further investigation in this stress range was beyond the scope of this research also considering the limited number of samples available. The FC, FC-P, and FC-A tests were carried out at the two more severe loading conditions. The presence of an aggressive environment led to a detectable decrease of the fatigue life. The imposition of the anodic potential drastically reduced the specimen’s life due to the strong corrosion attack on the specimen. On the other side, the cathodic protection seems to exert a positive influence on the fatigue behavior by enhancing the fatigue life at the lower stress level up to values higher than those obtained for tests in a non-aggressive environment.
Electrochemical Characterization during Fatigue Experiments
In order to have further insights on the electrochemical behavior of the samples during fatigue testing conditions, galvanic coupling tests were performed on the unloaded (reference) sample as well as on the loaded sample during the fatigue corrosion tests. Figure 8 represents the evolution of potential over time of coupled AISI 304—ASTM A105 in a 3.5 wt% NaCl solution for the two conditions.
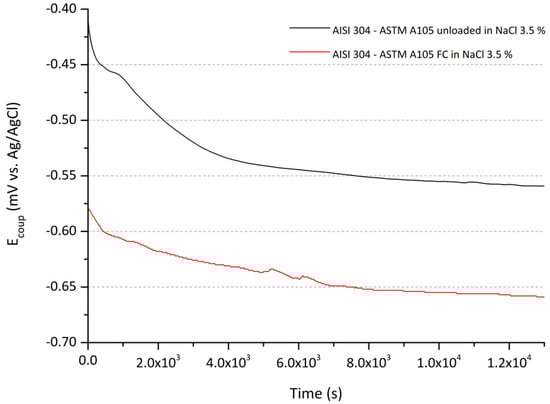
Figure 8.
Potential evolution over time of coupled AISI304—ASTM A105 in a 3.5 wt% NaCl solution unloaded sample and on a loaded sample tested to fatigue corrosion at 500 MPa.
Looking at the galvanic coupling potential of the unloaded sample, it is possible to observe that it reached a stable state after a transient. This behavior can be explained considering that the two alloys have a different behavior in the environment, thus, the transient regime represent the on-set of different corrosion mechanisms. In the case of an applied load, thus during fatigue corrosion experiments, the potential of the galvanic couple approaches more negative potentials with respect to what happens for the unloaded samples. This is clearly caused by the mechanical stress: Cyclic loading seems to activate the system and enhance corrosion mechanisms.
3.4. Failure Analysis
Optical and SE microscope analyses were carried out in order to get further insights on the failure modes of these specimens and to identify the fatigue fracture growth lines and the probable area of crack initiation. The observation with SEM allowed reaching higher magnifications and better investigating the crack origin area.
3.4.1. Fatigue in Air
Figure 9 shows the fracture surface of two different AISI304—ASTM A105 specimens tested by fatigue in air. Figure 9a shows the presence of two different areas: The fatigue fracture area at the bottom of the sample, containing the origin where the fatigue cracks started and the unstable fracture area on the top (also called “sudden fracture zone”) [42]. It is possible to observe that the crack probably originated in a different plane with respect to the plane where the crack propagated, and this fact is highlighted by the presence of a shadow in this area. The sudden fracture area, on the contrary, is characterized by a higher roughness, because of the sudden propagation that led to the specimen failure. The same observations are valid for the sample tested at 450 MPa, shown in Figure 9c,d. The samples both failed in the region plasticized during welding at about 1 mm from the interface.
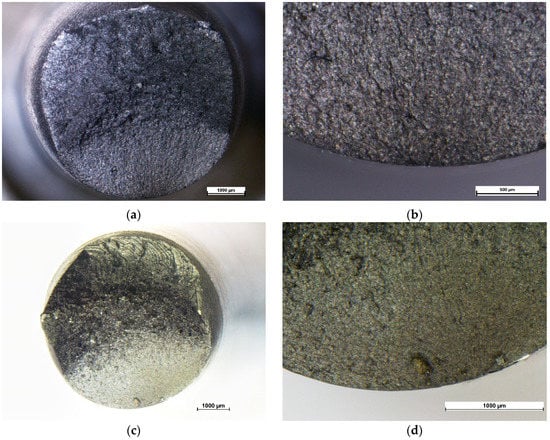
Figure 9.
Optical images of the fracture surface of a welded AISI304—ASTM A105 specimen tested to fatigue in air (F) (a) Top view of the sample fracture surface tested at 500 MPa; (b) close-up of the fatigue fracture surface and crack nucleation area of the sample (a); (c) top view of the sample fracture surface tested at 450 MPa; (d) close-up of the fatigue fracture surface and crack nucleation area of the sample (c).
3.4.2. Fatigue Corrosion
Figure 10 shows the fracture surface of two different AISI304—ASTM A105 specimen tested to FC in a 3.5 wt% NaCl solution. The fatigue fracture area is very limited in dimension with respect to one of the samples tested to FA and the transition to the unstable fracture area is very marked. The unstable fracture area is characterized by the presence of circular lines, due to the rotary friction welding process: This fact gives some information about the failure mode of these specimens, as the unstable fracture area is very near to the weld interface. In addition to that, it is also possible to observe that only one main fracture plane was identified in the analyzed samples and the fracture happened at 0.75 mm from the weld interface. The behavior of the specimens and their lower fatigue cycle number resistance is probably related to the aggressive environment that weakened the specimen causing a localized corrosion attack, as it is possible to see in Figure 10d. In addition to that, it is also possible to observe that only one main fracture plane was identified in the analyzed samples.
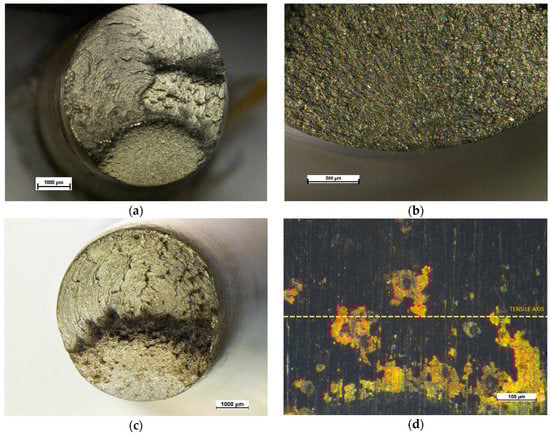
Figure 10.
Optical images of the fracture surface of a welded AISI304—ASTM A105 specimen tested to fatigue corrosion (FC): (a) Top view of the sample fracture surface tested at 450 MPa; (b) close-up of the fatigue fracture surface and crack nucleation area of the sample (a); (c) top view of the sample fracture surface tested at 450 MPa; (d) external surface of the sample in (c) near the fracture surface.
3.4.3. Fatigue Corrosion under Cathodic Protection
Figure 11 shows the fracture surface of an AISI304—ASTM A105 specimen tested to corrosion fatigue in a 3.5 wt% NaCl solution with cathodic protection (FC-P). The cathodically protected specimen shows a behavior similar to one of the specimens tested in air: The transition from the fatigue fracture area (at the bottom of the sample) to the unstable fracture area is smoother with respect to those of the FC tested specimens. Figure 11b shows a detail of the area between these two regions: It is possible to identify the typical progression marks present in the samples tested to fatigue [41]. The failure of the sample happened at about 50 μm from the interface, as evident from the structure of the failure surface.
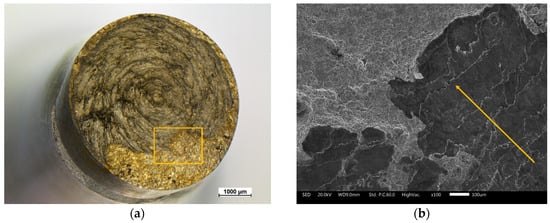
Figure 11.
(a) Optical image of the fracture surface of a welded AISI304—ASTM A105 specimen tested to protected fatigue corrosion (FC-P); (b) SEM micrograph of the area in between the fatigue fracture surface and the brittle fracture surface.
3.4.4. Accelerated Fatigue Corrosion
Figure 12 shows a welded AISI304—ASTM A105 specimen tested to accelerated corrosion fatigue in a 3.5 wt% NaCl solution. The behavior of the accelerated test samples was different, and most of the failure originated from the ASTM A105 side. The sudden fracture area is very irregular, and the fatigue fracture area is very limited in dimension, as is possible to see from Figure 12b.
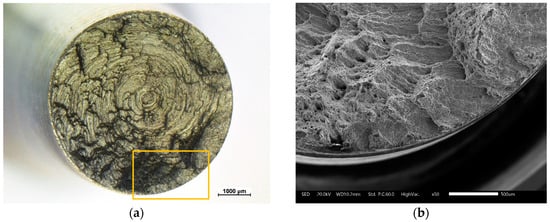
Figure 12.
(a) Optical image of the fracture surface of a welded AISI304—ASTM A105 specimen tested to accelerated fatigue corrosion (FC-A); (b) SEM micrograph of the area in between the fatigue fracture surface and the unstable fracture surface.
The fractographic analysis was very important to highlight the distinct behavior of the samples tested under different conditions. In particular, the coupling between microscopic analysis with fatigue testing pointed out remarkable differences between the samples. The experimental method and setup seemed to be effective for studying the fatigue corrosion of dissimilar welded joints, although the obtained results should be implemented with further fatigue testing at different stress levels.
4. Conclusions
This study pointed out the possibility of studying the fatigue corrosion behavior of dissimilar metal welded joints using a simple testing apparatus and performing the tests in different aggressive environments.
- The home-built setup proved to be effective to be adapted to the study of fatigue corrosion behavior of the samples under investigation, with the possibility of monitoring the progression of the tests by electrochemical measurements.
- The tests highlighted an evident coupling between environmental and mechanical testing conditions by the local electrochemical environment. The cathodic protection of the samples is effective in improving their fatigue behavior, in particular at low stress values. On the contrary, fatigue corrosion or even anodic activation worsen the behavior of the samples.
- The failure analysis of the samples tested in different conditions showed that in all cases their failure occurs near the welded interface, in the plastically deformed regions and not in the parent metal. A significant difference was observed among the fracture surface produced by different testing conditions thus confirming that the different severity of the test conditions may change the local damage mechanisms.
Author Contributions
Conceptualization and methodology, S.R., V.F. and M.B.; investigation, A.M.L. and F.R.; formal analysis, F.R.; writing—original draft preparation, F.R.; writing—review and editing, S.R., V.F. and M.B.; supervision, S.R., V.F. and M.B. All authors have read and agreed to the published version of the manuscript.
Funding
This research received no external funding.
Acknowledgments
We gratefully acknowledge Tomet Mechanics (Castelgomberto, Vicenza, VI, Italy) for the samples supplied for the experiments.
Conflicts of Interest
The authors declare no conflict of interest.
References
- Sakundarini, N.; Taha, Z.; Abdul-Rashid, S.H.; Ghazila, R.A.R. Optimal Multi-material Selection for Lightweight Design of Automotive Body Assembly Incorporating Recyclability. Mater. Des. 2013, 50, 846–857. [Google Scholar] [CrossRef]
- Varelis, G.E.; Papatheocharis, T.; Karamanos, S.A.; Perdikaris, P.C. Structural behavior and design of high-strength steel welded tubular connections under extreme loading. Mar. Struct. 2020, 71, 102701. [Google Scholar] [CrossRef]
- Wirsching, P.H. Fatigue reliability in welded joints of offshore structures. Int. J. Fatigue 1980, 2, 77–83. [Google Scholar] [CrossRef]
- Fan, Y.; Jiang, D.; Mo, D.; Zhu, D.; Luo, Z. A review on dissimilar metals’ welding methods and mechanisms with interlayer. Int. J. Adv. Manuf. Technol. 2019, 102, 2845–2863. [Google Scholar]
- Uday, M.B.; Ahmad Fauzi, M.N.; Zuhailawati, H.; Ismail, A.B. Advances in friction welding process: A review. Sci. Technol. Weld. Join. 2010, 15, 534–558. [Google Scholar] [CrossRef]
- Martinsen, K.; Hu, S.J.; Carlson, B.E. Joining of dissimilar materials. CIRP Ann. Manuf. Technol. 2015, 64, 679–699. [Google Scholar] [CrossRef]
- Cai, W.; Daehn, G.; Li, G.; Mishra, R.; Vivek, A.; Khan, H.; Komarasamy, M. A state-of-the-art review on solid state metal joining. J. Manuf. Sci. Eng. 2019, 141, 031012. [Google Scholar] [CrossRef]
- Wenya, L.; Vairis, A.; Preuss, M.; Tiejun, M. Linear and rotary friction welding review. Int. Mater. Rev. 2015, 61, 71–100. [Google Scholar]
- Vairis, A.; Papazafeiropoulos, G.; Tsainis, A. A comparison between friction stir welding, linear friction welding and rotary friction welding. Adv. Manuf. 2016, 4, 296–304. [Google Scholar] [CrossRef]
- Klomp, J.T.; De With, G. Strong metal-ceramic joints. Mater. Manuf. Process. 1993, 8, 129–157. [Google Scholar] [CrossRef]
- Meshram, S.D.; Mohandas, T.; Reddy, G.M. Friction welding of dissimilar pure metals. J. Mater. 2007, 184, 330–337. [Google Scholar] [CrossRef]
- Rupinder, S.; Ranvijay, K.; Feo, L.; Fraternali, F. Friction welding of dissimilar plastic/polymer materials with metal powder reinforcement for engineering applications. Compos. Part B Eng. 2016, 101, 77–86. [Google Scholar]
- Arivazhagan, N.; Surendra, S.; Prakash, S.; Reddy, G.M. Investigation on AISI 304 austenitic stainless steel to AISI 4140 low alloy steel dissimilar joints by gas tungsten arc, electron beam and friction welding. Mater. Des. 2011, 32, 3036–3050. [Google Scholar] [CrossRef]
- Carlone, P.; Astarita, A. Dissimilar metal welding. Metals 2019, 9, 1206. [Google Scholar] [CrossRef]
- Sathiya, P.; Aravindan, S.; Noorul Haq, A.; Paneerselvam, K. Optimization of friction welding parameters using evolutionary computational techniques. J. Mater. 2009, 209, 2576–2584. [Google Scholar] [CrossRef]
- Nascimento, M.P.; Souza, R.C.; Pigatin, W.L.; Voorwald, J.H.C. Effects of surface treatments on the fatigue strength of AISI 4340 aeronautical steel. Int. J. Fatigue 2001, 23, 607–618. [Google Scholar] [CrossRef]
- Shushan, S.M.; Charles, E.A.; Congleton, J. The environment assisted cracking of diffusion bonded stinless steel to carbon steel joints in an aqueous chloride solution. Corros. Sci. 1996, 38, 673–686. [Google Scholar] [CrossRef]
- Sarkari Khorrami, M.; Mostafaei, M.A.; Pouraliakbar, H.; Kokabi, A.H. Study on microstructure and mechanical characteristics of low-carbon steel and ferritic stainless steel joints. Mater. Sci. Eng. A 2014, 608, 35–45. [Google Scholar] [CrossRef]
- Prasad, K.S.; Rao, C.S.; Rao, D.N. A review on welding of AISI 304L austenitic stainless steel. J. Manuf. Sci. Prod. 2012, 14, 1–11. [Google Scholar] [CrossRef]
- Maddox, S.J. Fatigue behaviour of welded joints. In Advances in Fatigue Science and Technology; Branco, C.M., Rosa, L.G., Eds.; Springer: Dordrecht, The Netherlands, 1989; Volume 159. [Google Scholar]
- Akiniwa, Y.; Miyamoto, N.; Tsuru, H.; Tanaka, K. Notch effect on fatigue strength reduction of bearing steel in the very high cycle regime. Int. J. Fatigue 2006, 28, 1555–1565. [Google Scholar] [CrossRef]
- Casavola, C.; Giordano, V.; Pappalettere, P.; Pruncu, C.I. Influence of geometrical shape of specimen in fatigue life characterization on welded joint in titanium alloy. In Proceedings of the Twelfth Meeting New Trends in Fatigue and Fracture, Brasov, Romania, 27–30 May 2012. [Google Scholar]
- Alam, M.M.; Barsoum, Z.; Jonsén, P.; Kaplan, A.F.H.; Häggblad, H.Å. The influence of surface geometry and topography on the fatigue cracking behaviour of laser hybrid welded eccentric fillet joints. Appl. Surf. Sci. 2010, 256, 1936–1945. [Google Scholar] [CrossRef]
- Bertini, L.; Fontanari, V.; Straffelini, G. Influence of post weld treatments on the fatigue behaviour of Al-alloy welded joints. Int. J. Fatigue 1998, 20, 749–755. [Google Scholar] [CrossRef]
- Sabzi, M.; Dezfuli, S.M. Post weld heat treatment of hypereutectoid hadfield steel: Characterization and control of microstructure, phase equilibrium, mechanical properties and fracture mode of welding joint. J. Manuf. Process. 2018, 34, 313–328. [Google Scholar] [CrossRef]
- Revie, R.W. Environmental cracking of metals. In Modern Aspects of Electrochemistry; Conway, B.E., Bockris, J.O., Eds.; Springer: Boston, MA, USA, 1994; Volume 26. [Google Scholar]
- Andersen, P.L. ASM Handbook—Vol. 19. Corrosion Fatigue Testing; ASM International: Geauga County, OH, USA, 1998. [Google Scholar]
- Schijve, J. Fatigue of Structures and Materials; Springer: Dordrecht, The Netherlands, 2009; pp. 457–479. [Google Scholar]
- Andersen, P.L.; Jones, R.H. Stress Corrosion Cracking—Material Performance and Evaluation; ASM International: Geauga County, OH, USA, 1992. [Google Scholar]
- Sieradzki, K.; Newman, R.C. Stress-corrosion cracking. J. Phys. Chem. Solids 1987, 48, 1101–1113. [Google Scholar] [CrossRef]
- ASTM International. ASTM A276 Standard, Standard Specification for Stainless Steel Bars and Shapes; ASTM International: West Conshohocken, PA, USA, 2017. [Google Scholar]
- ASTM International. ASTM A105 Standard, Standard Specification for Carbon Steel Forgings for Piping Applications; ASTM International: West Conshohocken, PA, USA, 2018. [Google Scholar]
- UNI Ente Nazionale Italiano di Unificazione. UNI EN ISO 11782-1 Standard, Corrosion of Metals and Alloys—Corrosion Fatigue Testing Cycles to Failure Testing; UNI Ente Nazionale Italiano di Unificazione: Milano, Italy, 2008. [Google Scholar]
- Fontana, M.G. Corrosion Engineering; Tata McGraw-Hill Education: New York, NY, USA, 2005. [Google Scholar]
- ASTM International. ASTM G8-96 Standard, Standard Test Methods for Cathodic Disbonding of Pipeline Coatings; ASTM International: West Conshohocken, PA, USA, 2019. [Google Scholar]
- Ananthapadmanaban, D.; Seshagiri Rao, V.; Abraham, N.; Prasad Ra, K. A study of mechanical properties of friction welded mild steel to stainless steel joints. Mater. Des. 2009, 30, 2642–2646. [Google Scholar] [CrossRef]
- Özdemir, N. Investigation of the mechanical properties of friction-welded joints between AISI 304L and AISI 4340 steel as a function rotational speed. Mater. Lett. 2005, 59, 2504–2509. [Google Scholar] [CrossRef]
- Sahin, M. Joining with friction welding of high-speed steel and medium-carbon steel. J. Mater. Process. Technol. 2005, 168, 202–210. [Google Scholar] [CrossRef]
- Yoon, H.-K.; Kong, Y.-S.; Kim, S.-J.; Kohyama, A. Mechanical properties of friction welds of RAFs (JLF-1) to SUS304 steels as measured by the acoustic emission technique. Fusion Eng. Des. 2006, 81, 945–950. [Google Scholar] [CrossRef]
- Rowlands, D.P. The Mechanical Properties of Stainless Steel. In Sassda Stainless Steel Information Series No. 3; Southern Africa Stainless Steel Development Association: Sandton, South Africa, 2006. [Google Scholar]
- MT Acciai Speciali. Acciai al Carbonio. Available online: http://www.mtacciai.com/it/acciai/al-carbonio/astm-a105 (accessed on 21 July 2020).
- Sachs, N.W. Understanding the Surface Features of Fatigue Fractures: How They Describe the Failure Cause and the Failure History. J. Fail. Anal. Prev. 2005, 2, 11–15. [Google Scholar] [CrossRef]
© 2020 by the authors. Licensee MDPI, Basel, Switzerland. This article is an open access article distributed under the terms and conditions of the Creative Commons Attribution (CC BY) license (http://creativecommons.org/licenses/by/4.0/).