Article

Effect of DC Currents and Strain on Corrosion of X80 Steel in a Near-Neutral Environment

School of Chemical Engineering, Northwest University, Xi’an 710069, China
*
Author to whom correspondence should be addressed.
Metals 2021, 11(10), 1601; https://doi.org/10.3390/met11101601
Submission received: 2 September 2021 / Revised: 2 October 2021 / Accepted: 5 October 2021 / Published: 9 October 2021

Abstract

:
The corrosion behavior of X80 steel in a near-neutral soil-simulated solution under various DC stray currents and applied strains was investigated using electrochemical measurements (open circuit potential, linear polarization, and electrochemical impedance spectroscopy) and surface analysis techniques. Our results show that a DC stray current has a substantially greater effect on steel corrosion compared to applied strain. However, strain could slow down the corrosion rate in specific conditions by affecting the composition of corrosion products and the structure of the corrosion scale on the surface of the steel. Although the porosity of the corrosion scale of steel without an applied strain will increase with increasing DC currents, once strain is applied, the corrosion scale will become denser. Furthermore, both DC currents and strain can promote steel pitting, and the number and size of pitting holes will increase significantly with an increase in current densities.

1. Introduction

The past decade has seen rapid developments in national infrastructure construction, such as high-voltage direct current (HVDC) transmission systems and electrified railways. At the same time, as demand grows for energy resources such as oil and gas, the number of long-distance buried pipelines has also increased. Such complex electrified lines and pipelines will inevitably form a so-called public corridor during their design and construction, which can increase the risk of pipeline corrosion by stray currents [1,2,3]. In addition, the corrosion of buried pipelines is also affected by various stress–strain conditions (caused by internal pipeline pressure and soil movement) and the corrosive environment of soils (such as pH, moisture content, bacteria) [4,5,6,7,8]. The coupling of stray currents and strain applied on buried pipelines is becoming a pressing issue. Although the DC-induced corrosion of buried pipelines is widely recognized, the mechanism of pipeline degradation underlying DC stray currents and strain remains controversial.
Numerous studies have investigated the effect of stray currents on steel corrosion. In the presence of stray current interference, the corrosion rate of metals is greatly accelerated. Different stray current sources can be divided into DC stray currents and AC stray currents [3]. Under normal circumstances, the corrosion rate of steel with applied DC currents is much greater than that with AC currents [9,10]. Qian et al. [11] found that corrosion kinetics under the influence of DC currents comply with Faraday’s law of electrolysis. For instance, in a near-neutral and oxygen-free environment, if DC currents are applied to X52 steel with a current density of 0.5   mA / cm 2 , corrosion rates can be as high as 6.57 mm / y [12,13,14]. Moreover, some studies have shown that stray currents can cause potential shifts and can lead to cathodic protection (CP) failures, which indirectly accelerate corrosion [11,15]. Qin et al. [16] found that the potential of X70 steel would periodically fluctuate in soil under a dynamic DC interference. Wang [17] also reported the potential of Q235 steel to shift positively under DC interference, while the corrosion rate increased with the current density. Moreover, a few studies have reported the influence of DC interference on pitting corrosion. It has been shown that DC interference can reduce the pitting resistance of low carbon steel [18]. Wang et al. [2] found that under the interference of DC, the depth of X70 steel corrosion pits increased with the current density.
Furthermore, stress–strain-assisted corrosion is one of the fundamental reasons for pipeline failure. Studies have suggested that the impact of plastic deformation on corrosion is much more significant than elastic deformation is [19,20,21,22]. Behera et al. [23] observed decreased corrosion resistance on steel bars subjected to pre-induced plastic strain through experiments. Through finite element modeling, Xu and Cheng [24] found that the local static elastic strain of a pipeline had almost no effect on the electrochemical corrosion of steel. However, when a steel sample reaches the plastic deformation stage, local corrosion activity becomes significantly higher. Wang et al. [25] explained this phenomenon through a mechanical–electrochemical theory and pointed out that the corrosion resistance of steel is mainly affected by surface activity and dislocation changes. The increase in dislocations promotes the progress of a cathode reaction. Moreover, the effect of stress on corrosion also comes from the structure of the corrosion product layer. The effect of stress changes the porosity of the corrosion scale on an electrode’s surface, which, in turn, affects the ion exchange process at the electrode–solution interface [20,26].
The above research shows that either stress–strain or stray currents can impact the metal corrosion. Xu et al. [27] used electrochemical measurements such as linear polarization and electrochemical impedance spectroscopy to study the effects of elastic stress and AC on the corrosion of X80 steel. The results reflect that AC and stress have a synergistic effect on corrosion. Wang et al. [28] also observed the synergy of DC currents and stress to promote corrosion on X65 steel.
However, most of the aforementioned research is focused on the influence of a single factor (stress–strain, AC/DC stray current), or the coupling of AC stray currents and stress, on corrosion. This study aims to explore the effect of the coupling of different DC stray current densities and applied strains on the corrosion behavior of X80 steel in an NS4 solution. The electrochemical characteristics of X80 steel under different coupling conditions were obtained. Meanwhile, corrosion morphology and products were observed. Finally, the corrosion mechanism was analyzed to more clearly understand the corrosion of X80 pipeline steel under the combination of DC currents and strain in a near-neutral soil-simulated environment.

2. Materials and Methods

2.1. Materials

The samples used in the experiment were taken from an X80 pipe produced by Wuhan Iron and Steel. Its chemical composition is shown in Table 1.
The stress–strain curve (see Figure 1) of a plate-shaped sample was measured by a microcomputer-controlled electronic test universal machine. As shown in Figure 1, the mechanical parameters of the steel are as follows: (1) Tensile strength: 706 MPa; (2) yield strength: 624 MPa; (3) elongation after fracture: 23%; (4) gauge length: 50 ± 0.5 mm.
The samples were cut along the axial direction of the pipe into pieces that were 110 mm × 15 mm × 4 mm in size. They were polished with 240#, 600#, 800#,1000#, and 1200# SiC papers until there were no noticeable scratches on the surface, and they were then rinsed with deionized water and absolute ethanol and were dried with cold air. Subsequently, these samples were uniformly coated with silicone rubber, leaving a 1 cm 2 area at the center of the sample as the working electrode surface (see Figure 2a), and the samples were then dried in a desiccator until use.

2.2. Simulated Soil Solution

An NS4 near-neutral soil solution was used as a corrosion medium in the experiment. Table 2 shows the composition of the solution. Before the steel was immersed, a constant flow of 95 %   N 2 + 5 %   CO 2 was continued for 2 h to minimize the dissolved oxygen content in the solution and to maintain a near-neutral pH condition (pH = 6.8) [29].

2.3. Experimental Set-Up

The experimental set-up is shown in Figure 3. It was primarily composed of a four-point-bend loading apparatus, a DC power supply IT 6302 (ITECH Ltd., Nanjing, China), a pH meter, a variable resistor, a graphite electrode, and a plexiglass electrochemical cell. The four-point-bend loading apparatus was used to load the sample with a constant strain (see Figure 2b). Strain gauges were used to measure strain value. The loading apparatus was covered with paraffin wax to avoid electrical interaction between the fixture and the working electrode. The DC power supply was used to form a stable current loop between the working electrode and the graphite. The rheostat adjusted the current density through the surface of the working electrode. The ammeter was used to monitor the actual current in the current loop. Electrochemical measurements were performed using a Corrtest CS2350 electrochemical workstation (Wuhan Corrtest Instrument Corp., Ltd., Wuhan, China) with a traditional three-electrode system, where an X80 steel sample was used as a working electrode, the platinum sheet was a counter electrode (CE), and the saturated calomel electrode (SCE) was immersed in the Luggin capillary as a reference electrode.

2.4. Electrochemical Measurement

The electrochemical measurement methods in this study consisted of three parts: open circuit potential (OCP), linear polarization (LP), and electrochemical impedance spectroscopy (EIS). The details are as follows:
In order to remove the oxide film formed on the electrode surface due to natural oxidation, the working electrode was initially polarized at −1.5 V (VS. OCP) for 1 min and was then placed in the solution for 20 min. Then, the sample was subjected to constant densities for 2 h. After applying different DC currents, open circuit potential and drift potential were measured. The linear polarization curve measurements were conducted at a 0.166 mV/s scan rate, ranging from –0.02 V to +0.02 V (VS. OCP). Cview software (Version 3.5) was used to fit the test data. Since EIS can only be measured under open-circuit potential or stable DC currents, the EIS measurement was conducted at a fixed DC density after the potential was stable. The frequency range of the EIS was from 100k Hz to 10m Hz with a 10mV sinusoidal signal. The EIS curves were fitted by Zsimpwin software (Version 3.60). In this work, all of the tests were operated at about 20 °C. The samples were supplied with DC densities of 0   mA / cm 2 , 0.25   mA / cm 2 , 0.5   mA / cm 2 , 1   mA / cm 2 , 2   mA / cm 2 and strains of 0, 0.5 × 10 3 , 1.0 × 10 3 , 1.5 × 10 3 , 3.0 × 10 3 , respectively.

2.5. Morphologies Characterization Analysis

The morphology of the corrosion products of the sample surfaces was characterized using a Zeiss Gemini 300 (Zeiss Ltd., Jena, Germany) scanning electron microscope (SEM) with energy dispersive X-ray analysis (OXFORD INCAPentaFET-x3, Oxford Instruments, Oxfordshire, England).
The samples that were subjected to different currents under strained and unstrained conditions were immersed for 24 h to analyze the composition of the corrosion products using Raman spectroscopy (HORIBA Scientific LabRAM HR Evolution, HORIBA Ltd., Kyoto, Japan). Raman spectra were obtained with a 100× objective; excitation wavelength: 532 nm; focused beam diameter: 11 μm; test range: 150–1500 cm−1.
After the removal of superficial corrosion products, the samples were examined with an SEM to observe the corrosion morphology. Before observation, the corrosion products were carefully removed using chemical (acid-hexamethylenetetramine corrosion inhibitor solution) and mechanical methods according to ASTM G1-03 [30].

3. Results

This section is divided by subheadings. It provides a concise and precise description of the experimental results and their interpretation as well as the experimental conclusions that can be drawn from them.

3.1. Potential Analysis

Figure 4 shows the changes in potential of X80 steel samples under different DC densities and strains values. There were two kinds of potential in this plot: the OCP potential (NO-DC potential) and the polarizing potential (DC-ON potential). The DC-ON potential shifted positively after the DC currents were supplied. The NO-DC potential was maintained at about −0.74 V, and it decreased with the increase in the applied strain. When i DC = 0.25   mA / cm 2 , the corrosion potential rose to approximately −0.62 V. The DC-ON potential increased with the current density and roughly followed a linear trend. In addition, the potential drift caused by the DC currents is regarded as a CP shift in actual engineering. A significant potential shift may increase the risk of pipeline corrosion [28].

3.2. Linear Potential Resistance

Figure 5 shows the linear polarization resistance values of X80 steel in the NS4 solution under the different strains and DC densities. The linear polarization resistance ( R p ) was used to analyze the influence the of DC currents and the strain on the corrosion of the X80 steel. There was a negative correlation between R p and the corrosion rate [31,32]. As shown in Figure 5, in the absence of the DC currents and applied strain, the R p value was 2524.20   Ω · cm 2 . It decreases with increasing strain, reflecting the fact that strain increases the corrosion activity of X80 steel. In the presence of DC currents, the R p value decreases instantaneously. As the DC density increases to 0.25   mA / cm 2 , the R p sharply decreases to 186.87   Ω · cm 2 , over 1/10 of that occurring without DC. When the current density reached 2   mA / cm 2 , the R p value sharply decreases to 55.68   Ω · cm 2 . When the DC density is higher than 0.25   mA / cm 2 , the R p value at a constant DC density is the smallest in the absence of a strain and is the biggest in the presence of a strain. The above results indicate that either the strain or the DC currents can accelerate the corrosion rate of X80 steel in a simulated soil solution. However, when the strain and DC currents were applied to the steel sample simultaneously, the strain was only expected to slightly impede corrosion.

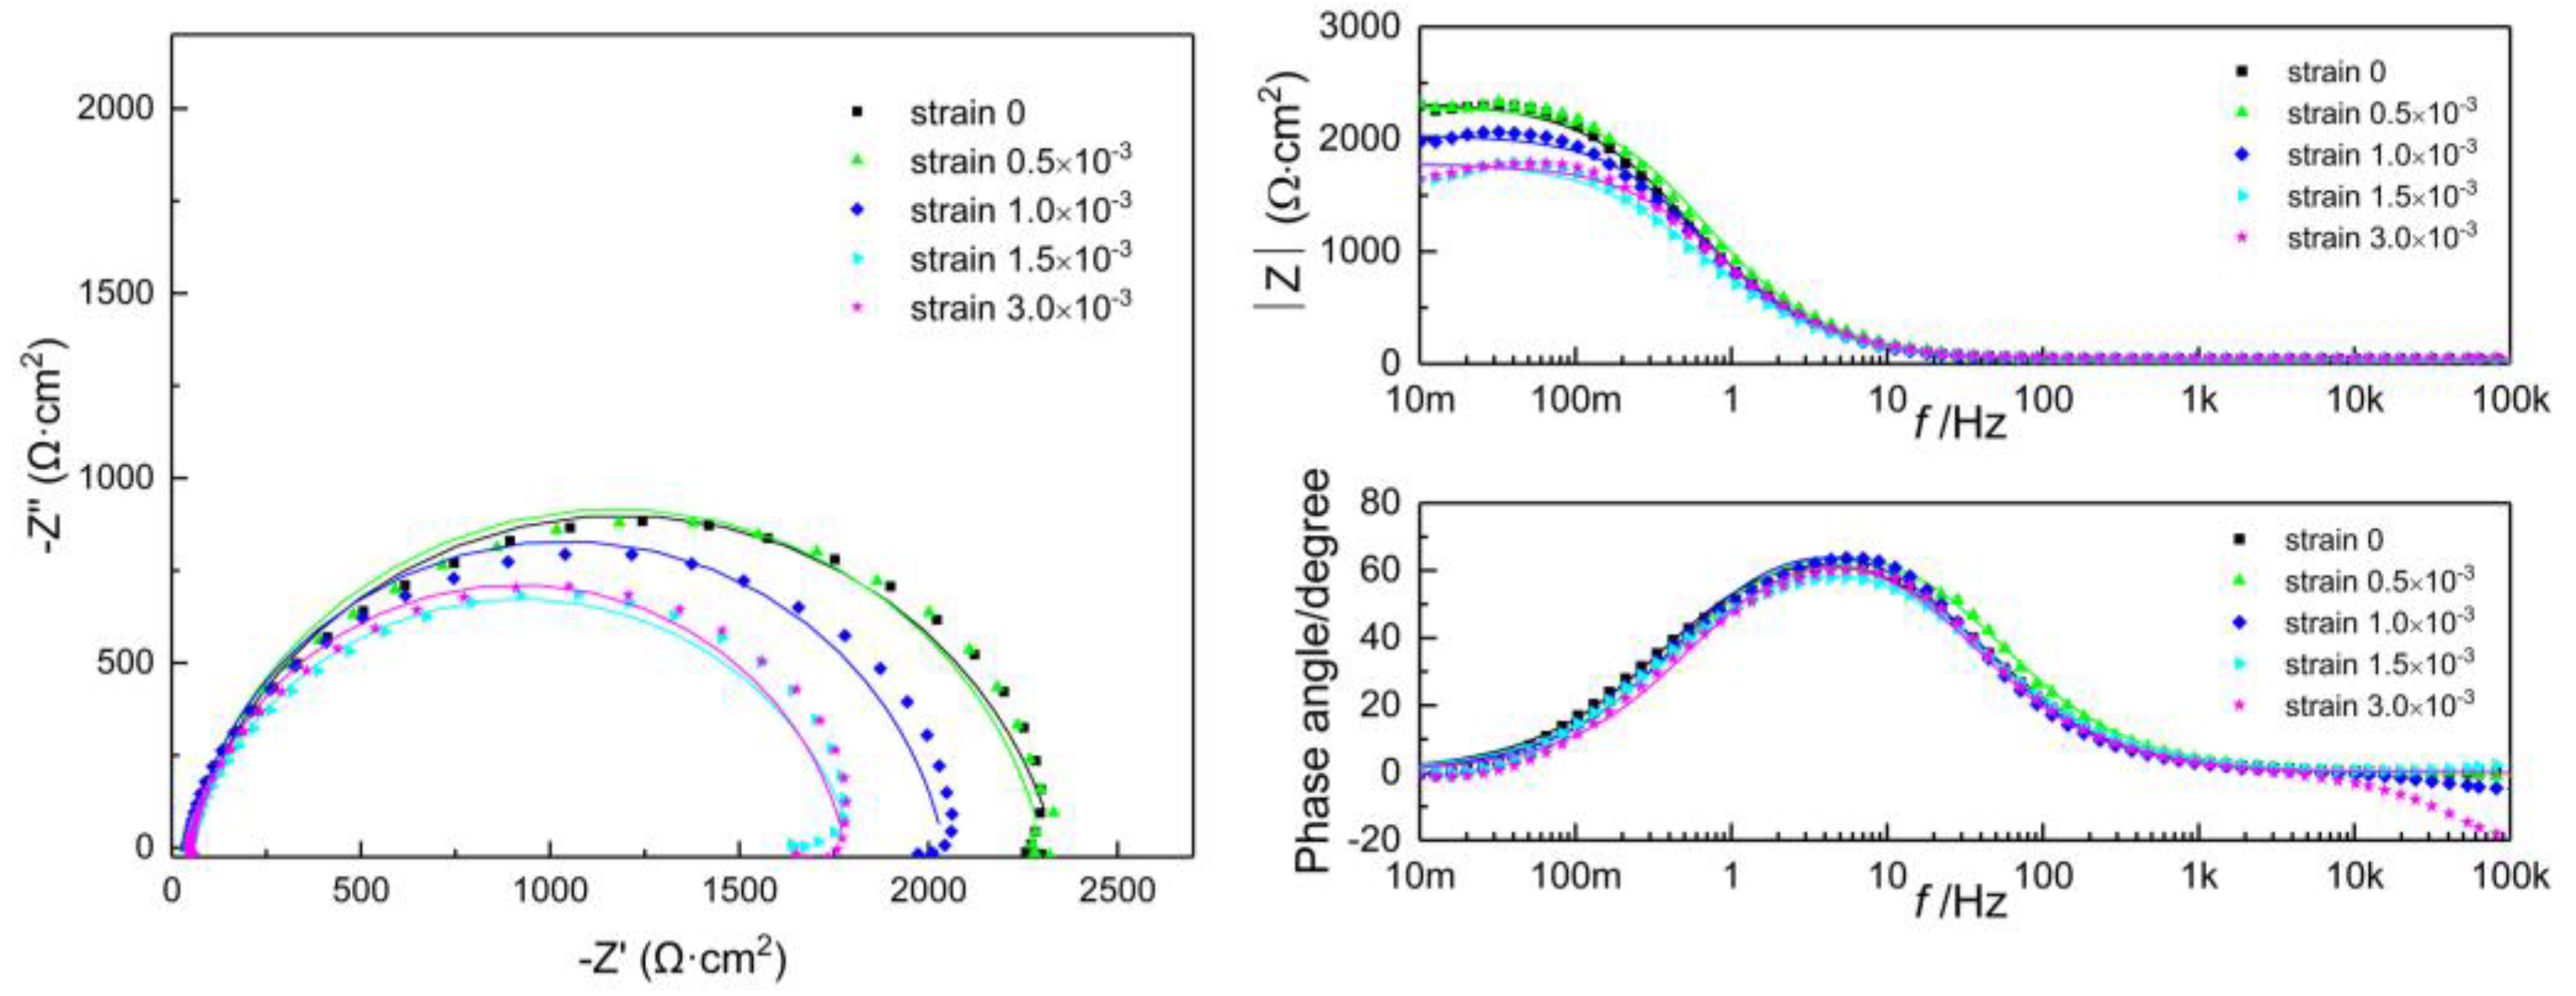
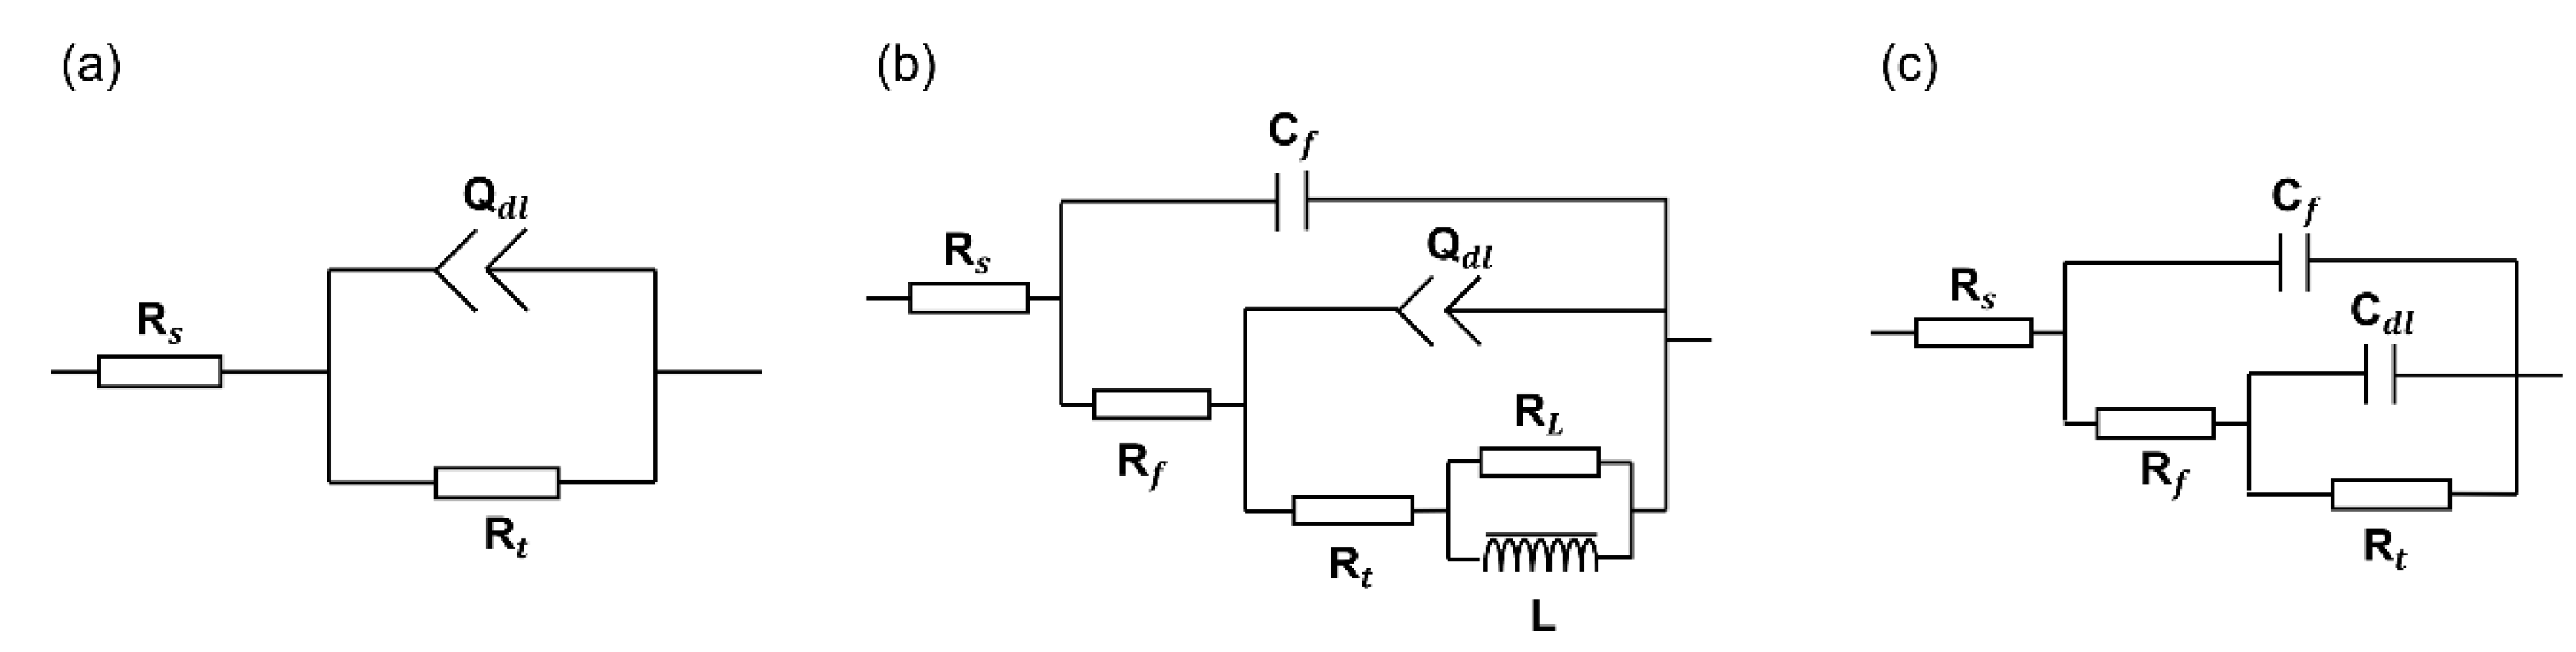
3.3. Electrochemical Impedance Spectroscopy

Figure 6 shows Nyquist and Bode diagrams of the X80 steel in the NS4 solution under the different applied strains at i DC = 0   mA / cm 2 . In the low-frequency regions(the frequency was above 10 Hz), a capacitive loop could be observed for all of the conditions. As shown in Figure 6, the capacitance is semi-circular, which indicates that the corrosion process of the X80 steel sample is controlled by the charge transfer process in the NS4 solution; thus, the steel samples are in an active dissolution state during the entire experiment. Moreover, the radius of the capacitance decreases with an increase in strain, indicating that the charge transfer resistance decreases with an increase in strain and the corrosion resistance decreases accordingly [33,34].
Figure 7a–c show the Nyquist and Bode diagrams of X80 steel with different DC densities and applied strains. All of the curves show two capacitive reactance arcs at high and intermediate frequencies and one inductive reactance arc at a low frequency. The high-frequency capacitive reactance arc corresponds to the corrosion product film. The intermediate frequency capacitive reactance arc corresponds to the dissolution reaction of X80 steel, which can be attributed to the electric double layer on the steel’s surface. The low-frequency inductive arc is caused by the formation process of pitting corrosion on the electrode’s surface [35,36]. As shown in Figure 7d, when the DC density further increases to 2   mA / cm 2 , the inductive loop disappears, which may be caused by the rapid formation of corrosion pits due to larger the DC density. The size of the intermediate frequency semicircle is inversely proportional to the charge transfer resistance, and it decreases as the DC density increases. This trend is consistent with the law shown in linear polarization resistance. Therefore, the corrosion rate of the X80 steel increases with the increase in the DC density. However, the radius of the capacitive reactance arc is limited by the applied strain.
According to the abovementioned electrochemical system characteristics, the equivalent circuit model of impedance spectroscopy was established. Figure 8 shows the equivalent circuit of the EIS of X80 steel in an NS4 solution with different DC densities, where R s is the solution resistance; C f and R f represent the capacitance and resistance of the corrosion product, respectively; Q dl replaces the double-layer capacitance; R t represents the charge transfer resistance of the double electric layer; L is the inductance; and R L represents the inductance resistance. Q dl is represented as follows [33,36]:
Z = ( Y 0 ) 1 ( j ω ) n
where Y 0 is the CPE constant, ω is the angular frequency, and n is a factor; when it approaches −1, 0, or 1, CPE is an ideal electrical component. ZSimpWin software was used to fit the test data. The fitted parameters of the components of the equivalent circuits obtained are shown in Table 3 and Table 4.
As shown in Table 3, in the absence of DC currents, the R t value decreases with an increase in strain. Specifically, when the strain increases from 0 to 3 × 10 3 , the R t decreases from 2293   Ω · cm 2 to 1800   Ω · cm 2 . When the DC current of 0.25   mA / cm 2 is applied, the R t value instantly drops to 1/20 of that without DC currents. Additionally, the R t value is only 12.39   Ω · cm 2 as the DC density increases to 2   mA / cm 2 (see Table 4). However, when the DC density increases to greater than or equal to 0.5   mA / cm 2 , the R t value slightly increases with a rise in the strain under the same DC density. The results show that DC currents significantly reduce the charge transfer resistance between the electrode interface and the electrolyte solution, which then enhances the corrosion of the X80 steel in the NS4 solution. In addition, when DC currents are applied, the strain has a limited effect on the corrosion process.

3.4. Microscopic Characterization of Corrosion Products and Morphology

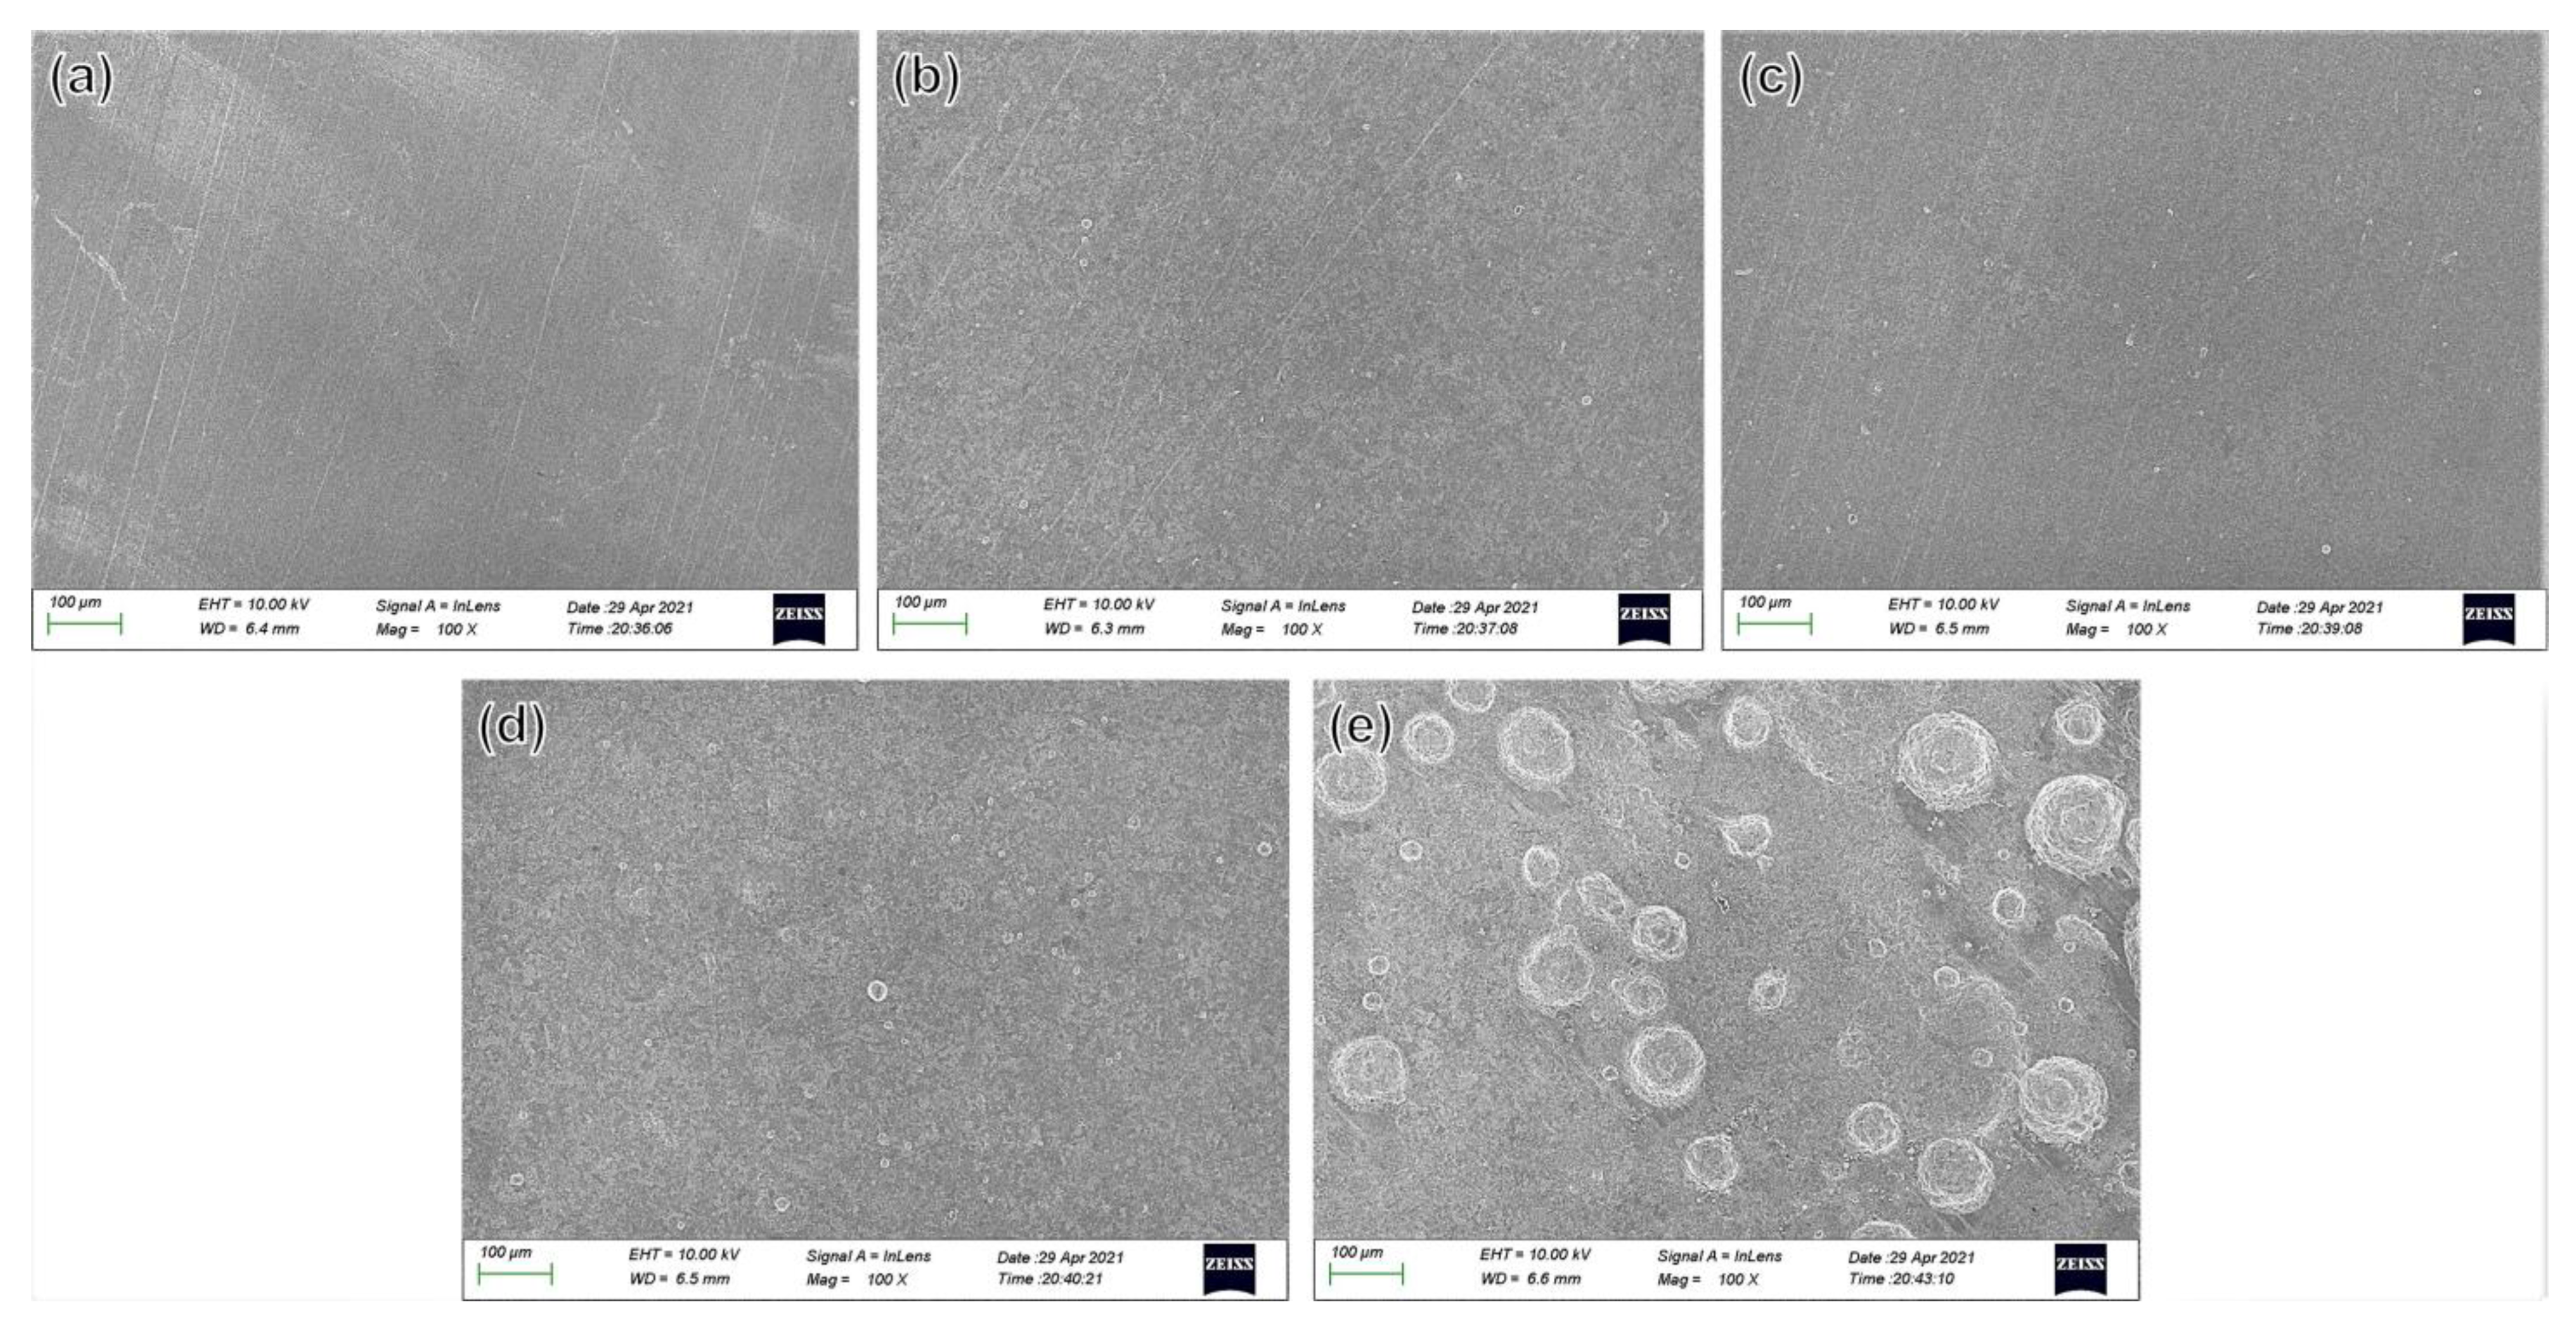
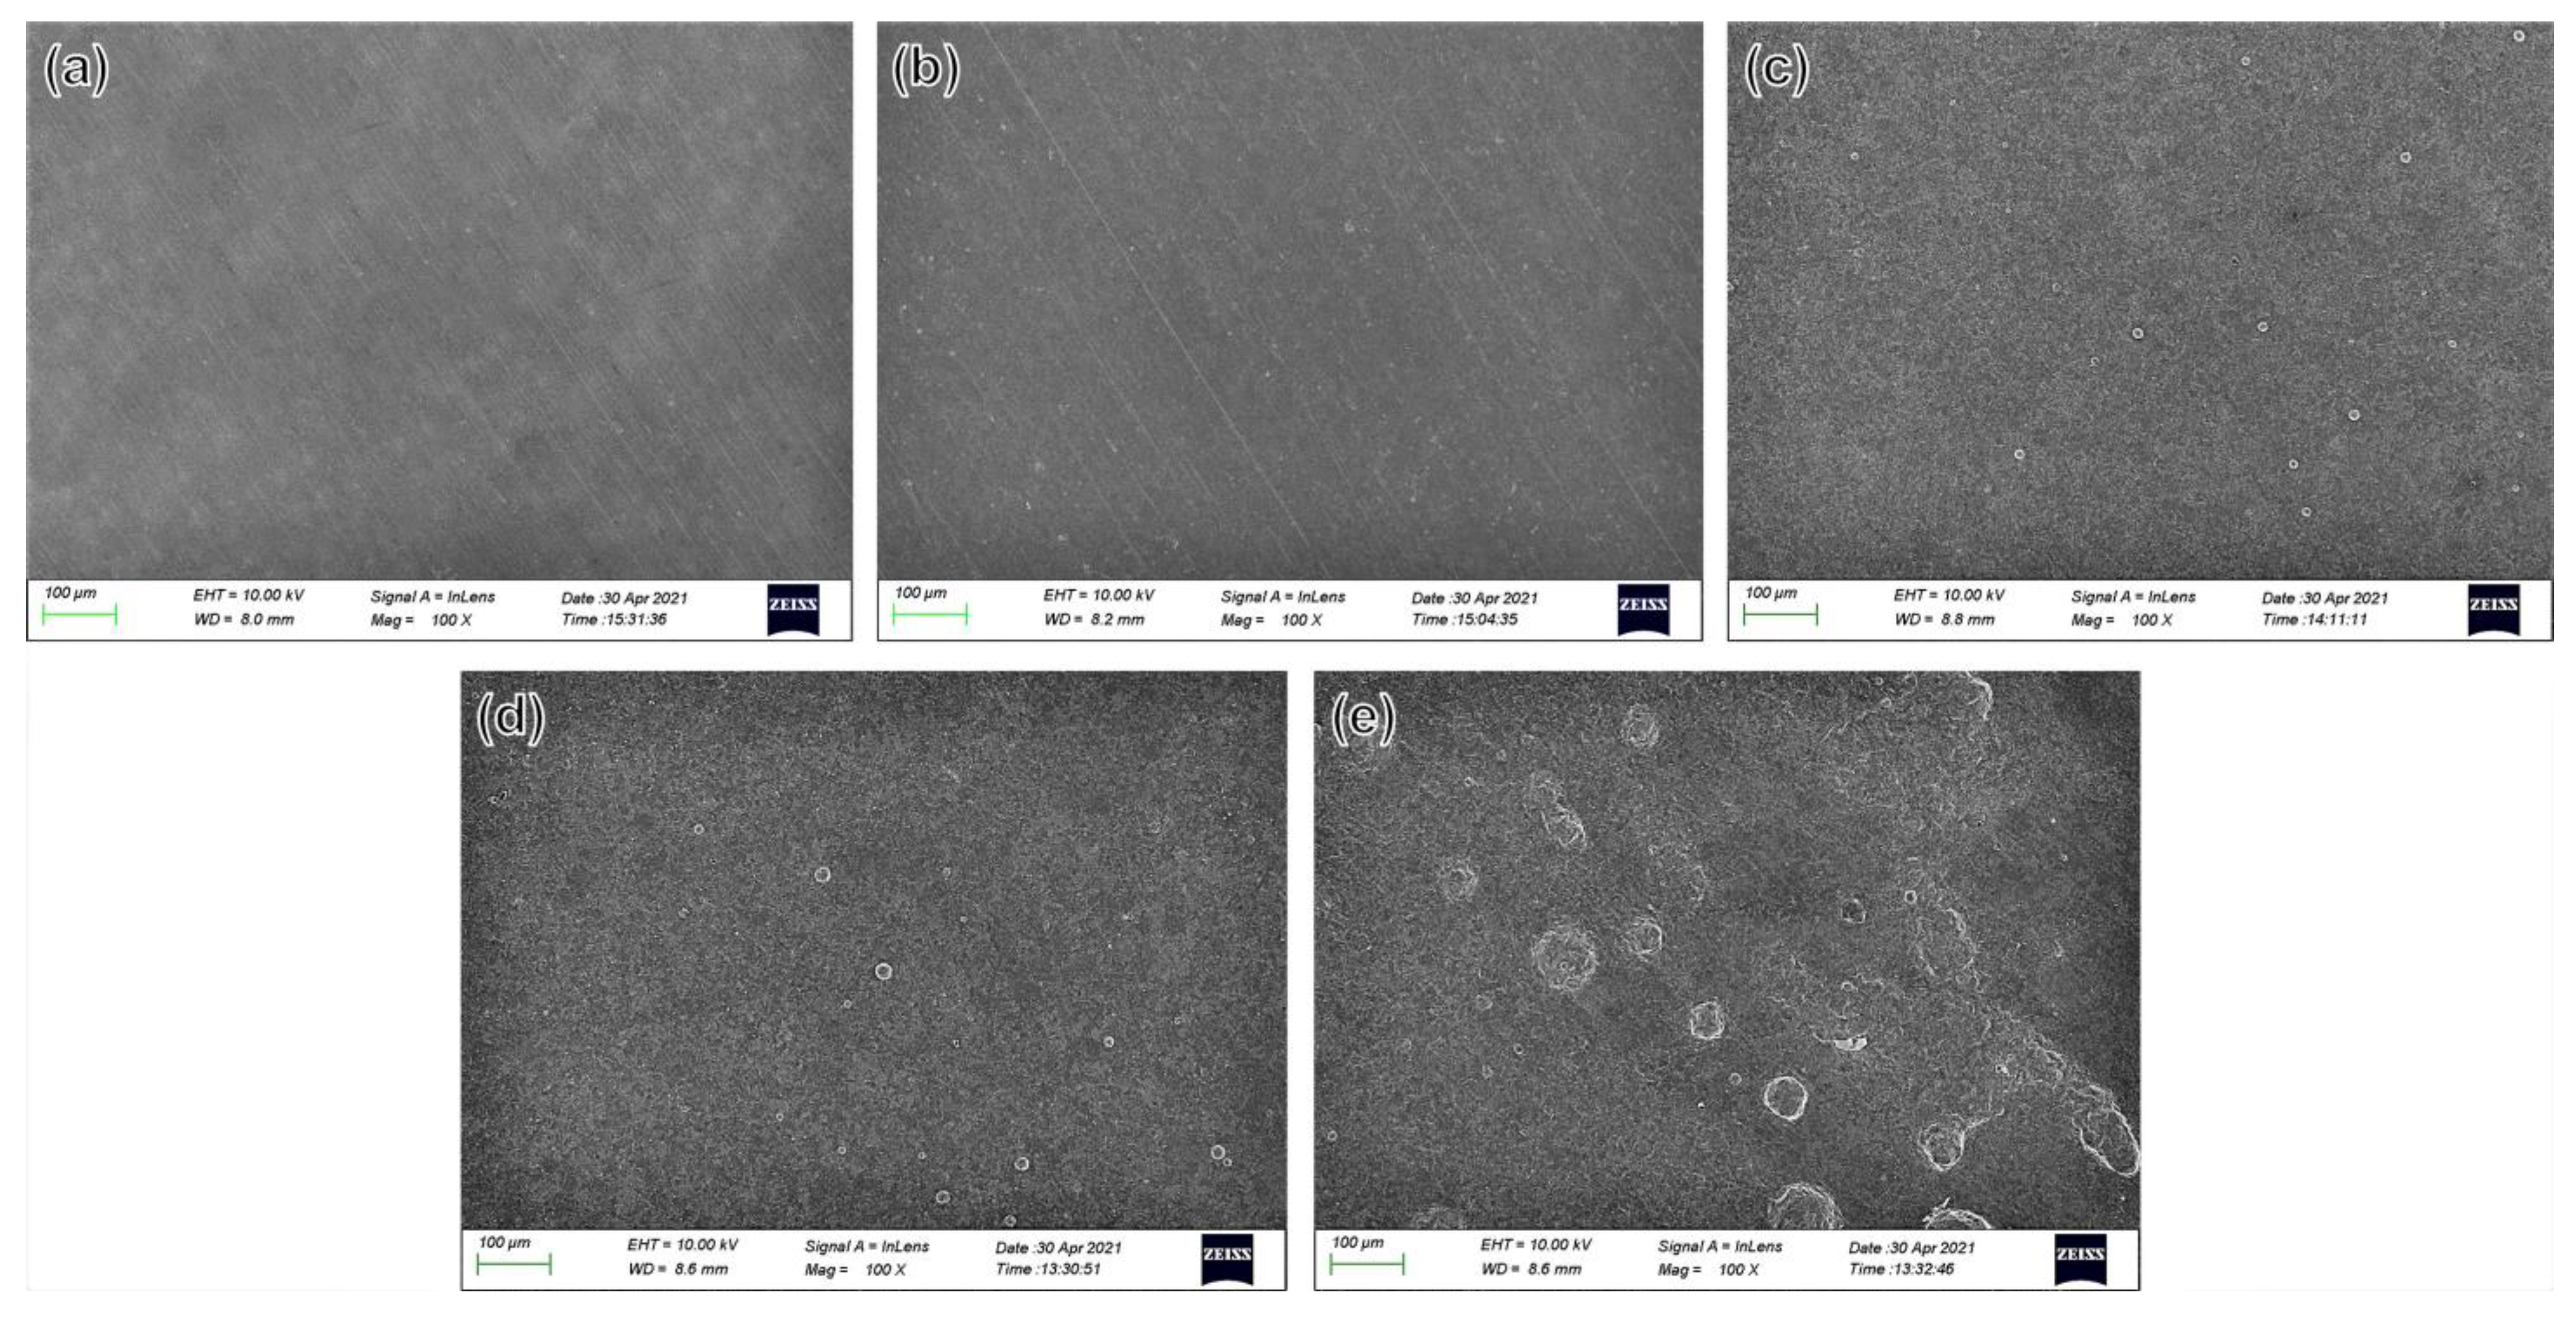
3.4.1. Scanning Electron Microscopy Morphology of the Corrosion Products

Figure 9 shows SEM pictures of the X80 steel after corrosion in an NS4 solution only under the influence of stray currents of different DC densities. When the DC density was 0   mA / cm 2 , only a tiny number of iron oxides were distributed in the granular form (see Figure 9a), indicating that the X80 steel could generate corrosion products in the NS4 solution but at a slower rate. When the DC density increased to 0.25 mA/ cm 2 , the corrosion morphology showed a more significant change (see Figure 9b). It can be clearly seen that the corrosion product layer became thicker than it did without DC interference and formed some tablet-like products. The products occupied the majority of the corroded surface, which was possibly composed of hematite [37]. This significant change may be due to DC interference. When DC density increased to 0.5 mA/ cm 2 (see Figure 9c), these tablet-like corrosion products began to transform into denser spherical corrosion products. When the DC density increased to 1 mA/ cm 2 , most of the tablet-like iron oxides were transformed into spherical structures. With the increase in the DC density, the cracks on the corrosion product layer increased significantly, which appeared to be loose and porous. These cracks are more conducive to the penetration of corrosive ions in the solution as well as to the diffusion of iron ions, which further promotes corrosion.
Figure 10 shows SEM pictures of the X80 steel immersed in NS4 solution for 2 h under different DC densities and at 3 × 10 3 strain. The changing trend is the same as that without strain. The corrosion products increased and thickened with the increase in DC density. In addition, as the DC density increases, more cracks can be observed in the corrosion product layer. Compared to Figure 9a, it can be seen that even in the absence of DC currents, the corrosion of the electrode surface with strain was more severe than that without strain, which indicates that strain can promote corrosion. However, in the presence of both DC currents and strain, a denser and tighter corrosion product film with fewer cracks was formed, which may hinder the diffusion of ions to some extent.
Table 5 shows the surface EDXA results of the X80 steel sample in the NS4 solution under different DC currents and strains. It can be seen that the elements in corrosion products on the steel’s surface contain C, O, Mg, Cl, Ca, and Fe, where Fe is derived from the corrosion process and C, O, Mg, Cl, and Ca come from the corrosive solution.

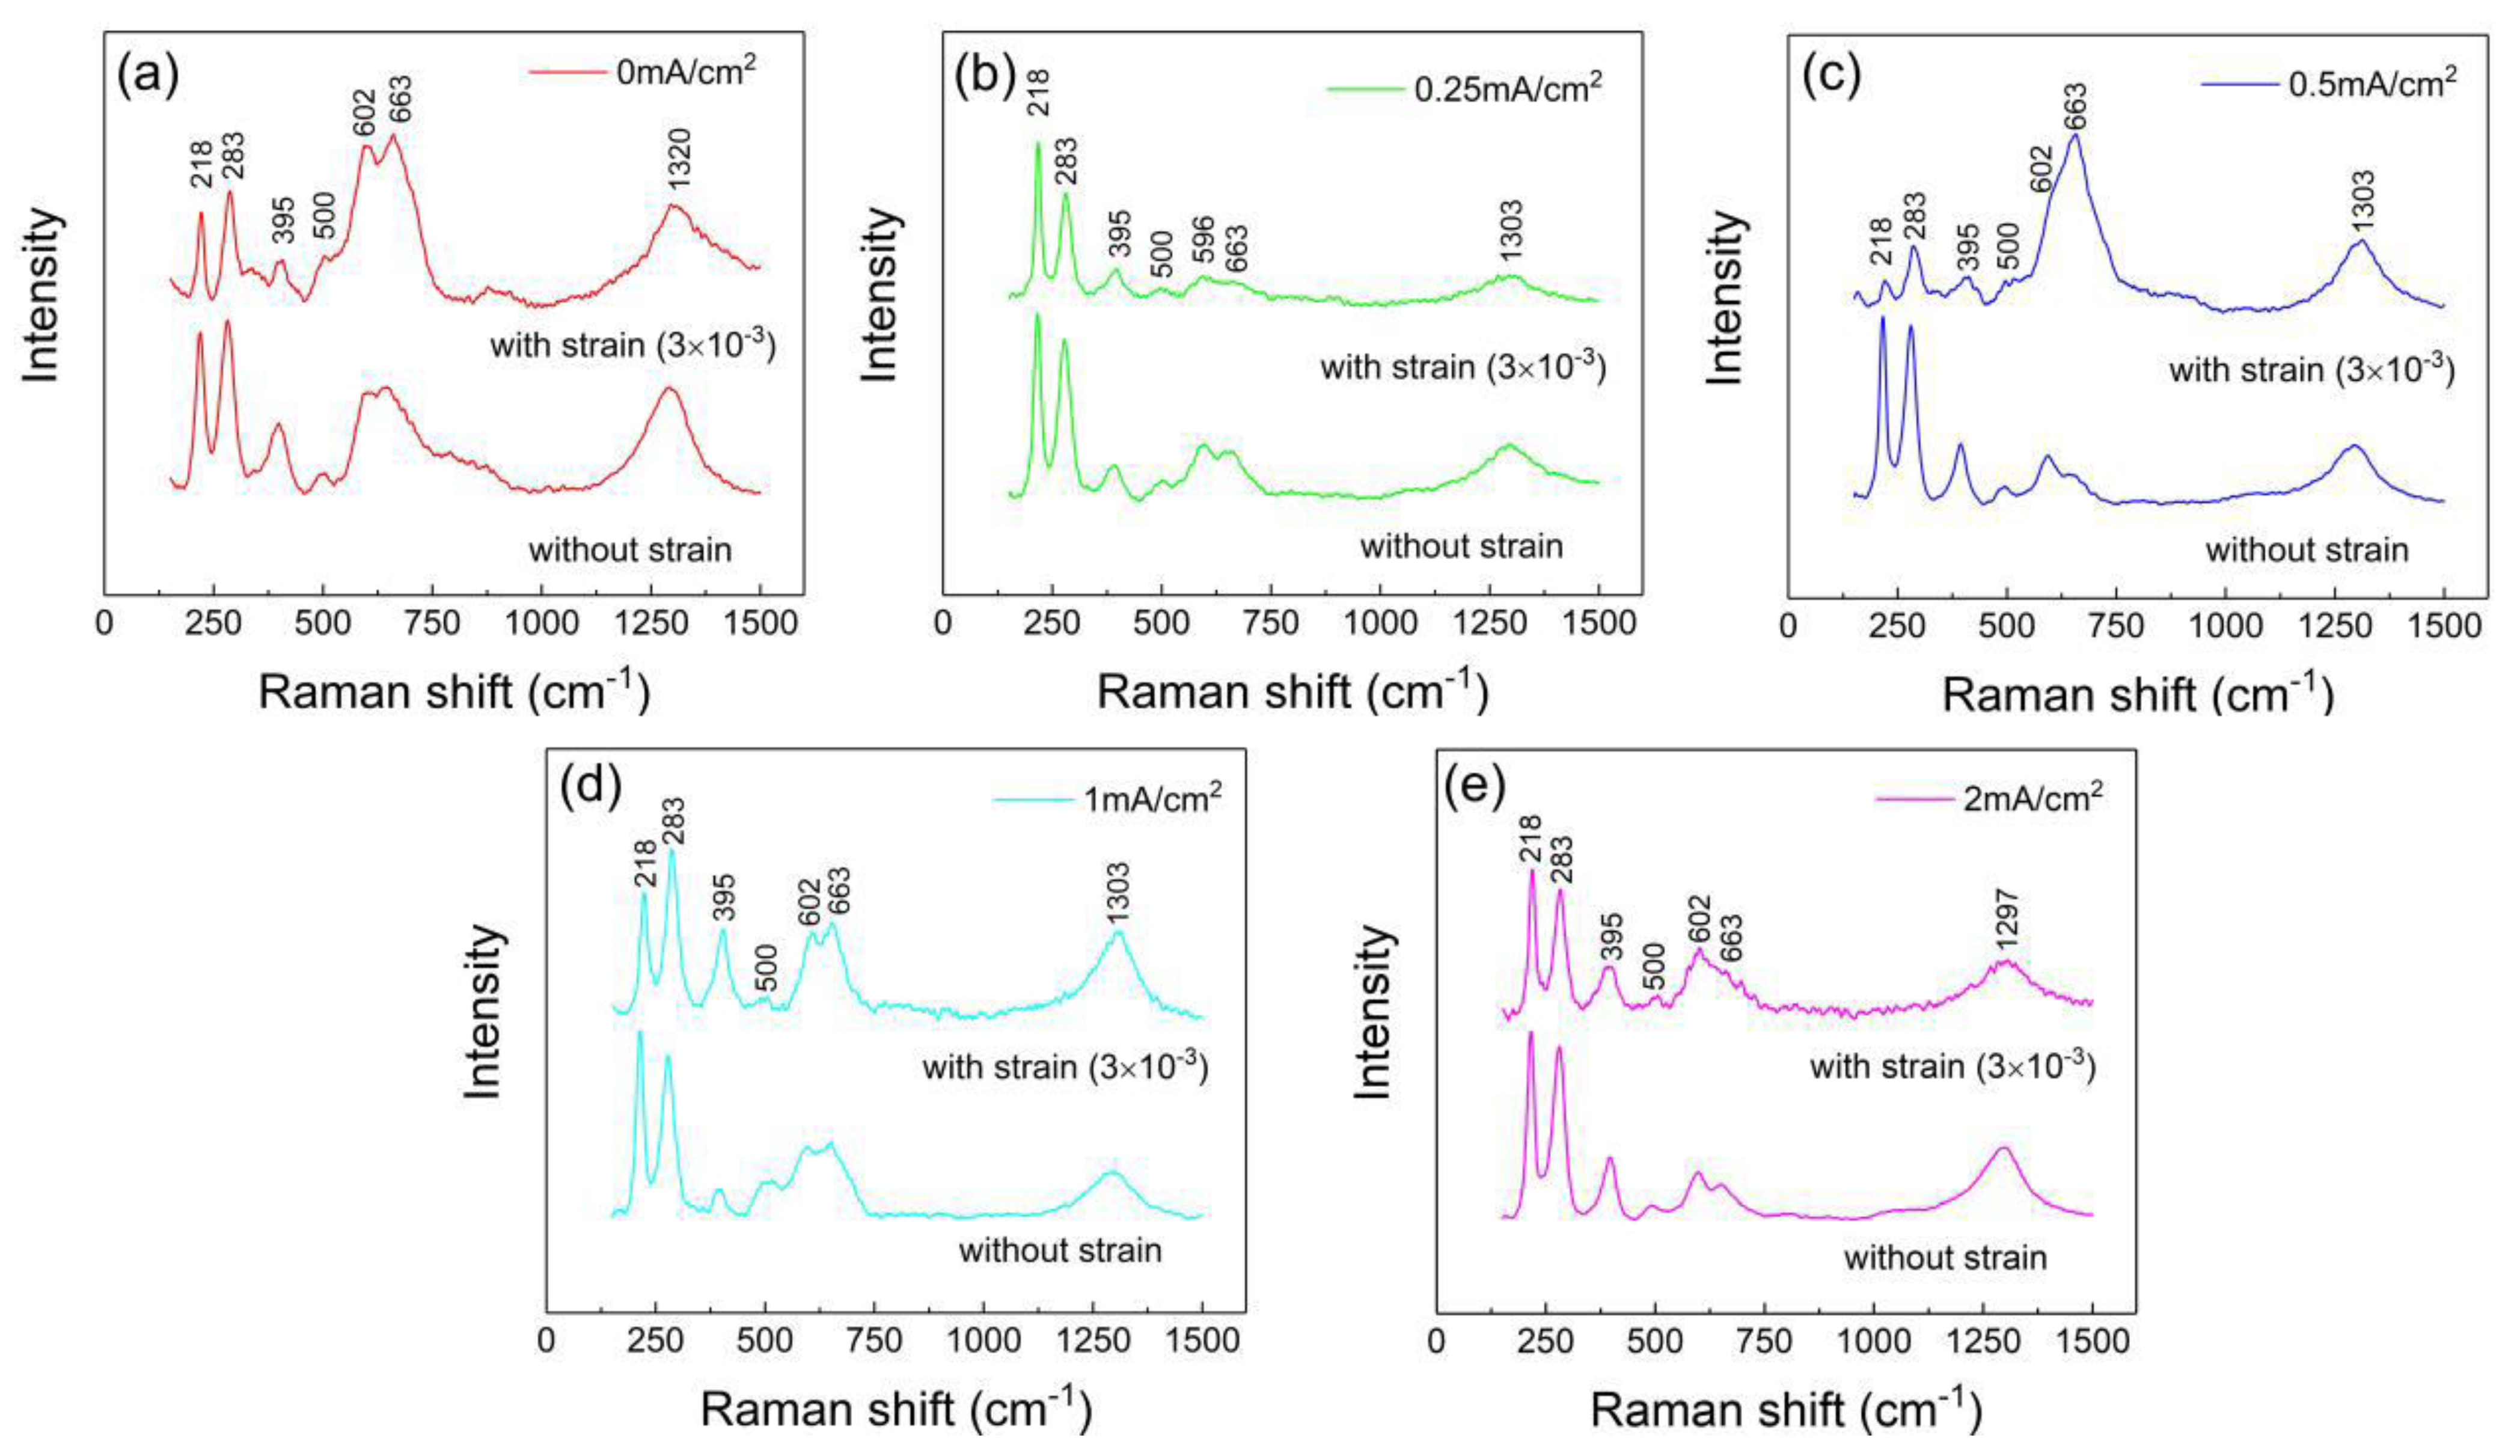
3.4.2. Raman Spectrum Analysis of the Corrosion Products

Raman spectroscopy was used to investigate the composition of the corrosion products on the steel samples. Figure 11 shows the Raman spectra of X80 steel samples as a function of DC current without strain and with strain ( 3 × 10 3 ). All of the samples have similar peaks. The characteristic peaks of the standard phases of iron oxide and oxyhydroxide under the Raman laser were observed in this study. The characteristic peaks of α Fe 2 O 3 were at 218, 283, 596, and 602   cm 1 . Additionally, the peak at 395, 500   cm 1 can be considered the characteristic peak of α FeOOH . Fe 3 O 4 was observed at 663   cm 1 . When no DC currents were applied, the characteristic peak of α FeOOH was observed at 1320   cm 1 . When DC currents were applied, the characteristic peak of γ FeOOH appeared at 1297 and 1303   cm 1 [38,39,40]. γ FeOOH is generally considered to be an unstable, porous, electrochemically active product that mainly forms on the surface [41,42]. Its formation further promotes the oxidation–reduction reaction on an electrode’s surface, accelerating the corrosion of X80 steel [32,43].

3.4.3. Analysis of Corrosion Morphology

Figure 12 and Figure 13 demonstrate the SEM images of the X80 steel samples with and without strain in the corrosion process after the removal of corrosion products, respectively. As shown in Figure 12, the sample without strain and applied DC currents was not obviously corroded (see Figure 12a). Scratches on the surface due to polishing can be found. In the presence of DC currents, some small and shallow corrosion pits were apparently formed on the surface of the sample. As the current density increased, the pits became larger and denser. When DC density was up to 2   mA / cm 2 (see Figure 12e), the entire steel surface was wholly corroded, and the depth and width of the pits were far greater than those without DC.
In the case of strain, as shown in Figure 13, a small number of pits was observed on the steel without DC currents, which indicates that the strain will reduce the pitting resistance of X80 in the NS4 solution. However, there was a discernible difference in the corrosion morphology between the steels with and without pre-stain.

4. Discussion

4.1. Formatting of Mathematical Components

Various defects often appeared during the formation of the corrosion product film. As shown by the SEM results (Figure 9 and Figure 10), the thickness of the corrosion product film increased with DC interference. When the DC density is greater than 0.25   mA / cm 2 , cracks can be observed on the corrosion product film (see Figure 9c–e), which may be caused by the electrostriction effect of the sample under the electric field [44]. Xu et al. [20] found that the change in the corrosion scale structure is also an essential factor affecting the corrosion rate. A corrosion scale with greater porosity will cause corrosive ions to contact the steel sample more quickly, further accelerating corrosion. While the strain and the DC currents were applied simultaneously to the sample, the corrosion product film became denser than when only the DC currents were applied although there were still many visible cracks. Cui et al. [45] suggested that as the strain increased, the surface energy of the steel surface also increased, and the electrostriction effect caused by the electric field might be weakened to a certain extent, making it easier for corrosion products to be deposited on the surface and to form a denser plate-like structure. A thick corrosion product layer blocks the intrusion of some corrosive ions and enhances the protection of metal substrates. This may be why corrosion rates do not change significantly with an increase in strain under a particular DC density.

4.2. Formatting of Mathematical Components

The polarization resistance of the steel sample in the NS4 solution can also be obtained by fitting the equivalent circuit in EIS [36,46]:
1 R p = 1 R f + R t + R L
where R p can be used to evaluate the corrosion of metals, and the corrosion current density can be estimated based on the Stern–Geary Equation:
i c o r r = B R p
where B (mV) is an empirical constant; a voltage of 26 mV was used in this work [47,48].
For the electrode affected by DC, the steel sample in the anode zone was anodically polarized to Fe 2 + in the electric double layer, causing the potential to move in the positive direction. Therefore, the corrosion current density was calculated according to Formula (3), and Faraday’s law was used to calculate the corrosion rate of X80 steel under DC currents and stress loading:
v d = 8.76 × 10 3 × i c o r r M z F ρ   ( mm · a )
where v d is the corrosion rate ( mm / a ), i c o r r is the corrosion current density ( mA · cm 2 ), M is molar mass of the metal ( g · mol 1 ), F is Faraday constant (96,485 C · mol 1 ), and ρ is the density of the carbon steel ( g · cm 3 ).
Figure 14 shows the corrosion rates of the samples with and without strain under different DC densities. They were obtained by linear polarization fitting (see Figure 14a) and EIS fitting (see Figure 14b), respectively. When i DC < 0.5   mA / cm 2 , the corrosion rate of the sample with strain is larger than that without strain. However, in the case of i DC > 0.5   mA / cm 2 , the strain will hinder the acceleration of corrosion to a certain extent. In addition, the corrosion caused by DC currents is much higher than that caused by strain alone. When the i DC is 0.25   mA / cm 2 , the corrosion rate is more than ten times higher than it is without DC. It can be concluded that when there are no DC currents or when the current density is relatively small, DC currents and strain will jointly promote corrosion. DC currents have a more severe effect on the corrosion of steel compared to strain. Nevertheless, when the DC density is larger than 0.5   mA / cm 2 , the strain will slightly reduce the corrosion rate of our steel sample.

4.3. Corrosion Process of X80 Steel under DC Currents and Strain

The corrosion of the steel in the deoxidized, nearly neutral NS4 solution is an electrochemical process that can be divided into anode and cathode reactions. The anode reaction is the dissolution of steel, and the reduction in water occurs at the cathode [49,50]:
Anodic reaction:
Fe Fe 2 + + 2 e
Cathodic reaction:
2 H 2 O + 2 e H 2 + 2 OH
A Raman spectrum shows that the corrosion products were mainly composed of α Fe 2 O 3 , α FeOOH , γ FeOOH , and Fe 3 O 4 . As 5 %   CO 2 + 95 %   N 2 was used continuously to purge the solution, the injected CO 2 hydrates with the solution to form a weak acid, H 2 CO 3 , which generated an additional amount of CO 3 2 in the solution. Then, CO 3 2 and OH reacted with the Fe 2 + of the anode to form FeCO 3 and Fe ( OH ) 2 , which was deposited on the steel’s surface, forming the porous and loose corrosion products:
Fe 2 + + CO 3 2 FeCO 3
Fe 2 + + 2 OH Fe ( OH ) 2
Fe ( OH ) 2 oxidized to the iron oxide by the trace amount of dissolved oxygen in the solution. A part of α FeOOH was further converted to α Fe 2 O 3 by dehydration. Additionally, FeCO 3 was electro-oxidized to α FeOOH , γ FeOOH , and Fe 3 O 4 by the polarization of a relatively positive potential [49,51,52].
6 Fe ( OH ) 2 + O 2 2 Fe 3 O 4 + 6 H 2 O
6 Fe ( OH ) 2 + O 2 α FeOOH + 6 H 2 O
2 α FeOOH α Fe 2 O 3 + H 2 O
FeCO 3 + H 2 O α FeOOH / γ FeOOH + CO 3 2 + 3 H + + e
3 FeCO 3 + 5 OH Fe 3 O 4 + 3 HCO 3 + H 2 O + 2 e

4.4. Proposed Mechanism of X80 Pipeline Steel Corrosion with DC Currents and Strain Applied

Figure 15 illustrates the proposed mechanism of DC and strain on the corrosion of X80 steel in the NS4 solution. As shown in Figure 15a, under the natural corrosion of X80 steel, OH obtained from the cathodic reaction with Fe 2 + generated by anodic oxidation formed Fe ( OH ) 2 , while CO 3 2 also reacted with Fe 2 + to obtain FeCO 3 , which was partially deposited on the electrode’s surface. Subsequently, the products were oxidized to and Fe 3 O 4 by a trace amount of dissolved oxygen in the solution. In the presence of DC currents, as shown in Figure 1b, the FeCO 3 deposited on the electrode’s surface was electro-oxidized oxidized by DC interference into α FeOOH , γ FeOOH , and Fe 3 O 4 . The steel was affected by anodic polarization. The iron ions were then rapidly diffused into the solution under the electric field, resulting in a decrease in the concentration of iron ions at the electrode–solution interface. The solubility of the steel electrode was further increased to reach a new balance, which led to an increase in corrosion rate [27].
The case of strain only is shown in Figure 15c. On the one hand, according to Gutmann’s mechanical–electrochemical theory, the applied load affects an electrode’s equilibrium potential [53]. When the steel is within the range of elastic deformation, the electrode potential Δ ϕ is calculated by:
Δ ϕ = Δ P V i z i F
where Δ P represents the load applied to the electrode, V i represents the molar volume of the electrode, is the valence of the metal ion, and F is the Faraday constant (96,485   C · mol 1 ). When the steel is within the range of plastic deformation, the electrode potential can be expressed by:
Δ ϕ = n Δ τ R α ¯ k N m a x z F
where n is the number of dislocations in a dislocation pile-up, Δ τ is the degree of hardening, R is the gas constant, α ¯ is the average dislocation density, k is the Boltzmann constant, and N m a x represents the maximum density of dislocation. Lu et al. [54] found that V i was slightly changed during an electrode’s deformation process under stress loading. Therefore, from Equation (14), as the stress increases, the electrode potential shifts in the negative direction. The offset parameter may increase with the strain on the steel’s surface, further increasing the electrode surface’s electrochemical activity and corrosion risk. In addition, the applied load tends to cause stress concentrations at surface defects. These areas have higher electrochemical thermodynamic activity and lower negative potential than other areas, increasing the possibility of corrosion.
On the other hand, Cui et al. [45] believed that the corrosion effect of stress–strain on the steel sample also came from the change in its surface energy. The surface energy increases with strain. A larger surface energy has higher hydrophilicity than one without strain, affecting the corrosion process. Moreover, sizeable elastic deformation is often accompanied by plastic deformation. Under the influence of elastic–plastic deformation, the change in surface dislocation density leads to a change in cathodic reaction distribution, which affects the hydrogen evolution reaction and increases the corrosion rate of the sample [25].
In the presence of both DC currents and strain, as shown in Figure 15d, the effect of strain on corrosion is not noticeable. A possible explanation for this might be that when the corrosion rate in the unstressed state is high, the sensitivity of a corrosion to strain will be sharply reduced [53]. At this point, the stress–strain curve has a limited effect on the electrode, and DC currents primarily dominate the corrosion. Another possible explanation for this is that strain loading will increase the electrochemical activity of the steel electrode surface, at least to a certain extent. However, when strain and DC currents are applied together, a denser corrosion product layer will be formed on the electrode’s surface, hindering the ferrous iron produced by anodic oxidation. The diffusion of ions and the intrusion of corrosive anions into the metal–film interface offsets the corrosion acceleration caused by the increase in electrochemical activity.

5. Conclusions

The effect of DC stray currents and strain on the corrosion of X80 steel in an NS4 soil simulation solution was investigated by electrochemical measurements and surface analysis techniques. The main conclusions are as follows:
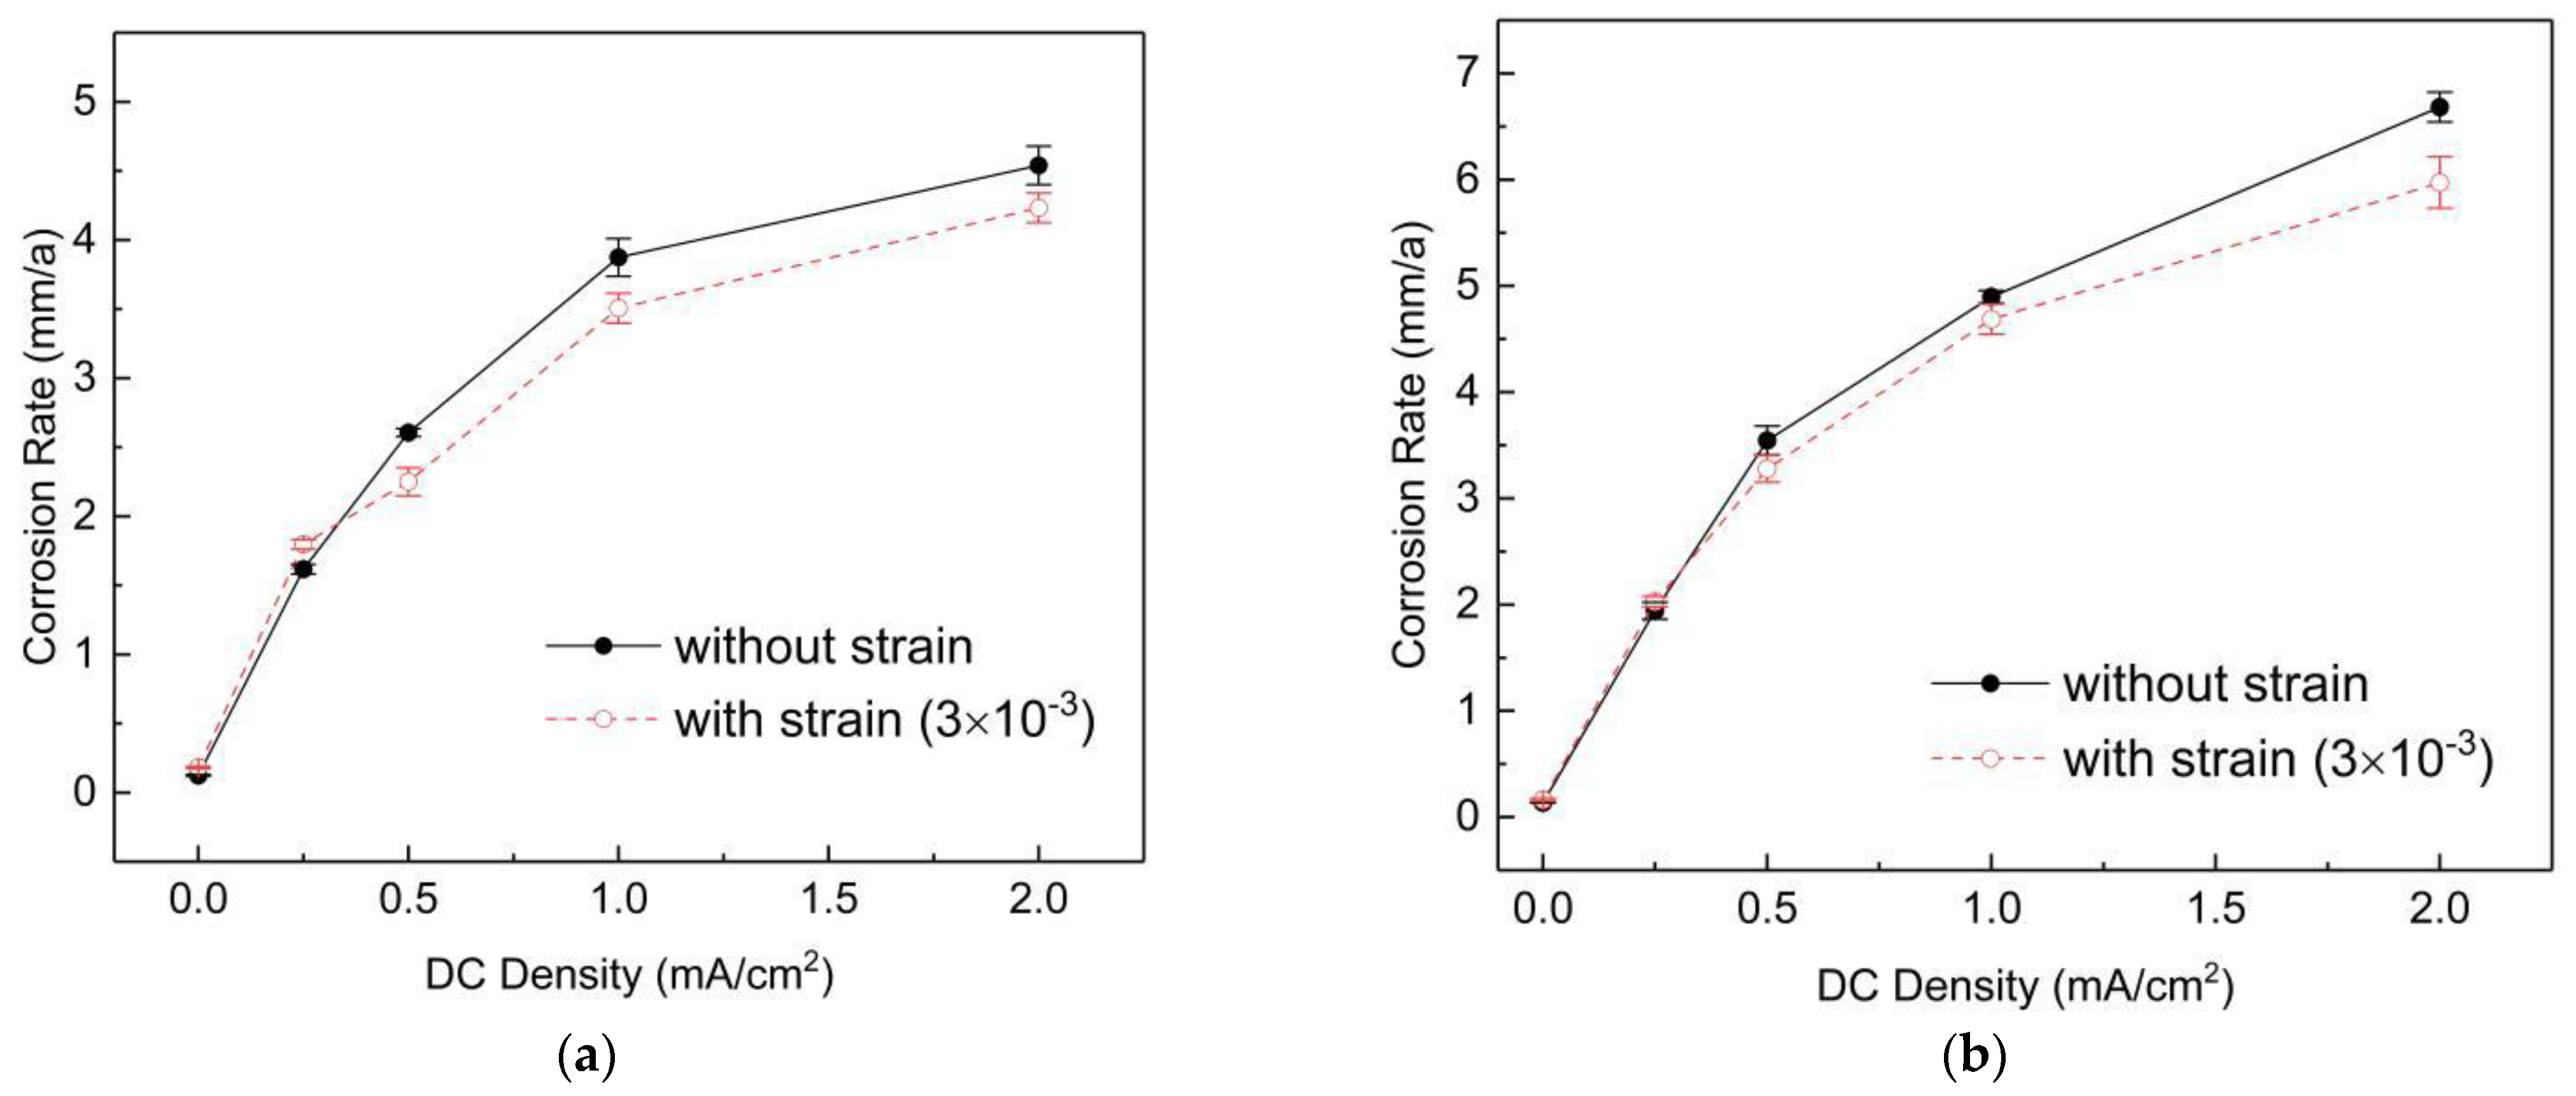
  • Both DC currents and strain can promote the corrosion of X80 in a near-neutral soil simulation solution, but the influence of DC currents is much more significant than strain.
  • When both DC currents and strain are applied, they have a synergistic effect on the corrosion of the steel sample if the i DC < 0.5   mA / cm 2 . However, if i DC > 0.5   mA / cm 2 , the strain will slightly reduce the corrosion rate of the steel.
  • DC currents and strain can change the composition and structure of the corrosion product layer of X80 steel. The γ FeOOH generated under applied DC currents can increase the porosity of the product layer and can promote corrosion. However, with the addition of strain, the corrosion scales become denser, which indirectly inhibits corrosion.
  • When strain or DC currents are applied to X80 steel, the pitting resistance of the steel will decrease. Without DC currents, the strain makes the steel more vulnerable to pitting. Once DC currents are applied, the number and size of pitting holes increase with current density.
The amount of data present to support the slowed-down corrosion of strain on steel under high DC densities interference is limited, but the indications are strong. The detailed mechanism needs further investigation in the future.

Author Contributions

Conceptualization, methodology, formal analysis, investigation, and writing—original draft, Z.M.; conceptualization and supervision, W.W.; validation and visualization, P.Z.; writing—review and editing and project administration, Y.D. All authors have read and agreed to the published version of the manuscript.

Funding

This work was supported by Natural Science Basic Research Plan in Shaanxi Province of China, grant number 2020JM-436; the National Natural Science Foundation of China, grant number 51605368; and the Wisteria International Cooperation Program of Northwest University, grant number XM06190015.

Conflicts of Interest

The authors declare no conflict of interest.

References

  1. Thakur, A.K.; Arya, A.K.; Sharma, P. The science of alternating current-induced corrosion: A review of literature on pipeline corrosion induced due to high-voltage alternating current transmission pipelines. Corros. Rev. 2020, 38, 463–472. [Google Scholar] [CrossRef]
  2. Wang, J.; Li, Z.; Cui, G.; Liu, J.; Kong, C.; Wang, L.; Gao, G.; Guo, J. Corrosion behaviors of X70 steel under direct current interference. Anti-Corros. Methods Mater. 2019, 66, 307–316. [Google Scholar] [CrossRef]
  3. Chen, Z.; Koleva, D.; Van Breugel, K. A review on stray current-induced steel corrosion in infrastructure. Corros. Rev. 2017, 35, 397–423. [Google Scholar] [CrossRef]
  4. Niazi, H.; Eadie, R.; Chen, W.; Zhang, H. High pH stress corrosion cracking initiation and crack evolution in buried steel pipelines: A review. Eng. Fail. Anal. 2021, 120, 105013. [Google Scholar] [CrossRef]
  5. Wasim, M.; Shoaib, S.; Mubarak, N.M.; Inamuddin; Asiri, A.M. Factors influencing corrosion of metal pipes in soils. Environ. Chem. Lett. 2018, 16, 861–879. [Google Scholar] [CrossRef]
  6. Wasim, M.; Djukic, M.B. Long-term external microbiologically influenced corrosion of buried cast iron pipes in the presence of sulfate-reducing bacteria (SRB). Eng. Fail. Anal. 2020, 115, 104657. [Google Scholar] [CrossRef]
  7. Wang, W.; Wang, Y.; Zhang, B.; Shi, W.; Li, C.-Q. Failure prediction of buried pipe network with multiple failure modes and spatial randomness of corrosion. Int. J. Press. Vessel. Pip. 2021, 191, 104367. [Google Scholar] [CrossRef]
  8. Wasim, M.; Li, C.-Q.; Mahmoodian, M.; Robert, D. Mechanical and Microstructural Evaluation of Corrosion and Hydrogen-Induced Degradation of Steel. J. Mater. Civ. Eng. 2019, 31, 04018349. [Google Scholar] [CrossRef]
  9. Cotton, I.I.; Charalambous, C.A.; Aylott, P.; Ernst, P. Stray Current Control in DC Mass Transit Systems. IEEE Trans. Veh. Technol. 2005, 54, 722–730. [Google Scholar] [CrossRef]
  10. Bertolini, L.; Carsana, M.; Pedeferri, P. Corrosion behaviour of steel in concrete in the presence of stray current. Corros. Sci. 2007, 49, 1056–1068. [Google Scholar] [CrossRef]
  11. Qian, S.; Cheng, Y.F. Accelerated corrosion of pipeline steel and reduced cathodic protection effectiveness under direct current interference. Constr. Build. Mater. 2017, 148, 675–685. [Google Scholar] [CrossRef]
  12. Wang, X.; Wang, Z.; Chen, Y.; Song, X.; Yang, Y. Effect of a DC Stray Current on the Corrosion of X80 Pipeline Steel and the Cathodic Disbondment Behavior of the Protective 3PE Coating in 3.5% NaCl Solution. Coatings 2019, 9, 29. [Google Scholar] [CrossRef] [Green Version]
  13. Qian, S.; Cheng, Y.F. Corrosion of pipelines under dynamic direct current interference. Constr. Build. Mater. 2020, 261, 120550. [Google Scholar] [CrossRef]
  14. Allahkaram, S.R.; Isakhani-Zakaria, M.; Derakhshani, M.; Samadian, M.; Sharifi-Rasaey, H.; Razmjoo, A. Investigation on corrosion rate and a novel corrosion criterion for gas pipelines affected by dynamic stray current. J. Nat. Gas Sci. Eng. 2015, 26, 453–460. [Google Scholar] [CrossRef]
  15. Ormellese, M.; Beretta, S.; Brugnetti, F.; Brenna, A. Effects of non-stationary stray current on carbon steel buried pipelines under cathodic protection. Constr. Build. Mater. 2021, 281, 122645. [Google Scholar] [CrossRef]
  16. Qin, H.; Du, Y.; Lu, M.; Liu, J.; Zhu, X. Accelerated corrosion of pipeline steel under dynamic DC stray current interference. Corros. Eng. Sci. Technol. 2020, 55, 670–680. [Google Scholar] [CrossRef]
  17. Wang, C.; Li, W.; Wang, Y.; Xu, S.; Yang, X. Chloride-induced stray current corrosion of Q235A steel and prediction model. Constr. Build. Mater. 2019, 219, 164–175. [Google Scholar] [CrossRef]
  18. Shi, J.; Zou, Y.; Ming, J.; Wu, M. Effect of DC stray current on electrochemical behavior of low-carbon steel and 10%Cr steel in saturated Ca(OH)2 solution. Corros. Sci. 2020, 169, 108610. [Google Scholar] [CrossRef]
  19. Xu, L.; Cheng, Y. Corrosion of X100 pipeline steel under plastic strain in a neutral pH bicarbonate solution. Corros. Sci. 2012, 64, 145–152. [Google Scholar] [CrossRef]
  20. Xu, L.; Cheng, Y. An experimental investigation of corrosion of X100 pipeline steel under uniaxial elastic stress in a near-neutral pH solution. Corros. Sci. 2012, 59, 103–109. [Google Scholar] [CrossRef]
  21. Wu, W.; Yin, H.; Zhang, H.; Kang, J.; Li, Y.; Dan, Y. Electrochemical Investigation of Corrosion of X80 Steel under Elastic and Plastic Tensile Stress in CO2 Environment. Metals 2018, 8, 949. [Google Scholar] [CrossRef] [Green Version]
  22. Romaniv, O.M.; Heneha, B.Y.; Huta, O.M.; Vasylechko, V. Effect of stresses on the electrochemical corrosion of steel in aqueous media. Mater. Sci. 1996, 32, 760–763. [Google Scholar] [CrossRef]
  23. Behera, P.K.; Katiyar, P.K.; Misra, S.; Mondal, K. Effect of Pre-induced Plastic Strains on the Corrosion Behavior of Reinforcing Bar in 3.5 pct NaCl Solution. Met. Mater. Trans. A 2021, 52, 605–626. [Google Scholar] [CrossRef]
  24. Xu, L.; Cheng, Y. Development of a finite element model for simulation and prediction of mechanoelectrochemical effect of pipeline corrosion. Corros. Sci. 2013, 73, 150–160. [Google Scholar] [CrossRef]
  25. Wang, Y.; Zhao, W.; Ai, H.; Zhou, X.; Zhang, T. Effects of strain on the corrosion behaviour of X80 steel. Corros. Sci. 2011, 53, 2761–2766. [Google Scholar] [CrossRef]
  26. Yang, H.-Q.; Zhang, Q.; Tu, S.-S.; Wang, Y.; Li, Y.-M.; Huang, Y. Effects of inhomogeneous elastic stress on corrosion behaviour of Q235 steel in 3.5% NaCl solution using a novel multi-channel electrode technique. Corros. Sci. 2016, 110, 2124–2128. [Google Scholar] [CrossRef]
  27. Xu, J.; Bai, Y.; Wu, T.; Yan, M.; Yu, C.; Sun, C. Effect of elastic stress and alternating current on corrosion of X80 pipeline steel in simulated soil solution. Eng. Fail. Anal. 2019, 100, 192–205. [Google Scholar] [CrossRef]
  28. Wang, X.; Tang, X.; Wang, L.; Wang, C.; Zhou, W. Synergistic effect of stray current and stress on corrosion of API X65 steel. J. Nat. Gas Sci. Eng. 2014, 21, 474–480. [Google Scholar] [CrossRef]
  29. Wasim, M.; Mahmoodian, M.; Robert, D.; Li, C.-Q. Correlation Model for the Corrosion Rates of Buried Cast Iron Pipes. J. Mater. Civ. Eng. 2020, 32, 04020353. [Google Scholar] [CrossRef]
  30. Goidanich, S.; Lazzari, L.; Ormellese, M. AC corrosion. Part 2: Parameters influencing corrosion rate. Corros. Sci. 2010, 52, 916–922. [Google Scholar] [CrossRef]
  31. López, D.A.; Simison, S.; de Sánchez, S. The influence of steel microstructure on CO2 corrosion. EIS studies on the inhibition efficiency of benzimidazole. Electrochim. Acta 2003, 48, 845–854. [Google Scholar] [CrossRef]
  32. Choudhary, S.; Garg, A.; Mondal, K. Relation Between Open Circuit Potential and Polarization Resistance with Rust and Corrosion Monitoring of Mild Steel. J. Mater. Eng. Perform. 2016, 25, 2969–2976. [Google Scholar] [CrossRef]
  33. Li, M.C.; Lin, H.C.; Cao, C.N. Study on soil corrosion of carbon steel by electrochemical impedance spectroscopy (EIS). J. Chin. Soc. Corros. Prot. 2000, 2, 47–53. [Google Scholar]
  34. Yan, M.C.; Yang, S.; Xu, J.; Sun, C.; Wu, T.Q.; Yu, C.K.; Ke, W. Stress corrosion cracking of ×80 pipeline steel at coating defect in acidic soil. Acta Metall. Sin. 2016, 52, 1133–1141. [Google Scholar] [CrossRef]
  35. Zhu, Q.Z.; Xue, W.B.; Lu, L.; Du, J.C.; Liu, G.J.; Li, W.F. Preparation of microarc oxidation coating on (al2o3-sio2)sf/az91d magnesium matrix composite and its electrochemical impedance spectroscopic analysis. Acta Metall. Sin. 2011, 47, 74–80. [Google Scholar] [CrossRef]
  36. King, A.; Birbilis, N.; Scully, J. Accurate Electrochemical Measurement of Magnesium Corrosion Rates; a Combined Impedance, Mass-Loss and Hydrogen Collection Study. Electrochim. Acta 2014, 121, 394–406. [Google Scholar] [CrossRef]
  37. Schwertmann, U.; Cornell, R.M. Iron oxides in the laboratory. Soil Sci. 1991, 156, 281–282. [Google Scholar] [CrossRef]
  38. Alcántara, J.; Chico, B.; Simancas, J.; Díaz, I.; de la Fuente, D.; Morcillo, M. An attempt to classify the morphologies presented by different rust phases formed during the exposure of carbon steel to marine atmospheres. Mater. Charact. 2016, 118, 65–78. [Google Scholar] [CrossRef]
  39. Dai, N.-W.; Zhang, J.-X.; Chen, Q.-M.; Zhang, X.; Cao, F.-H.; Zhang, J.-Q. Influence of Direct Current Electric Field on the Formation, Composition and Microstructure of Corrosion Products Formed on the Steel in Simulated Marine Atmospheric Environment. Acta Met. Sin. Eng. Lett. 2016, 29, 373–381. [Google Scholar] [CrossRef] [Green Version]
  40. Colomban, P.; Cherifi, S.; Despert, G. Raman identification of corrosion products on automotive galvanized steel sheets. J. Raman Spectrosc. 2008, 39, 881–886. [Google Scholar] [CrossRef]
  41. Yamashita, M.; Miyuki, H.; Matsuda, Y.; Nagano, H.; Misawa, T. The long term growth of the protective rust layer formed on weathering steel by atmospheric corrosion during a quarter of a century. Corros. Sci. 1994, 36, 283–299. [Google Scholar] [CrossRef]
  42. Cook, D.; Oh, S.; Balasubramanian, R.; Yamashita, M. The role of goethite in the formation of the protective corrosion layer on steels. Hyperfine Interact. 1999, 122, 59–70. [Google Scholar] [CrossRef]
  43. Kamimura, T.; Hara, S.; Miyuki, H.; Yamashita, M.; Uchida, H. Composition and protective ability of rust layer formed on weathering steel exposed to various environments. Corros. Sci. 2006, 48, 2799–2812. [Google Scholar] [CrossRef]
  44. Sato, N. A theory for breakdown of anodic oxide films on metals. Electrochim. Acta 1971, 16, 1683–1692. [Google Scholar] [CrossRef]
  45. Cui, Z.; Liu, Z.; Wang, L.; Li, X.; Du, C.; Wang, X. Effect of plastic deformation on the electrochemical and stress corrosion cracking behavior of X70 steel in near-neutral pH environment. Mater. Sci. Eng. A 2016, 677, 259–273. [Google Scholar] [CrossRef]
  46. Feng, Y.; Teo, W.-K.; Siow, K.-S.; Tan, K.-L.; Hsieh, A.-K. The corrosion behaviour of copper in neutral tap water. Part I: Corrosion mechanisms. Corros. Sci. 1996, 38, 369–385. [Google Scholar] [CrossRef]
  47. Cao, C.N. Principles of Electrochemical of Corrosion, 3rd ed.; Chemical Industry Press: Beijing, China, 2008; ISBN 7-5025-5187-5. [Google Scholar]
  48. Stern, M.; Geary, A.L. Electrochemical polarization: A theoretical analysis of the shape of polarization curves. J. Electrochem. Soc. 1957, 104, 56–63. [Google Scholar] [CrossRef]
  49. Gadala, I.M.; Alfantazi, A. Electrochemical behavior of API-X100 pipeline steel in NS4, near-neutral, and mildly alkaline pH simulated soil solutions. Corros. Sci. 2014, 82, 45–57. [Google Scholar] [CrossRef]
  50. Han, J.; Young, D.; Colijn, H.; Tripathi, A.; Nešić, S. Chemistry and Structure of the Passive Film on Mild Steel in CO2 Corrosion Environments. Ind. Eng. Chem. Res. 2009, 48, 6296–6302. [Google Scholar] [CrossRef]
  51. Lu, Z.; Huang, C.; Huang, D.; Yang, W. Effects of a magnetic field on the anodic dissolution, passivation and transpassivation behaviour of iron in weakly alkaline solutions with or without halides. Corros. Sci. 2006, 48, 3049–3077. [Google Scholar] [CrossRef]
  52. Dai, N.; Chen, Q.; Zhang, J.; Zhang, X.; Ni, Q.; Jiang, Y.; Li, J. The corrosion behavior of steel exposed to a DC electric field in the simulated wet-dry cyclic environment. Mater. Chem. Phys. 2017, 192, 190–197. [Google Scholar] [CrossRef]
  53. Gutman, E.M. Mechanochemistry of Materials; Cambridge International Science Publishing: Cambridge, UK, 1998; ISBN 1-898326-32-0. [Google Scholar]
  54. Lu, B.; Luo, J.; Norton, P.; Ma, H. Effects of dissolved hydrogen and elastic and plastic deformation on active dissolution of pipeline steel in anaerobic groundwater of near-neutral pH. Acta Mater. 2009, 57, 41–49. [Google Scholar] [CrossRef]
Figure 1. Tensile stress–strain curve of the X80 steel.
Metals 11 01601 g001
Figure 2. (a) The geometry and the size of the X80 steel sample (unit: mm). (b) Four-point-bend loading apparatus.
Metals 11 01601 g002
Figure 3. Schematic diagram of the experimental set-up for electrochemical measurements.
Metals 11 01601 g003
Figure 4. The potential variations in X80 steel samples in the NS4 solution with different strains at various DC densities.
Metals 11 01601 g004
Figure 5. Variations in R p values of X80 steel sample in NS4 solution under different DC densities and applied strains (obtained from linear polarization scan).
Metals 11 01601 g005
Figure 6. Nyquist and Bode plots of X80 steel sample in NS4 solution without DC currents under different applied strains.
Metals 11 01601 g006
Figure 7. Nyquist and Bode plots of X80 steel sample in NS4 solution with strain under different applied DC: (a) 0.25   mA / cm 2 , (b) 0.5   mA / cm 2 , (c) 1   mA / cm 2 , (d) 2   mA / cm 2 .
Metals 11 01601 g007aMetals 11 01601 g007b
Figure 8. (a) Equivalent circuit models for fitting the EIS data without DC currents; (b) with i DC 1 mA / cm 2 and (c) with i DC = 2   mA / cm 2 .
Metals 11 01601 g008
Figure 9. SEM corrosion product images of X80 steel samples after 2 h in NS4 solution under various DC densities without strain: (a) i DC = 0   mA / cm 2 , (b) i DC = 0.25   mA / cm 2 , (c) i DC = 0.5   mA / cm 2 , (d) i DC = 1   mA / cm 2 , (e) i DC = 2   mA / cm 2 .
Metals 11 01601 g009
Figure 10. SEM corrosion product image of X80 steel sample after 2 h in NS4 solution under various DC densities with strain of 3 × 10 3 : (a) i DC = 0   mA / cm 2 , (b) i DC = 0.25   mA / cm 2 , (c) i DC = 0.5   mA / cm 2 , (d) i DC = 1   mA / cm 2 , (e) i DC = 2   mA / cm 2 .
Metals 11 01601 g010
Figure 11. Raman spectra of the corrosion product formed on the X80 steel samples in the NS4 solution under various DC densities and strains: (a) i DC = 0   mA / cm 2 , (b) i DC = 0.25   mA / cm 2 , (c) i DC = 0.5   mA / cm 2 , (d) i DC = 1   mA / cm 2 , (e) i DC = 2   mA / cm 2 .
Metals 11 01601 g011
Figure 12. SEM images of the corrosion morphology of X80 steel samples after 2 h in NS4 solution under various DC densities without applied strain: (a) i DC = 0   mA / cm 2 , (b) i DC = 0.25   mA / cm 2 , (c) i DC = 0.5   mA / cm 2 , (d) i DC = 1   mA / cm 2 , I i DC = 2   mA / cm 2 .
Metals 11 01601 g012
Figure 13. SEM images of the corrosion morphology of X80 steel samples after 2 h in NS4 solution under various DC densities with strain of 3 × 10 3 . (a) i DC = 0   mA / cm 2 , (b) i DC = 0.25   mA / cm 2 , (c) i DC = 0.5   mA / cm 2 , (d) i DC = 1   mA / c I , (e) i DC = 2   mA / cm 2 .
Metals 11 01601 g013
Figure 14. The corrosion rates of X80 steel samples in NS4 solution as a function of i DC and strain: (a) obtained by LPR; (b) obtained by EIS curve.
Metals 11 01601 g014
Figure 15. Schematic diagram of X80 steel during corrosion under the applied DC and strain. (a) natural corrosion; (b) strain applied; (c) DC current applied; (d) DC current and strain applied.
Metals 11 01601 g015
Table 1. Chemical composition of X80 pipeline steel ( ω /w%).
ElementCSiMnPSVNbTiCrMoAlFe
Content0.0900.3501.9000.0300.0050.0600.0650.0160.0300.2100.060balance
Table 2. Composition of NS4 solution (g/L).
Composition N a H C O 3 K C l M g S O 4 · 2 H 2 O C a C l 2 · 7 H 2 O
Content0.4830.1220.1310.181
Table 3. Fitted EIS parameters of X80 steel samples after applying various DC densities and strains.
DC DensityStrain R s C f R f     Q d l R t L R L
( m A / c m 2 ) ( × 10 3 ) ( Ω · c m 2 ) ( F / c m 2 ) ( Ω · c m 2 ) Q - Y 0   ( F / c m 2 ) Q-n ( Ω · c m 2 ) (H) ( Ω · c m 2 )
0043.13--2.10   ×   10 4 0.842293--
0.538.14--1.71   ×   10 4 0.862266--
141.33--1.96   ×   10 4 0.882000--
1.548.51--2.86   ×   10 4 0.871733--
342.39--2.40   ×   10 4 0.831764--
0.25017.209.84   ×   10 6 33.382.35   ×   10 4 0.8486.3122.3433.21
0.516.757.21   ×   10 6 40.072.02   ×   10 4 0.8390.7729.0340.79
116.788.87   ×   10 6 37.331.98   ×   10 4 0.8677.8934.4440.76
1.516.8311.79   ×   10 6 28.382.24   ×   10 4 0.8683.1724.2935.69
318.468.04   ×   10 6 30.532.50   ×   10 4 0.8381.3328.6937.81
0.5018.1110.00   ×   10 6 32.282.49   ×   10 4 0.8940.647.6914.08
0.517.4711.45   ×   10 6 27.692.93   ×   10 4 0.8544.667.6716.41
119.3211.69   ×   10 6 24.953.16   ×   10 4 0.8443.896.9416.13
1.517.978.10   ×   10 6 37.232.38   ×   10 4 0.8842.628.1516.81
316.949.7327.792.880.8252.66.7416.00
1016.59.8427.403.53   ×   10 4 0.7926.261.678.50
0.516.0810.4729.303.34   ×   10 4 0.8523.532.027.30
117.427.55   ×   10 6 36.493.02   ×   10 4 0.8424.351.597.41
1.516.638.86   ×   10 6 33.972.71   ×   10 4 0.8821.991.617.05
317.599.11   ×   10 6 34.872.87   ×   10 4 0.8623.001.266.83
Table 4. Fitted EIS parameters of X80 steel samples after applying various strains and i DC = 2   mA / cm 2 .
DC DensityStrain R s C f R f C d l R t
( m A / c m 2 ) ( × 10 3 ) ( Ω · c m 2 ) ( F / c m 2 ) ( Ω · c m 2 ) ( F / c m 2 ) ( Ω · c m 2 )
2017.599.64   ×   10 6 33.112.17   ×   10 4 12.39
0.517.608.78   ×   10 6 35.231.55   ×   10 4 12.94
116.807.90   ×   10 6 38.771.48   ×   10 4 13.53
1.516.527.67   ×   10 6 35.761.70   ×   10 4 12.05
317.678.28   ×   10 6 38.792.01   ×   10 4 14.04
Table 5. EDXA results of corrosion products of X80 steel samples (At. %).
ElementDC DensityCOMgClCaFe
without strain0 mA/cm210.2014.270.120.570.2774.58
0.25 mA/cm212.2237.010.040.12-50.61
0.5 mA/cm220.5127.40-0.230.0651.80
1 mA/cm230.6217.65-0.230.1351.37
2 mA/cm232.8126.33-0.140.2740.45
with strain
(3   ×   10 3 )
0 mA/cm217.238.420.01-0.0274.32
0.25 mA/cm219.5331.670.120.040.1148.52
0.5 mA/cm227.3814.38---58.24
1 mA/cm229.6128.950.280.080.0941.00
2 mA/cm226.5743.150.370.090.0829.83
Publisher’s Note: MDPI stays neutral with regard to jurisdictional claims in published maps and institutional affiliations.

