Abstract
This paper presents a finite element analysis of the small punch creep test for 316L(N), which is compared with experimental data for 650 and 700 °C. Special emphasis is placed on (i) assessing the influence of friction and (ii) comparing two different creep models: the simple Norton creep and the more general creep model. The computed normalized deflection rate versus time is almost identical for all cases, which allows for scaling of the results. The computed time to rupture increases linearly with the friction coefficient due to a reduction in the mean stress. There is a good overall agreement between the experimental values and the computed deflection rate for a friction coefficient of around 0.3. It is shown that the initial reduction in deflection rate is due to stress relaxation and homogenization, and is only marginally affected by primary creep hardening. The computed results are compared with the equivalent stress and strain rates in the recently published small punch standard (EN 10371). The computed von Mises stresses at minimum deflection decrease linearly with the friction coefficient but are consistently slightly higher than the equivalent stress in the standard. For the strain rates, the computed values are significantly higher than the equivalent values in the standard. The presented simulations give a deeper insight of the small punch creep and impact of key parameters such the friction coefficient and in general as a guidance to refinement and improvement of the empirically based formulae in the standard.
1. Introduction
In the small punch creep test (SPC) a disc, with a typical diameter and thickness of 8 mm and 0.5 mm, respectively, is loaded by an indenter with a spherical tip under constant load. The deflection of the disc versus the time is akin to the time-dependent displacement of a uniaxial creep test. Important relationships established for uniaxial creep tests and used in creep design, such as the Monkman–Grant (linear loglog for time to rupture vs. deflection/rate) and Larsson–Miller relationships (linear loglog force versus time to rupture), also follow from the small punch creep test by replacing the stress and strain rate in the uniaxial test with the force and deflection rate in the SPC test e.g., [1,2,3,4,5,6,7,8,9,10,11,12,13,14,15].
This similarity with the standard uniaxial test in combination with the very small material volumes and the simplicity of performing the SPC test makes it very attractive as a tool for the assessment of creep life. A code of practice for the small punch test was published in 2006 [16] and a complete EN standard has now been published [17]. A description of the pre-normative research leading to the standard is given in [18].
Despite these similarities, there are also important differences between the SPC and the uniaxial creep test. First, in the SPC, the initial deflections are large with significant plastic deformation of the disc; upon loading the in-plane stress and strains are bi-axial and vary significantly across the disc, but the highest stresses relax quickly under the constant load resulting in a redistribution and homogenization of the stress and strain fields. Moreover, the friction between the indenter and the disc has a large impact on the deflection rate and the time to rupture. In addition to prescribing how to prepare and conduct the SPC test, the standard also provides formulae for stress and strain rate from the force, deflection and deflection rates. These are empirically based on the uniaxial creep and SPC test data so that the time to rupture is the same. Given the significant differences between the uniaxial creep and SPC test, “equivalence” is not obvious. Therefore, it is not straightforward to determine the stress and creep strain rates that would allow for a direct comparison. The SPC test has therefore mainly been used as a screening test.
To better interpret and further develop the SPC test, finite element analyses have been conducted with increasing levels of complexity. Some early publications [10,19] did not consider friction. The important role of friction is now understood, namely that increasing friction increases the time to rupture and shifts the location of largest creep strain from the centre of the disc to the edge of the contact zone, as demonstrated by Dymáček and Milička [20]. Constitutive models which include the effect of large initial plastic strain, often referred to as pre-strain, on the creep behaviour have been published e.g., [21], as well as different damage models to describe tertiary creep [14,15,22,23]. There is now a consensus that small punch creep models must account for friction, the coupling between plasticity and creep, and large deformation effects. During SPC tests, the disc deforms plastically with large strains and a very large range of stresses in the creep stage resulting in variations in creep strains during the test. Clearly, then, a constitutive model must accommodate elastic–plastic curves for large strains and a very large range of creep rates. A recent overview of SPC modelling is given in [24].
Much of the SPC tests and analyses reported in the literature for creep-resistant steels are ferritic–martensitic steels of type P91 [1,2,7,12,13,14,20,25,26,27,28] and, to a somewhat lesser extent, austenitic steel of type 316L [4,5,8,14,23,29,30], which is widely used in the nuclear industry.
In this paper, we present a finite element visco-plastic analysis of the SPC test for 316L(N) and predictions are compared with experimental data. The tensile and creep models need to be calibrated to a large stress and strain range, which requires a very large test programme. To calibrate our constitutive model, we therefore use data from the nuclear design code RCC-MRx [31], which provides engineering design data based on processed data from large test programmes.
2. Model Description
2.1. Constitutive Model
As mentioned above, the small punch creep discs deform with an initial large plastic deformation followed by creep deformation resulting in final rupture by a combination of creep and plastic collapse. The first simplification is the assumption that the strain and strain rate can be separated into a time-independent elastoplastic part, which consists of an elastic and plastic part and a creep part:
The elastoplastic constitutive model has no time dependence and consequently the associated strain rate depends only on the local stress rate. The elastoplastic and creep constitutive models are calibrated separately to the uniaxial tensile and creep data, respectively. The ideal situation would be to perform the uniaxial tests needed for the model calibration and the small punch tests from the same material batch, but this is not a feasible approach since we need creep curves that cover a large stress range and associated rupture lives. In this paper we therefore base the calibration on design code data from RCC-MRx representing mean values which we process further to allow for large strains and tertiary creep. The constitutive models and calibration procedure is outlined below. The main reason to use this design code data is that it already covers a large range of stresses and strains from a large set of tests processed by experts into consistent data sets. Another reason to use design data is that it better illustrates an engineering application of the small punch creep test.
2.1.1. The Elastoplastic Constitutive Model
The 316L(N) engineering tensile properties from the RCC-MRx code [31]. Stress and strain data are first converted into true values and the plastic hardening model is then derived from the true stress σ and the true plastic strain εp fitted to an analytical expression that includes a constant term, a linear hardening term and two non-linear hardening terms:
R0 is the elastic limit, H linear plastic hardening, Qi and bi relate to the amplitude and rate of then nonlinear hardening. As long as there is no unloading there is no need to distinguish between isotropic and kinematic plastic hardening, but as already discussed, stress redistribution will result in local stress relaxation, which in turn could result in plastic strain reversal. The values of the fitting constants are listed in Table 1. Figure 1 shows the tensile data points from RCC-MRx at 700 °C and 650 °C and the calibrated curves. In the uniaxial test, necking will start at some stress level (corresponding to the tensile strength when engineering strain is used). The calibrated curve is based on uniform deformation, which breaks down when necking occurs. The RCC-MRx does not provide any information on load reversal, but it is well known that 316L(N) has a pronounced Bauschinger effect. In fully isotropic hardening, unloading is elastic for stress ranges equal to twice the maximum stress. If we assume that the plastic hardening is fully kinematic, then plastic strain reversal occurs when the unloading exceeds 2R0 with the same hardening as in Equation (2), which is illustrated in Figure 1. For isotropic hardening, there can be no plastic reversal in tension.

Table 1.
Young modulus and parameters for the expression of the true stress, plastic strain values at 650 °C and 700 °C.
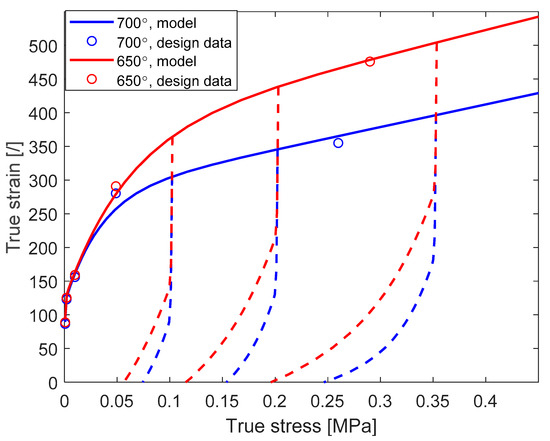
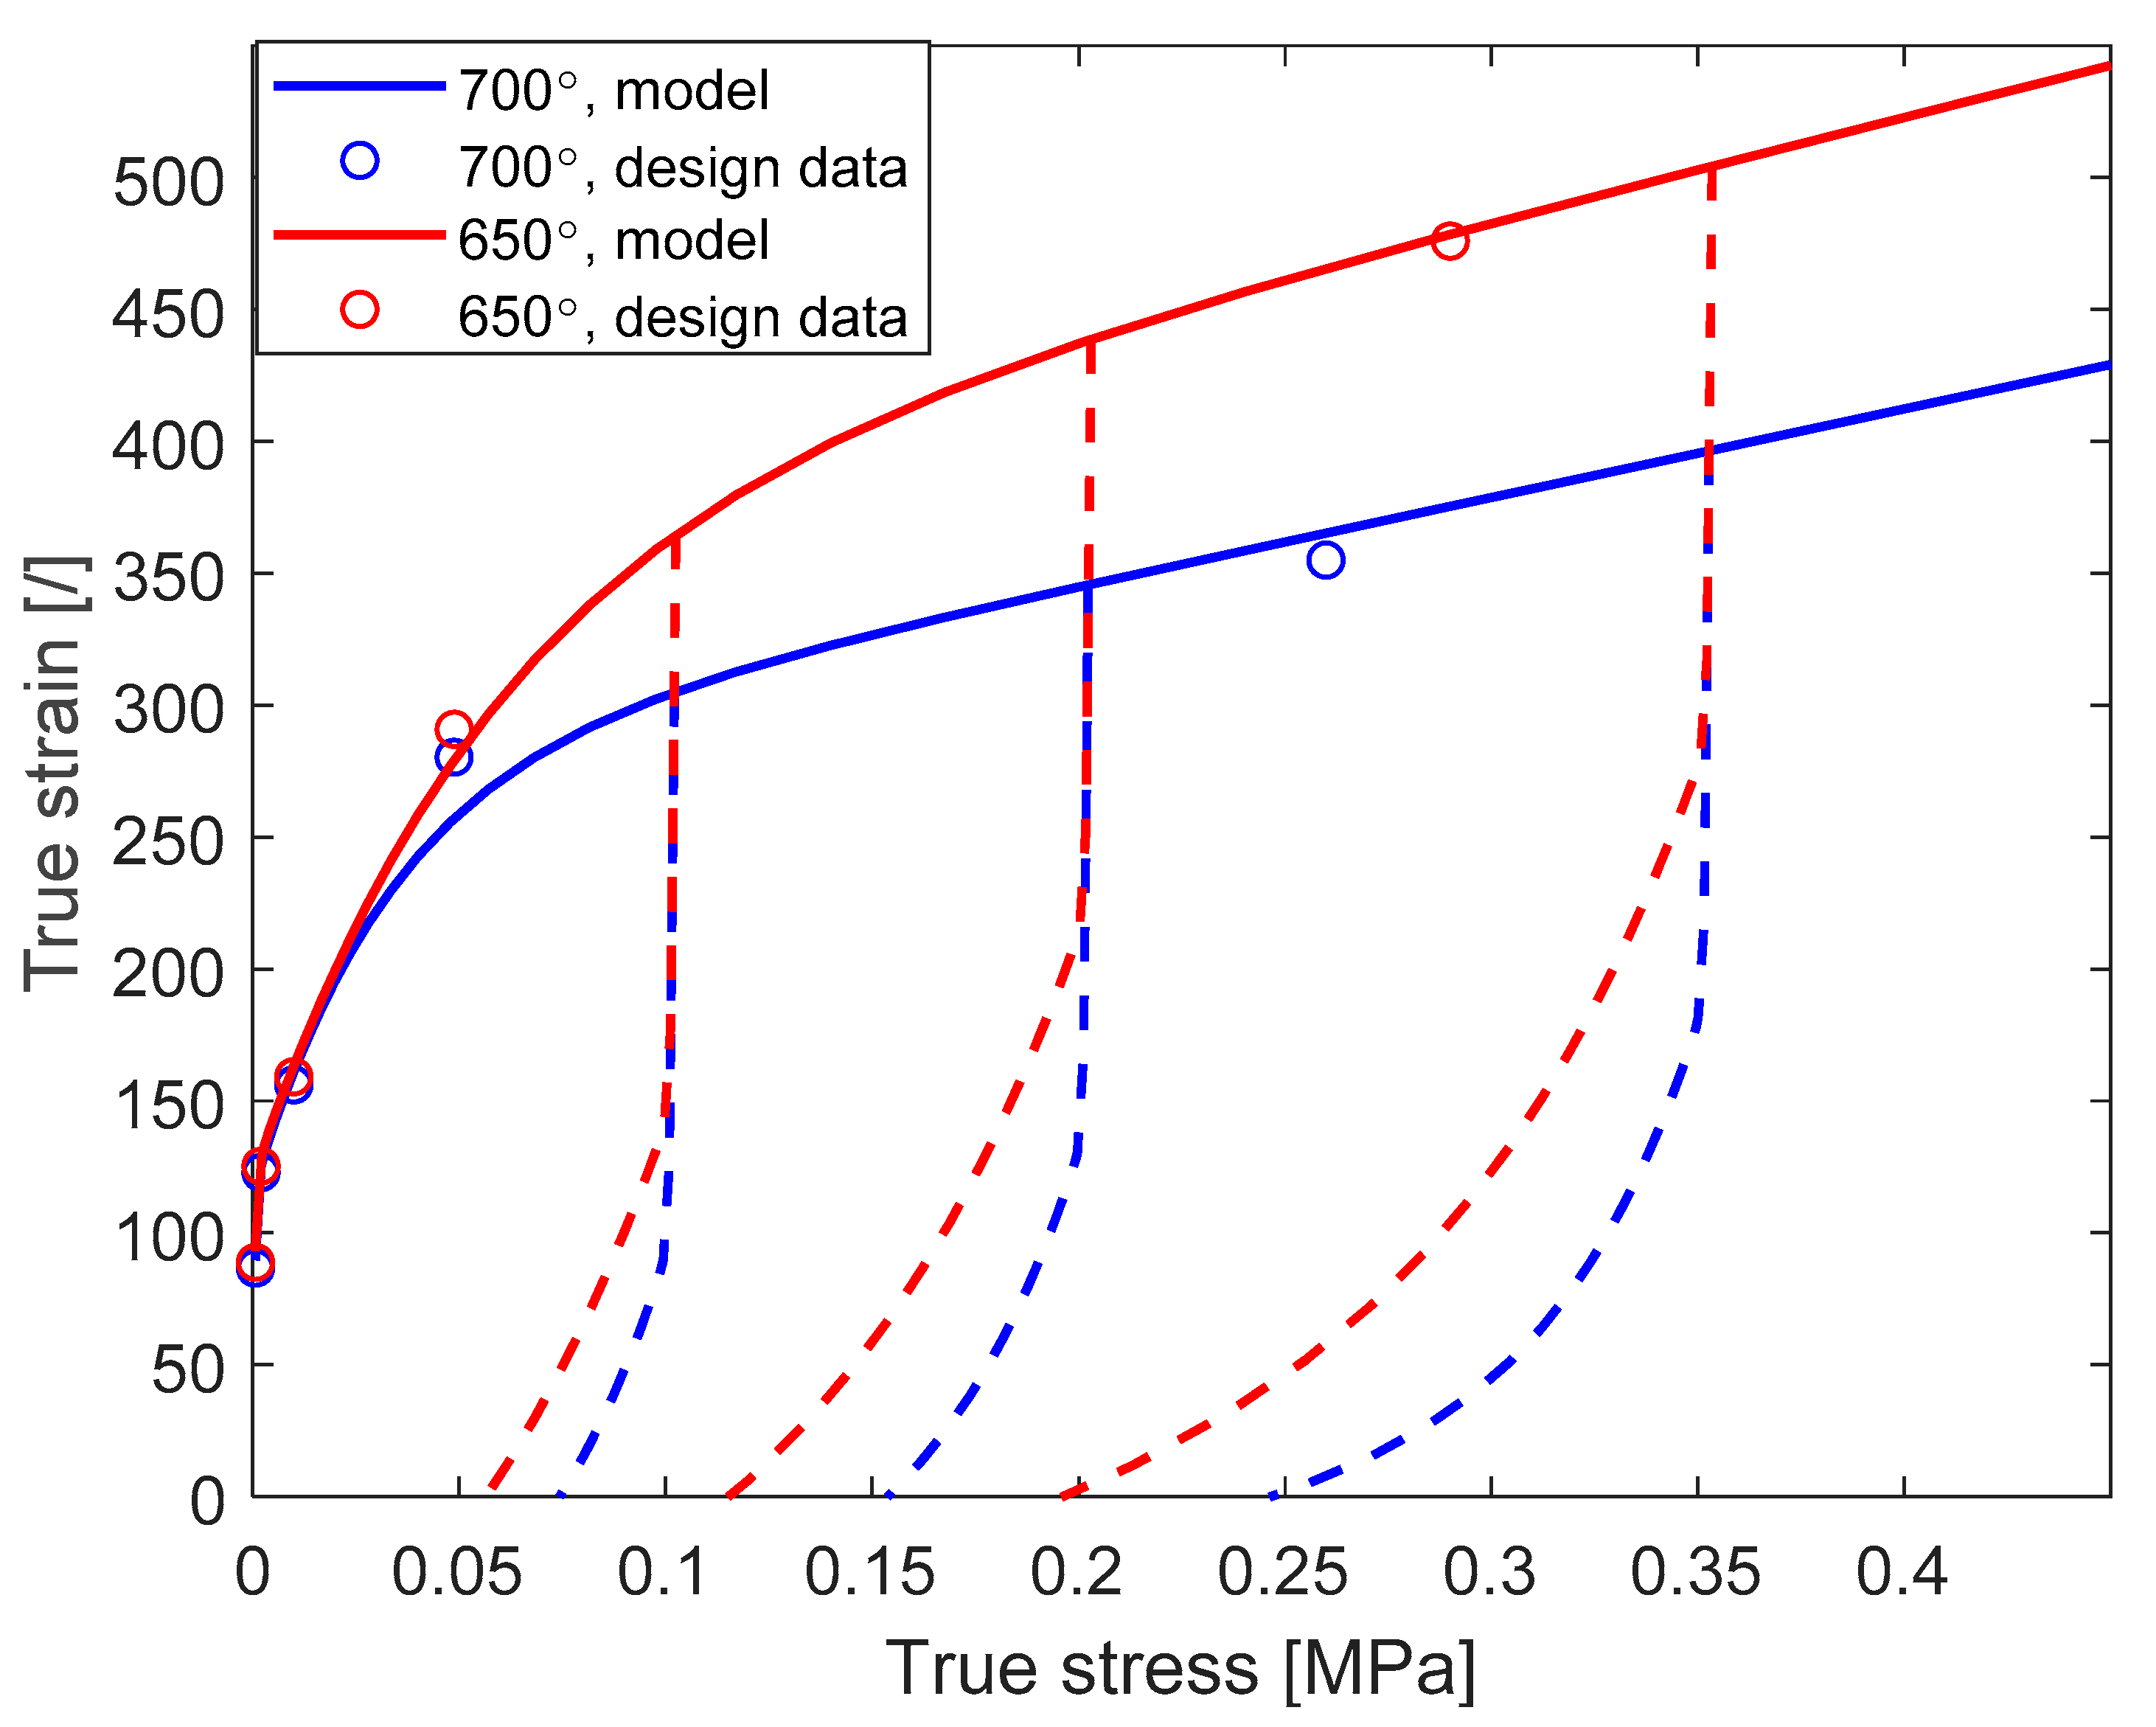
Figure 1.
RCC-MRx 316L(N) mean true stress vs. true plastic strain at 650 °C and 700 °C. Dotted lines indicate unloading with kinematic hardening.
2.1.2. The Creep Constitutive Model
The creep deformation for 316L(N) steel in a uniaxial creep test typically exhibits three stages: the primary creep stage, where the strain rate decreases with time; the secondary creep stage, with a constant strain rate; and the tertiary creep stage, where the strain rate increases prior to rupture. As mentioned above, in the small punch creep test the stresses and initial plastic strains are large, and large accumulated creep strains develop during the creep stage. In addition, the stress and the plastic and creep deformation may vary considerably across the punched disk. Clearly, there is a need for a constitutive creep model that covers a large range of stresses and strains and the three creep stages. To this end, we adopt a phenomenological creep model proposed by the authors of [32]:
In the special case that the parameters K1, c1, K2 and c2 are all zero, the model reduces to the standard Norton model used for secondary creep, , with the Norton exponent n and the drag stress K0. The terms K1, c1, and K2 and c2 describe primary and tertiary creep effect, respectively. The K parameters relate to the amplitude and the ci parameters to the creep strain where hardening/softening is active (c1 > c2 since primary hardening occurs at lower creep strains than tertiary softening). The creep model is calibrated to the 316L(N) creep data provided in RCC-MRx. The code provides equations for primary and secondary mean creep strain, but RCC-MRx does not provide equations for tertiary creep. The code provides the average value for time to rupture for different stresses, but only in tabular form. The logistic creep strain prediction (LCSP) method is adopted to derive a complete creep curve from the equations for primary and secondary creep whereas the tertiary creep part is derived from the time to minimum creep rate and the time to rupture [32]. We refer to this data as “processed design code data”. For calibration with the creep models, two additional modifications must be done on the processed design code data. First, the stress and strain in the RCC-MRx code are engineering values, whereas the analysis and Equation (3) refer to true stress and strains. In the uniaxial case, prior to any necking, the true stress and strain values () can be determined directly from the engineering values :
Second, what is referred to as “creep strain” in a creep test is the total strain from the initial elastoplastic strain and includes the plastic strain increment from the increased true stress and the actual creep part. The creep is derived from the engineering processed design code data and by subtracting the elastoplastic strain increment given by the true strain and Equation (4). In this last step, we assume that the elastoplastic constitutive models, Equation (2), do not depend on the accumulated creep strain.
Primary and tertiary creep effects may depend on the stress levels. To account for this, the parameters K0, K1, K2, c1 and c2 are linear functions of the stress,
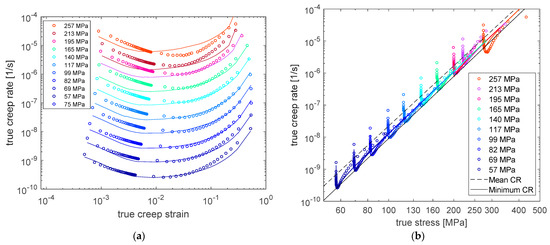
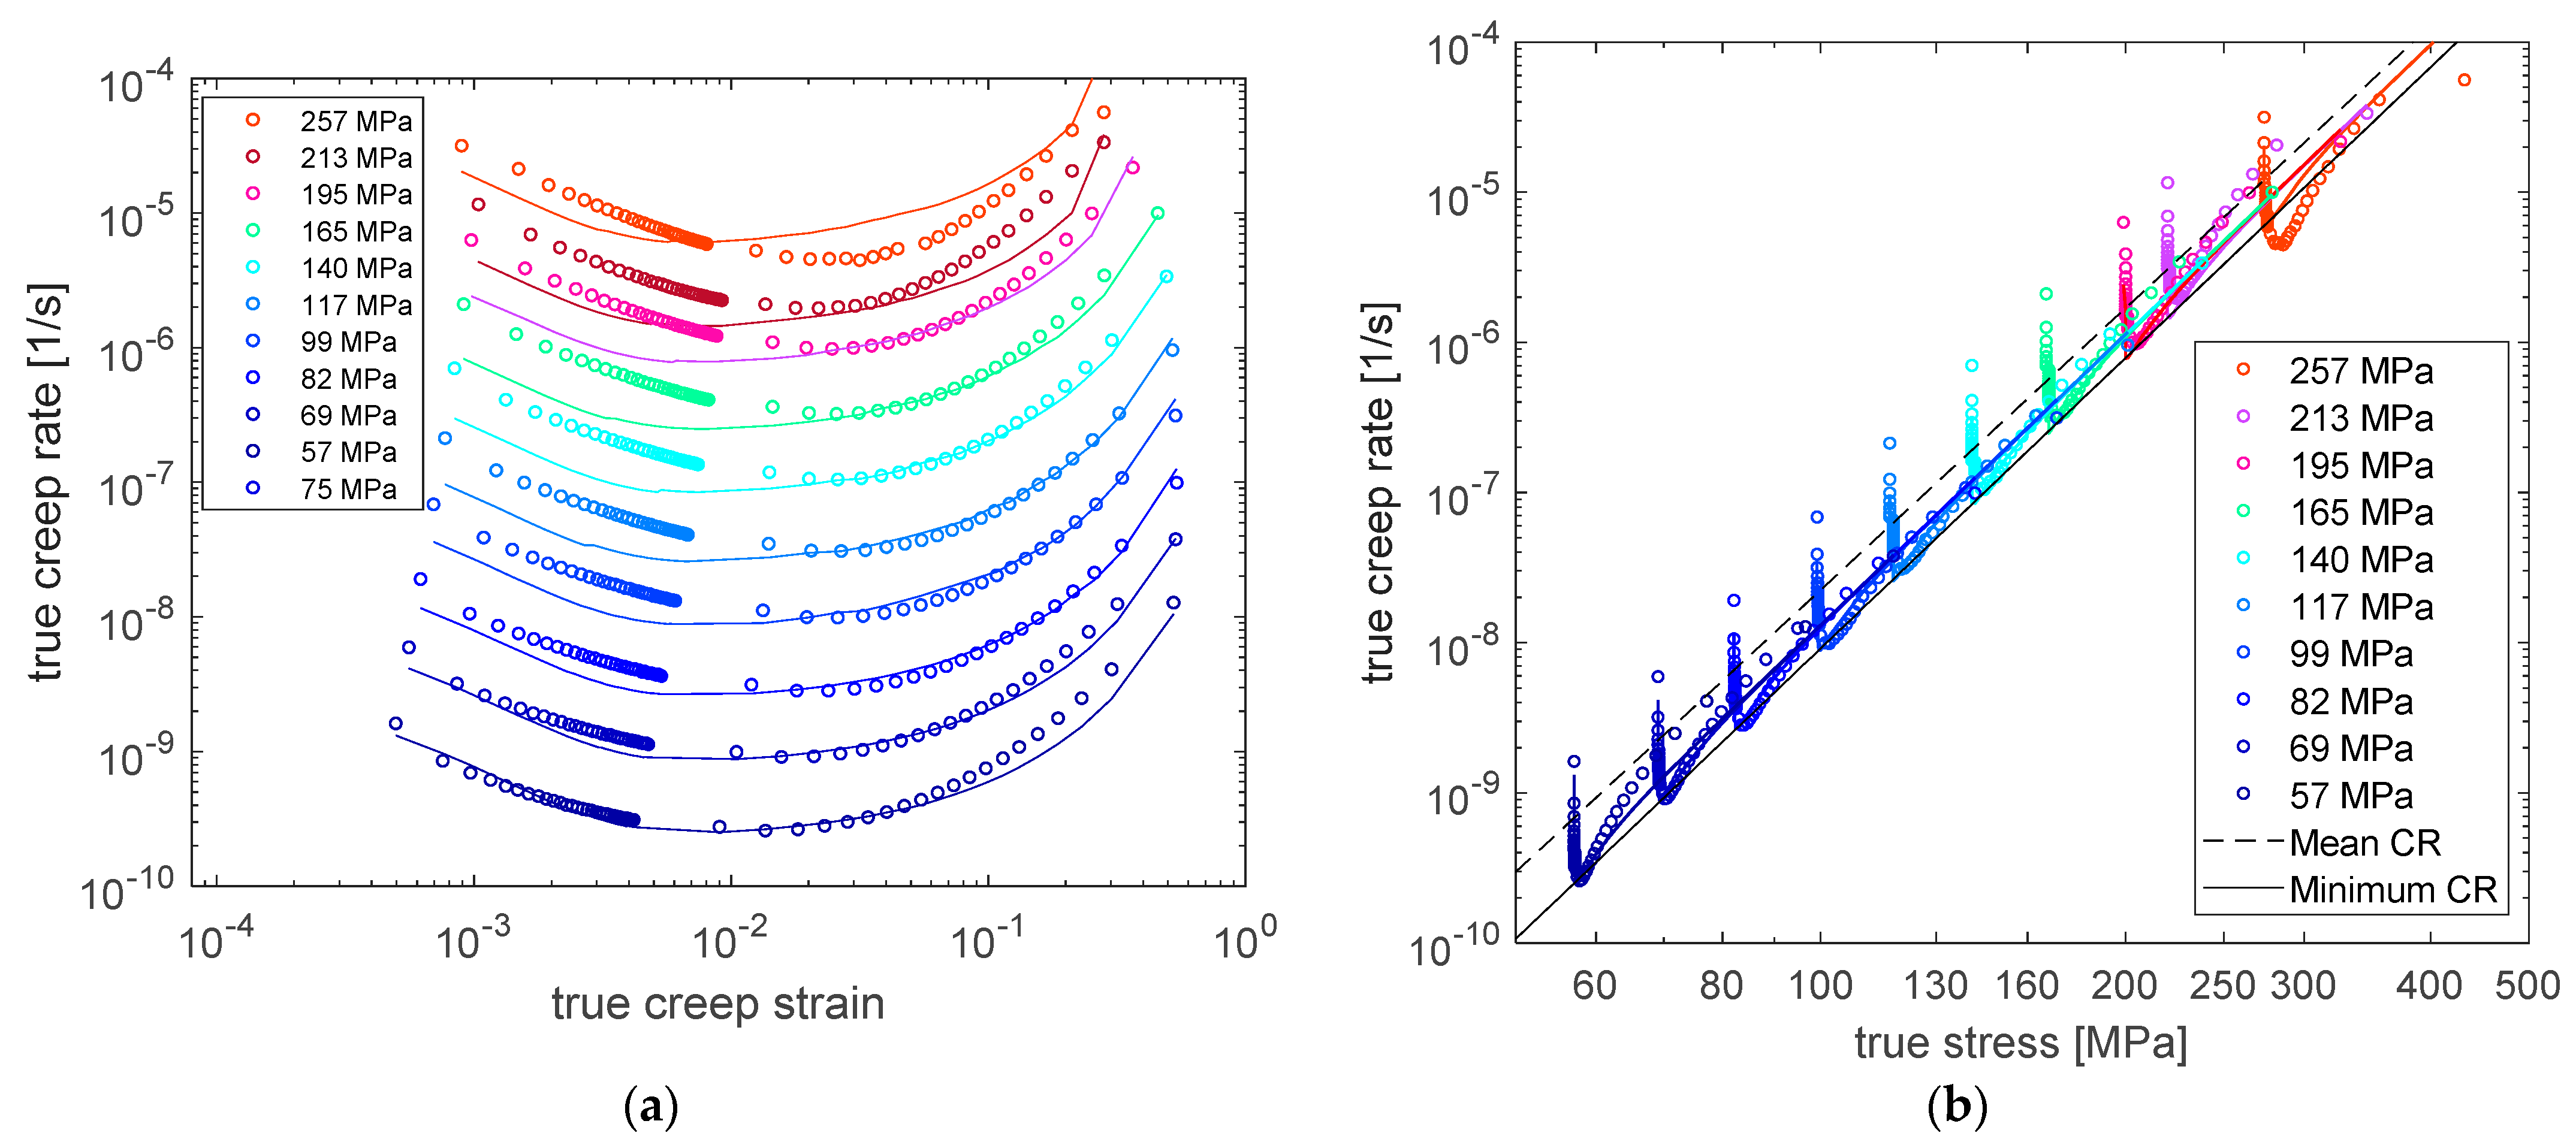
The calibration of the creep model’s 11 parameters (A1–A5, B1–B5 and n) to a true creep strain versus stress curve is done by an optimization procedure [32]. The values for 700 °C and 650 °C are given in Table 2, which also includes the special Norton case for fitting mean and minimum creep rate, respectively. It can be noted that for 700 °C, B1–B5 are zero, so there is no stress dependence, whereas for 650 °C, the stress dependence is very small. Figure 2a shows the true creep rate versus creep strain for different values of the nominal engineering strains at 700 °C. The symbols are the processed design code data and the lines are the calibrated values using the constitutive models with the values in Table 1 and Table 2. Figure 2b shows the corresponding true creep rate versus the true stress for the general creep model and the Norton model fitted to mean and minimum creep rates. The constitutive model correlates quite well with the processed design code data. Plots are not shown for 650 °C, but the agreement between the processed design code data and the calibrated data is similar. Figure 2a shows the primary and tertiary creep and that the minimum creep rate is attained at 1% creep strain. In the primary creep, the creep strain is small so there is no “true stress effect”; thus the observed primary creep effect is a material effect. For the tertiary creep, the true stress increases in accordance with Equation (4). In Figure 2b it can be noted that for each nominal stress case there is a linear relationship between the true stress and true creep rate in the log-log diagram of Figure 2b. Thus, the processed design code data do not reveal any creep damage material softening.
Table 2.
Parameters for Equation (5) and mean value for the Norton model.
2.2. Finite Element Model of the Small Punch Creep Test
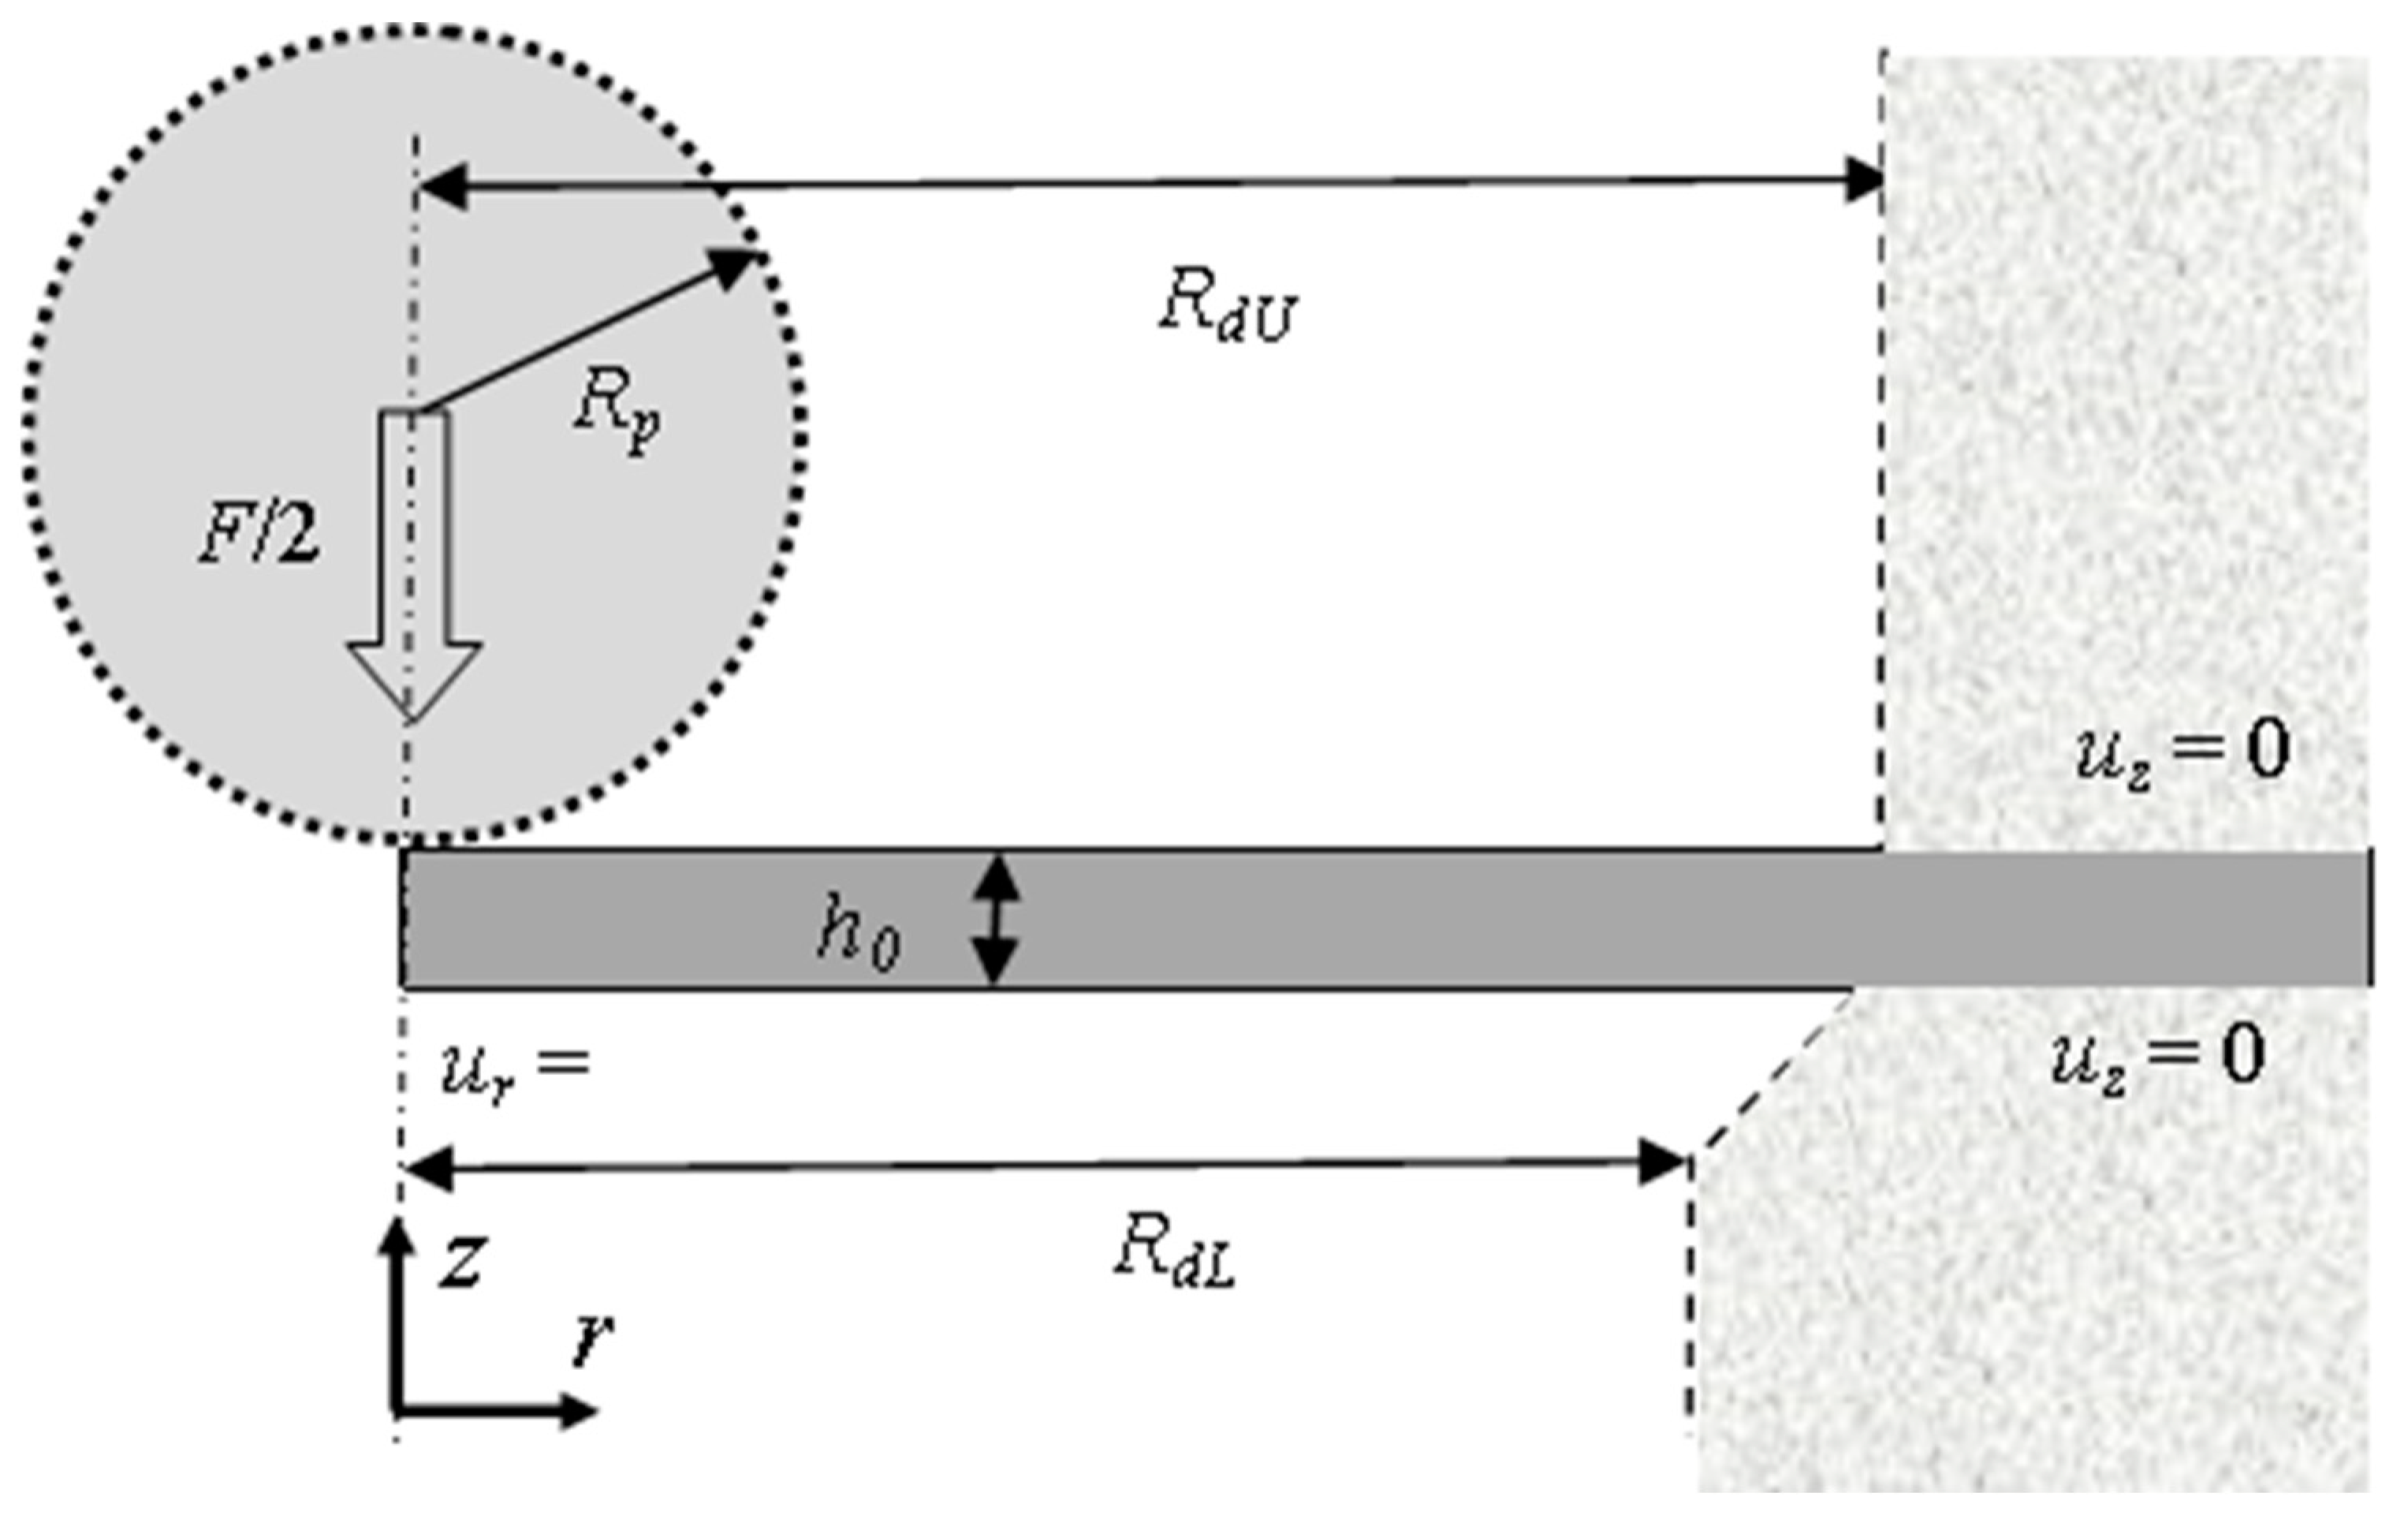
The small punch test is modelled as a two-dimensional axisymmetric body, as illustrated in Figure 3. The radius and thickness of the disc are 4 mm and 500 μm, respectively. The receiving hole has a radius RDL = 2 mm and a 0.2 mm × 45° chamfer to avoid shearing of the specimen at the edges. The upper hole has a radius RDU = 2.5 mm. The radius of the spherical indenter is 1.25 mm. The indenter and the upper and lower dies are rigid bodies, i.e., modelled as non-deformable boundary lines, illustrated by the dashed lines. Hence, the disc can slide and the deformed surface in the contact region is fully determined by the displacement and the spherical shape of the indenter. The force is applied at the centre of the rigid ball and transferred to the disc. The constitutive model described above with a time-independent plastic part and a creep part is adopted for the disc. The finite element code ABAQUS [33] is used, but the constitutive models described above are implemented via Zmat [34]. Coulomb friction is assumed in the contact zone between the ball and the disc and between the disc and the upper and lower dies. The axisymmetric 8-node elements CAX8R are used, and the total number of elements is 2170.
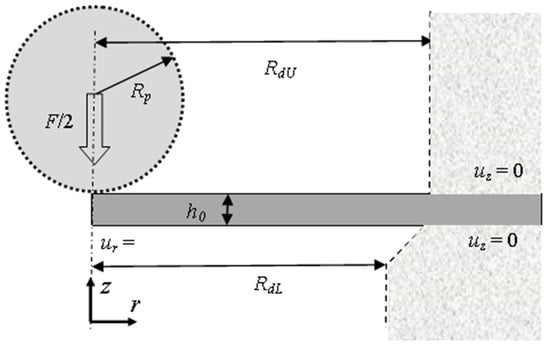
Figure 3.
Schematic illustration of the disc, the upper and the lower die.
The loading consists of two steps: the loading stage where applied force is increased linearly from 0 to the maximum load, F, in 1 second, followed by the creep stage when the force is kept constant. The deflection increases monotonically in the creep stage and in the final stage the computed deflection rate increases drastically and eventually becomes very large so numerical convergence cannot be achieved. The time to reach this stage is defined as the computed creep rupture time.
3. Experimental Results SPC
The SPC creep tests were conducted in the JRC Structural Materials Performance Assessment (SMPA) laboratory in Petten, the Netherlands. The small punch creep machines used for the testing are custom-made rigs from Phoenix Calibration & Services Ltd. The rigs were built to conform with the pre-standard CEN CWA 15,627 (2007), [16].
The main setup for the test conducted on the 316L(N) steel included: punch ball—2.5 mm (high precision silicon nitride Si3N4 bearing ball); receiving hole—4 mm with a 0.2 mm chamfer; specimen—8 mm in diameter discs, thickness 500 µm.
The test sample is restricted from bending through hand tightening of the single thread clamping system pressing the sample between the upper and lower die. The test temperature is measured by an N-type thermocouple located in close proximity to the sample, i.e., touching the inner die less than 10 mm from the sample, enclosed in the SPC clamping tool made of Nimonic 90 steel. The clamping tool has a large mass in comparison to the sample, and the temperature gradient within the tool is negligible by adopting a 20 minutes stabilization time.
The deflection is measured from below the sample with a ceramic rod touching the sample and extending to an LVDT gauge. The LVDT has a negligible spring counter force.
The results for three tests at 700 °C with applied forces of 300, 400 and 500 N, and one at 650 °C with an applied force of 550 N are summarized in Table 3. The deflection at the start of creep, u0, is large compared to the thickness, indicating large plastic deformation. It is also noteworthy that the ratio between the time to reach the minimum deflection rate and time to rupture is consistently very close to 0.5, and that the deflection is close to 1.5 mm when the minimum deflection rate is attained. This is consistent with observations reported in the literature e.g., [2,3,18,26]. The final rupture is by fracture with a hemispherical fracture surface of a diameter of typically 1–1.5 mm, which is also consistent with observations reported in the literature [4,29].
Table 3.
Experimental small punch creep data. tr is the time to rupture and the time at which the minimum deflectioin rate is attained; u0 is the measured deflection at the centre of the and lower surface of the disk at the onset of creep; and are the minimum deflection rate and deflection rate at tr/2; umin and utr/2 are the deflection at the time when minimum deflection rate occurs and at half the time to rupture, respectively and σmin and σtr/2 the corresponding stresses computed from the deflection and force and the Standard [17].
The times to rupture in our tests are significantly longer (factor of 10) than results reported by Kumar and co-workers for 316L(N) [4]. The main difference was that the diameter was 2.38 mm instead of 2.5 mm. It should be noted that time to rupture depends on the nitrogen content; the time to rupture increased by a factor of three when the nitrogen content increased from 0.07 to 0.14 wt. % [30].
4. Small Punch Creep Analysis
4.1. Numerical Simulation Cases
For the analyses two temperature, four loads, four friction coefficient values and four material models were used (see Table 4).
Table 4.
Cases used in the numerical simulations.
The load range is typical for the values used in small punch creep tests with expected rupture times in the range 10–1000 h; the friction values cover typical lower and upper values reported e.g., [5,11,14,15,21,22,25,26,35]. In a uniaxial creep test, there cannot be any unloading so there is no need to distinguish between isotropic and kinematic plastic hardening. In the small punch creep test, the peak stresses will relax and redistribute during the creep stage, which means that plastic stress reversal may occur locally in case of the kinematic hardening, which directly affects the creep deformation. Thus, Iso and Kin refer to isotropic and kinematic hardening for the elastoplastic models. Two creep models are also used: the Norton creep fitted to the mean creep rate, and the more general phenomenological creep model with the parameter values in Table 2. Thus, the number of simulations for each temperature is 80 (5 × 4 × 4).
4.2. Deflection and Time to Rupture
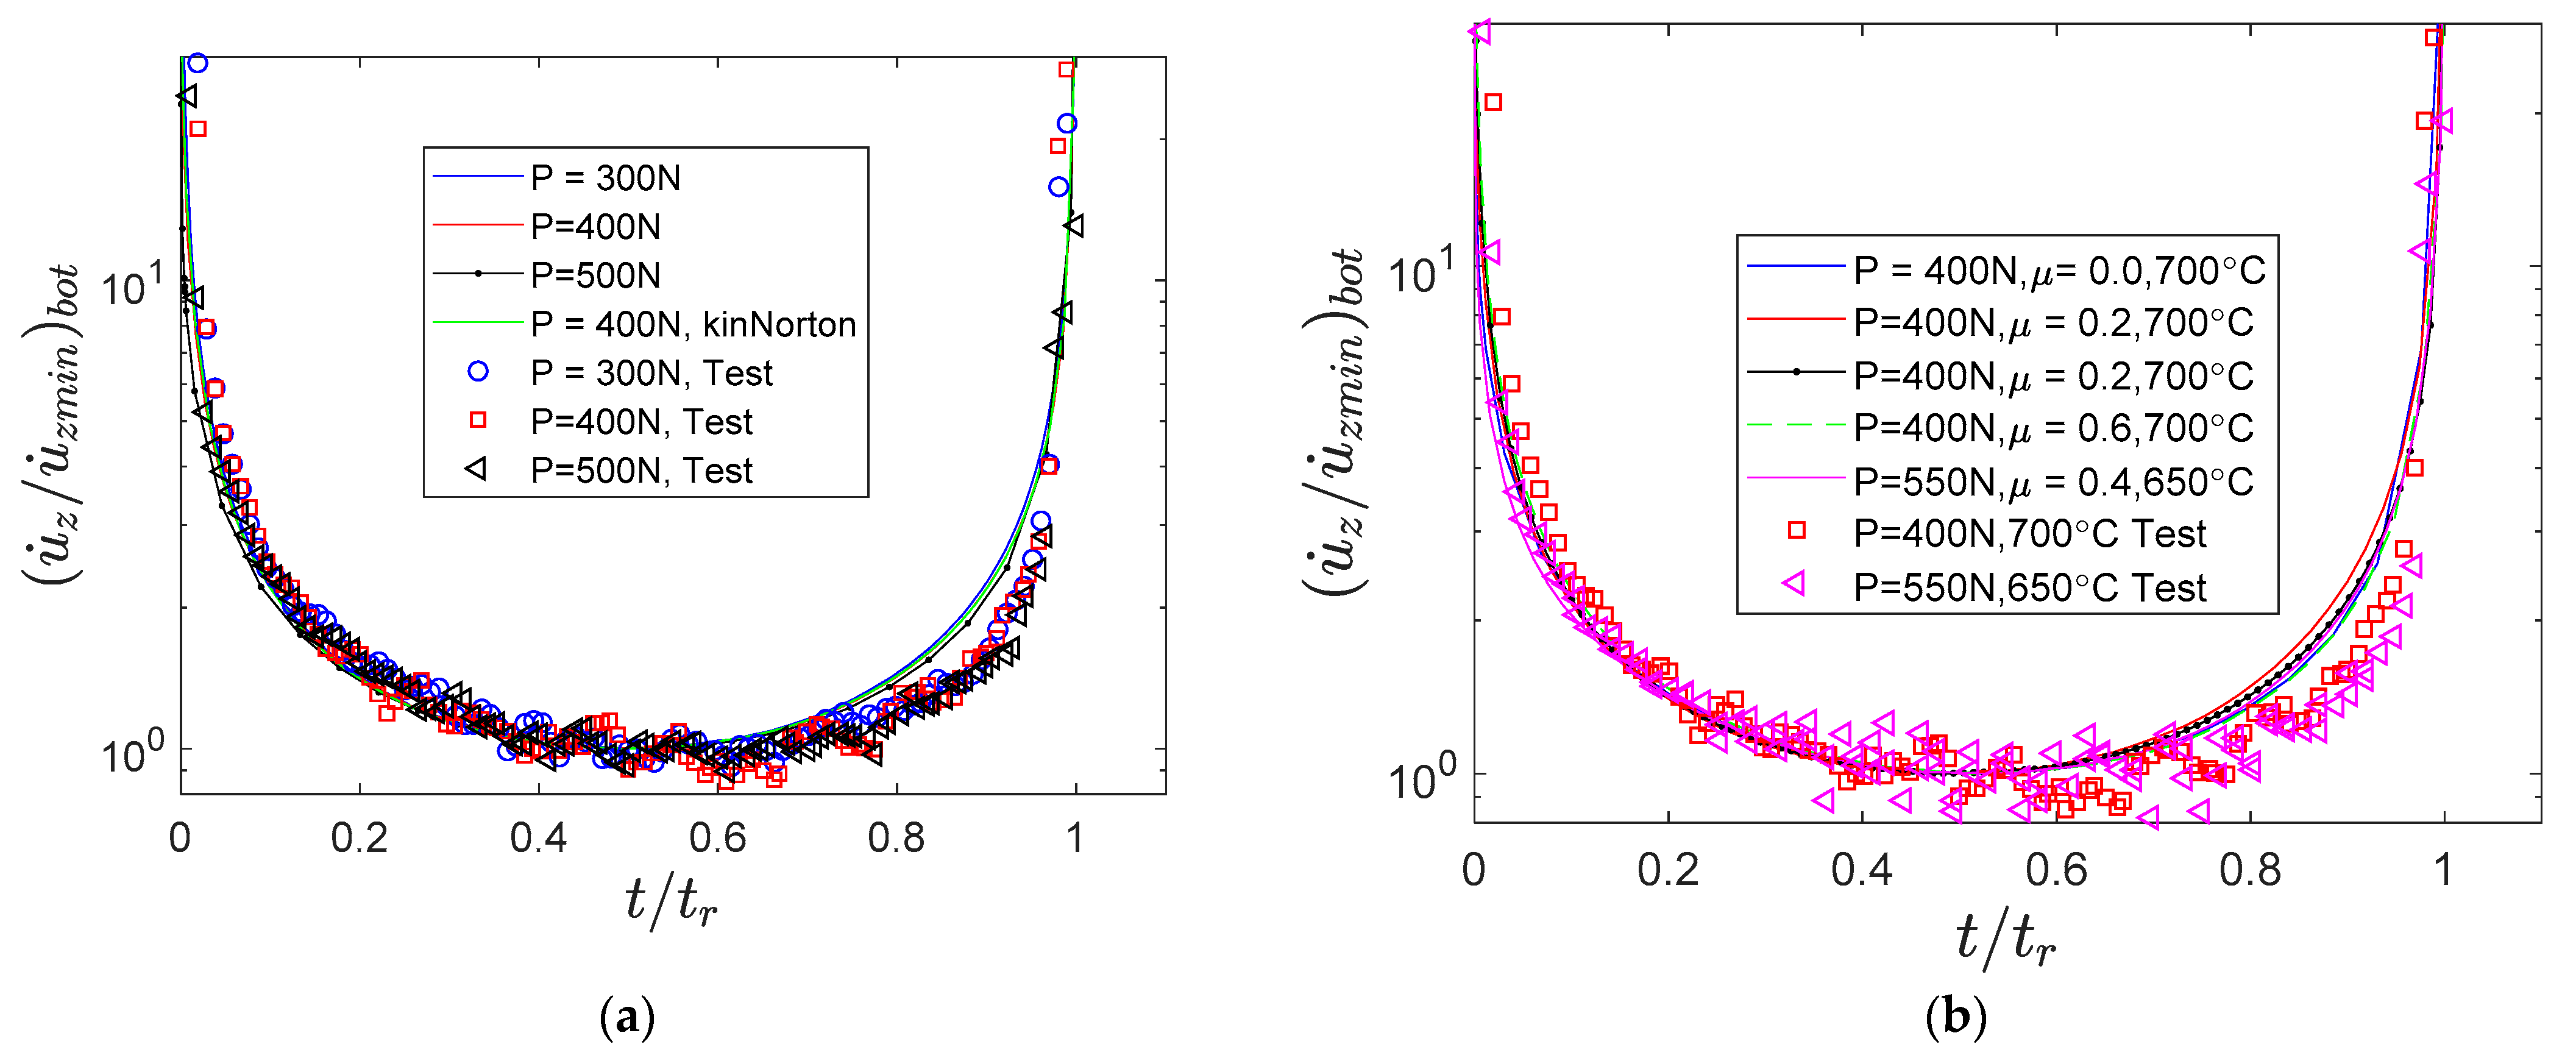
It was mentioned above that the minimum deflection rate for small punch creep is generally attained at half the rupture life for a large range of materials, temperatures and load ranges. This behaviour suggests a “Master Curve” for the creep deflection rate when plotted against the normalised time t/tr. Figure 4a,b show computed results and experimental data for the normalized deflection rate versus time to rupture. To minimize the effect of scatter, the experimental deflection rate is normalized by its mean value in the range t/tr = 0.45–0.55.
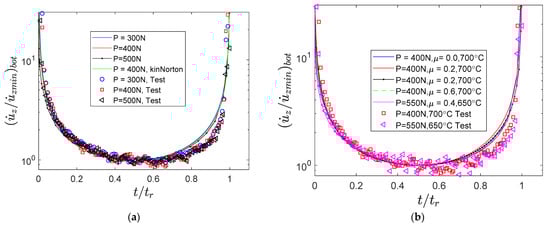
Figure 4.
Normalized deflection rate versus rupture time (a) KinGen, 700 °C, F = 300, 400 and 500 N, µ = 0.4; (b) 700 °C, F = 400 N, µ = 0–0.6; 650 °C, F = 550 N, µ =0.4.
Figure 4a shows the case for 700 °C, µ = 0.4, and F = 300, 400 and 500 N using the “KinGen” model and F = 400 N using the “KinNort” model. Figure 4b shows the computed values for 700 °C, F = 400 N, µ = 0, 0.2, 0.4 and 0.6, and for 650 °C when F = 400 N and µ = 0.4, all using the “KinGen”model. The first observation is that all computed curves fall almost on top of each other. This observation is general and applies to the kinematic and isotropic hardening. The second observation is that the computed and experimental values agree quite well up to 0.7⋅tr; thereafter the simulations predict a higher normalized deflection rate. The deflection rate curve has the typical three creep stages: primary, secondary and tertiary. In uniaxial creep, the primary creep effect is due to material hardening, whereas for the tertiary stage, the creep rate increases from increasing true stress and possibly also softening from accumulated creep damage. In the small punch creep case, the bell shape is also seen for the Norton creep model, which has no primary hardening or tertiary creep softening; thus, the apparent primary creep in SPC must mainly be due to stress redistribution and relaxation.
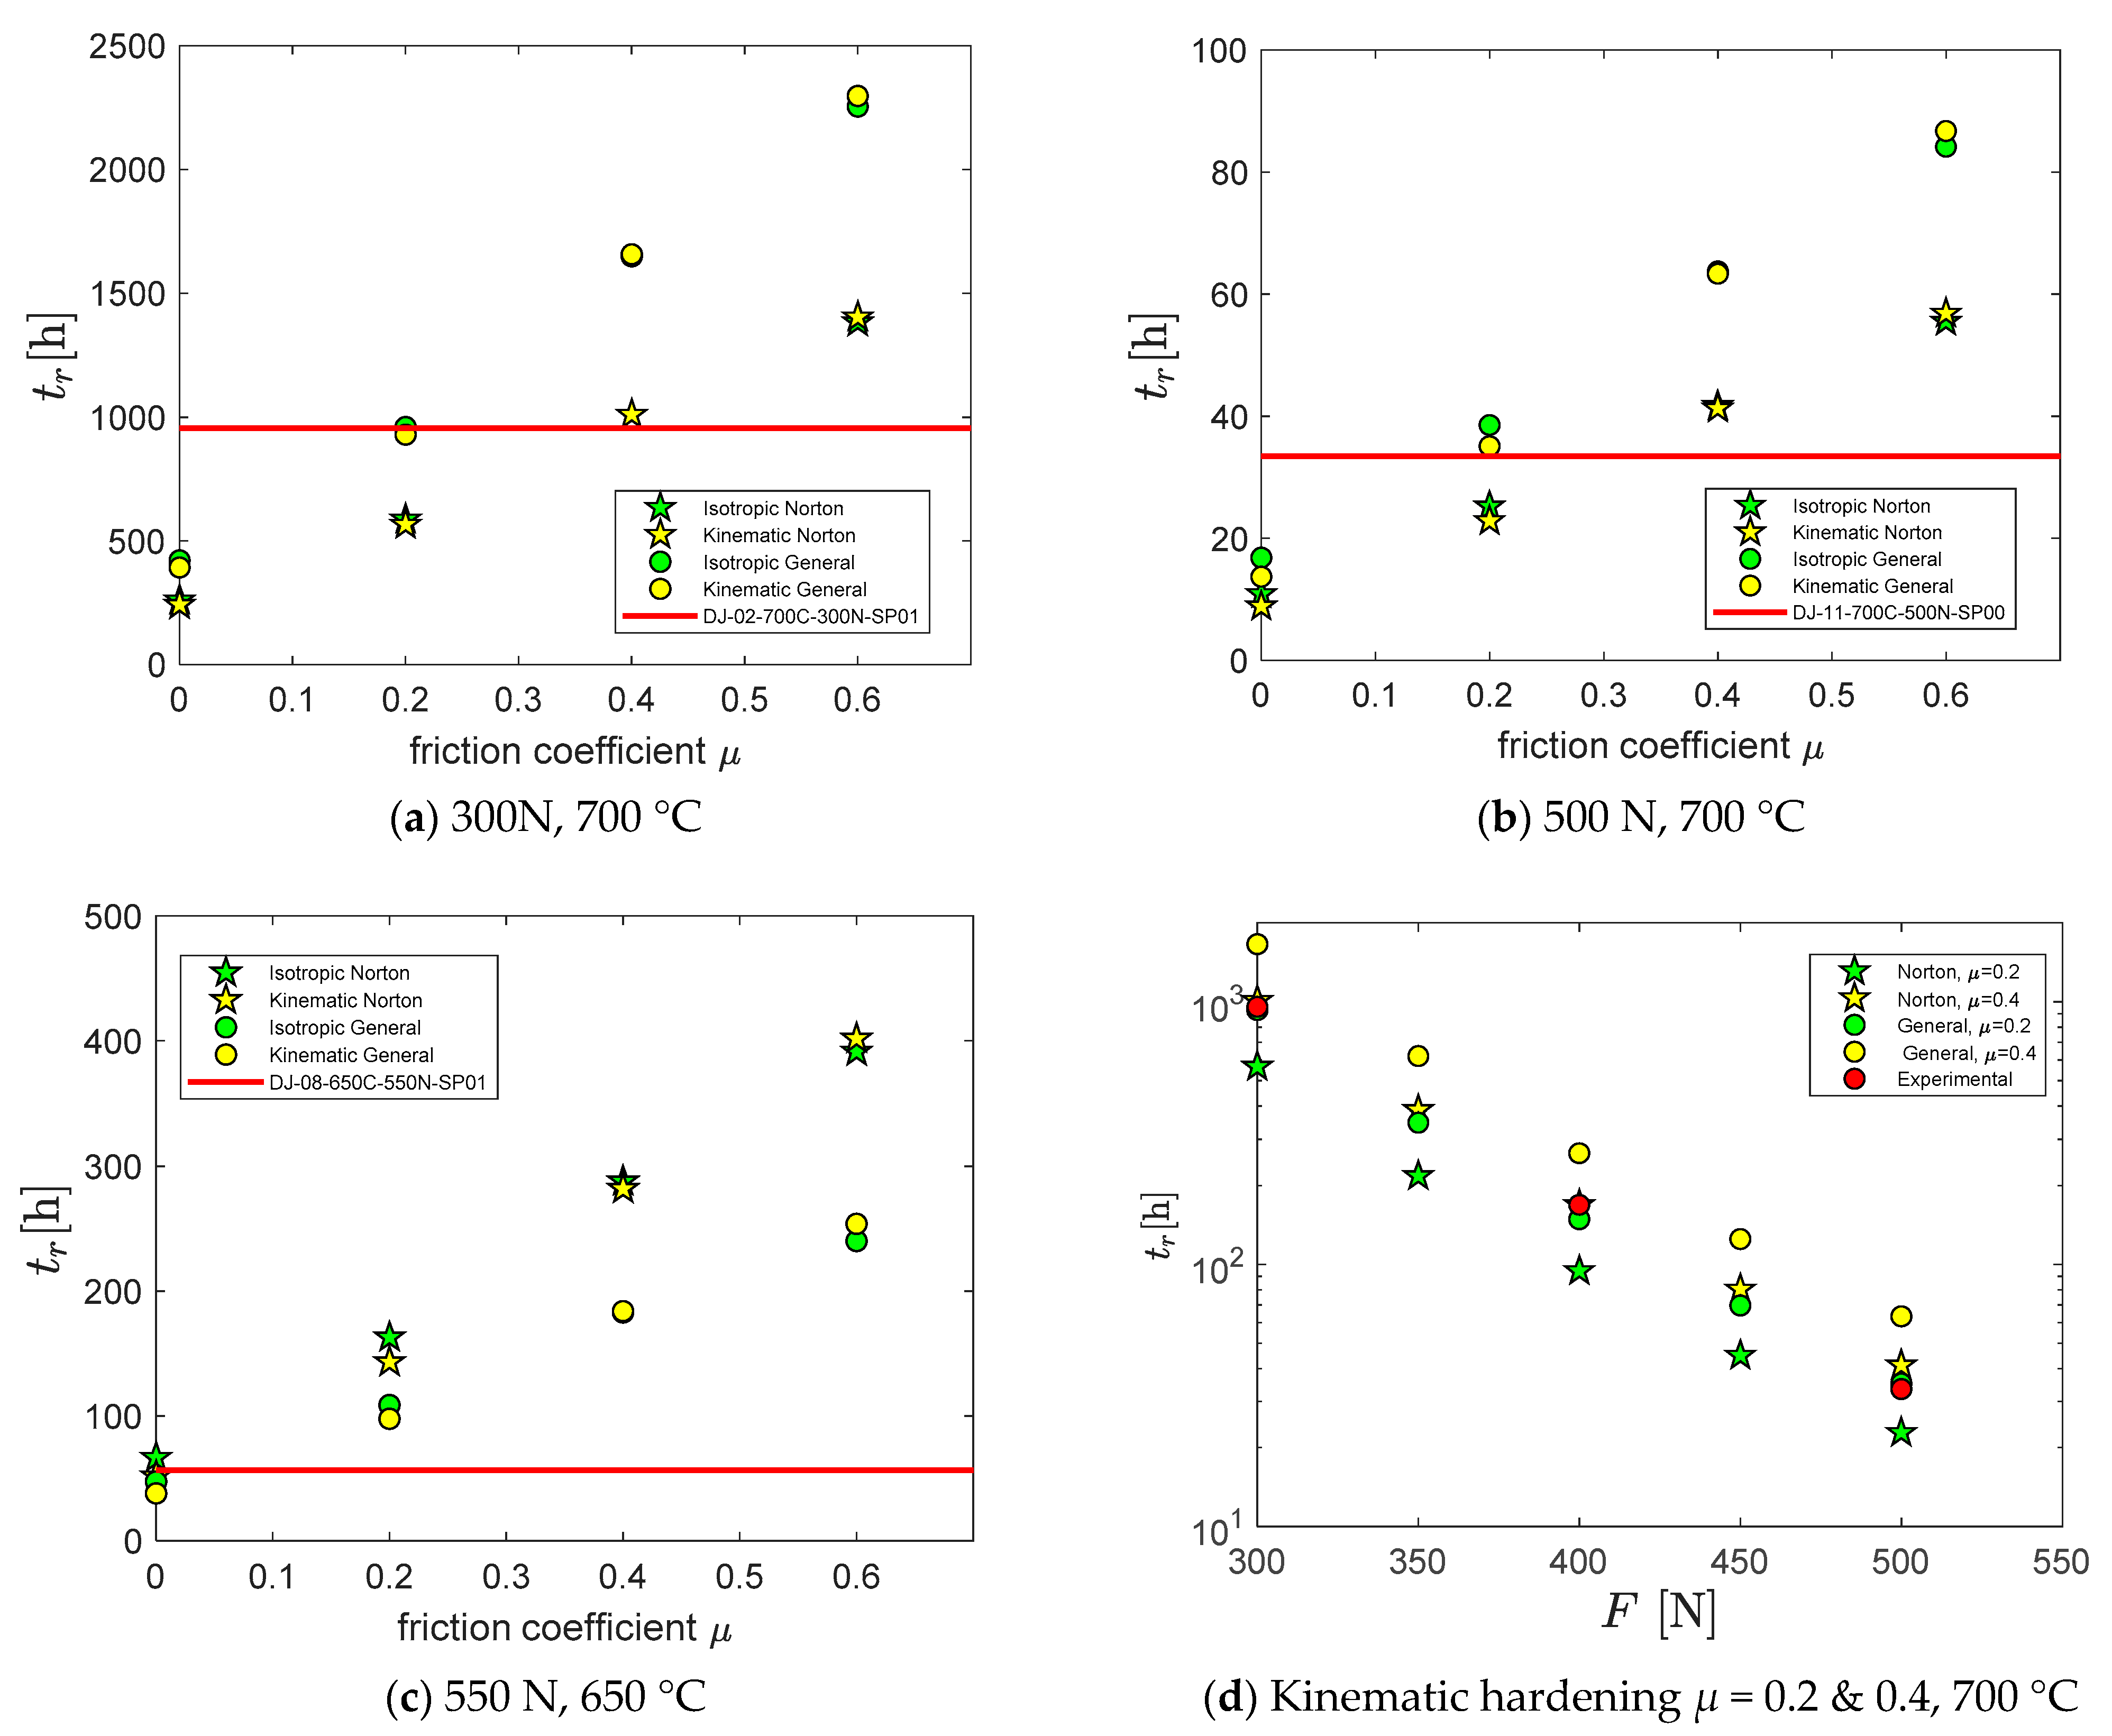
The computed time to rupture versus the friction coefficient is shown in Figure 5a–c for all four constitutive models together with experimental time to rupture (solid red line) for the cases 700 °C, F = 300 N and 500 N; and 650 °C, F = 550 N, respectively. In all cases the computed time to rupture increases linearly with the friction coefficient. It can also be noted that there is almost no difference between predictions using kinematic or isotropic hardening. We saw in Figure 4a that Norton and the general creep model resulted in almost identical normalized time/deflection rate curves, but the rupture time is roughly double for the general creep model as compared to the Norton model for 700 °C, whereas at 650 °C the Norton model predicts longer rupture time. Note that the Norton model was calibrated as the “best -fit” and not to the minimum creep rate as in creep design. Thus, whether the Norton model predicts shorter or longer rupture times depends on the calibration data and method. At any rate, a factor of two is within the scatter for a material’s creep rupture data. The computed creep rupture time increases linearly with the friction coefficient for all models by a factor of five when the friction coefficient increases from 0 to 0.6.
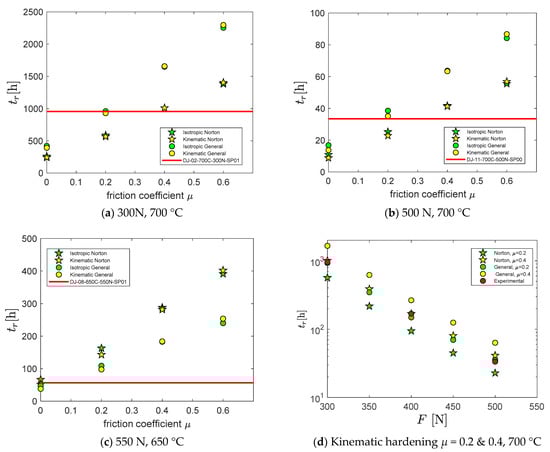
Figure 5.
Computed and measured time to rupture versus friction coefficient (a–c). (a) 300. N, 700 °C; (b) 500 N, 700 °C; (c) 500 N, 650 °C and (d) versus applied force for µ = 0.2 and 0.4, 700 °C.
There is an excellent agreement between the experimental data for the 700 °C case of the general creep model with µ = 0.2 for 300 N and 500 N and good agreement for the Norton creep model with µ = 0.4. Figure 5d shows the computed logarithmic rupture time versus the load for the “KinGen” and “KinNort” models with the friction coefficients 0.2 and 0.4. There is an almost perfect linear relationship and with an almost perfect agreement between the measured time to rupture and the Norton model with µ = 0.4 and the general creep model with µ = 0.2 for 300, 400 and 500 N.
The linear relationships between creep rupture time, friction and load are very nice features and could be used to explain systematic differences in measured rupture time due to friction, for example. The linear relationship suggests that the friction coefficient could be inferred from small punch test rupture time. Using a linear regression for the computed time to rupture versus friction for each load fitted to experimental data results in friction coefficients of 0.19, 0.22 and 0.17 for F = 300, 400 and 500 N, respectively, for the KinGen model. There is, however, significant scatter in measured rupture times for nominally identical cases, and as mentioned above, a factor of two is quite normal, which limits the accuracy of such an approach.
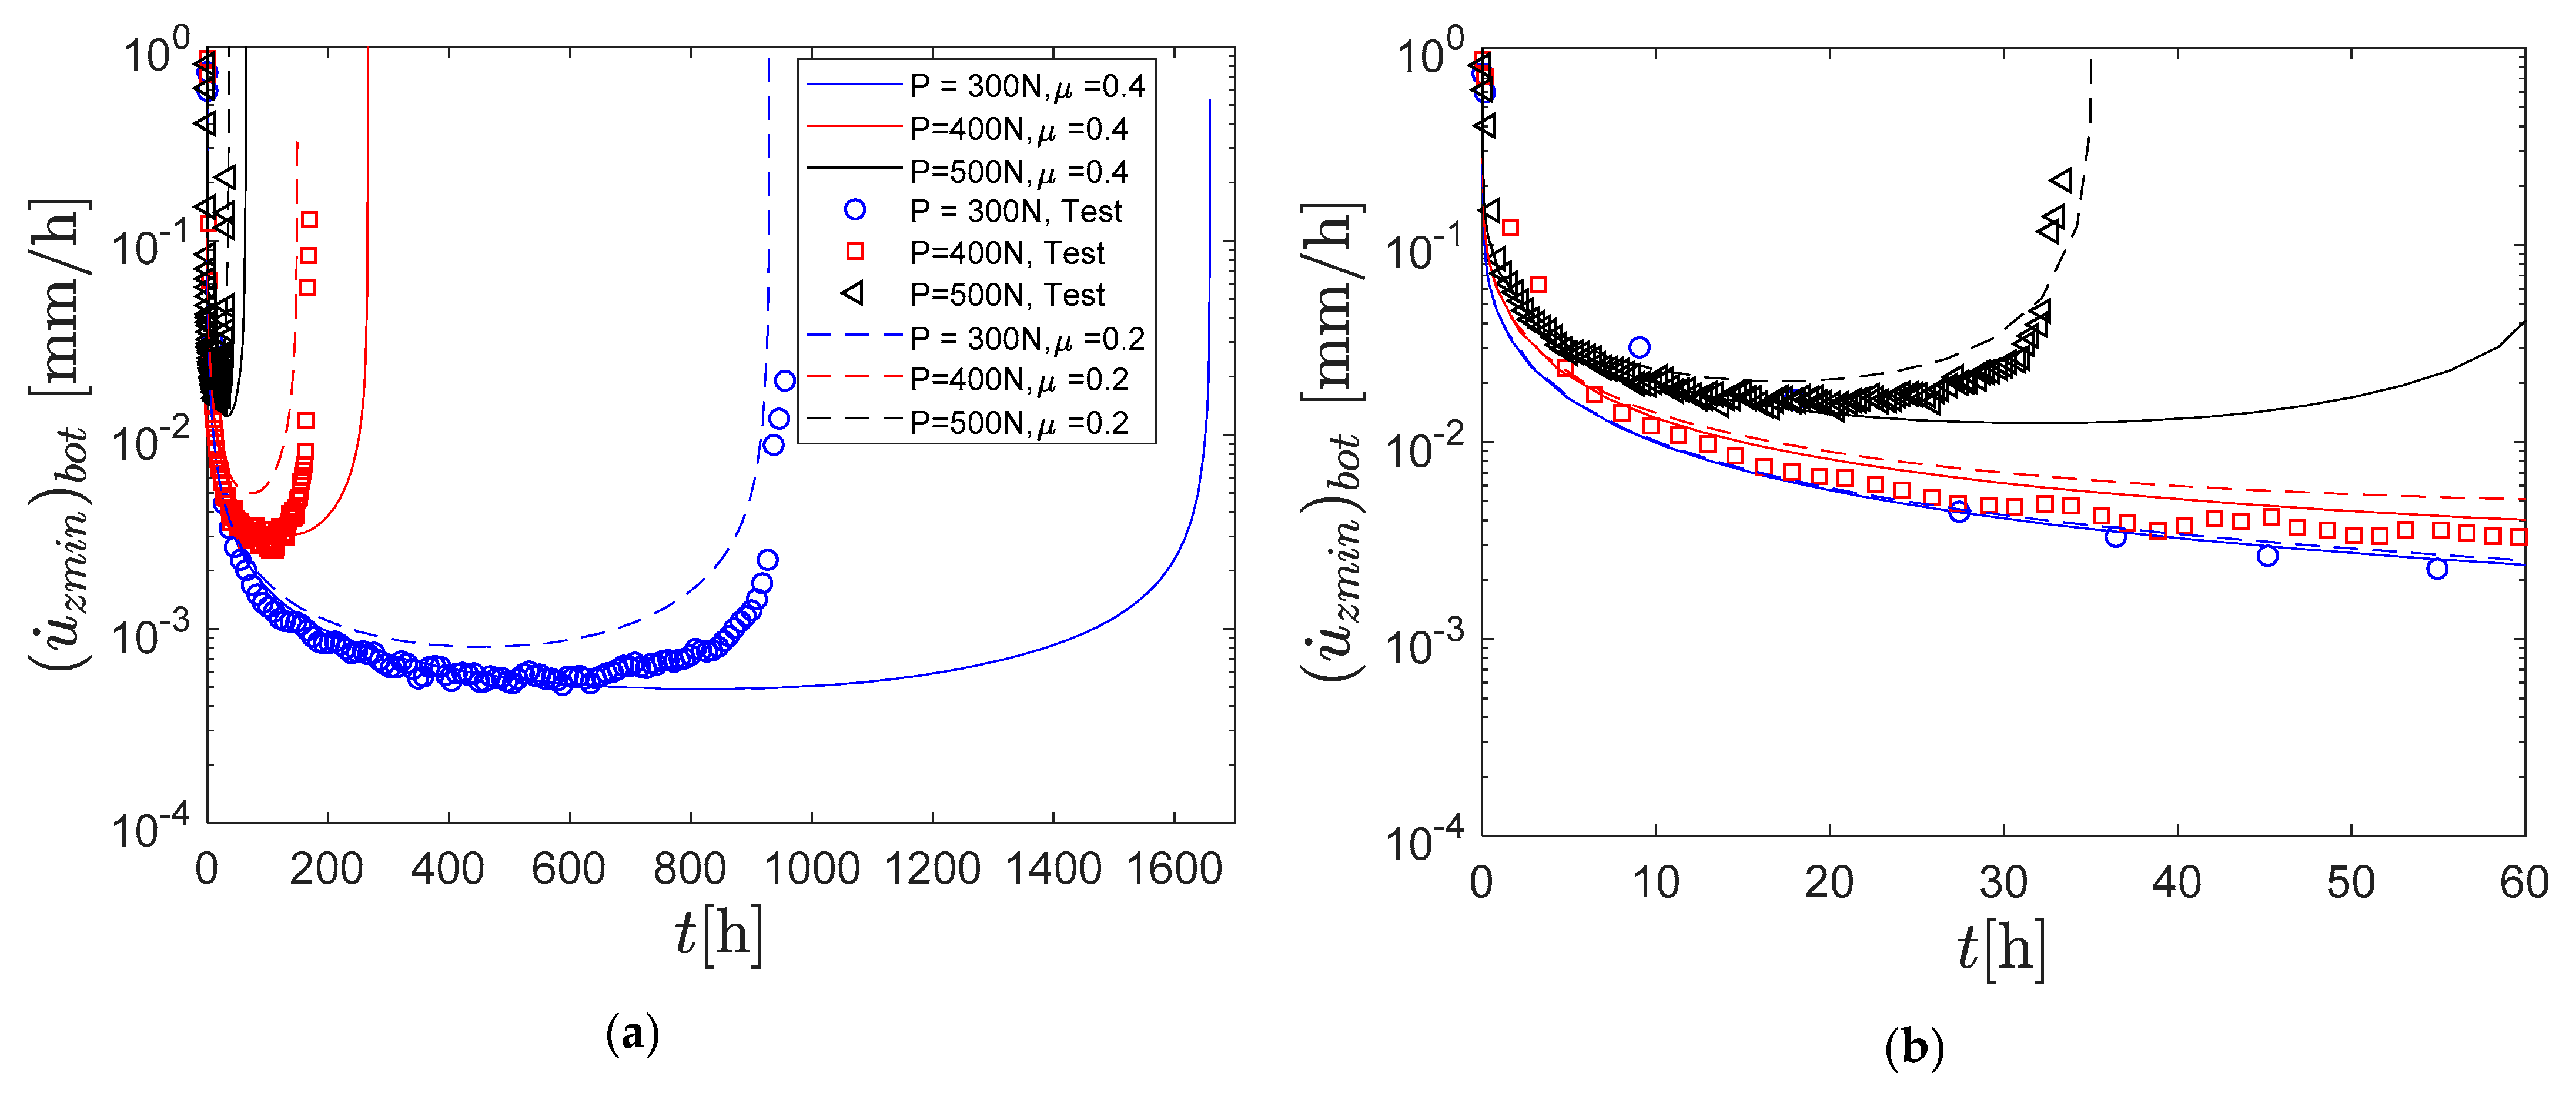
The scatter in rupture time is largely due to differences in the final tertiary stage, so it may be more appropriate to use the deflection rate to determine the friction coefficient. Figure 6 depicts measured and computed deflection rates versus time for the 700 °C case and F = 300, 400 and 500 N using the KinGen model with µ = 0.2 and 0.4, respectively. As noted above, µ = 0.2 results in a good agreement between the computed and measured time to rupture, whereas µ = 0.4 gives systematically a much closer agreement with the measured deflection rate until its minimum value but over-predicts the time to rupture by a factor of 1.5. A conjecture could therefore be that µ = 0.4 is a better estimate of the true friction coefficient, but that beyond half the rupture time there is increasing creep damage which accelerates creep deformation, and this creep damage is not captured by our processed design code creep data. The sudden increase in deflection is also an indication of cracking [2]. Damage models calibrated to uniaxial test data have been applied for the simulation of the small punch creep test, including Kachanov–Rabatov [5,25,35], modified Liu–Murakami [13,14,15] and ductility–exhaustion [22]. Typically, a combination of cleavage and ductile fracture is observed at the edge of the indented area, indicating local damage prior to failure [4]. Our creep model includes tertiary effects, but the processed design data to which it was calibrated did not show creep damage softening.

Figure 6.
Computed deflection rate vs. time, F = 300, 400 and 500 N, experimental and simulation (kinGen model) (a) 0–1700 h; (b) 0–60 h.
Coulomb friction coefficients calibrated to experimental results are typically between 0.2 and 0.4. [5,11,13,14,15,21,26,28,35]. More advanced contact models that allow variable friction coefficients that depend on contact area and plastic hardening result in higher friction coefficients at the edge of the contact zone but with a good agreement with Coulumb friction coefficients 0.2–0.3 for P91 [25]. Both the creep damage and the friction effects are most pronounced in the tertiary stage.
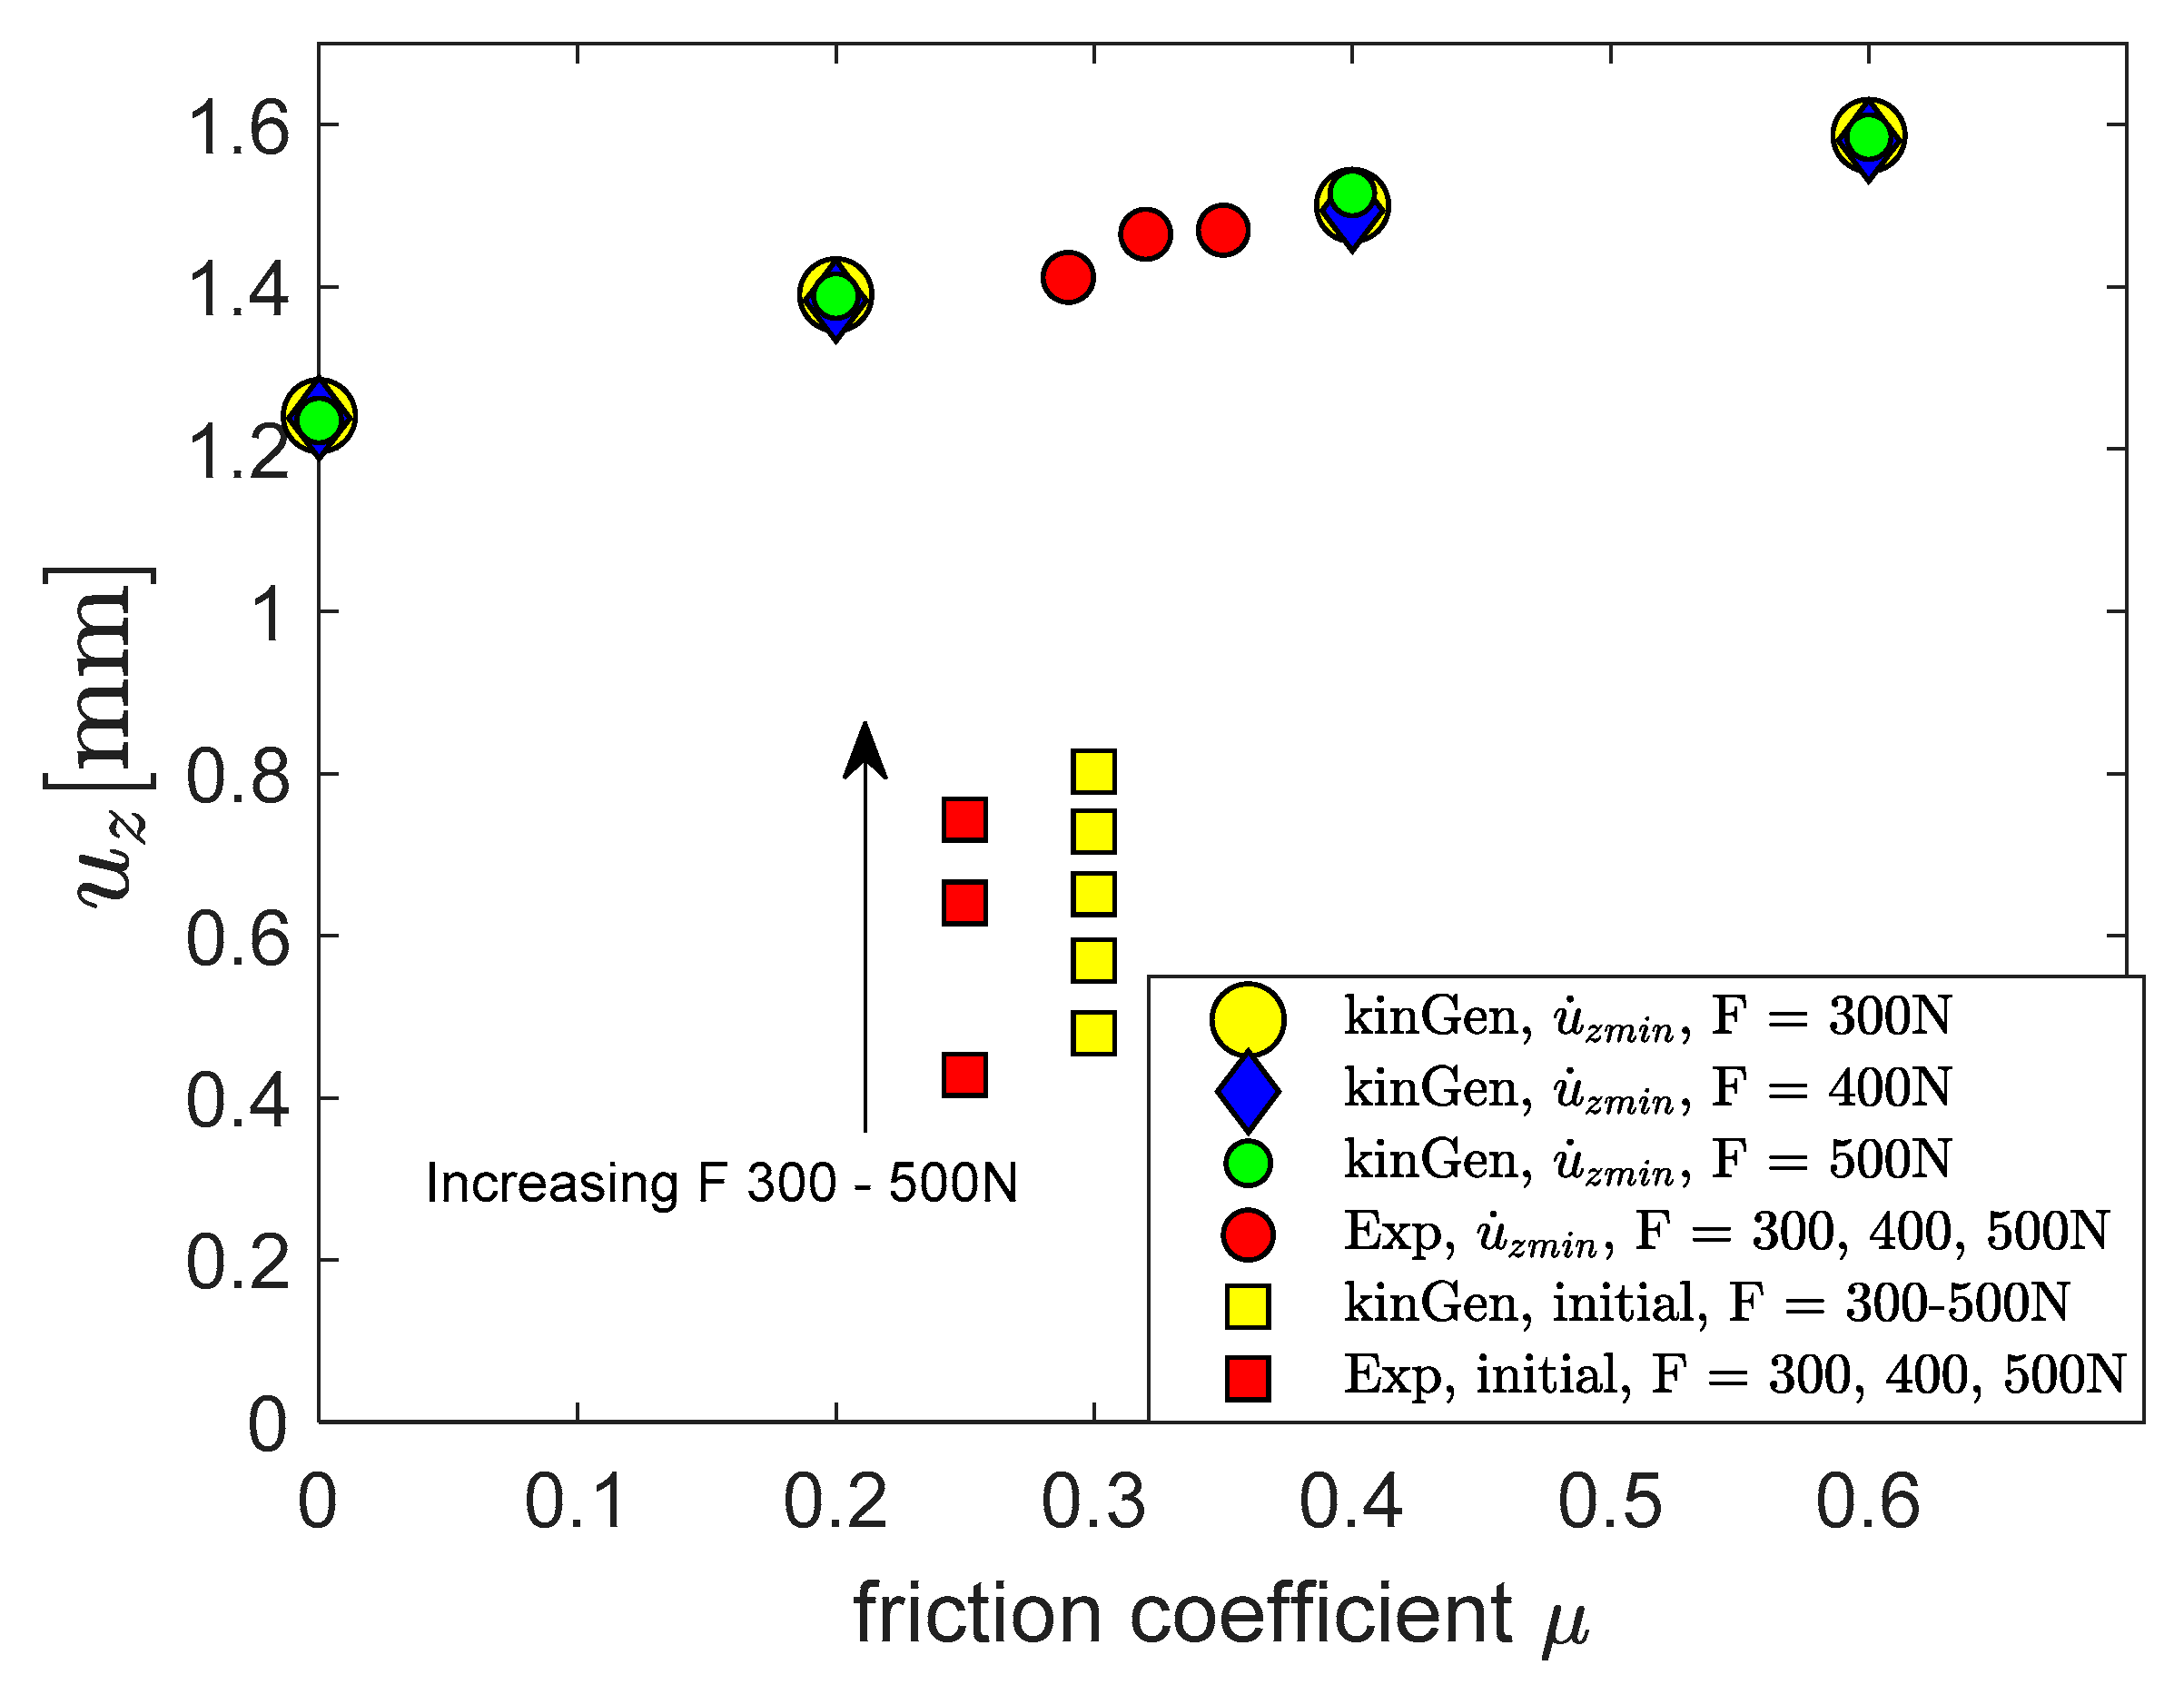
Figure 7 shows the computed and experimental deflections at the start of creep and when the minimum deflection is attained versus the friction coefficient. The actual friction coefficient cannot be measured, and test data are plotted with µ = 0.25 for the initial elastoplastic deflection and 0.29, 0.32 and 0.35 for the minimum deflection rate. The computed elastoplastic deflection at the start of the creep stage is virtually unaffected by the friction coefficient and is slightly higher than the measured values, and in Figure 7 only plotted for µ = 0.3. The computed total deflection when the minimum deflection rate is attained is virtually unaffected by the load but increases slightly and almost linearly with the friction coefficient. Note that since the initial elastoplastic deflection increases with the increasing load, the creep contribution at the minimum deflection rate must decrease correspondingly. The corresponding measured deflection is essentially the same for the three load levels and agrees with the computed value for µ between 0.2 and 0.4, in agreement with Figure 6. Fitting a linear regression of the computed deflection at minimum deflection rate with the experimental data result is predicted friction coefficients of 0.37, 0.37 and 0.28 for F = 300, 400 and 500 N.
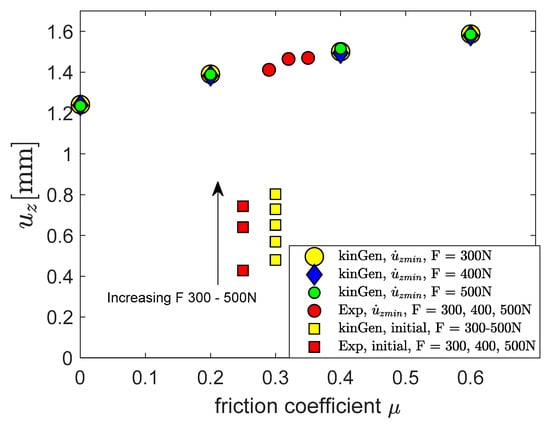
Figure 7.
Computed and measured deflection at the start of creep and when minimum deflection rate is achieved for 700 °C. The computed deflection when minimum is achieved is plotted against the friction coefficient. The computed initial plastic deformation is virtually independent of the friction and only one value per applied load is shown.
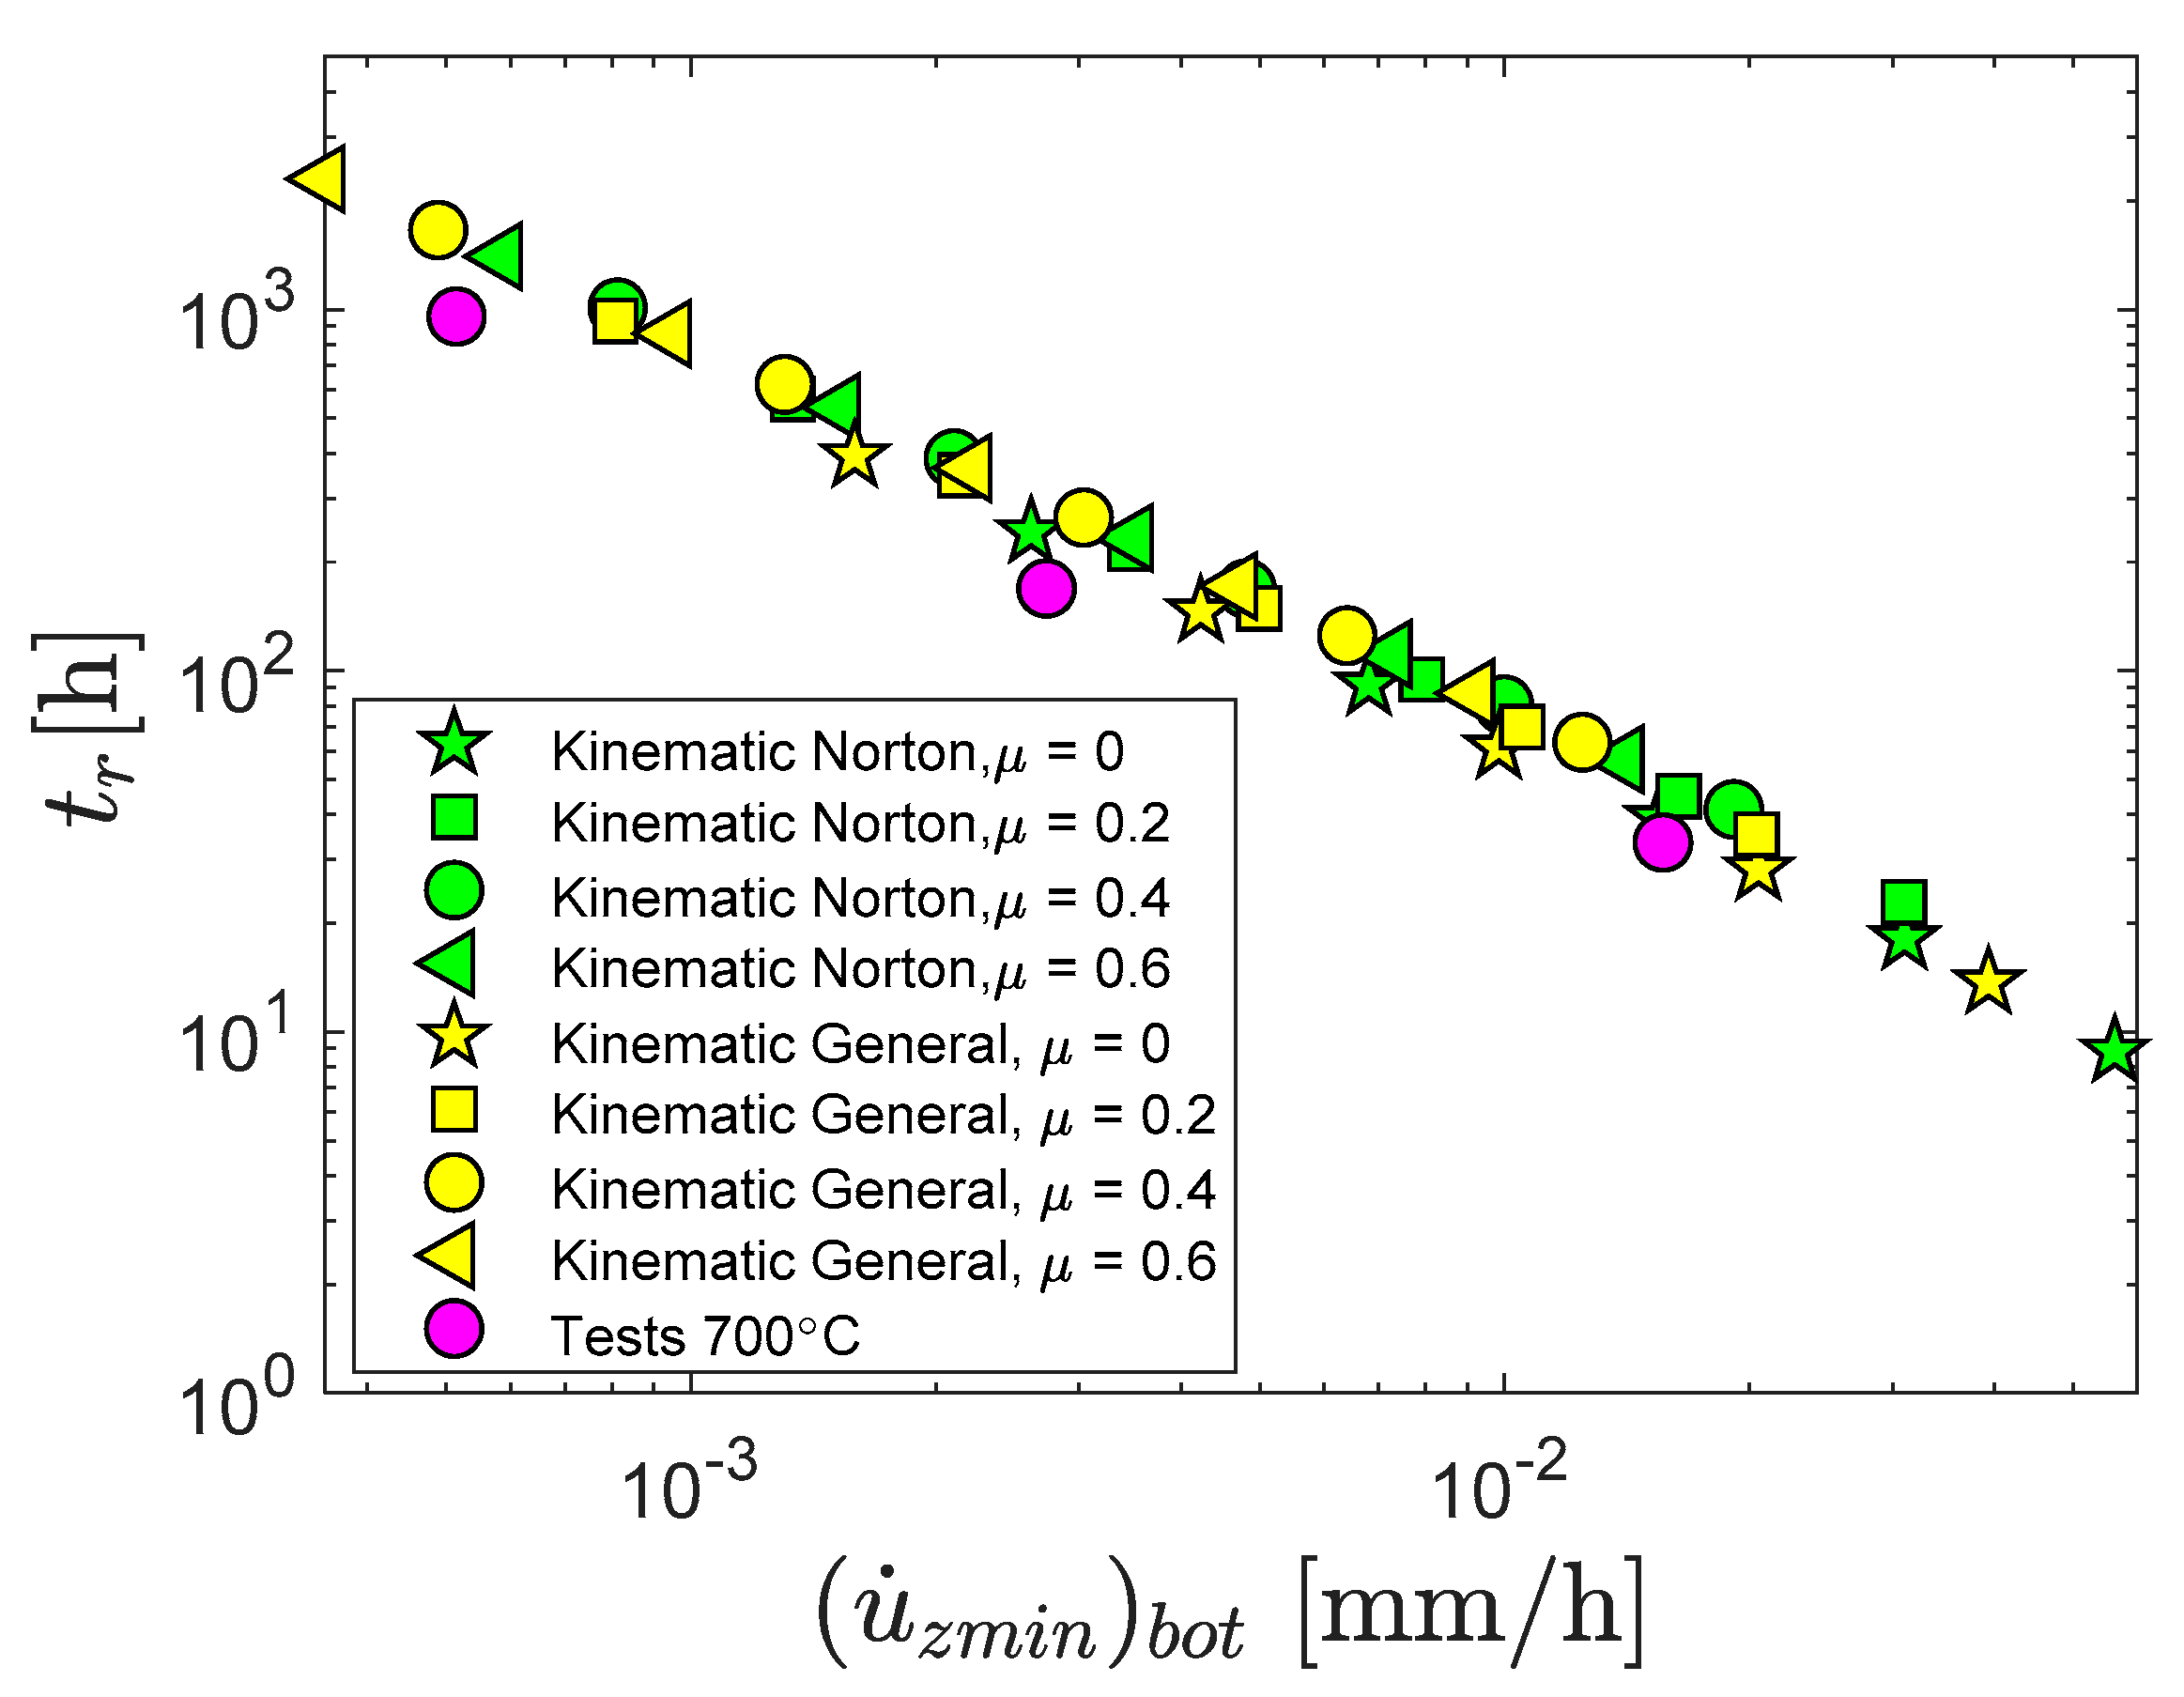
Figure 8 depicts the computed time to rupture versus the minimum deflection rate in a log-log scale for the kinematic hardening models of Norton and general creep with the four friction values together with thee measured values. All computed values fall neatly along a line that slightly over-predicts the measured time to rupture, which is expected since the deflection rate in the tertiary stage is underestimated as shown in Figure 6. More importantly, it shows that friction does not affect the relationship between time to rupture and deflection rate.
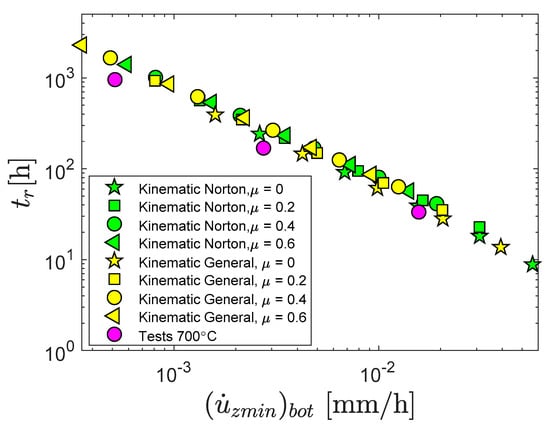
Figure 8.
Time to rupture versus minimum deflection rate at lower surface.
4.3. Computed Stresses and Strains
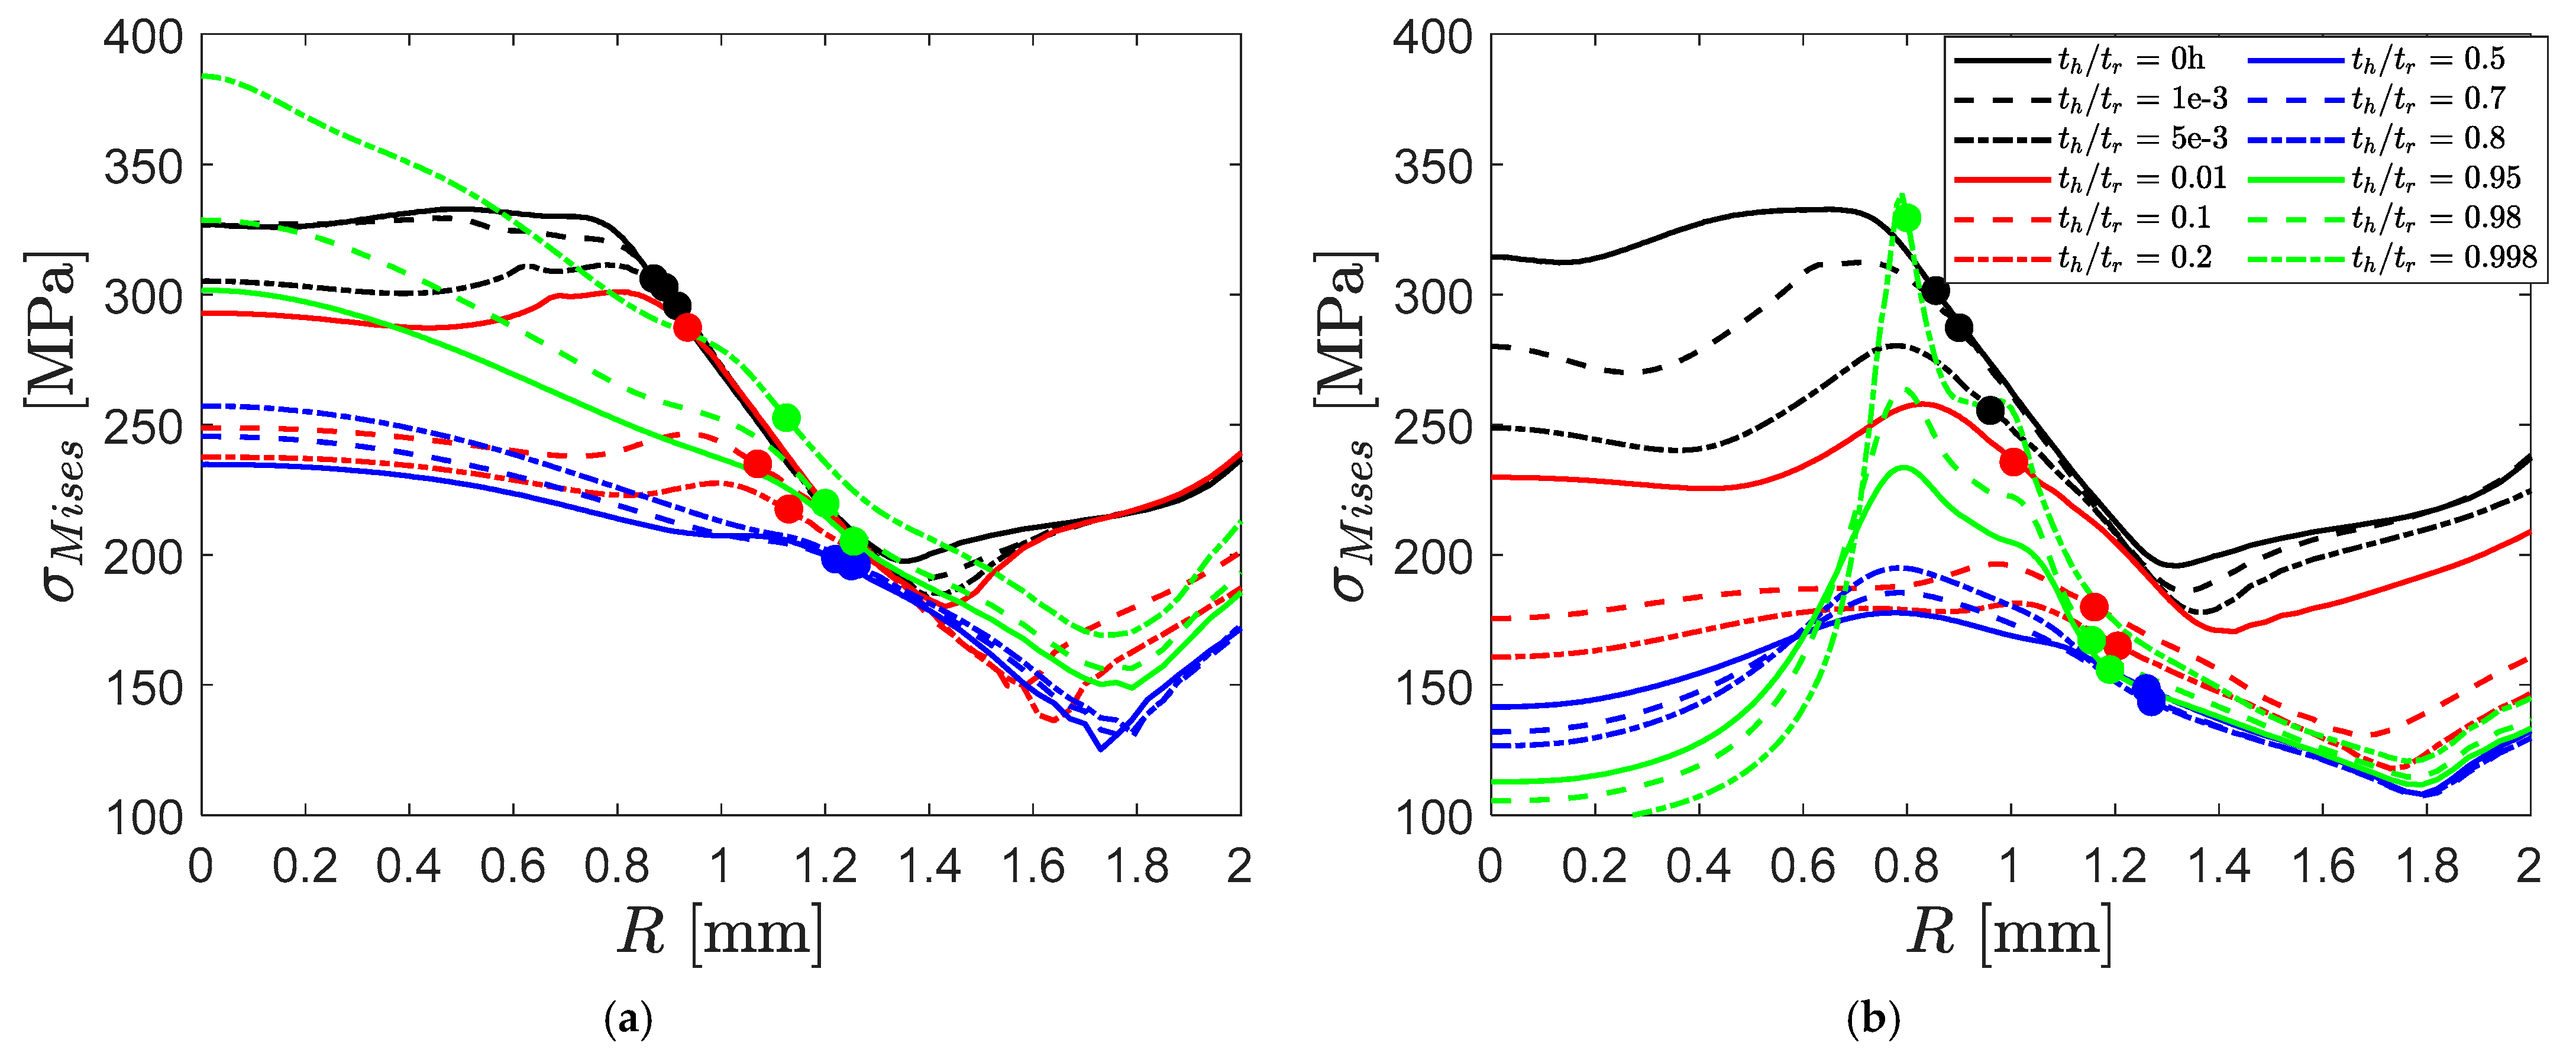
The plastic and creep deformations are directly linked to the stress distribution through the constitutive model. Understanding the evolution of the complex stress distribution is essential to better understand the small punch creep test. The computed stress distributions for the different models, applied load and temperature are quite similar indicating a “master shape”, whereas the difference in friction coefficient infers a relatively large impact on the stress distribution. We therefore limit the discussion to the case of kinGen, 700 °C, 400 N applied force, for µ = 0 and 0.6. Figure 9a, b shows the stress distributions at twelve time instances. The black solid line is the stress distribution at the start of the creep, and the colours represent different stages of t/tr: 0–5 × 10⁻³, 0.01–0.2, 0.5–0.8, 0.9–0.998.
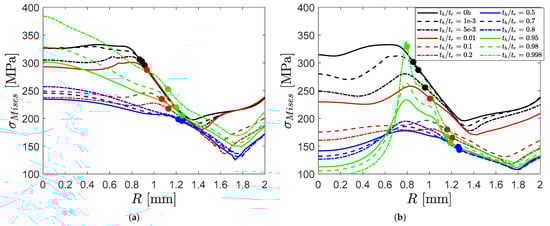
Figure 9.
Computed von Mises hoop stress distributions vs. radial distance in the undeformed stage at different times, kinGen model, F = 400 N, T = 700 °C, (a) µ = 0; (b) µ = 0.6. The circles show the radial contact zone under the indenter.
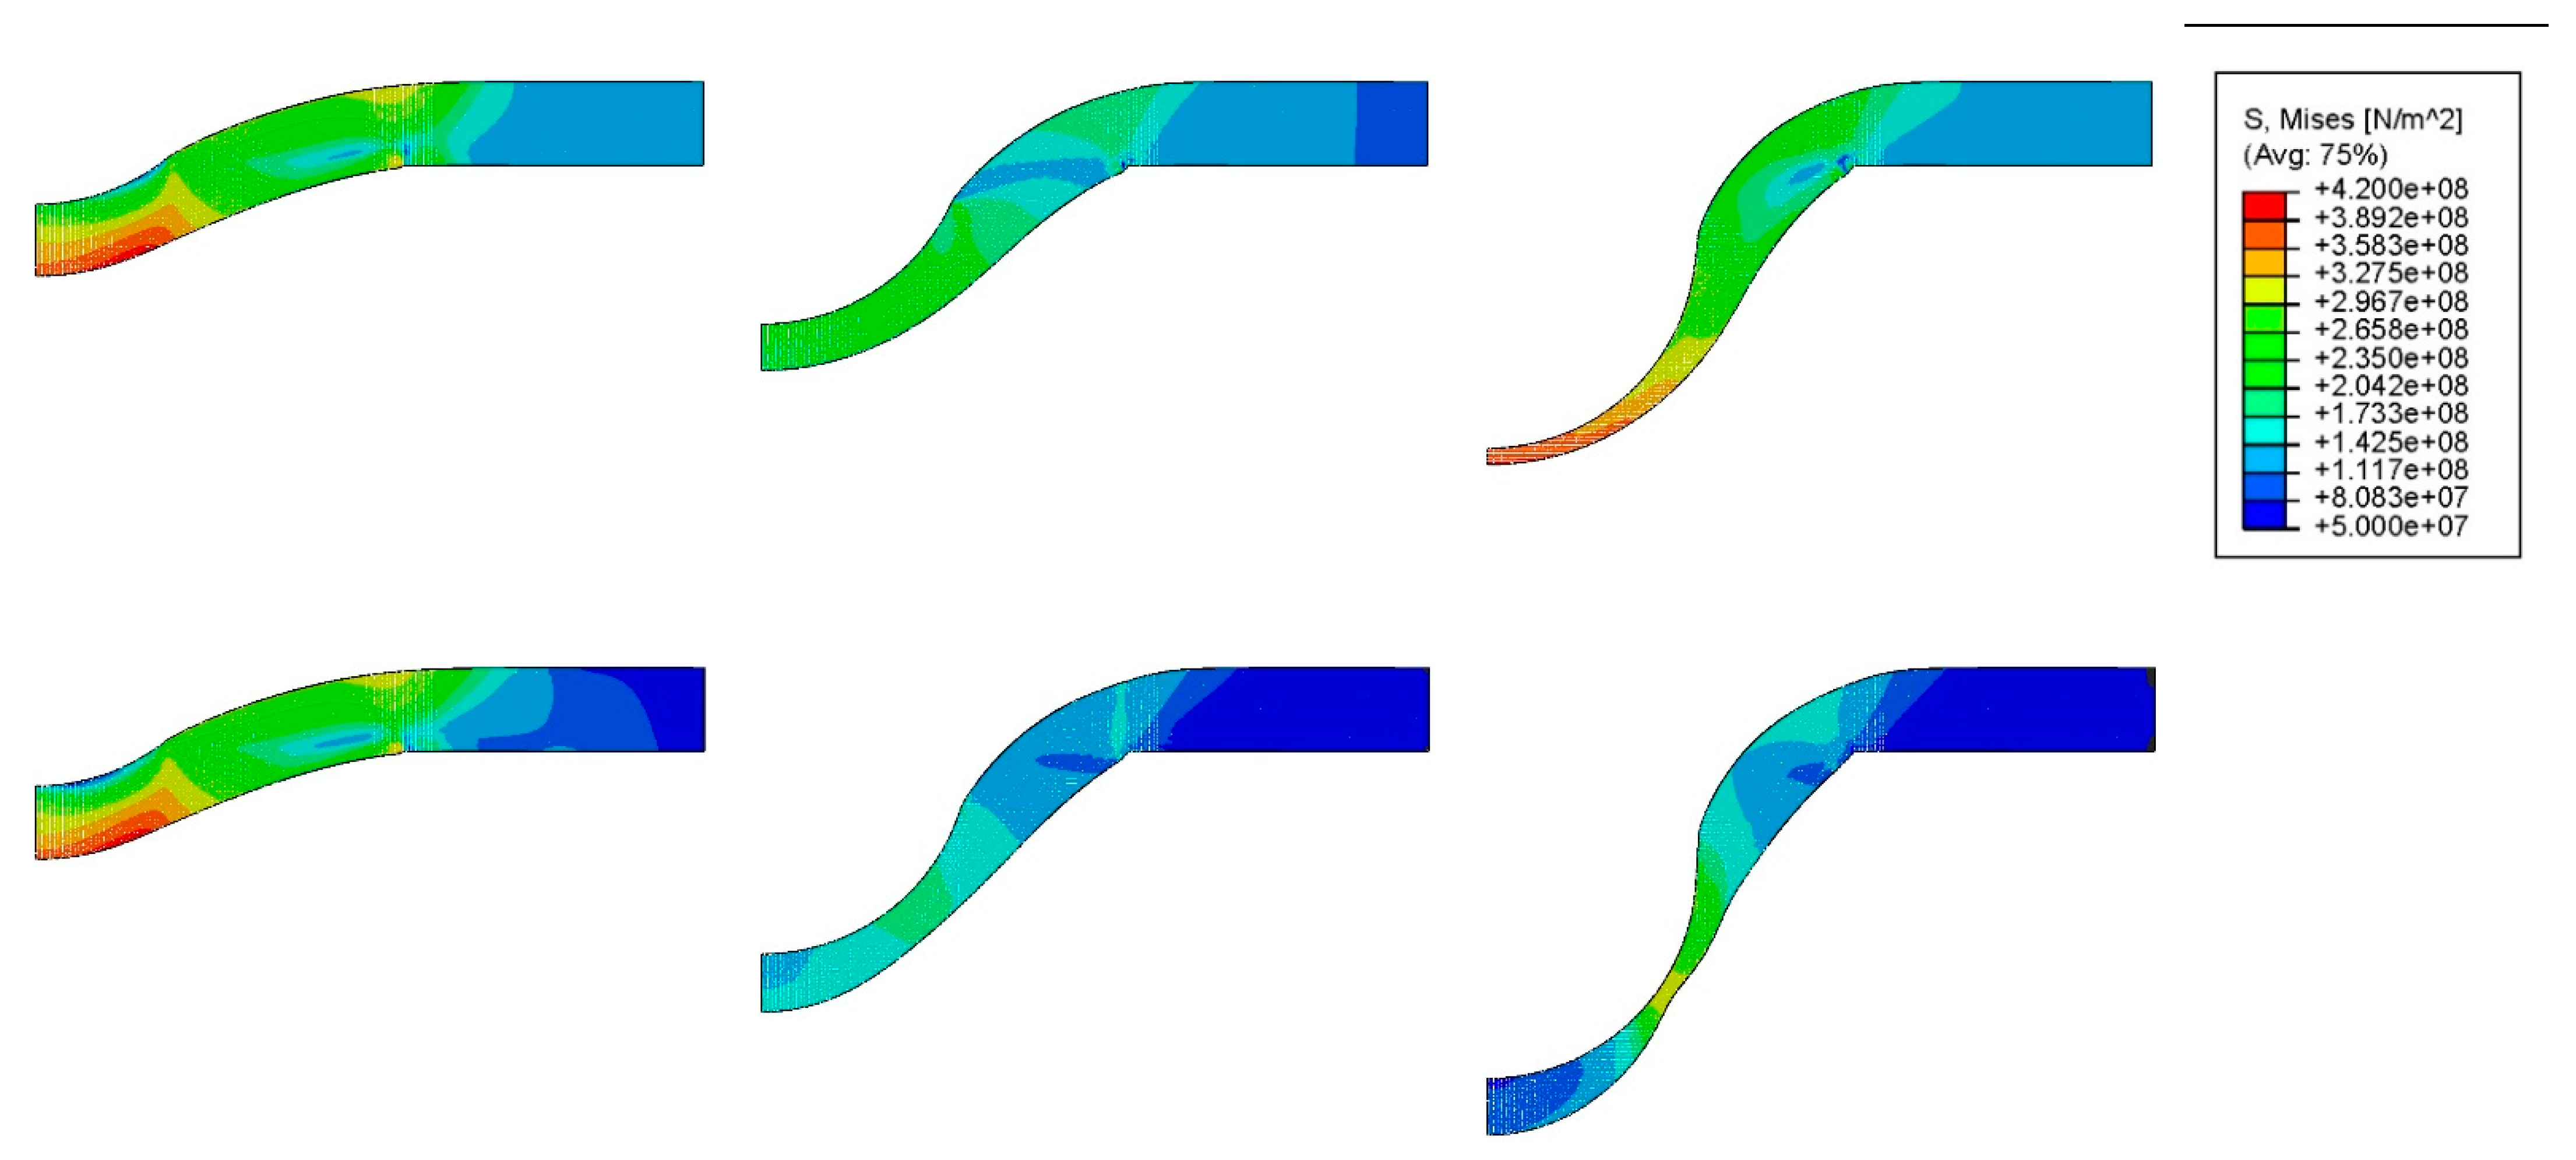
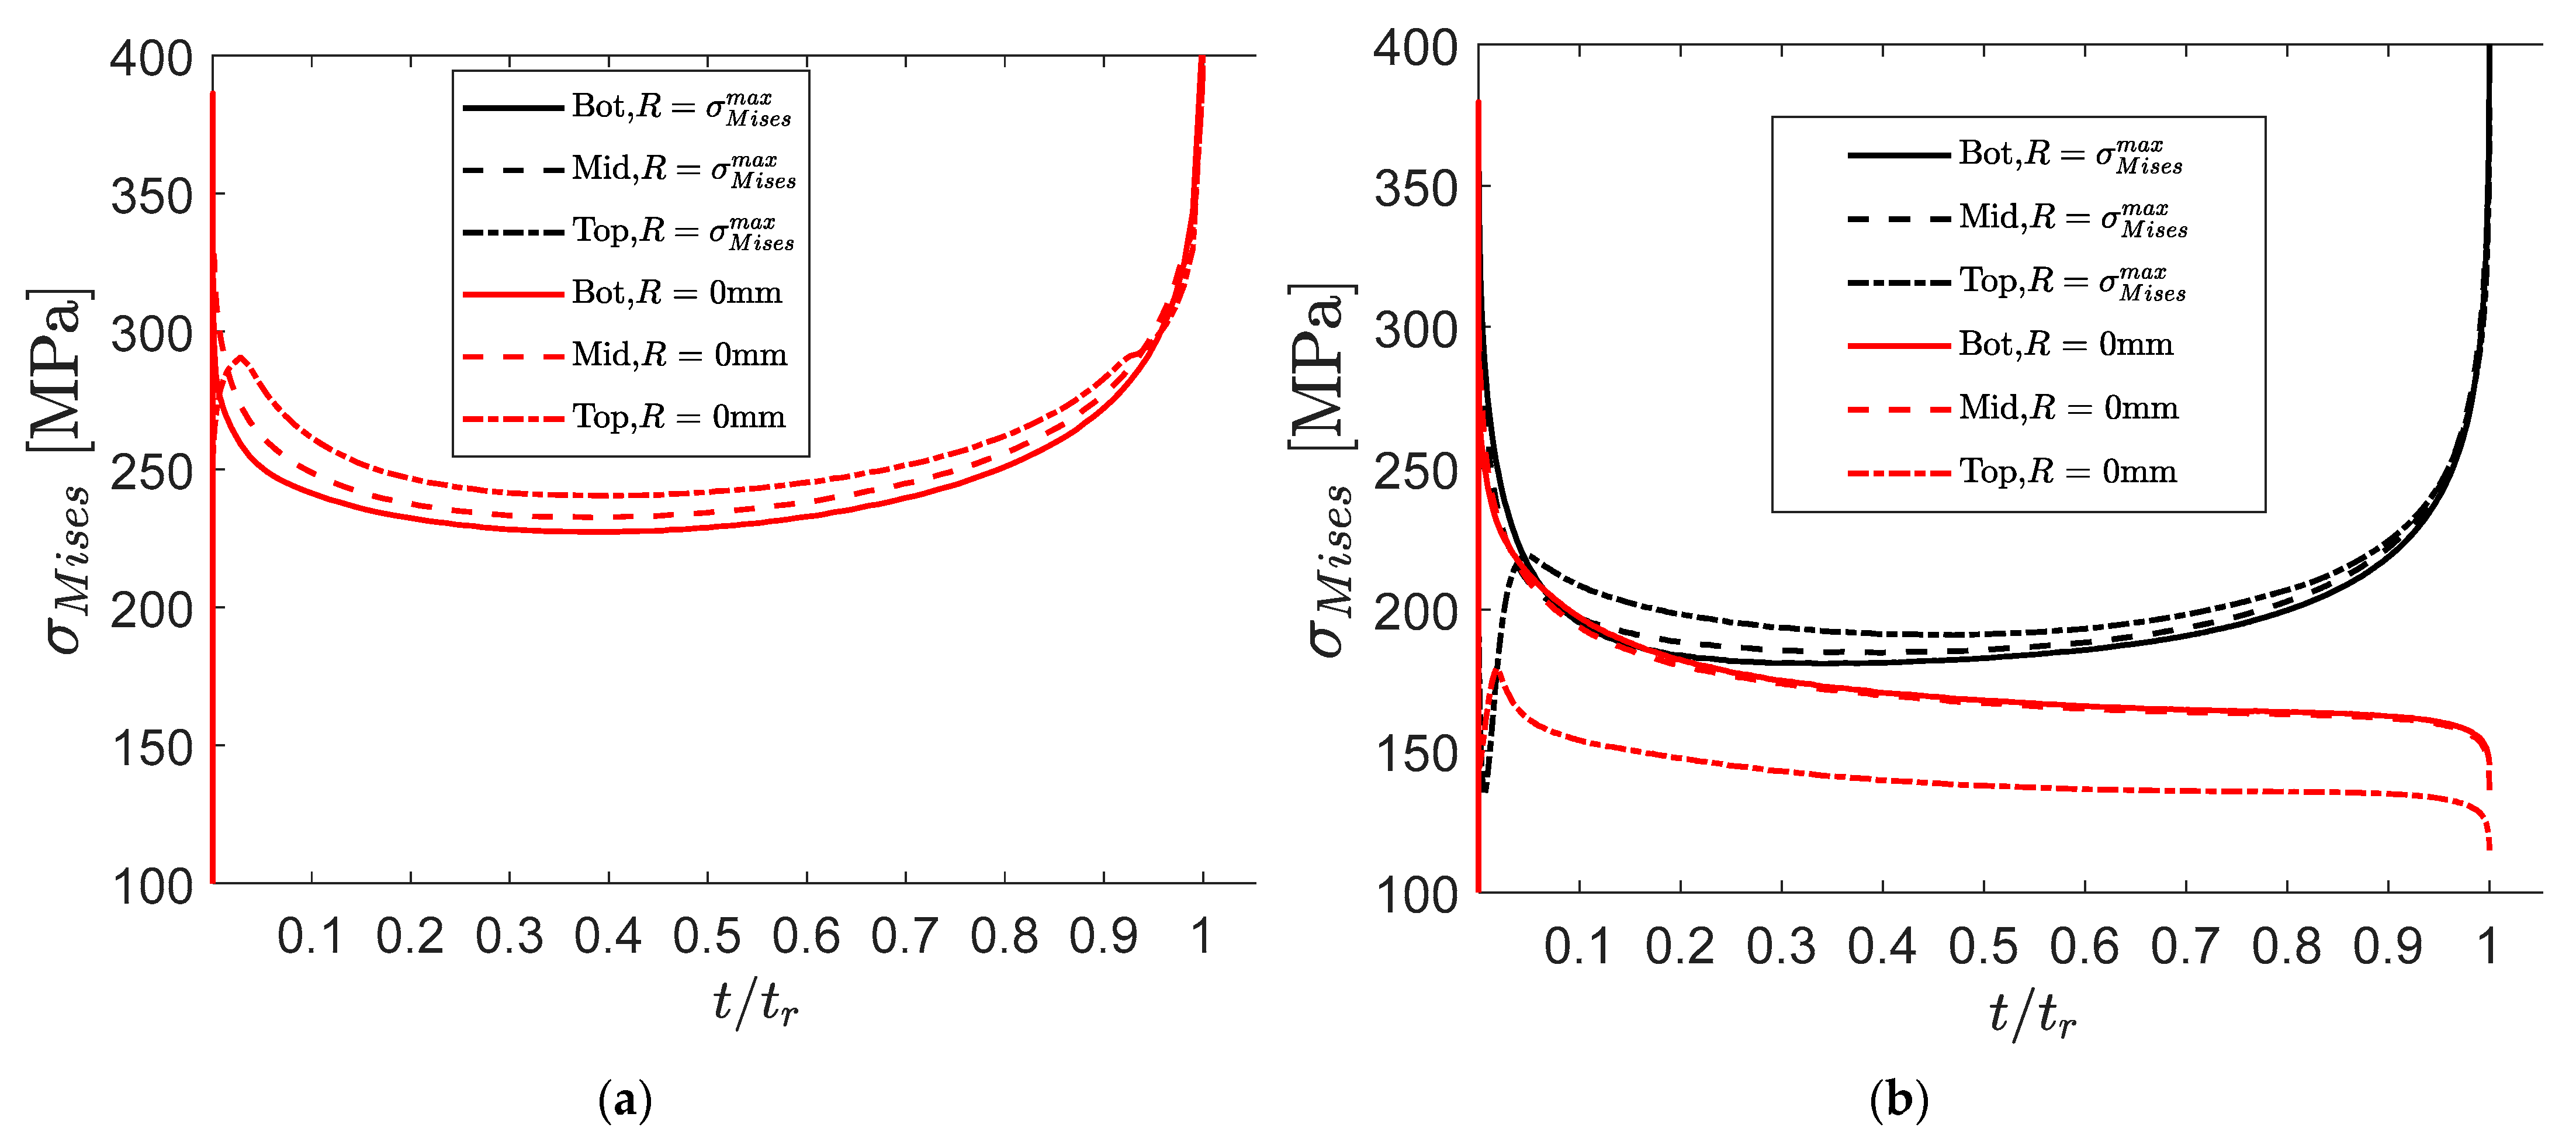
As a reference, the indenter radius is 1.25 mm, and the radial distance 2 mm corresponds to the radius of the lower hole RdL in Figure 3. The radial distance R in Figure 10 corresponds to the undeformed state. The radial extension of the contact zone between the puncher and the disc is indicated by the symbols. Figure 10 shows the cross section for the von Mises stress distribution when µ = 0 and 0.6, and when t/tr = 0, 0.5 and 0.998, respectively. Figure 11 shows the von Mises stress versus time at the upper and lower surfaces and at the mid section at the centre of the disk (R = 0) and the location with maximum peak stress at the minimum deflection rate (R = 0 and 0.7 mm for µ = 0 and 0.6, respectively). Plastic reversal requires, as shown in Figure 1, that the stress drops by twice the initial yield limit (2R0 = 180MPa, for 700 °C) and this only just about occurs for the large friction case, which explains why the difference between kinematic and isotropic hardening has a very small impact on the predictions.

Figure 10.
Cross sections of von Mises stress at t/tr = 0, 0.5 and 0.998, F = 400 N, kinGen, µ = 0 0 (upper row) µ = 0.6 (lower row).
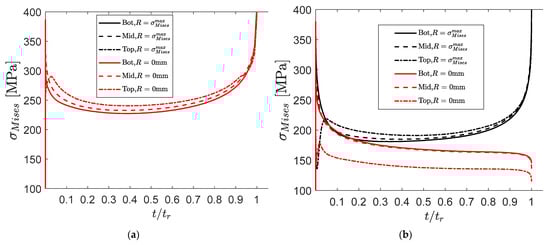
Figure 11.
Computed von Mises stress at upper surface (top), mid- and lower surface (Bot) at two radial locations: the centre and the location with the maximum stress at the minimum deflection rate vs. time, kinGen model, F = 400 N, T = 700 °C, (a) µ = 0; (b) µ = 0.6.
There are some commonalities as well as important differences between the high and low friction cases. In both cases the initial high stress relaxes quickly, and the stress distribution evens out; the peak stress attains a minimum value at half the rupture time, which also coincides with the minimum deflection rate as seen Figure 4. Subsequently the peak true stress increases until failure due to reduced cross-section with increasing deformation. The contact zone expressed by the undeformed configuration expands with time until 0.8tr and then slightly decreases. The actual contact zone, however, increases monotonically with stretching as indicated in Figure 10.
There are also significant differences for the stress distribution itself and the deformation. In the zero-friction case the peak stress is at the centre (R = 0) and relatively evenly distributed under the indenter. In the high-friction case, the peak stress is located at radial distance 0.6–0.8 mm and a very localized peak stress develops before rupture, where a necking also occurs. The stress distribution under the puncher (0–1 mm) is much more homogeneously distributed and the mean stress is also much higher for the low-friction coefficient compared to the large friction for 0.2 < t/tr < 0.8, when the “stage 2 creep deflection” prevails, as indicated in Figure 4. It should be noted from Figure 11 that the stress distribution at the at the “peak stress location” is relatively constant over a large fraction of the creep life and close to a membrane state for both the low and high friction case. The higher mean stress for µ = 0.6 explains why the time to rupture increases with lower friction.
In a multiaxial deformation, the stress components are important. The individual stress components are not as evenly distributed as the von Mises stress. The shear stress is small for µ = 0, but becomes large for µ = 0.6, and in the necking region the shear stress exceeds the radial and hoop stress components.
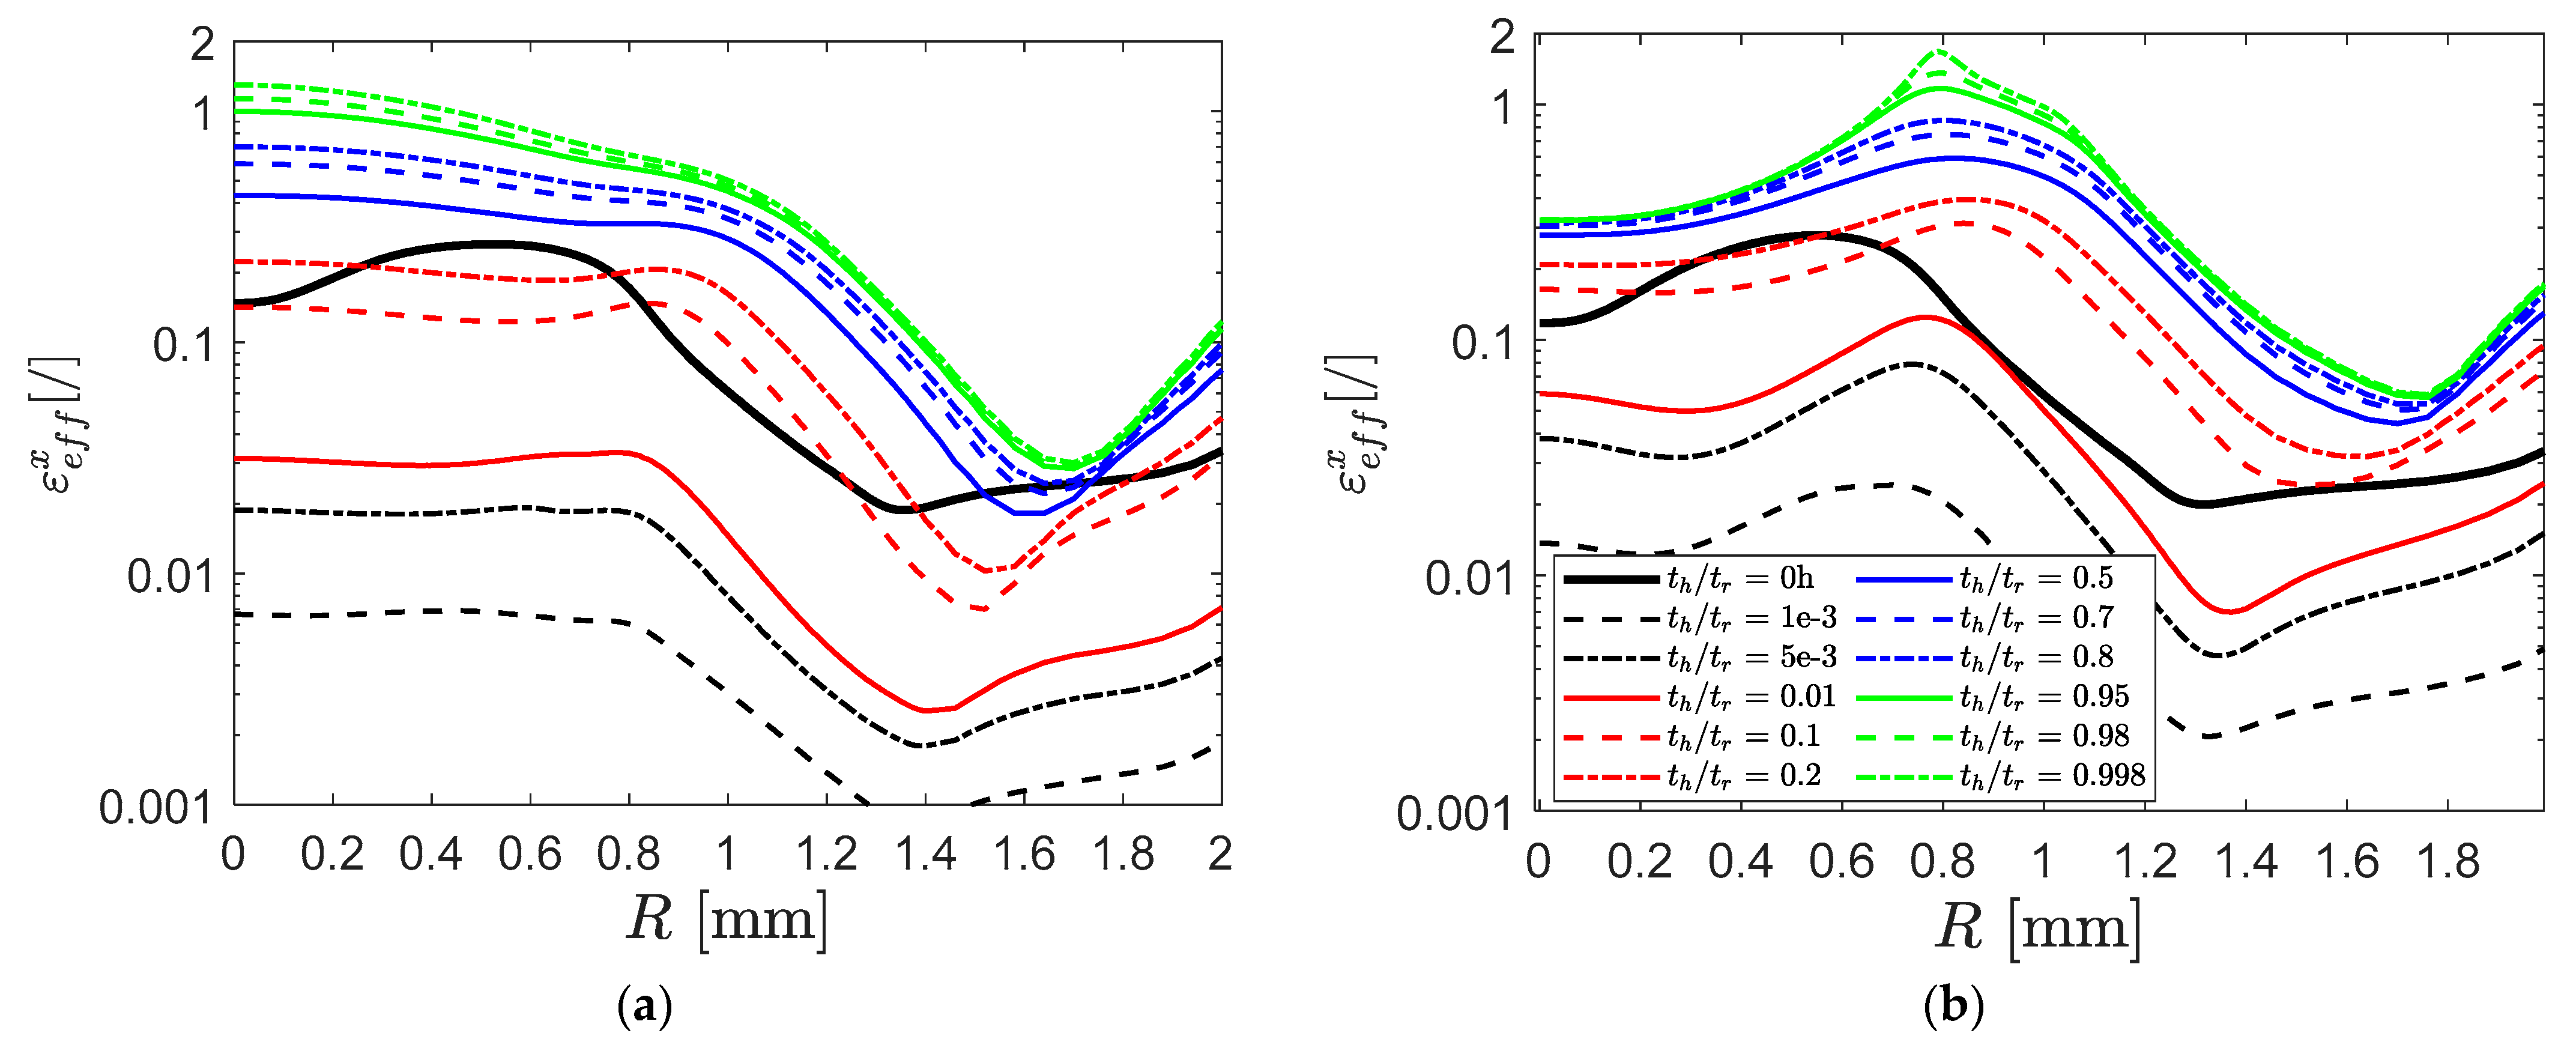
The effective cumulative plastic (t/tr = 0, black solid line) and creep strain distributions corresponding to the stress distributions in Figure 9 are depicted in Figure 12. In both cases the plastic strain is about 0.2. The plastic reversal is negligible, so the plastic strain remains constant whereas the creep strain increases monotonically and exceeds the plastic strain for t/tr > 0.2 when the stage 2 deflection starts. Similar patterns between the low- and high-friction cases are observed for the strains. The differences in the stress components mentioned above are magnified for the creep strain components due to the power law feature of the creep model.
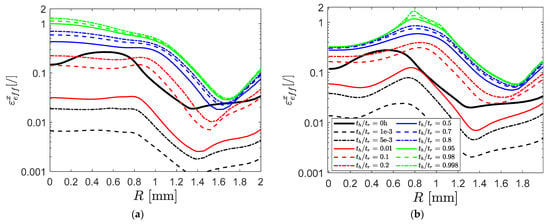
Figure 12.
Computed cumulative effective strain distributions vs. radial distance in the undeformed stage at different times, kinGen model. F = 400 N, T = 700 °C, (a) µ = 0, (b) µ = 0.6,, x = f creep, x = p plasticity.
4.4. Comparison with the Standard
The small punch standard is based on the applied force and the measured deflection and deflection rate [17]. A key challenge and source of error in using the SPC test to estimate uniaxial creep properties is the conversion of the applied force and deflection to an equivalent uniaxial stress, (MPa), and an even greater challenge is how to determine an equivalent strain rate, (1/h). There is not a straightforward equivalence between SPC and uniaxial test data. The effective creep strain is determined from , where are the principal strain components. In the uniaxial case, and prior to necking, there is only one stress component, which is equal to the von Mises stress, and since the creep deformation does not infer volume change it follows that , and the effective creep strain therefore equals the axial strain component, .
The equivalent stress in the standard is empirically based and optimized to give the same time to rupture as the uniaxial test at this stress level using 97 uniaxial and 159 SPC tests, mainly ferritic–martensitic steels, but also some 316L austenitic steel,
and where the force F is in Newton and the minimum deflection is in mm. Note that the uniaxial stress reported in test data is the nominal engineering stress whereas the FE analysis always refers to the true stress.
An equivalent stress from the finite element calculation is computed by integrating the von Mises true stress in the mid-section of the disc over a radial distance of 0.8 mm at the minimum deflection rate,
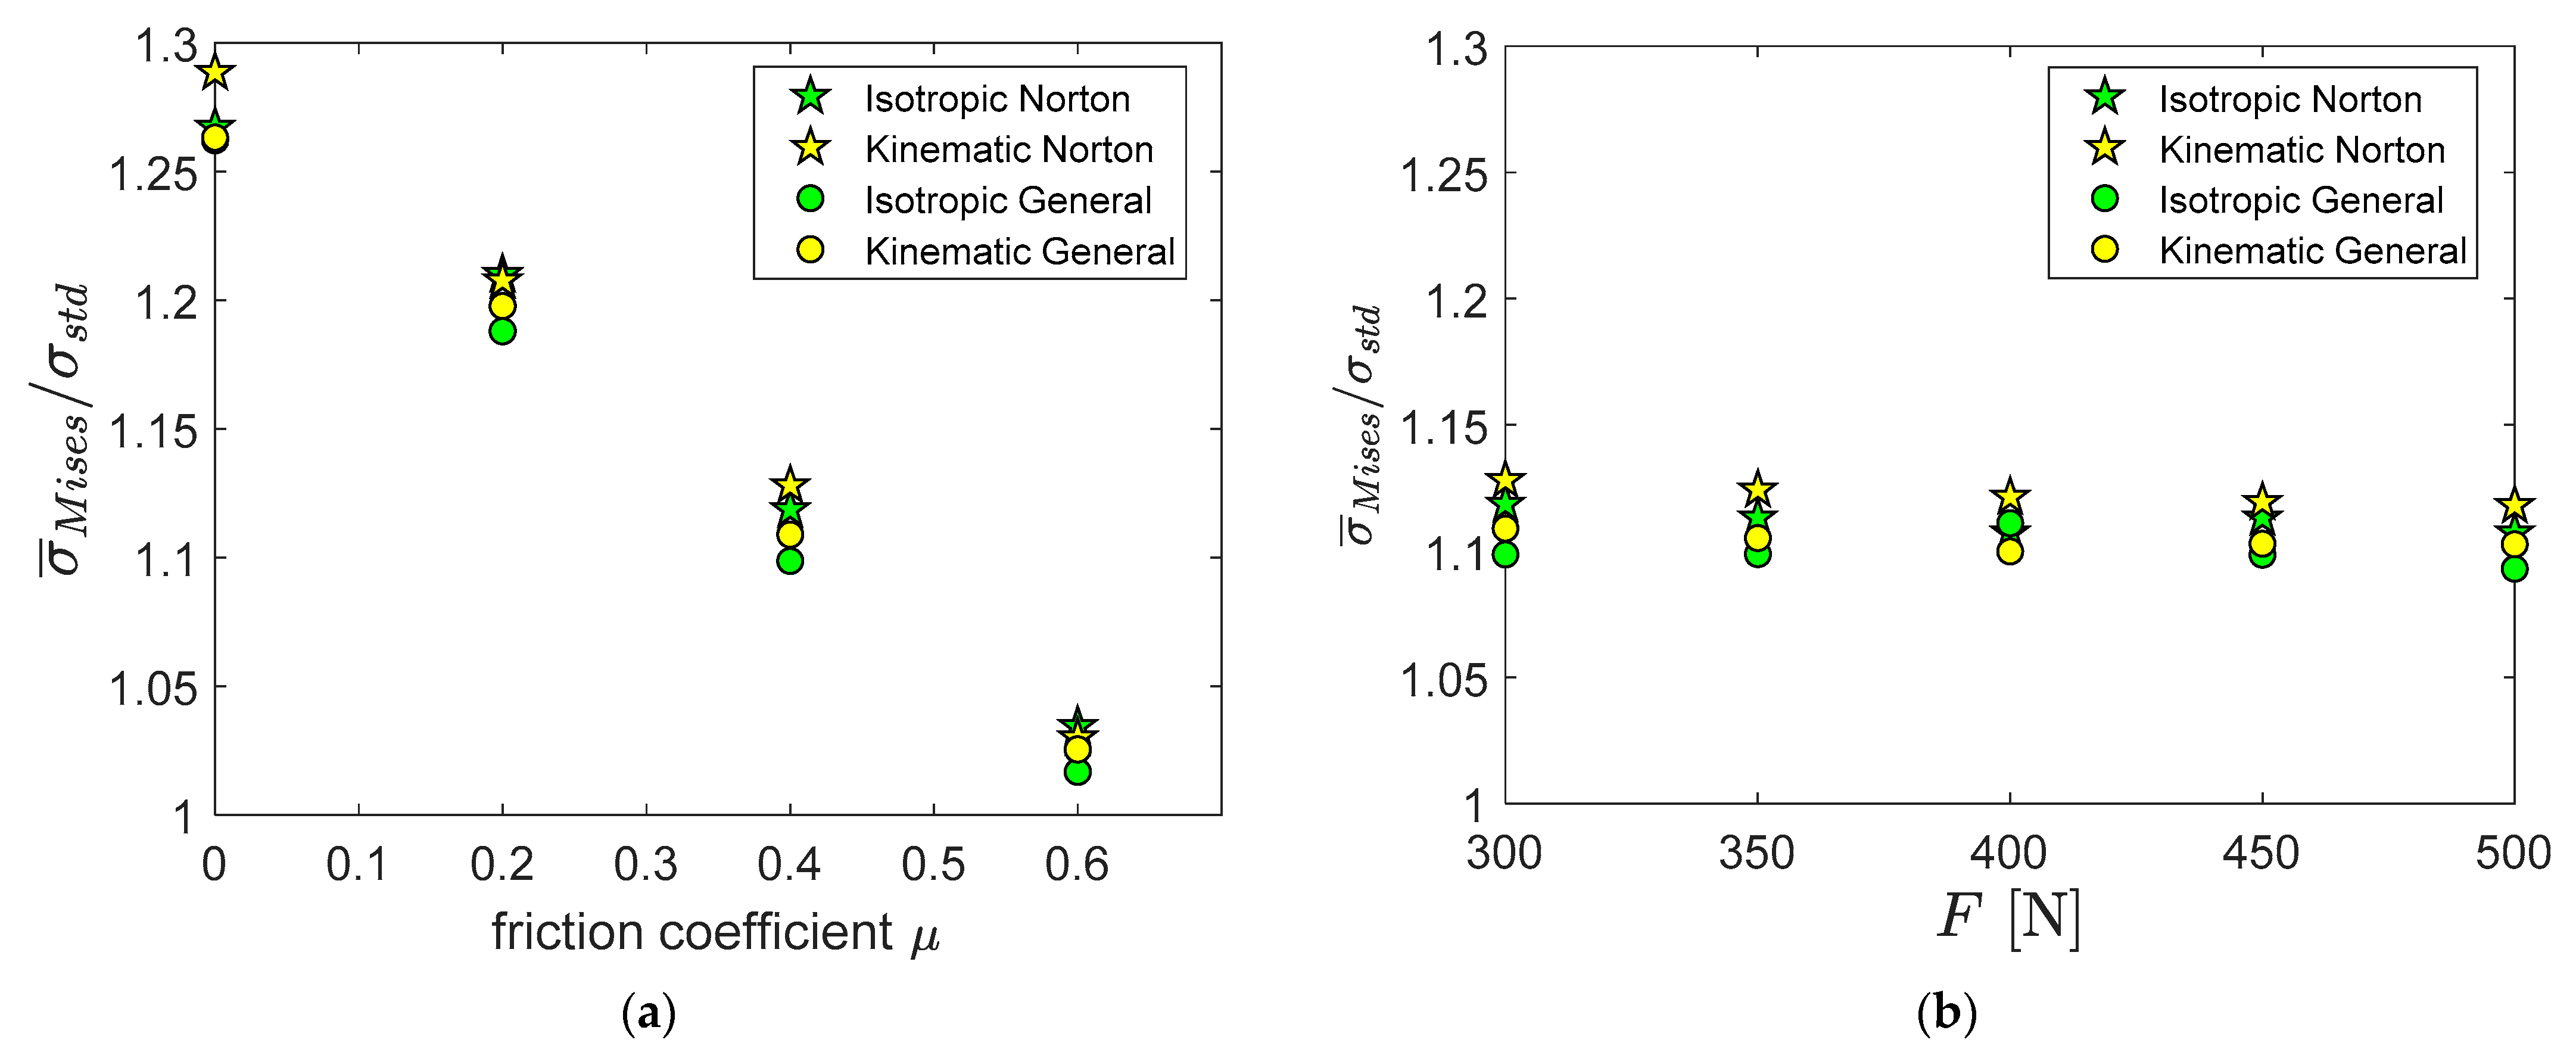
Figure 13 shows the ratio between computed stress, Equation (7), and the standard (Equation (6)) using the computed deflection at the minimum deflection rate, umin, at 700 °C for all four constitutive models. Figure 13a shows the stress ratio versus the friction coefficient when F = 500 N, and Figure 13b shows the ratio versus the load when µ = 0.4. The stress ratio decreases linearly from 1.25 to 1 when the friction increases from 0 to 0.6, but is independent of the applied load. It was inferred from Figure 12 that the effective accumulated creep strain is typically 0.3, which gives a factor of 1.3 for true/engineering stress (Equation (4)), which is larger than the factor of 1.1 for µ = 0.4. However, since the uniaxial and the multiaxial small punch case are not really comparable, it is not obvious what the expected ratio should be.
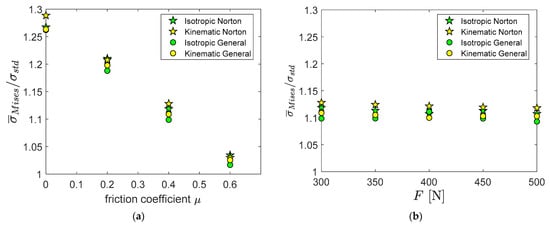
Figure 13.
Ratio between the computed mean von Mises true stress (0 < R < 0.8 mm) and the stress in the SP standard , (a) versus µ, F = 500 N; (b) versus F, µ = 0.4.
Figure 14 shows the computed time to rupture versus the standard stress, Equation (6), and the fully FEM-computed true stress value, Equation (7), versus the computed time to rupture for the kinNort and kinGen models, respectively. The symbols represent the computed cases. The solid lines are the regression analysis for µ = 0 and 0.6 for each constitutive model. The red circles are the experimental values in Table 3. First, we note that in all cases there is a linear relationship in the log-log diagram between stress and rupture time. As expected from the stress ratio in Figure 14, the stress corresponding to a specific rupture time is systematically higher for the fully FE-based stress than for the standard stress, but this difference decreases with increasing rupture time in accordance with Figure 13. More surprising is that the friction effect goes in the opposite direction for the two stress measures: the FE-based rupture using true stress has its highest value for the lowest friction coefficient (★,★), whereas it is the lowest standard rupture stress that is associated with the lowest friction values (★,★). For both stress values, the general creep models give higher rupture stress than the Norton model. The experimental data are in the intermediate rupture stress range.
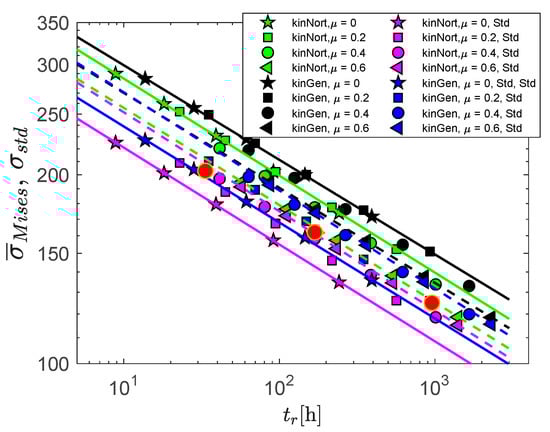
Figure 14.
Computed stress versus rupture life for kinematic plasticity with kinNort and kinGen constitutive models at µ = 0, 0.2, 0.4, 0.6. Computed mean true stress 0–1 mm and stress computed from the formula from the standard. Solid lines are regression analysis for each case µ= 0 and 0.6.
The standard also provides an equivalent minimum creep strain rate,
Comparing the standard’s strain rate with a corresponding finite element computed value is more complicated. In the stress case, the von Mises effective stress is higher than the radial or hoop stress using the Equation (7), but the difference is always below 2. For the creep rate, the difference between using the components or the equivalent strain rate is much larger. The FE-based strain rate is given by the Equation,
Here the subscript ij refers to a specific creep strain rate component or the effective value.
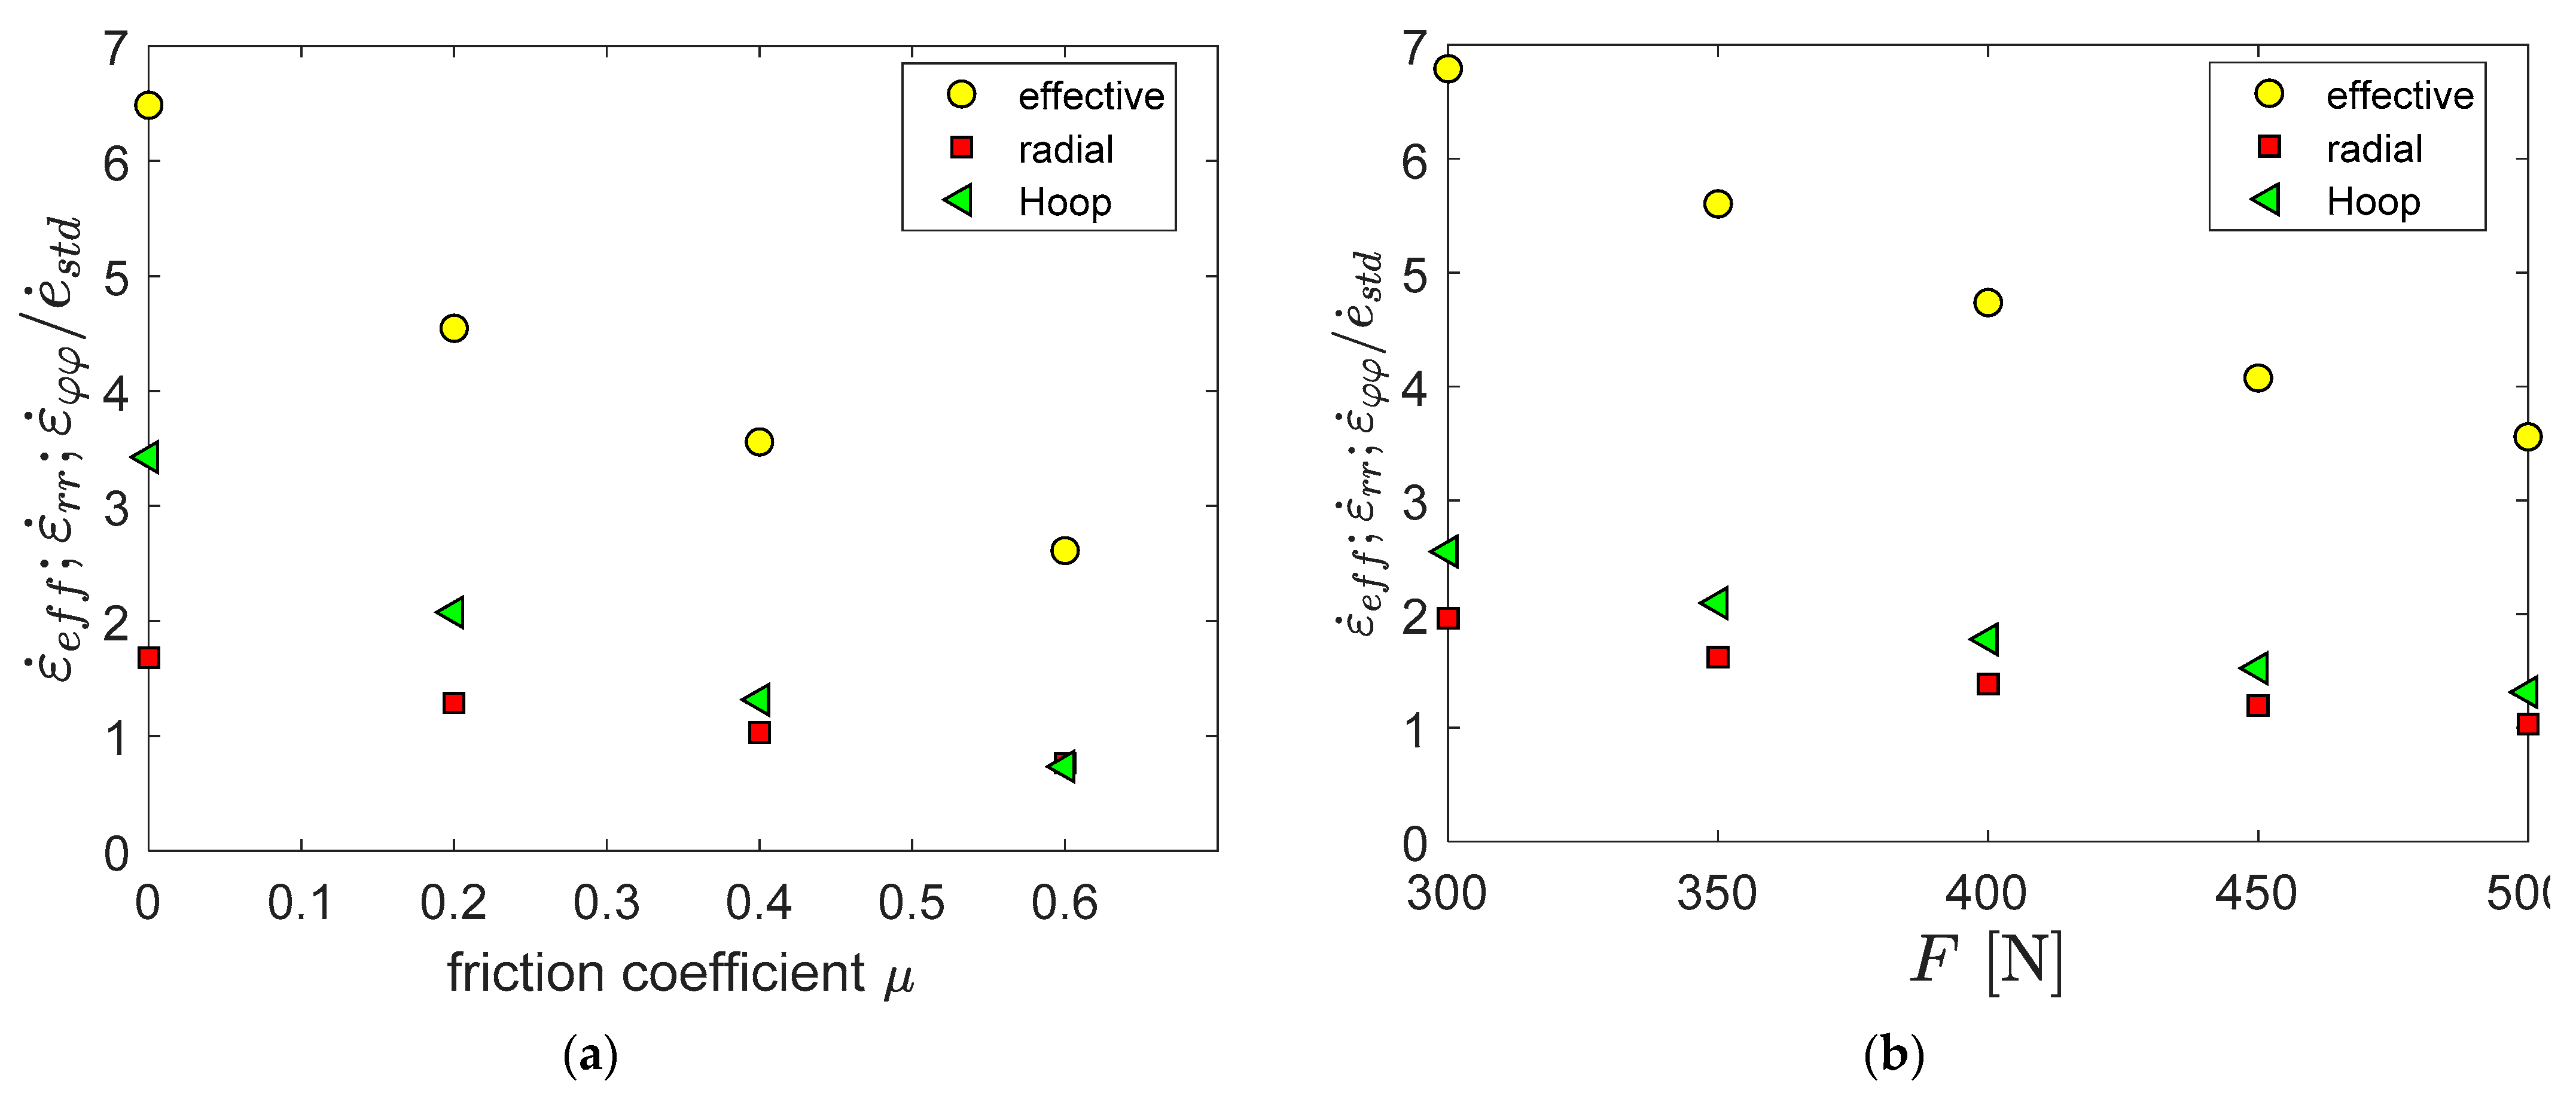
Figure 15a,b depicts strain rate ratios for effective, hoop and radial components. In all three cases; the strain ratio decreases linearly with the friction coefficient, but the ratio also decreases linearly with the load. Moreover, the strain rate ratio is much higher than for the stress ratio, and the strain rate ratio is more than three times higher for the effective creep strain rate compared to the radial component. The equivalence between the small punch and uniaxial creep rates is not obvious. For the uniaxial case there is no distinction between the axial and effective strain rate, whereas for the small punch the choice of strain (radial, hoop of effective) becomes important. In a test, only strain components can be directly measured. It should also be kept in mind that the data set used to determine the stress and strain rate in the standard is dominated by ferritic–martensitic steels which have a higher yield stress and a different slope in the Monkman–Grant relation than for the austenitic 316L(N) steel.
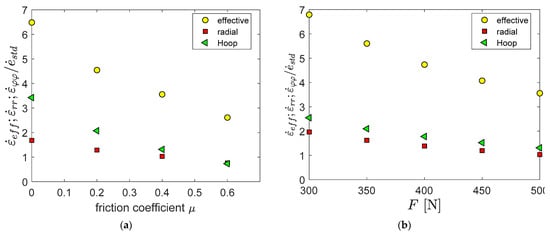
Figure 15.
Ratio between computed strain rate and strain rate in standard (a) versus µ, F = 500 N; (b) versus F, µ = 0.4.
5. Discussion
In this paper we have presented test data and a numerical analysis of the small creep punch (SPC) test for 316L(N) austenitic steel. The main objectives were:
- to assess to what extent the experimental observations can be predicted and explained by numerical simulation;
- to evaluate the importance of complexity for visco-plastic constitutive models with respect to prediction accuracy and computational effort;
- to investigate whether the RCC-MRx design data predict the SPC behaviour;
- to assess and quantify the effect of friction between the sample and the indenter for the test results;
- to compare computed results to the new small punch standard and practical aspects of the small punch creep test as an engineering tool.
Two very important features of the small punch creep tests are the large initial plastic deformation and the stress relaxation that drastically reduces the initially large stress variations and results in a quasi-membrane stress state. This results in the typically u-shaped curve for the normalized deflection rate versus time. We can refer to it as a “Master Curve”, as it is essentially unaffected by load, temperature, variation in material model and friction coefficient. Such master curve behaviour is also observed experimentally as shown in Figure 4.
It is important to have sufficiently accurate constitutive elastoplastic models to describe the deflection rate. The deflection rate master curves show the typical primary, secondary and tertiary creep behaviour seen in uniaxial tests. As mentioned above, the shape is essentially the same for a Norton model and a more complex constitutive creep model that accounts for primary and tertiary creep. Thus, the primary creep effect in the SPC test is mainly due to the initial stress relaxation and transition from bending to the membrane state. To predict deflection rates and time to rupture, it is important to have the correct mean creep rate and initial plastic deflection. The experimental master curve increased more drastically in the tertiary stage than did the simulations. It is likely that this is caused by creep damage which accelerates the creep rate in the final stage with final cracking at the edge of the contact zone between the sample and the indenter. The design creep data from the RCC-MRx do not provide any details between time to minimum creep rate and rupture time. In fact, the calibrated model had no creep softening for higher stress (B1–B4 zero or very small in Table 1). If the creep model had been calibrated against more complete creep curves with true material creep softening, then the creep model could have accommodated this. Since the SPC primary effect is caused by stress relaxation and homogenization rather than true material behaviour, SPC cannot be used to determine more complex material creep curves by reverse-model approaches. It can also be noted that we defined “creep rupture” as when the creep strain increases dramatically and the peak creep strain is 100%. An alternative but equally simplistic approach could have been to use a critical strain, but such an approach would not give more insight if damage and cracking is not accounted for and if separate strain components are not taken into account.
The time to rupture increases with the friction coefficient between the disc and the indenter. In the simulations, time to rupture increased typically by a factor of six when the friction coefficient increased from 0 to 0.6 (Figure 5). The friction coefficient is closely related to the preparation of both the sample and the indenter, and could be a major factor in scatter and also systematic differences between different laboratories. Fortunately, the simulations indicated an almost perfect linear relationship between rupture time and friction coefficient, as seen in Figure 5. This could potentially be used to rationalize differences in due to different friction coefficients. This would of course require that the friction coefficients are known, for instance from surface roughness. Provided specimens and indenters have been carefully prepared with very similar properties, and since deflection and time to rupture increase linearly with the friction coefficient, the friction coefficient could potentially be derived from computed and measured deflections or time to rupture. Using this approach for the limited data for 700 °C resulted in friction coefficients of 0.2 and 0.4 using the rupture time or deflection, respectively. We believe that 0.4 is a more correct value in our case since the lower value using the rupture time is due to creep softening not included in the processed design data.
The small punch test is primarily intended as a screening test. In Figure 8, it was shown that the computed time to rupture versus the minimum creep rate falls neatly along a narrow band for all friction values. Thus, if we use the small punch creep test as a screening test and are only interested in the deflection rate, we do not need to bother about the friction coefficient. Moreover, together with the master curve behaviour, it means that we can predict the time to rupture while reducing the test time by a factor of two. The minimum is, however, quite flat and extended, so it is not so obvious where to stop.
From the stress analysis, summarized by Figure 9, Figure 10 and Figure 11, we conclude that the stress distributions are not much affected by the constitutive model and the load, but that friction had a significant impact. In particular, increasing friction resulted in a more localized stress distribution and deformation, and the location with the peak stress (and strain) moved from the centre of the sample to a radial distance of about 0.8 mm. However, for a SPC test conducted until rupture, after the initial relaxation, the stress distribution is relatively evenly distributed and constant for a radial distance of 1 mm and more-or-less in a membrane state. This feature is very helpful when developing simpler models and when comparing with uniaxial tests.
The recent Standard for the creep of the small punch test is based on correlating experimental load deflections and equivalence with the uniaxial creep test. Since there are fundamental differences between the small punch and uniaxial creep tests, in particular the multiaxiality and the inherently large strains in the small punch test, transferability is not obvious. The simulation is clearly helpful to better understand the differences, but also to propose potential modifications to the standard. Figure 13 shows that the computed von Mises stress is higher than the stress in the standard but that the ratio decreases linearly with the friction coefficient. Irrespective of whether the standard or fully computed true stress is used, there is a linear relationship with the time to rupture on a loglog scale. If the SPC is used as a screening test, then it does not matter which stress measure is used. The stresses are not directly comparable, the computed stress is a true stress, whereas the stress in the standards is calibrated to be equivalent with the uniaxial engineering stress. Nevertheless, the linear stress ratio relationship indicates a path to adjust for differences in friction coefficient.
For the strain rate there is also a linear relationship for the ratio between the true computed and standard values. For the strain rate, it is much less clear whether the effective or a component value is more appropriate.
The multiaxial analyses can also allow that multiaxiality effects can be taken into account for the transferability and future improvements of SPC in engineering design. Finally, it is worth mentioning that the small punch test was initially proposed to determine tensile properties, but by virtue of the stress relaxation and the resulting homogenization of the stress and strain distributions in the sample, the small punch test seems to be better suited to predict creep than tensile properties.
6. Conclusions
The small punch creep (SPC) test has become very popular to assess creep rupture and a standard has been published recently. In the SPC test, the disc has generally large elastoplastic and creep deformation in combination with stress relaxation and contact between the indenter and the sample. In this paper, finite element analyses were performed and compared with experimental data with special emphasis on assessing the influence of friction and complexity of the creep model for 316L(N) austenitic steel. The following conclusions and observations can be drawn.
- The normalized computed deflection rate versus time agrees very well with experimental data and is independent of the applied load and temperature, as well as the creep model and friction coefficient. The deflection rate has a very distinct initial decrease followed by a shallow minimum value and sharp increase prior to rupture.
- The reason for this is that the stress relaxation that occurs at the beginning of the creep homogenizes the stress distribution across the sample, and at the very end, the deflection rate increases due to increased true stress.
- The time to rupture increases linearly with the friction coefficient. This could potentially be used as a method to estimate the friction coefficient. The friction coefficient is affected by sample preparation and differences in measured time to rupture may be related to different sample preparations.
- Increasing friction results in an increasing localization that also moves away from the centre of the sample, but more importantly, the mean stress is reduced which explains the increase in time to rupture and a very slight increase in deflection at the minimum deflection rate.
- The time to rupture versus deflection rate is independent of the friction coefficient. Thus, friction does not affect the capability for ranking time to rupture by the SPC test.
- The time to rupture in SPC can be accurately predicted by simulation, provided that a) initial tensile properties so that the initial elastoplastic deformation is captured; b) the friction coefficient is known; and c) the creep model captures the average creep rate and ideally also creep damage in the tertiary stage.
- The small punch test is potentially better suited to estimate creep properties than tensile properties by virtue of the stress relaxation and associated stress homogenization.
- The SPC standard, which is based on the equivalence between uniaxial and small punch creep is purely empirical. Given the very different nature of the uniaxial and small punch creep, the equivalence is not obvious. Better understanding through modelling and testing of both cases could be very helpful to better assess the equivalence (or lack thereof) and guide further development of the standard.
Author Contributions
Conceptualization, K.-F.N. and D.B.; formal analysis, K.-F.N., D.B. and I.S.; writing—original draft preparation, K.-F.N. and D.B.; review and editing, K.-F.N.; conceptualization data curation, S.H.; software, I.S. All authors have read and agreed to the published version of the manuscript.
Funding
This research received no external funding.
Data Availability Statement
The RCC-MRx data cannot be made publicly available because of confidentially issue.
Acknowledgments
This work was carried out within the multi-year program of the European Commission’s Joint Research Centre under the auspices of the PreMaCor institutional project as well carried out in the frame of EERA Joint Programme on Nuclear Materials and is partly funded by the European Commission HORIZON 2020 Framework Programme under grant agreement No. 755269.” The material tested has been provided by the EDF in France and the experimental and numerical work has been conducted as part of the European Creep Collaborative Committee (ECCC) Working Group IIIB austenitic steels.
Conflicts of Interest
The authors declare no conflict of interest.
References
- Dobeš, F.; Milička, K. Application of creep small punch testing in assessment of creep lifetime. Mater. Sci. Eng. A510-511 2009, 4, 440–443. [Google Scholar] [CrossRef]
- Dymáček, P. Recent developments in small punch testing: Applications at elevated temperatures. Theor. Appl. Fract. Mech. 2016, 86, 25–33. [Google Scholar] [CrossRef]
- Hyde, T.H.; Stoyanov, M.; Sun, W.; Hyde, C. On the interpretation of results from small punch creep tests. J. Strain Anal. Eng. Des. 2010, 45, 141–164. [Google Scholar] [CrossRef]
- Ganesh Kumar, J.; Laha, K. Small Punch Creep deformation and rupture behaviour of 316L(N) stainless steel. Mater. Sci. Eng. A 2015, 641, 315–322. [Google Scholar] [CrossRef]
- Kim, J.H.; Ro, U.; Lee, H.; Kang, S.J.; Lee, B.H.; Kim, M.K. A direct assessment of creep life based on small punch creep test. Theor. Appl. Fract. Mech. 2019, 104, 102346. [Google Scholar] [CrossRef]
- Lorenzo, M.; Cuesta, I.I.; Alegre, J.M. The relationship between the Uniaxial Creep Test and the Small Punch Creep Test of the AZ31 magnesium alloy. Mater. Sci. Eng. A 2014, 614, 319–325. [Google Scholar] [CrossRef]
- Milička, K.; Dobeš, F. Small punch testing of P91 steel. Int. J. Press. Vessel. Pip. 2006, 83, 625–634. [Google Scholar] [CrossRef]
- Saucedo-Muñoz, M.L.; Komazaki, S.-I.; Takahashi, T.; Hashida, T.; Shoji, T. Creep property measurement of service-exposed SUS 316 austenitic stainless steel by the small-punch creep-testing technique. J. Mater. Res. 2002, 17, 1945–1953. [Google Scholar] [CrossRef]
- Ule, B.; Šuštar, T.; Dobeš, F.; Milička, K.; Bicego, V.; Tettamanti, S.; Maile, K.; Schwarzkopf, C.; Whelan, M.; Kozlowski, R.; et al. Small punch test method assessment for the determination of the residual creep life of service exposed components: Outcomes from an interlaboratory exercise. Nucl. Eng. Des. 1999, 192, 1–11. [Google Scholar] [CrossRef]
- Evans, R.W.; Evans, M. Numerical modelling of small disc creep test. Mater. Sci. Technol. 2006, 22, 1155–1162. [Google Scholar] [CrossRef]
- Evans, M.; Wang, D. The small punch creep test: Some results from a numerical model. J. Mater. Sci. 2008, 43, 1825–1835. [Google Scholar] [CrossRef]
- Li, R.; Hyde, T.H.; Sun, W.; Dogan, B. Modelling and Data Interpretation of Small Punch Creep Testing. In Proceedings of the ASME 2011 Pressure Vessels and Piping Conference: American Society of Mechanical Engineer, Baltimore, MD, USA, 17–21 July 2011; Volume 6, pp. 1119–1127. [Google Scholar]
- Cortellino, F.; Rouse, J.P.; Cacciapuoti, ·B.; Sun, W.; Hyde, T.H. Experimental and Numerical Analysis of Initial Plasticity in P91 Steel Small Punch Creep Samples. Exp. Mech. 2017, 57, 1193–1212. [Google Scholar] [CrossRef] [PubMed] [Green Version]
- Zhao, L.; Song, K.; Xu, L.; Han, Y.; Jing, H.; Zhang, Y.; Li, H. Determination of creep properties of an advanced Fe-Cr-Ni alloy using small punch creep test with a modified creep strain model. Theor. Appl. Fract. Mech. 2019, 104, 102324. [Google Scholar] [CrossRef]
- Song, K.; Zhao, L.; Xu, L.; Han, Y.; Jing, H. Experimental and numerical analysis of creep and damage behavior of P92 steel by small punch tests. Theor. Appl. Fract. Mech. 2019, 100, 181–190. [Google Scholar] [CrossRef]
- CEN CWA 15627 Workshop Agreement: Small Punch Test Method for Metallic Materials (Part A A Code of Practice for Small Punch Creep Testing); European Committee for Standardization: Brussels, Belgium, 2006.
- DIN EN 10371:2021; Metallic Materials. Small Punch Test Method; English Version; German Institute for Standardization: Berlin, Germany, 2021.
- Holmström, S.; Li, Y.; Dymacek, P.; Vacchieri, E.; Jeffs, S.; Lancaster, R.; Omacht, D.; Kuboň, Z.; Anelli, E.; Rantala, J.; et al. Creep strength and minimum strain rate estimation from Small Punch Creep tests. Mater. Sci. Eng. A 2018, 731, 161–172. [Google Scholar] [CrossRef]
- Yang, Z.; Wang, Z.-W. Relationship between strain and central deflection in small punch creep specimens. Int. J. Press. Vessel. Pip. 2003, 80, 397–404. [Google Scholar] [CrossRef]
- Dymáček, P.; Milička, K. Creep small-punch testing and its numerical simulations. Mater. Sci. Eng. A 2009, 510–511, 444–449. [Google Scholar] [CrossRef]
- Wu, W.; Xiaozhe, J.; Hao, L.; Wie, S. Determination of creep damage properties from small punch creep tests considering pre-straining effect using an inverse approach. Mech. Mater. 2019, 139, 103171. [Google Scholar]
- Yang, S.; Zheng, Y.; Ling, X. Evaluation of multiaxial creep and damage evolution for small punch creep test considering critical-strain criterion. Eng. Fail. Anal. 2018, 91, 99–107. [Google Scholar] [CrossRef]
- Ling, X.; Zheng, Y.; You, Y.; Chen, Y. Creep damage in small punch creep specimens of Type 304 stainless steel. Int. J. Press. Vessel. Pip. 2007, 84, 304–309. [Google Scholar] [CrossRef]
- Arunkumar, S. Small Punch Creep Test: An Overview. Met. Mater. Int. 2020, 1–18. [Google Scholar] [CrossRef]
- Cortellino, F.; Sun, W.; Hyde, T. On the effects of friction modelling on small punch creep test responses: A numerical in-vestigation. J. Strain Analysis 2016, 51, 493–506. [Google Scholar] [CrossRef]
- Nakata, T.; Komazaki, S.I.; Kohno, Y.; Tanigawa, H. Development of a small punch testing method to evaluate the creep Property of high Cr ferritic steel:PartII—Stress analysis of small punch Test specimen by finite element method. Mater. Sci. Eng. A 2016, 666, 80–87. [Google Scholar] [CrossRef]
- Deliktaş, B.; Sönmez, M.; Türker, H.T. Characterization of Creep Behavior of high Temperature P91 steel using Uniaxial Creep and Small Punch Tests. In Proceedings of the 2016 World Congress on Advances in Civil, Environmental and Materials Research (ACEM16), Jeju, Korea, 28 August–1 September 2016; Available online: http://www.i-asem.org/publication_conf/acem16/6.ICAM16/T2F.1.MR360_1217F1.pdf, (accessed on 20 May 2021).
- Abendroth, M. Identification of creep properties for P91 steels at high temperatures using the small punch test. In Proceedings of the First International Conference SSTT, Ostrava, Czech Republic, 31 August–2 September 2010. [Google Scholar]
- Wang, L.-Y.; Song, Z.-M.; Luo, H.M.; Zhang, G.-P. 3D X-ray tomography characterization of creep cavities in small-punchtested 316 stainless steels. Mater. Sci. Eng. A 2018, 724, 69–74. [Google Scholar] [CrossRef]
- Ganesh Kumar, J.; Laha, K.; Ganesan, V.; Reddy, G.V.P. Analyses of Small Punch Creep Deformation Behavior of 316LN Stainless Steel Having Different Nitrogen Contents. J. Mater. Eng. Perform. 2018, 27, 2545–2555. [Google Scholar] [CrossRef]
- RCC-MRx; Design and Construction Rules for Mechanical Components of Nuclear Installations: High Temperature, Research and Fusion Reactors; Afcen RCC-MRx Code 2018 Edition; Afcen: Courbevoie, France, 2018.
- Baraldi, D.; Holmström, S.; Nilsson, K.-F.; Bruchhausen, M.; Simonovski, I. 316L(N) Creep Modeling with Phenomenological Approach and Artificial Intelligence Based Methods. Metals 2021, 11, 698. [Google Scholar] [CrossRef]
- Abaqus Software. Available online: https://www.3ds.com/products-services/simulia/products/abaqus/ (accessed on 10 January 2019).
- Zmat Material Model Library Software. Available online: http://www.zset-software.com/products/z-mat/ (accessed on 10 January 2019).
- Rouse, J.P.; Cortellino, F.; Sun, W.; Hyde, T.H.; Shingledecker, J. Small punch creep testing: Review on modelling and data interpretation. Mater. Sci. Technol. 2013, 29, 1328–1345. [Google Scholar] [CrossRef]

Publisher’s Note: MDPI stays neutral with regard to jurisdictional claims in published maps and institutional affiliations. |
© 2021 by the authors. Licensee MDPI, Basel, Switzerland. This article is an open access article distributed under the terms and conditions of the Creative Commons Attribution (CC BY) license (https://creativecommons.org/licenses/by/4.0/).