
Effect of Post-Weld Heat Treatment on the Fatigue Behavior of Medium-Strength Carbon Steel Weldments


Korea Railroad Research Institute, Uiwang-si 16105, Korea
Metals 2021, 11(11), 1700; https://doi.org/10.3390/met11111700
Submission received: 29 September 2021
/
Revised: 18 October 2021
/
Accepted: 20 October 2021
/
Published: 25 October 2021
(This article belongs to the Special Issue Welding and Fatigue of Railway Metallic Materials)
Abstract
:Railway vehicle makers manufacture the bogie frame by welding medium-strength carbon steel sheets. It has been a long-standing practice to perform post-weld heat treatment (PWHT) to remove welding-residual stress, but rail car manufacturers are moving toward producing bogie frames without PWHT. Since securing the fatigue strength of the bogie frame is essential for vehicle operation safety, it is necessary to systematically evaluate the effects of PWHT on hardness, microstructure, mechanical properties, corrosion, fatigue strength, etc. In this study, small-scale welding specimens and full-size components were produced using S355JR used in general structures, automobiles, shipbuilding, railroad vehicles, etc. The effect of PWHT on material properties-the hardness of the base material, heat-affected zone and weld metal, microstructure, shock absorption energy, yield strength, tensile strength, and fatigue were investigated. When the weld specimen was annealed at 590 °C and 800 °C for 1 h, the yield strength and tensile strength of the specimen decreased, but the elongation increased. For specimens not heat-treated, the parent material’s yield strength, the yield strength in HAZ, and the yield strength of the weld metal were 350 MPa, 345 MPa, and 340 MPa. For specimens heat-treated at 590 °C, they were 350 MPa, 345 MPa, and 340 MPa. For specimens heat-treated at 800 °C, they were 350 MPa, 345 MPa, and 340 MPa. Annealing heat treatment of the specimen at 800 °C homogenized the structure of the weldments similar to that of the base material and slightly improved the shock absorption energy. For specimens not heat-treated, the Charpy impact absorption energies at 20 °C of the parent material and weld metal were 291.5 J and 187 J. For specimens heat-treated at 590 °C, they were 276 J and 166 J. For specimens heat-treated at 800 °C, the Charpy impact absorption energy at 20 °C of the parent material was 299 J. PWHT at 590 °C had the effect of slightly improving the fatigue limit of the specimen but lowered the fatigue limit by 10.8% for the component specimen.
1. Introduction
Welding is a convenient and economical technology for joining steel, alloy, and non -ferrous metals, and is used in various fields such as automobiles, railways, aviation, bridges, pressure vessels, construction, etc. [1]. Welding has the advantages of simple equipment and work process, easy automation, high bonding efficiency, and few restrictions on the thickness of the welded object. On the other hand, welding also has shortcomings such as thermal deformation, residual stress, microstructural change, material embrittlement, welding defects, and bad working conditions [1]. Among them, the welding-residual stress is closely related to the fatigue behavior of the welded structure and has been studied for a long time. The magnitude of the welding-residual stress depends on several parameters such as the welding method, welding procedure, welding parameters, and constraint conditions of the welded objects. It can reach a magnitude similar to the yield stress of the base material [2,3,4,5]. If there is no constraint and external force in the structure, the residual stress is always at self-equilibrium. The sum of each stress component is zero. When an external force acts on an object in which residual stress exists, the stress caused by the external force overlaps on the residual stress, so the residual stress has the effect of increasing or reducing the stress caused by the external force. Even if the magnitude of the stress caused by the external load at a point in the structure is smaller than the yield stress when the sum of the stress caused by the external load and the residual stress is greater than the yield stress, yielding occurs. As a result, the state of the residual stress will change after the applied load is removed. It has been found that the residual stress is relieved to some extent when a cyclic load is applied. In some cases, the tensile residual stress changed to the compressive residual stress [2,4]. Therefore, the residual stress can influence crack initiation in the structure. When cracks develop and propagate, the residual stress changes depending on the size and direction of the cracks. So the residual stress may have a significant effect on the crack life [6,7,8,9,10,11]. According to the simulation results of Wang et al. [6], the residual stress significantly influenced the fatigue life of a T-joint when the stress ratio was less than 0.5. But the residual stress effect was negligible when the stress ratio was more than 0.5. Liljedahl et al. [7] showed that the residual stresses in 2024-T351 aluminum alloy accelerated the fatigue crack growth rate in the middle tension specimen. But they retarded the growth rate in the compact tension sample. Kang and Luo [8] reviewed existing fatigue life prediction models considering residual stresses and ratcheting. Wang et al. [9] applied Lemaitre’s plastic damage model considering weld-induced residual stresses and weld-induced plastic damage. The effect of residual stress on the fatigue life of butt-weld joints was significant. Baumgartner and Bruder [10] found that at higher load amplitudes due to plastic yielding in the sharp notches at the weld toe, welding residual stresses relaxed much, so residual stress effect on the fatigue life was not significant. McClung [11] surveyed extensive literature and provided experimental data on the redistribution and relaxation of welding residual stresses during fatigue tests. Therefore, to accurately predict the fatigue life of structures, it is necessary to know the state of stress caused by external load and residual stresses to predict the fatigue life of structures. However, in general, it is not easy to accurately measure or predict residual stress at all points of a material. Therefore, methods to reduce or remove the residual stress in the structure are applied. In welded structures, irregularities occur in the toe area where the weld metal and the base material meet, acting as a notch, causing stress concentration and structurally weak points. In most cases on the weld tow surface, tensile residual stress occurs and hardness and microstructures change. There are methods of applying vibration to the structure [12,13,14], methods of mechanical loading [3,15,16], and PWHT [5,17,18,19,20,21] to reduce the residual stress. Tomków and Janeczek [22] conducted an in-situ local heat treatment in underwater conditions. Additional welding stitches tempered the brittle structures in HAZ and gave a similar effect to PWHT. A more active way is to extend the fatigue life by striking the toe, the weak part of the welded structure, with a metal pin using a 20–30 kHz ultrasonic exciter (impact pin peening) to generate compressive residual stress from the toe surface to a certain depth. The method seems to be effective. Trufyakov et al. [23] showed that the ultrasonic impact peening improved fatigue life by four to five times for low-carbon steel welded specimens with a yield strength of about 200 MPa. Galtier and Stanikov [24,25] compared the fatigue life of samples treated with sand-blast, low transformation temperature welding, and ultrasonic peening on high-tensile steel welded specimens and showed that ultrasonic peening was the most effective in improving fatigue life.
To manufacture the bogie frame of a rail car (Figure 1), cut and formed steel plates are welded to produce side beams, and transoms made from steel plates or commercial pipes are joined with the side beams by welding. To the side beam and transom, various brackets required to install devices of railway vehicles: motor, reduction gear, brake, etc. are joined by welding. Therefore, welding is the core of the bogie frame manufacturing process, and it determines the quality of the bogie frame. After the bogie frame is manufactured with gas metal arc welding (MGAW), it is a long-standing practice to perform post-weld heat treatment (PWHT, or annealing) at about 600 °C to remove the residual welding stress. PWHT is specified in international standards for railroads [26,27]. Recently, based on the accumulated research results on the fatigue characteristics of welded parts, there is a trend toward manufacturing the bogie frame without PWHT [28]. Although many studies have been conducted to find out the effect of PWHT on the microstructure, hardness, etc. of the weldment of carbon steels, there are few studies on the effect of PWHT on the fatigue strength of the weldment. That is due to the fact that fatigue tests take a lot of time and cost. In general, it has been thought that when tensile residual stress occurs in the toe of a welded structure, the fatigue strength decreases. According to the results of fatigue tests on specimens from which residual stress was removed using PWHT, PWHT did not improve the fatigue strength of weldments. Leitner et al. [17] made a cross-shaped specimen with mild steel S355 (yield strength 355 MPa, tensile strength 470 MPa) and conducted a tensile fatigue test. After welding, annealing heat treatment was performed at 550 °C for 30 min. The test results showed that the fatigue life of the annealed specimens was shorter than that of the as-welded specimens. The authors argued that this was a result of the fact that the welding compressive residual stress was relieved by annealing. We also investigated the PWHT effect of the mechanical properties and fatigue behavior using butt-weld specimens and T-shape fillet weld specimens made from similar carbon steel [18]. For T-type specimens, PWHT increased the fatigue strength. But it was difficult to quantify the effect of PWHT on the fatigue strength in the case of the base specimen and the butt-welded specimen due to the lack of experimental data. Udo and Numakura [19] performed a fatigue test after arc-welding a V-groove of stainless steel (UNS S32750) and solution treatment at 1050 °C for 60 min. PWHT shortened the fatigue life. The cause was the S-phase that occurred during the heat treatment cooling period after welding. Zhang et al. [20] investigated the effect of PWHT on the crack propagation of high-tensile steel (tensile strength 790 MPa, yield strength 690 MPa) weldments. Arc welding was used, and annealing was carried out at 930 °C for one hour. According to their test results, the fatigue life of specimens heat-treated was 9.1% shorter than that of specimens not heat-treated. Jiang et al. [29] investigated the effect of PWHT on the strength of box columns made from high-strength steel plates. According to their test results under the compressive load, PWHT increased the vertical direction strength by 3~7% compared to as-welded columns. They explained that it was due to the fact that tensile residual stresses were relieved due to PWHT. PWHT is a necessary process in welded pipes and vessels used at high temperatures and pressures. P91 is one of the creep-resistant steel for pipes and vessels in the power generation industry. Lojen and Vuherer [30] found out that the high PWHT temperature could shorten the holding time. At 800 °C, 0.5 h was sufficient in terms of hardness and impact toughness. Silva et al. [31] also searched optimal PWHT conditions for P91 pipe welding concerning mechanical strengths, hardness, and microstructures. They applied five different heat treatment cycles. Pandey et al. [32,33] showed that creep rupture life, crack initiation, and propagation characteristics of P91 weld joints depended very much on PWHT conditions. A review paper on heat treatment by Kalyankar and Chudassama [21], a review paper by Vöhringer [34] on the relaxation of residual stress by heat treatment and mechanical loading, and a review paper on the effect of residual stress on fatigue by McClung [11] are of great help to the overall understanding of the effect of PWHT and residual stress.
In this study, the research material was medium-strength carbon steel (KS D 3515, SM355A) used in railway vehicles, automobiles, shipbuilding, etc. [4]. PWHT can influence microstructure, hardness, mechanical properties, fatigue life, etc. If PWHT softened the material, its mechanical strength would be lowered, which would decrease the fatigue strength. On the other hand, relaxation of the tensile residual stress in the structure can improve fatigue strength. Therefore, to accurately evaluate the PWHT effect on fatigue life, it is necessary to pinpoint these two effects separately. A literature review reveals that researchers have conducted little research in this area. In this study, the PWHT effects on material properties: hardness, microstructure, impact strength, and mechanical strength, were studied. In addition, fatigue tests of welded specimens were carried out, and the PWHT effect on the fatigue of welded specimens was analyzed in detail.
2. Materials and Methods
2.1. Effect of PWHT on Mechanical Properties
The SM355A (KS D 3515) welded structural steel used in the test is similar to S355JR (EN 10025-2) steel. It is used a lot for the bogie frame and body structure of railway vehicles [4]. The chemical components specified in the standard are C (<0.20 wt.%), Si (<0.55%), Mn (<1.6%), P (<0.035%), S (<0.035%). Its minimum yield strength, tensile strength, and elongation rate are 355 MPa, 490 MPa, and 17%. Welding conditions used in the railway industry were applied to fabricate the welding specimen, as in Figure 1. Two 10 mm thick steel plates were welded by GMAW (Gas Metal Arc Welding) under the conditions- welding current: 300 A, voltage: 30 V, movement speed: 25 cm/min, shield gas: Ar 85% + CO2 15%, annealing temperature: 590 ± 20 °C and 800 ± 20 °C, holding time: 1 h; heating and cooling rate: 120 °C/h. welding wire: AWS ER 70S-6 Φ1.2 was used, whose chemical compositions are C (0.06–0.15 Wt.%), Ni (0.15% max.), Mn (1.40–1.85%), Cr (0.15% max.), Si (0.80–1.15%), P(0.25% max.), and V (0.03% max). Specimens were produced by cutting with a wire saw so that the rolling direction of the steel plate coincided with the longitudinal direction of the specimen. Figure 2b shows the shape of a tensile specimen with a thickness of 5 mm, and Figure 2c shows the shape of the V-notch Charpy impact specimen. The longitudinal direction of the Charpy impact specimen was the same as the welding line. Vickers hardness was measured at 0.5 mm intervals under a load of 1.961 N. The tensile test was performed with a gauge length of 50 mm and a speed of 2 mm/min. The Charpy impact specimen test was performed according to ASTM A370. In both tests, three specimens were tested under the same conditions. The microstructure was observed at 500 magnification using an optical microscope.
2.2. Effect of PWHT on Fatigue Behavior
The material used in this section was the SM355A steel plate used in Section 2.1, but the production batch was different.
2.2.1. Hardness Measurement
For butt welded specimens, the hardness of the specimen without PWHT (AAN) and with PWHT (AAY) was measured and compared. The longitudinal direction of the specimen coincided with the rolling direction of the steel sheet, and the weld line was perpendicular to the rolling direction. Welding conditions were as follows: current 300 A; voltage 30 V; movement speed 30 cm/min; shield gas Ar 85% + CO2 15%; welding wire AWS ER 70S-6, Φ1.2. PWHT conditions were holding temperature: 590 ± 20 °C; holding time: 3 h; heating and cooling rate at 120 °C/h. The Vickers hardness was measured at 0.5 mm intervals in the length direction, and at +1 mm, −1 mm, −3 mm, −5 mm, and −7 mm, −9 mm in depth direction using the AVK-C1 model of AKASHI of Japan with a load of 5 kg (Figure 3c). A welded joint is composed of a base material, a heat-affected zone, and a weld metal, and each part is different in microstructure and hardness, so the welded joint is weaker than the base material. In addition, heat treatment after welding may cause local defects by changing the size of grains or creating inclusions. Changes in microstructure due to welding and heat treatment methods were analyzed using an optical microscope.
2.2.2. Specimen Tensile Test
Figure 4 shows the shape of the tensile specimen. The longitudinal direction of the specimen coincided with the rolling direction of the steel sheet, and the weld line was perpendicular to the rolling direction. The values of welding parameters and heat treatment conditions were the same as the hardness specimen in Figure 3. A tensile test was performed to obtain the basic properties of the material, such as yield strength, tensile strength, and modulus of elasticity. The tensile test was performed following ASTM E8 in an Instron 25-ton hydraulic universal testing machine (model 8802) at a test speed of 1 mm/min.
2.2.3. Specimen Fatigue Test
The tensile fatigue test was carried out according to ASTM E 466 at 20 Hz, a stress ratio of 0.1 using Instron model 8802 (25 ton). Figure 5 shows the butt fatigue specimen with a thickness of 10 mm. The longitudinal direction of the specimen coincided with the rolling direction of the steel sheet, and the weld line was perpendicular to the rolling direction. The same welding conditions as those applied to the tensile specimen were applied.
2.3. Fatigue Test of Members
A three-point bending fatigue test was performed using three types of beams of a size similar to the side frame of an actual railroad car bogie. The first type of beam was a box-shaped beam without reinforcement. The second was a beam with a gusset welded perpendicular to the center of the lower surface. The third was a beam with a gusset welded parallel to the bottom surface. The box-shaped beams were welded using a GMAW semi-auto robot. Welding conditions were shield gas: Ar 85% + CO2 15%; welding wire: AWS ER 70S-6 Φ1.2; weld current 280 A; voltage 29 V; moving speed 30 cm/min. A skilled welder welded the vertical and horizontal gussets. PWHT conditions were as follows: temperature: 590 ± 20 °C; holding time: 3 h; heating and cooling rate: 120 °C/h. The fatigue test was performed using Instron’s Model 8503 with a capacity of 50 tons. A constant amplitude load with a stress ratio R = 0.1 was applied. A line force was applied to the center of the upper surface of the beam. The failure occurred on the lower surface of the beam, where the maximum tensile stress was estimated. The failure life was defined as the time when cracks first developed on the bottom surface of the specimen and advanced by 20 mm. Figure 6 shows the cross-sectional shape and fatigue test setup of a 1500 mm long box-type beam.
3. Results and Discussion
3.1. Effect of PWHT on the Mechanical Properties
3.1.1. Tensile Test
Figure 7 shows the fractured specimens after the tensile tests for the base metal, HAZ, and weld metal. There were three similar specimens in every nine groups: parent as welded, parent PWHT at 590 °C, parent PWHT at 800 °C, HAZ as-welded, HAZ PWHT at 590 °C, HAZ PWHT at 800 °C, weld metal as-welded, weld metal PWHT at 590 °C, weld metal PWHT at 800 °C. In the case of the base material, first, shear deformation occurred in the 45-degree direction from the surface of the specimen, and then the cross-sectional area decreased to some extent. Finally, the specimen was separated perpendicular to the tensile load. In the case of weld metal, shear deformation occurred locally on the surface, or cracks were first generated and developed in the weak part inside, and the fracture surface showed a torn shape. The fracture surface of the HAZ specimen was similar to that of the parent material, but irregularities of the fracture surface were more severe than that of the parent material. Table 1, Table 2 and Table 3 show measured tensile properties. Figure 8a is the stress-strain curve of the base specimen. The yield strength and tensile strength of the specimen that was not heat-treated were the largest, and the specimen heat-treated at 800 °C for 1 h had the lowest strength. The elongation was the highest in the case of the specimen heat-treated at 800 °C. In general, the upper and lower yield strengths observed in low carbon steel appeared, and a Lüders band having almost constant stress was observed past the upper yield strength. It is well known that the upper yield point is due to the fact that the C or N atom at the Fe atom site interferes with the displacement of the dislocation [35]. The strain in the Lüders band section was 0.18 to 2.17% for not heat-heated specimens, 0.18 to 2.28% for 590 °C heat-treated specimens, and 0.18 to 2.24% for 800 °C annealed specimens. Figure 8b is the tensile curve of the HAZ specimen. The yield strength and tensile strength of the not annealed specimens were the largest. The strength of the specimen annealed at 800 °C was the lowest, and the elongation was smaller than the base material. Figure 8c is the tensile curve of the weld metal. The decrease in strength and increase in elongation due to heat treatment is evident. It showed the characteristic of sudden fracture after the stress reached the maximum. The tensile stress of the not heat-treated specimens and the specimens heat-treated at 590 °C continued to increase after the yield point. When heat-treated at 800 °C, deformation characteristics near the yield point were similar to those of the base material. Figure 9 compares the tensile curves of the base metal, HAZ, and weld metal under various conditions. In the absence of PWHT, the tensile curves of the base metal and the HAZ specimen were different in elongation, but the tensile strength and yield strength were almost the same. When heat-treated at 590 and 800 °C, the yield stress of HAZ was lower than that of the base material. That was due to the fact that restrained dislocations by inclusions between particles moved at high temperatures to soften the material. This phenomenon was more pronounced in HAZ and weld metal, where the grain size was smaller than that of the base metal, and there were many interfaces between grains. In the case of heat treatment at 800 °C, it was inferred from the tensile curve that the structure of the base metal, HAZ, and weld metal was almost homogenized. Figure 10 shows yield strengths, tensile strengths, and elongations under various conditions. The yield strength and tensile strength of the welded specimen without heat treatment were the greatest. The base metal, HAZ, and weld metal heat-treated at 800 °C had almost the same value. In the case of elongation, HAZ and welded specimens without heat treatment had the smallest value. In the case of elongation, HAZ and welded specimens without heat treatment had the smallest value. When heat-treated at 800 °C, their elongations were close to the level of the base material.
3.1.2. Microstructure and Hardness
Figure 11 is the Vickers hardness distribution of the base metal, HAZ, and weld metal measured on the surface of the weld specimen. Maximal Vickers hardness values were summarized in Table 4. Hardness values of the weld metal and HAZ were higher than the base metal. When the specimens were not heat-treated, or when specimens were heat-treated at 590 °C, hardness values of the weld metal and HAZ were 40–60 Hv higher than the base metal. When PWHT was carried out at 800 °C, the base metal, HAZ, and weld metal had almost the same hardness value, and the microstructures were more homogenized. At the boundary between HAZ and the weld metal, there was a point with higher hardness. That seems to be due to cementite inclusions existing at the grain boundary. The hardness distribution is consistent with the effect of heat treatment on tensile strength, yield strength, and elongation observed in the tensile curve. Figure 12, Figure 13 and Figure 14 are optical micrographs of the base metal, HAZ, and weld metal. The base material had a commonly observed carbon steel microstructure composed of the perlite (black) and the ferrite (gray) matrix. Almost all of the as-welded base material was ferrite. Some elongated pearlite grains were distributed at ferrite grain boundaries. The HAZ and weld metal that received welding heat were composed of bainite, ferrite, and pearlite. In the base material of the specimen heat-treated at 590 °C, the pearlite particles were larger and more numerous than those of the as-welded specimen. Although the HAZ structure was different from the as-welded, there was no significant difference in the microstructure of the weld metal. In the base material of the specimen heat-treated at 800 °C, pearlite was spheroidized. The microstructures of HAZ and weld metal were similar to those of the base material. Their microstructures became more homogenized. This characteristic explains that the hardness distribution of the specimen heat-treated at 800 °C was almost constant, and the elongation increased. The microstructure heat-treated at 800 °C was significantly different from the as-welded and heat-treated structures at 590 °C.
3.1.3. Charpy Impact Characteristics
Figure 15 shows the results of the Charpy impact test results of various specimens. In the case of the base material, the shock absorption energy value of the specimens heat-treated at 800 °C was higher than those of the specimens not heat-treated and heat-treated at 500 °C at temperatures below 20 °C. In the case of the base material, the shock absorption energy of the heat-treated specimen at 500 °C was slightly smaller than that of the base material not heat-treated at temperatures above −20 °C. In terms of shock absorption energy, heat treatment at 800 °C can improve the impact resistance of the bogie frame used in extreme climatic conditions. Another interesting result was that the shock absorption energy was maximum at 20 °C regardless of the presence or absence of heat treatment. In the case of weld metal, due to micro-defects existing inside the specimens, a fracture sometimes started not in the notch of the test pieces. So sufficient data on shock absorption energy could not be obtained. The shock absorption energy of the weld metal showed a smaller value than that of the base metal in all temperature ranges.
3.2. Fatigue Characteristics of Specimens
3.2.1. Microstructure and Hardness
Figure 16 is a microstructure photograph taken with an optical microscope [4]. It is a typical carbon steel structure composed of ferrite and pearlite. The perlite was elongated, and the perlite had a higher fraction in HAZ than in Figure 12. The microstructure was quite different from the results in Figure 12 and Figure 13 obtained from the different batches of the same steel manufacturer. Figure 17 shows the hardness distribution of the butt-welded specimen with and without PWHT. The hardness decreased in the order of weld metal, HAZ, and base material. The distribution of hardness was slightly different depending on the depth from the surface of the specimen. As shown in Figure 3, it was due to the shape of the weld bead. HAZ is a region that has different microstructures in the solid phase and exhibits unique mechanical properties due to grain growth, solid solution, precipitation of particles, and residual stress. In the hardness measurement of AAN and AAY specimens, there was no unusual tendency to distinguish HAZ. The hardness increased from the base metal to the weld zone. Metallographic observations can explain this kind of phenomenon. In HAZ, re-crystallization and coarsening of grains often occur, so HAZ has coarse-grained and fine-grained structures together. For the grains to become coarse, a lot of welding heat must be input, but in multi-layer welding, enough weld heat was not input at once. Thus, re-crystallization took place without coarsening of the grains. As a result, the base material with coarse grains had the lowest hardness value, and the hardness increased in HAZ with fine grains, and the weld metal had the highest hardness value.
3.2.2. Tensile Test Results
Figure 18 shows tensile stress-strain curves at room temperature. The base metal and the welded specimen presented distinctly different tensile behaviors. In the case of welded specimens, PWHT decreased strength and increased elongation to a significant extent. In the case of the base material specimen, after heat treatment (BMY), the tensile strength decreased by 20 MPa (7.2%), and the 0.2% offset yield strength decreased by 25 MPa (3.8%). In the case of butt-welded specimens, after heat treatment (AAY), the tensile strength decreased by 54 MPa (16.6%), and the yield strength decreased by 59 MPa (10.4%), but the elongation was increased by 73%. In the case of the specimen that was heat-treated after grinding the toe (GAY), the tensile strength became lower by 49 MPa (20.1%), and the yield strength became lower by 72 MPa (9.4%), but the elongation was increased by 238%.
3.2.3. Specimen Fatigue Test Results
Figure 19 is an S-N diagram for a tensile fatigue test performed at a stress ratio R = 0.1. Each point is the test data, and the straight line is a curve fit of the test data to a 50% probability of failure. Specimens that did not break over 2 × 10⁶ cycles were not included in the test data. Looking at the fatigue test results of the base metal specimen (Figure 19a), PWHT smoothed the slope of the S-N curve, but there was no significant difference in fatigue strength. If the magnitude of residual stress in the base material were negligible, this difference would be entirely due to heat treatment. In the case of butt-welded specimens (Figure 19b), the effect of PWHT was a bit greater than that of the base metal. In the region of 2 × 10⁵ cycles or less, the fatigue strength of the as-welded specimen was higher than that of the heat-treated specimen and was smaller over 2 × 10⁵ cycles [2]. The difference in fatigue strength seemed to be due to the simultaneous action of PWHT and residual stress since a considerable amount of residual stress existed in the case of welded specimens. In the low cycle region, if the total stress due to external loading and the residual stress exceeded the yield stress, the magnitude and distribution of the residual stress would change [2,4,5,6]. In the high cycle fatigue test, since the magnitude of the stress applied by the external force was small, the total stress was less than the yield stress, so the effect of the residual stress was insignificant [2,4,5,6]. Figure 19c compares the fatigue strength of the (GAY) and (GAN) specimens that were not heat-treated after grinding the weld toe of the butt-welded specimen. The scatter of fatigue lives was investigated by testing 20 specimens at each stress amplitude. Fatigue strength in the case of heat treatment was small in the whole life range. Grinding had the effect of suppressing the occurrence of fine cracks occurring in the notch by removing the irregularities existing in the weld tow. Since compressive residual stress was generated near the surface when grinding was performed, it was a predictable result that the fatigue strength of the specimen without PWHT was greater. Figure 19d compares the S-N curves of the as-welded specimen and the tow-ground specimen. The fatigue strength of the ground specimen was slightly higher. It was due to the surface compressive residual stress caused by grinding and the effect of surface finishing. Figure 19e compares the S-N diagrams when as-welded specimens and ground specimens were heat treated. Contrary to expectations, the fatigue strength of the GAY specimen was slightly lower. Inferring from these results, grinding based on the operator’s experience could lower the fatigue strength of the welded structure without improving it. Table 5 shows fatigue limits at 2 × 10⁶ cycles of the S-N diagram of Figure 18 (Log Δσ = a Log N + b). The fatigue limit decreased in the order of BMY > BMN > AAY > GAN > GAY > AAN.
3.2.4. Residual Stress Measurement by the Contour Method
The contour method [36] was applied to measure the residual stress in the specimen near the weld toe. First, the test piece was amputated using a wire electrical discharge machine. In the next step, the displacements normal to the cut surfaces, which were assumed to arise from elastic relaxation of residual stresses after the cut, were measured at 0.1 mm intervals in the horizontal and vertical directions using a laser displacement measurement sensor with a very high resolution of 0.01 μm. The average of displacements of two cut faces gives the vertical coordinate of the reference plane. After some raw data cleanup and smoothing [37], the reversed measured displacements were the input to the finite element model for the back-calculation of residual stresses in the specimen. Figure 20 shows the cut specimen. Figure 21 represents the measured displacement normal to the cut surface. Wedge elements with 15 nodes were used in the finite element model of the right part of the specimen. Young’s modulus E = 210 GPa and Poisson’s ratio ν = 0.3 were used. The right end side was fixed as a displacement boundary condition. The finite element analysis was carried out using the Abaqus code. Figure 22 presents the stress corresponding to the displacement in Figure 21. The magnitude of the tensile and compressive residual stresses was near to the yield stress. According to [36], when we use a wire electrical discharge machining for cutting, the contour method tends to predict slightly larger stresses at the edges [36,38]. The analysis results showed a similar trend.
3.2.5. Fatigue Test Results of Members
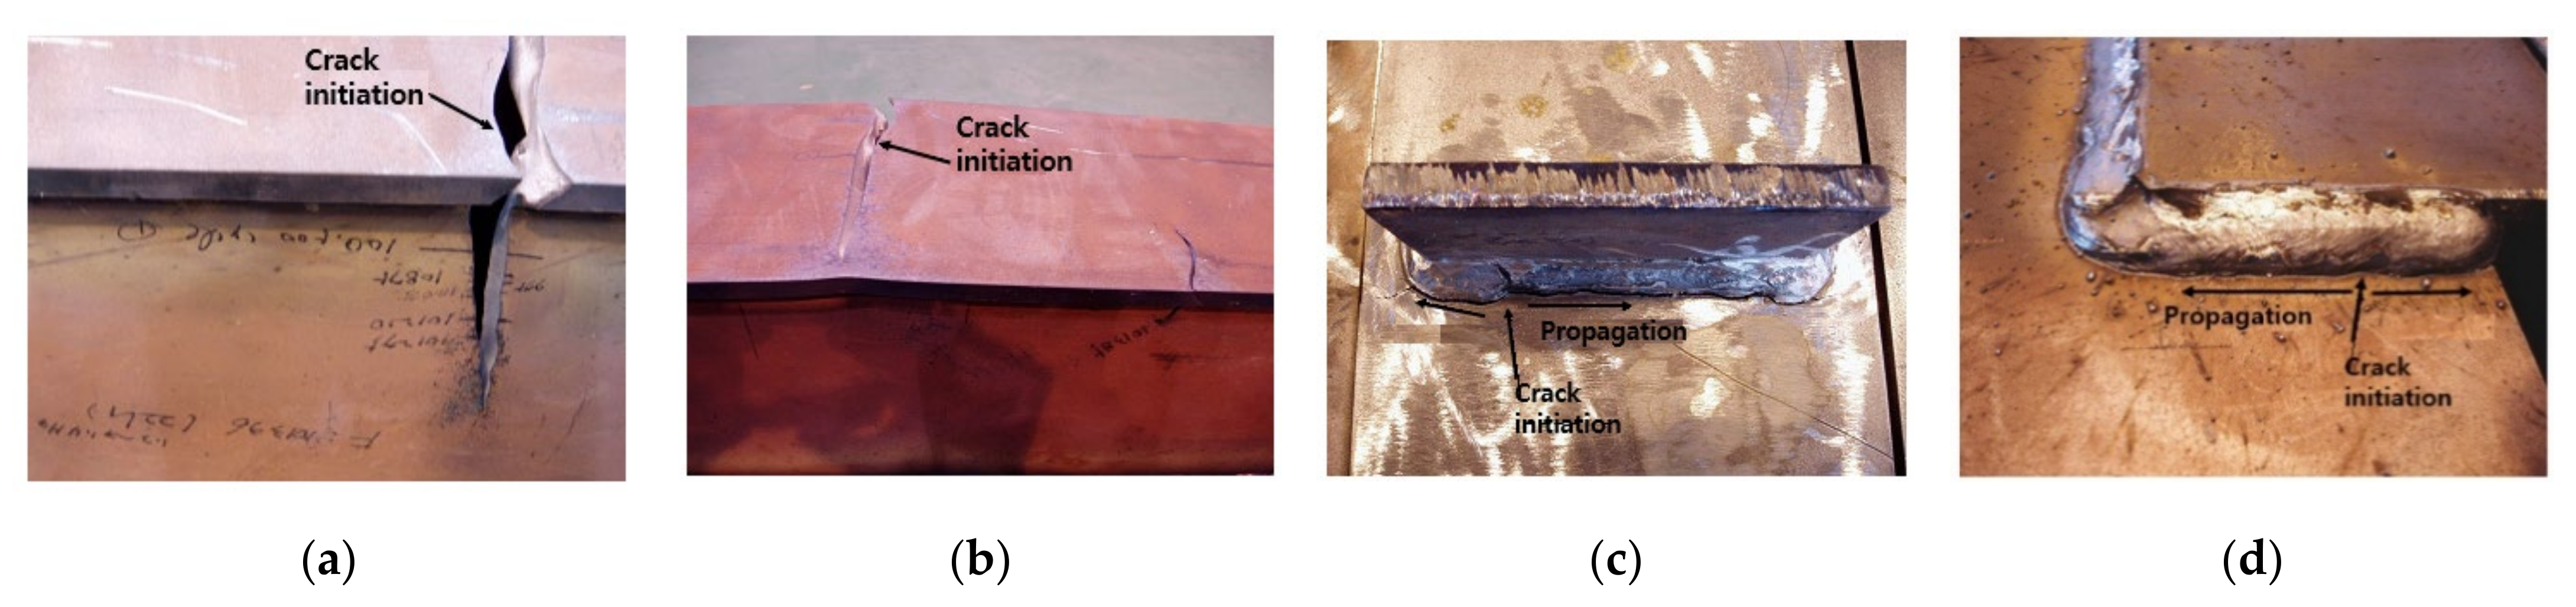
Figure 23 shows the S-N curve for the beams similar to the side member of the bogie frame. Table 6 summarizes the parameter values of the S-N curve. In the three-point bending fatigue test of the box-shaped beam, there was little effect of heat treatment, but rather, the fatigue strength of the member without heat treatment was higher. These results are consistent with those reported in the existing literature. According to [2], there was no effect of improving fatigue strength due to heat treatment on H-type St52, St37, and S355 full-size beams. For high tensile steel StE, the fatigue limit increased by 5% [2]. In the case of box-type beams, regardless of heat treatment, all cracks started at the lower plate where the maximum tensile stress took place by the concentrated load and propagated in the direction perpendicular to the principal stress. The crack initiation location was not in the center of the beam, but at about 1/3 of the width of the box beam N and the box beam Y (Figure 24a,b). That was due to the fact that though the cross-section of the beam was symmetric about the central axis, the welding-residual stress was asymmetric.
The fatigue life of the box beam V and the box beam H without heat treatment, to which a vertical (V) and a horizontal (H) gusset were welded, decreased significantly compared to the beam without gusset. The fatigue strength of the box beam H was a lot less than that of the box beam V. The slope values of the S-N curves of all beams were almost the same. Figure 24c,d show the crack initiation location and propagation path of the box beam-V and box-beam-H, respectively. The crack occurred in the HAZ and propagated along with the weld bead.
4. Conclusions
In this study, with medium-strength welded structural steel (SM355A, KS D 3515 equivalent to S355JR, EN 10025-2) widely used in industry, PWHT effects on material properties such as hardness, microstructure, and mechanical properties of weld specimens and full-size beams were studied. Several results are as follows.
- (1)
- When the base metal, HAZ, and weld metal were annealed at 590 °C and 800 °C for 1 h, the yield and tensile strength decreased but the elongation increased. When annealed at 800 °C for 1 h, the tensile curves of the base metal, HAZ, and weld metal showed almost similar behavior. That explained the almost constant hardness values and homogenization of the materials. For specimens not heat-treated, the parent material’s yield strength, the yield strength in HAZ, and the yield strength of the weld metal were 350 MPa, 345 MPa, and 340 MPa. For specimens heat-treated at 590 °C, they were 350 MPa, 345 MPa, and 340 MPa. For specimens heat-treated at 800 °C, they were 350 MPa, 345 MPa, and 340 MPa.
- (2)
- In the base material, PWHT at 800 °C slightly increased the Charpy impact absorption energy. But PWHT at 590 °C slightly lowered the impact resistance. The shock absorption energy of the weld metal was significantly lower than that of the base metal. And it did not increase much by heat treatment. For specimens not heat-treated, the Charpy impact absorption energies at 20 °C of the parent material and weld metal were 291.5 J and 187 J. For specimens heat-treated at 590 °C, they were 276 J and 166 J. For specimens heat-treated at 800 °C, the Charpy impact absorption energy at 20 °C of the parent material was 299 J.
- (3)
- PWHT had a slight effect on the fatigue strength of the base metal and slightly improved the fatigue strength of the butt-welded specimen. In the case of a specimen ground in the toe part and not heat-treated, the compressive residual stress occurred near the surface, and the fatigue strength slightly improved. However, when heat treated, the beneficial effect of the compressive residual stress disappeared, and the local damage caused by grinding lowered the fatigue strength.
- (4)
- The fatigue limit of the full-scale beam annealed at 590 °C was 10.8% lower than that of the as-welded beam. These results show the possibility of fabricating a bogie frame that does not require PWHT. Vertical and horizontal gussets welded to as-welded beams decreased the fatigue limits by 30.9% and 56%, respectively.
Funding
This research was funded by Korea Railroad Research Institute.
Institutional Review Board Statement
Not applicable.
Informed Consent Statement
Not applicable.
Data Availability Statement
Not applicable.
Conflicts of Interest
The author declares no conflict of interest.
References
- Olsen, F.O. (Ed.) Hybrid Laser-Arc Welding; CRC Press: Boca Raton, FL, USA; Elsevier: Amsterdam, The Netherlands, 2009; ISBN 978-1-4398-0214-4. [Google Scholar]
- Krebs, A.; Kassner, M. Influence of welding residual stresses on fatigue design of welded joints and components. Weld. World 2007, 51, 54–68. [Google Scholar] [CrossRef]
- Farajian, M. Welding residual stress behavior under mechanical loading. Weld. World 2013, 57, 157–159. [Google Scholar] [CrossRef]
- Goo, B.C.; Lee, D.H.; Seo, J.W.; Yang, S.Y.; Kwon, S.J. Development of Remaining Life Estimation Techniques for Rolling Stock Structures; KRRI Research Report 04–99 (in Korean). Korea Railroad Research Institute: Uiwang, Korea, 2004. [Google Scholar]
- Huang, C.C.; Pan, Y.C.; Chuang, T.H. Effects of post-weld heat treatments on the residual stress and mechanical properties of electron beam welded SAE 4130 steel plates. J. Mater. Eng. Perform. 1997, 6, 61–68. [Google Scholar] [CrossRef]
- Wang, D.; Zhang, H.; Gong, B.; Deng, C. Residual stress effects on fatigue behaviour of welded T-joint: A finite fracture mechanics approach. Mater. Des. 2016, 91, 211–217. [Google Scholar] [CrossRef]
- Liljedahl, C.D.M.; Brouard, J.; Zanellato, O.; Lin, J.; Tan, M.L.; Ganguly, S.; Irving, P.E.; Fitzpatrick, M.E.; Zhang, X.; Edwards, L. Weld residual stress effects on fatigue crack growth behaviour of aluminium alloy 2024-T351. Int. J. Fatigue 2009, 31, 1081–1088. [Google Scholar] [CrossRef]
- Kang, G.; Luo, H. Review on fatigue life prediction models of welded joint. Acta Mech. Sin. 2020, 36, 701–726. [Google Scholar] [CrossRef]
- Wang, X.; Meng, Q.; Hu, W. Fatigue life prediction for butt-welded joints considering weld-induced residual stresses and initial damage, relaxation of residual stress, and elasto-plastic fatigue damage. Fatigue Fract. Eng. Mater. Struct. 2019, 42, 1373–1386. [Google Scholar] [CrossRef]
- Baumgartner, J.; Bruder, T. Influence of weld geometry and residual stresses on the fatigue strength of longitudinal stiffeners. Weld. World 2013, 57, 841–855. [Google Scholar] [CrossRef]
- McClung, R.C. A literature survey on the stability and significance of residual stresses during fatigue. Fatigue Fract. Eng. Mater. Struct. 2007, 30, 173–205. [Google Scholar] [CrossRef]
- Aoki, S.; Nishimura, T.; Hiroi, T. Reduction method for residual stress of welded joint using random vibration. Nucl. Eng. Des. 2005, 14, 1441–1445. [Google Scholar] [CrossRef]
- Munsi, A.S.M.Y.; Waddell, A.J.; Walker, C.A. Modification of residual stress by post-weld vibration. Mater. Sci. Technol. 2001, 17, 601–605. [Google Scholar] [CrossRef]
- Zhang, Q.; Yu, L.; Shang, X.; Zhao, S. Residual stress relief of welded aluminum alloy plate using ultrasonic vibration. Ultrasonics 2020, 107, 106164. [Google Scholar] [CrossRef] [PubMed]
- Mordfin, L. (Ed.) Mechanical Relaxation of Residual Stress; ASTM International: West Conshohocken, PA, USA, 1988. [Google Scholar] [CrossRef]
- Takanashi, M.; Iida, K. Relaxation of welding residual stresses by reversed and repeated loadings. Jpn. Weld. Soc. 2001, 19, 129–139. [Google Scholar] [CrossRef]
- Leitner, M.; Mössler, W.; Putz, A.; Stoschka, M. Effect of post-weld heat treatment on the fatigue strength of HFMI-treated mild steel joints. Weld. World 2015, 59, 861–873. [Google Scholar] [CrossRef]
- Goo, B.C.; Lee, C.W.; Seo, J.W.; Kwon, S.J. Effect of postweld heat treatment on microstructure and fatigue strength of SM490A welded plates. J. Korean Soc. Railw. 2020, 20, 448–455. [Google Scholar] [CrossRef]
- Udo, R.; Numakura, H. Effect of post-weld heat treatment on fatigue reliability of super-duplex-stainless-steel weldments. ISIJ Int. 2017, 57, 1228–1232. [Google Scholar] [CrossRef] [Green Version]
- Zhang, C.; Ren, C.; Lei, B.; Hu, X.; Lu, P. Effect of post-weld heat treatment on the fatigue and fracture mechanisms of weld-repaired bisplate 80 with or without a buffer layer. JMEPEG 2017, 26, 2742–2753. [Google Scholar] [CrossRef]
- Kalyankar, D.; Chudasama, G. Effect of post weld heat treatment on mechanical properties of pressure vessel steels. Mater. Today Proc. 2018, 5, 24675–24684. [Google Scholar] [CrossRef]
- Tomków, J.; Janeczek, A. Additional stitches for improving the weldability of steel. Appl. Sci. 2020, 10, 1823. [Google Scholar] [CrossRef] [Green Version]
- Trufyakov, V.I.; Mikheev, P.P.; Kudryavtsev, Y.F.; Reznik, D.N. Fatigue endurance of welded joints, residual stresses and fatigue improvement treatments. In Ship Structure Symposium’93. Arlington, Virginia, USA. November 16; The Society of Naval Architects and Marine Engineers and the Ship Structure Committee: Washington, DC, USA, 1993; Available online: www.shipstructure.org/pdf/93symp13.pdf (accessed on 19 October 2021).
- Galtier, A.; Statnikov, E.S. The influence of ultrasonic impact treatment on fatigue behaviour of welded joints in high-strength steel. Weld. World 2004, 48, 61–66. [Google Scholar] [CrossRef]
- Stanikov, E.S.; Muktepavel, V.O.; Blomqvis, A. Comparison of ultrasonic impact treatment (UIT) and other fatigue life improvement methods. Weld. World 2002, 46, 20–32. [Google Scholar] [CrossRef]
- International Union of Railways. Technical Specification for the Quality Control of Welded Joints on Steel Rolling Stock, 3rd ed.; UIC 897-13; International Union of Railways: Paris, France, 1993. [Google Scholar]
- The European Committee for Standardization. Railway Applications—Welding of Railway Vehicles and Components—Part 3: Design Requirements; BS EN 15085-3; European Standards s.r.o.: Pilsen, Czech Republic, 2007. [Google Scholar]
- Chen, J.; Duan, L.; Liu, S.; Zhang, M.; Zhai, P.; Yu, L. Research on the Welding Bogie Process without Heat Treatment. Available online: http://www.360doc.com/content/17/1218/19/28704984_714291266.shtml (accessed on 8 July 2021).
- Jiang, J.; Zhang, J.; Liu, J.; Chiew, S.P.; Lee, C.K. Effect of welding and heat treatment on strength of high-strength steel columns. J. Constr. Steel Res. 2018, 151, 238–252. [Google Scholar] [CrossRef]
- Lojen, G.; Vuherer, T. Optimization of PWHT of simulated HAZ subzones in P91 Steel with respect to hardness and impact toughness. Metals 2020, 10, 1215. [Google Scholar] [CrossRef]
- Silva, F.J.G.; Pinho, A.P.; Pereira, A.B. Evaluation of welded joints in P91 steel under different heat-treatment conditions. Metals 2020, 10, 99. [Google Scholar] [CrossRef] [Green Version]
- Pandey, C.; Mahapatra, M.M.; Kumar, P.; Daniel, F.; Adhithan, B. Softening mechanism of P91 steel weldments using heat treatments. Arch. Civil Mech. Eng. 2019, 19, 297–310. [Google Scholar] [CrossRef]
- Pandey, C.; Mahapatra, M.M.; Kumar, P.; Kumar, S.; Sirohi, S. Effect of post weld heat treatments on microstructure evolution and type IV cracking behavior of the P91 steel welds joint. J. Mater. Process. Technol. 2019, 266, 140–154. [Google Scholar] [CrossRef]
- Vöhringer, O. Relaxation of Residual Stresses by Annealing or Mechanical Treatment, Advances in Surface Treatments: Technology, Applications, Effects; Niku-Lari, A., Ed.; Pergamon Press: Oxford, UK, 1987; Volume 4. [Google Scholar]
- Hutanu, R.; Clapham, L.; Rogge, R.B. Intergranular strain and texture in steel Lüders bands. Acta Mater. 2005, 53, 3517–3524. [Google Scholar] [CrossRef]
- Prime, M.B. Cross-Sectional mapping of residual stresses by measuring the surface contour after a cut. J. Eng. Mater. Technol. 2001, 123, 162–168. [Google Scholar] [CrossRef] [Green Version]
- Prime, M.B.; Kastengren, A.L. The contour method cutting assumption: Error minimization and correction. Exp. Appl. Mech. 2011, 6, 233–250. [Google Scholar]
- Mahmoudi, A.H.; Hosseinzadeh, F.; Jooya, M. Plasticity effect on residual stresses measurement using the contour method. Int. J. Eng. 2013, 26, 1203–1212. [Google Scholar] [CrossRef] [Green Version]
Figure 1.
A bogie frame made by welding for a rail vehicle.
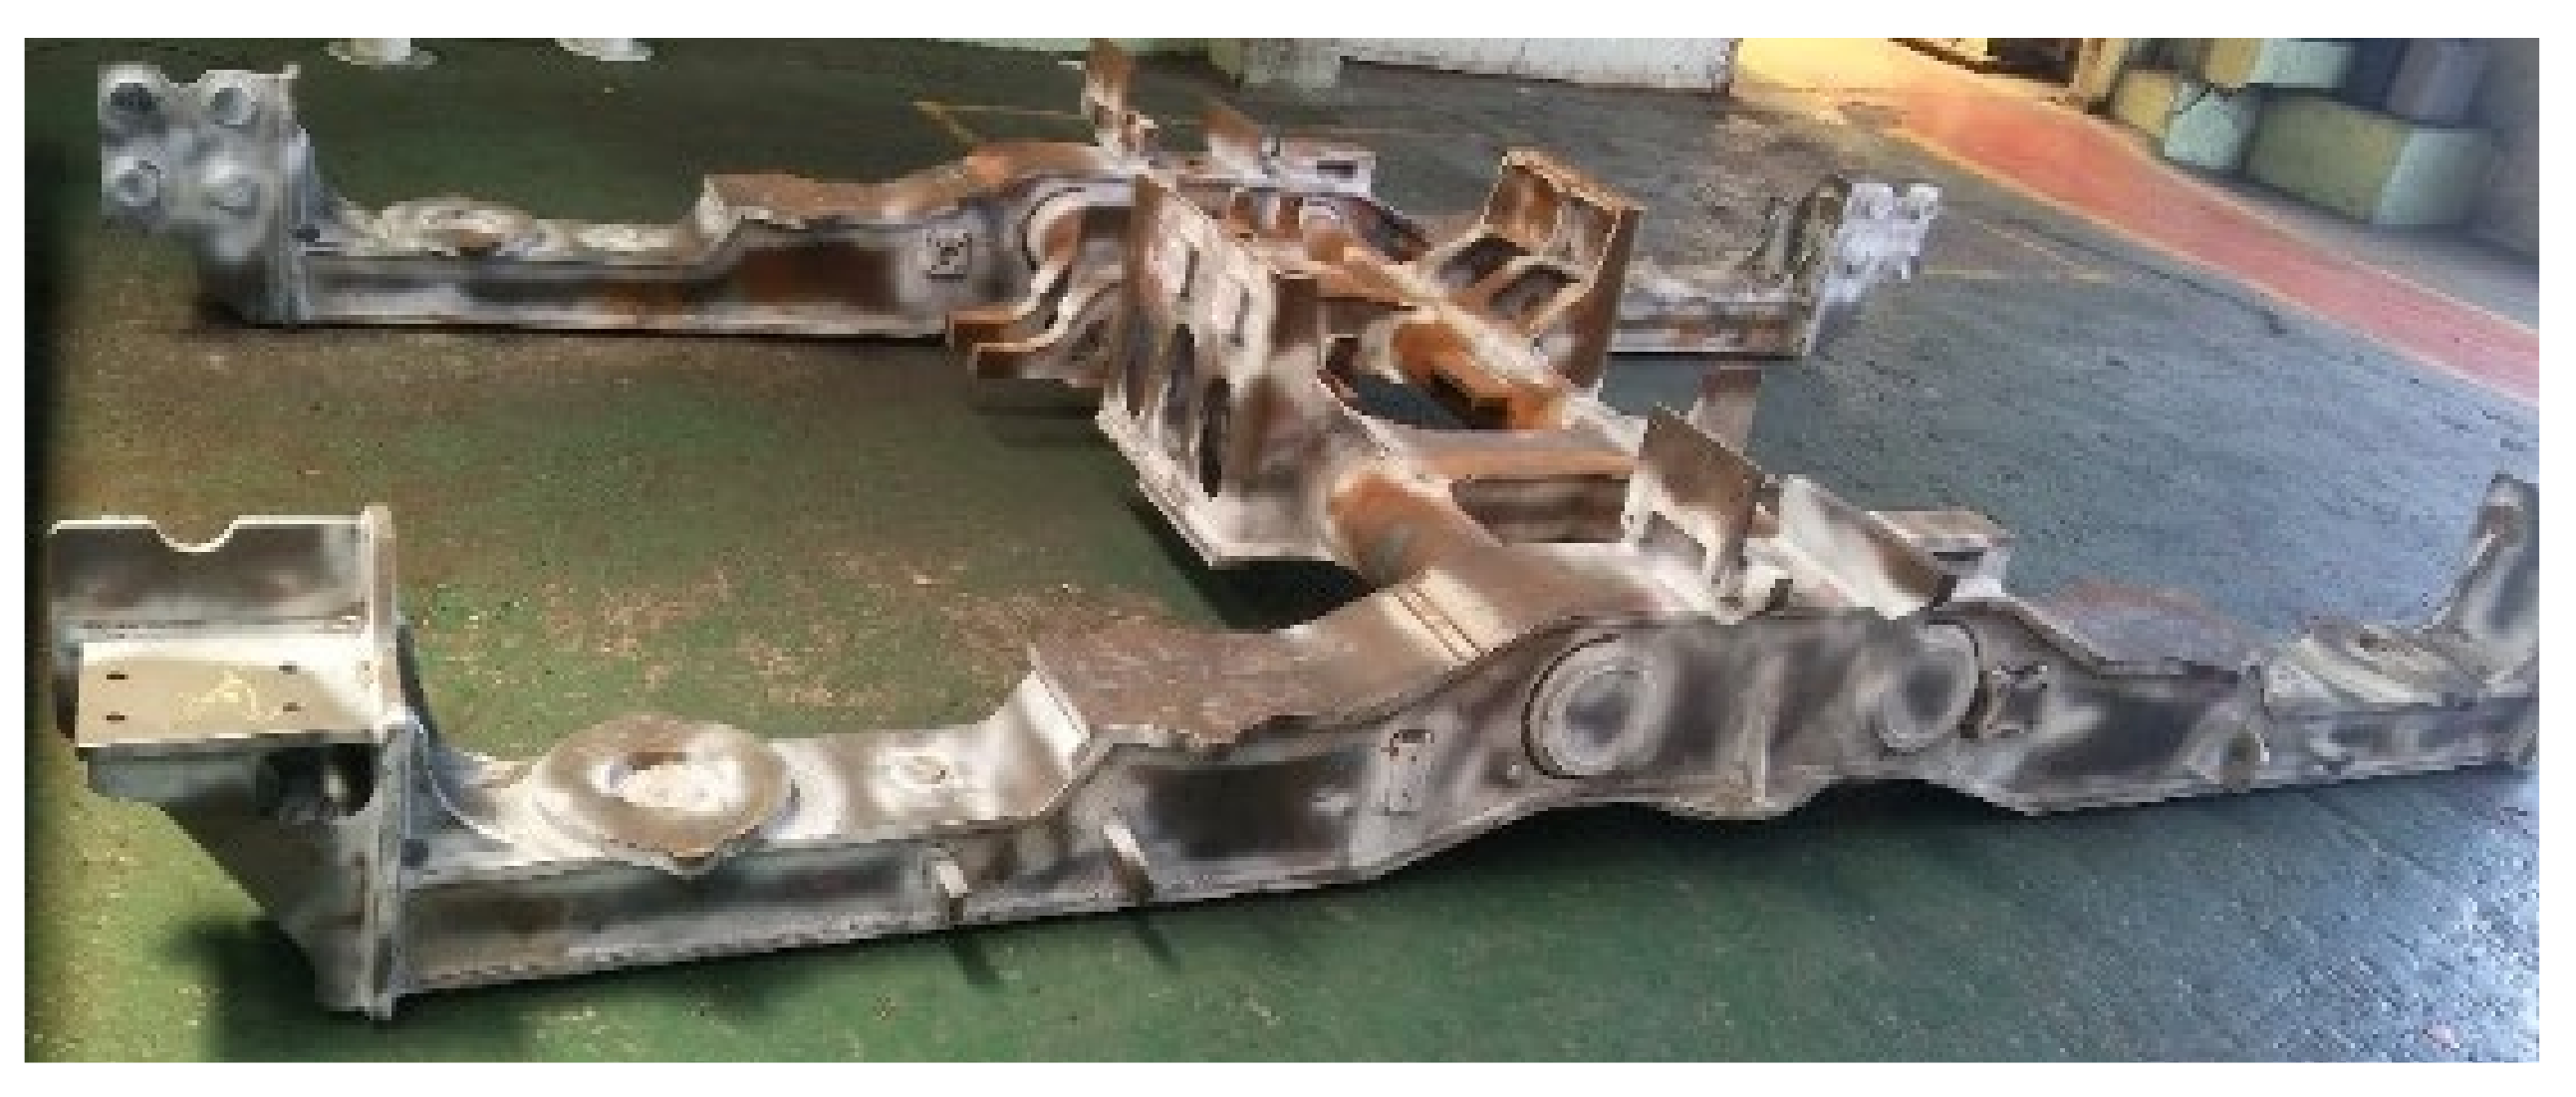
Figure 2.
Plate welding and production of specimens. (a) Plate welding; (b) tensile specimen, thickness 5 mm; (c) Charpy impact specimen.
Figure 2.
Plate welding and production of specimens. (a) Plate welding; (b) tensile specimen, thickness 5 mm; (c) Charpy impact specimen.
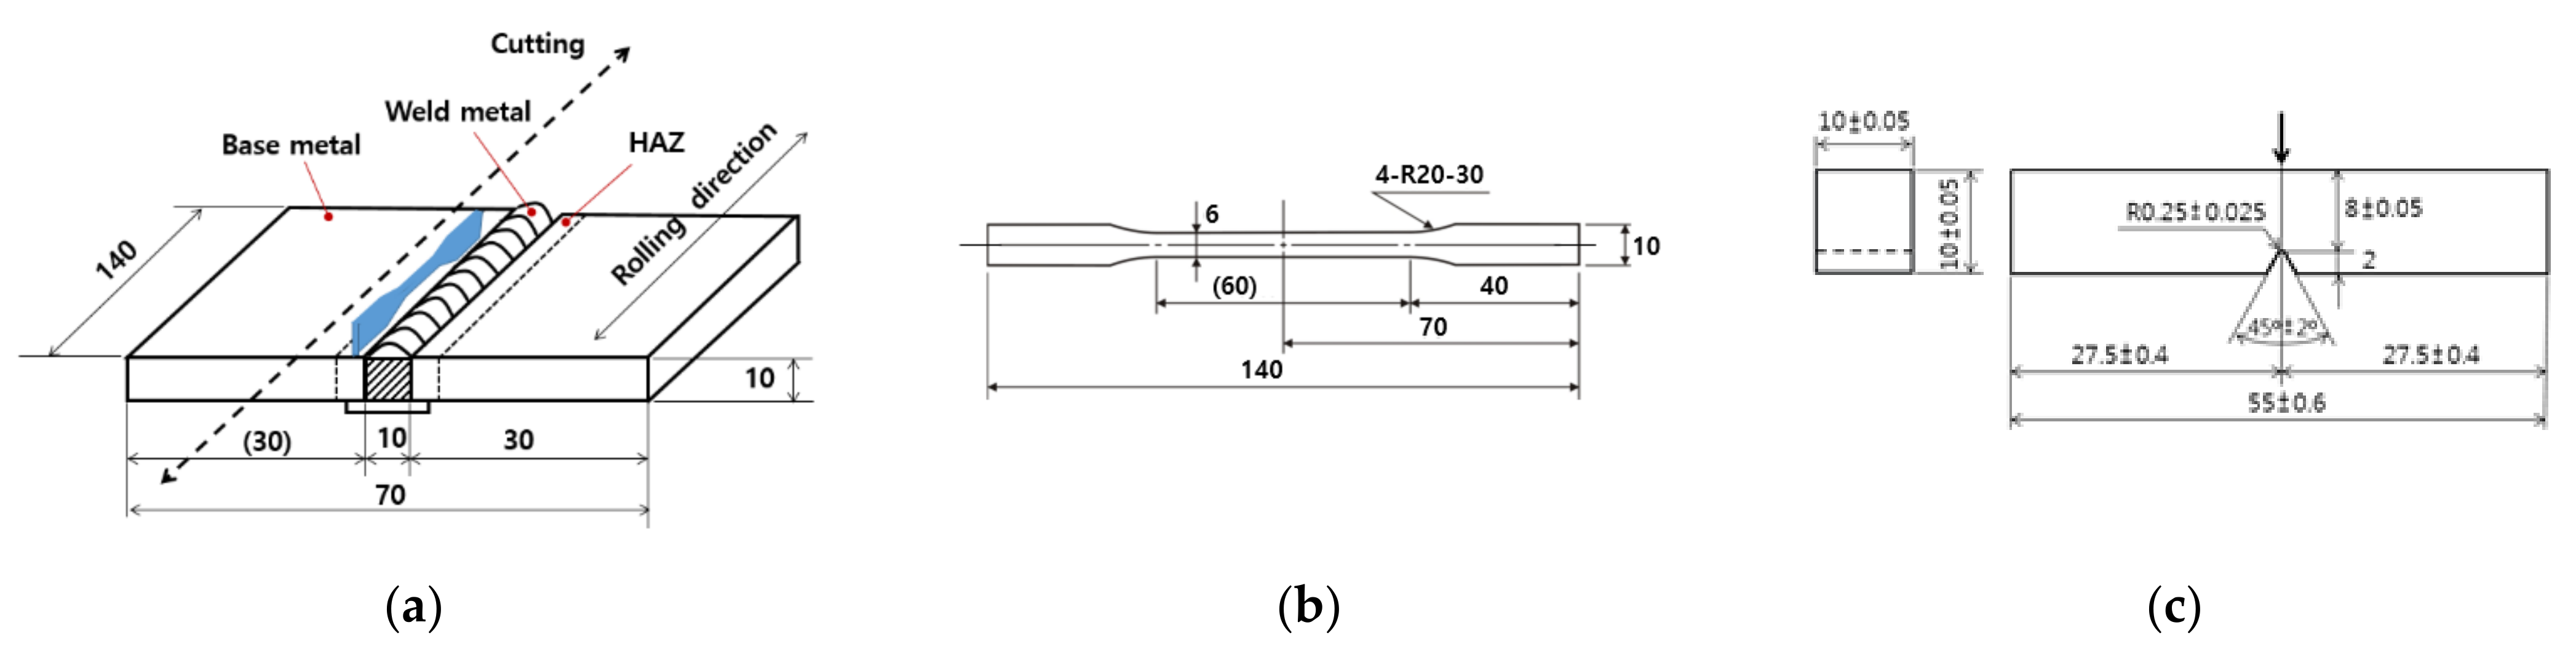
Figure 3.
(a) welding specimen geometry; (b) welded specimen; and (c) Vickers hardness measurement locations.
Figure 3.
(a) welding specimen geometry; (b) welded specimen; and (c) Vickers hardness measurement locations.
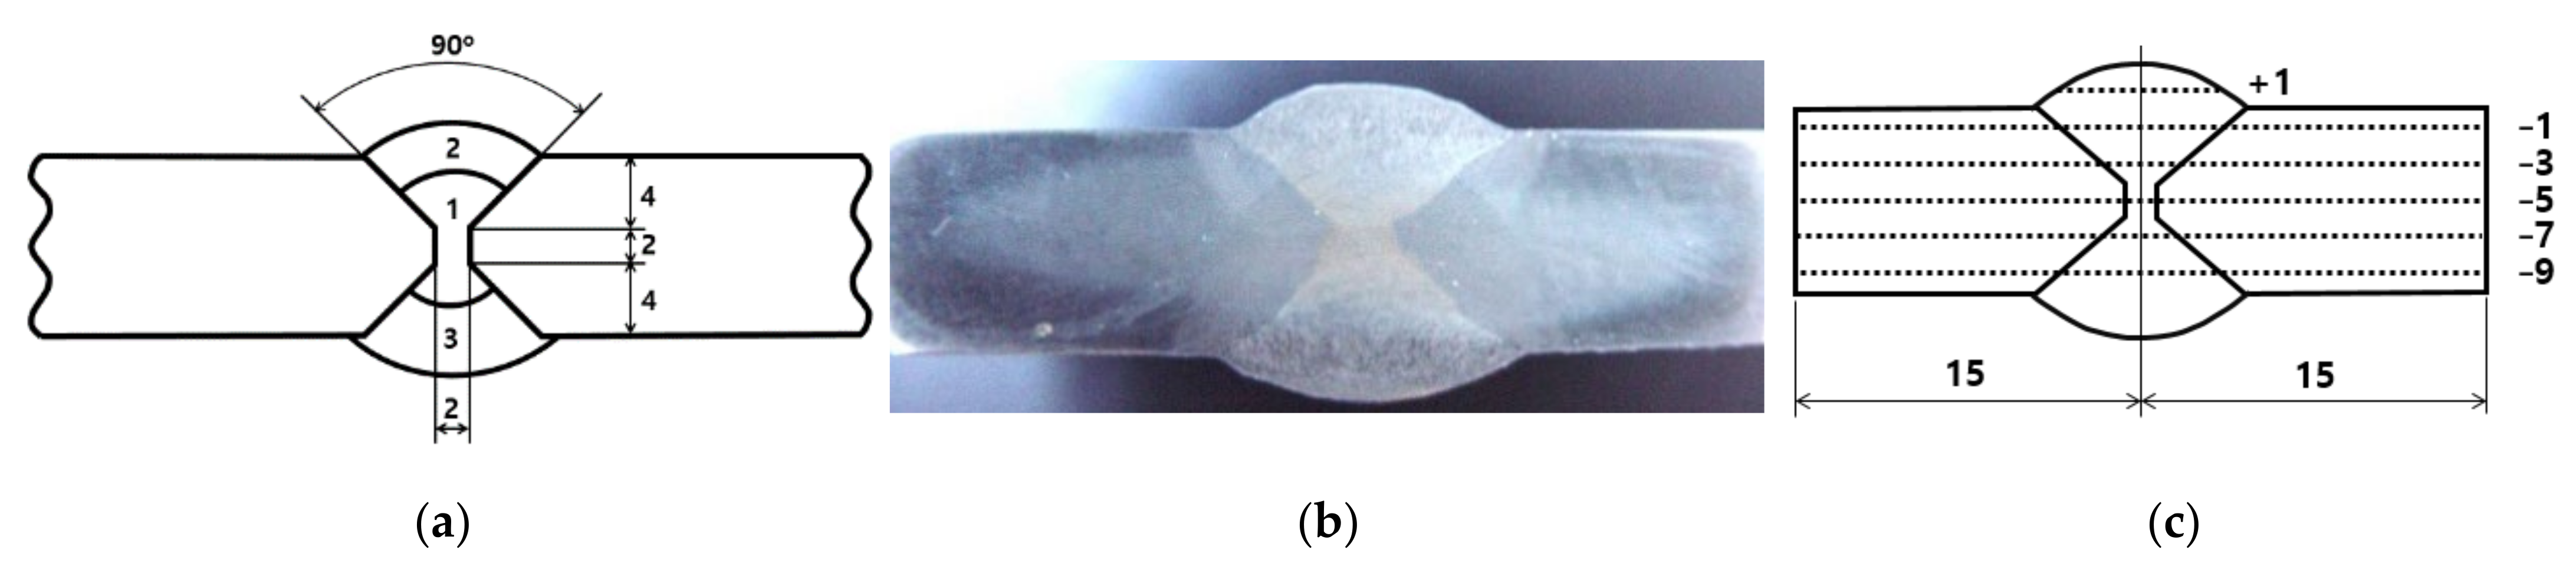
Figure 4.
Configuration of tensile specimen, thickness 10 mm.
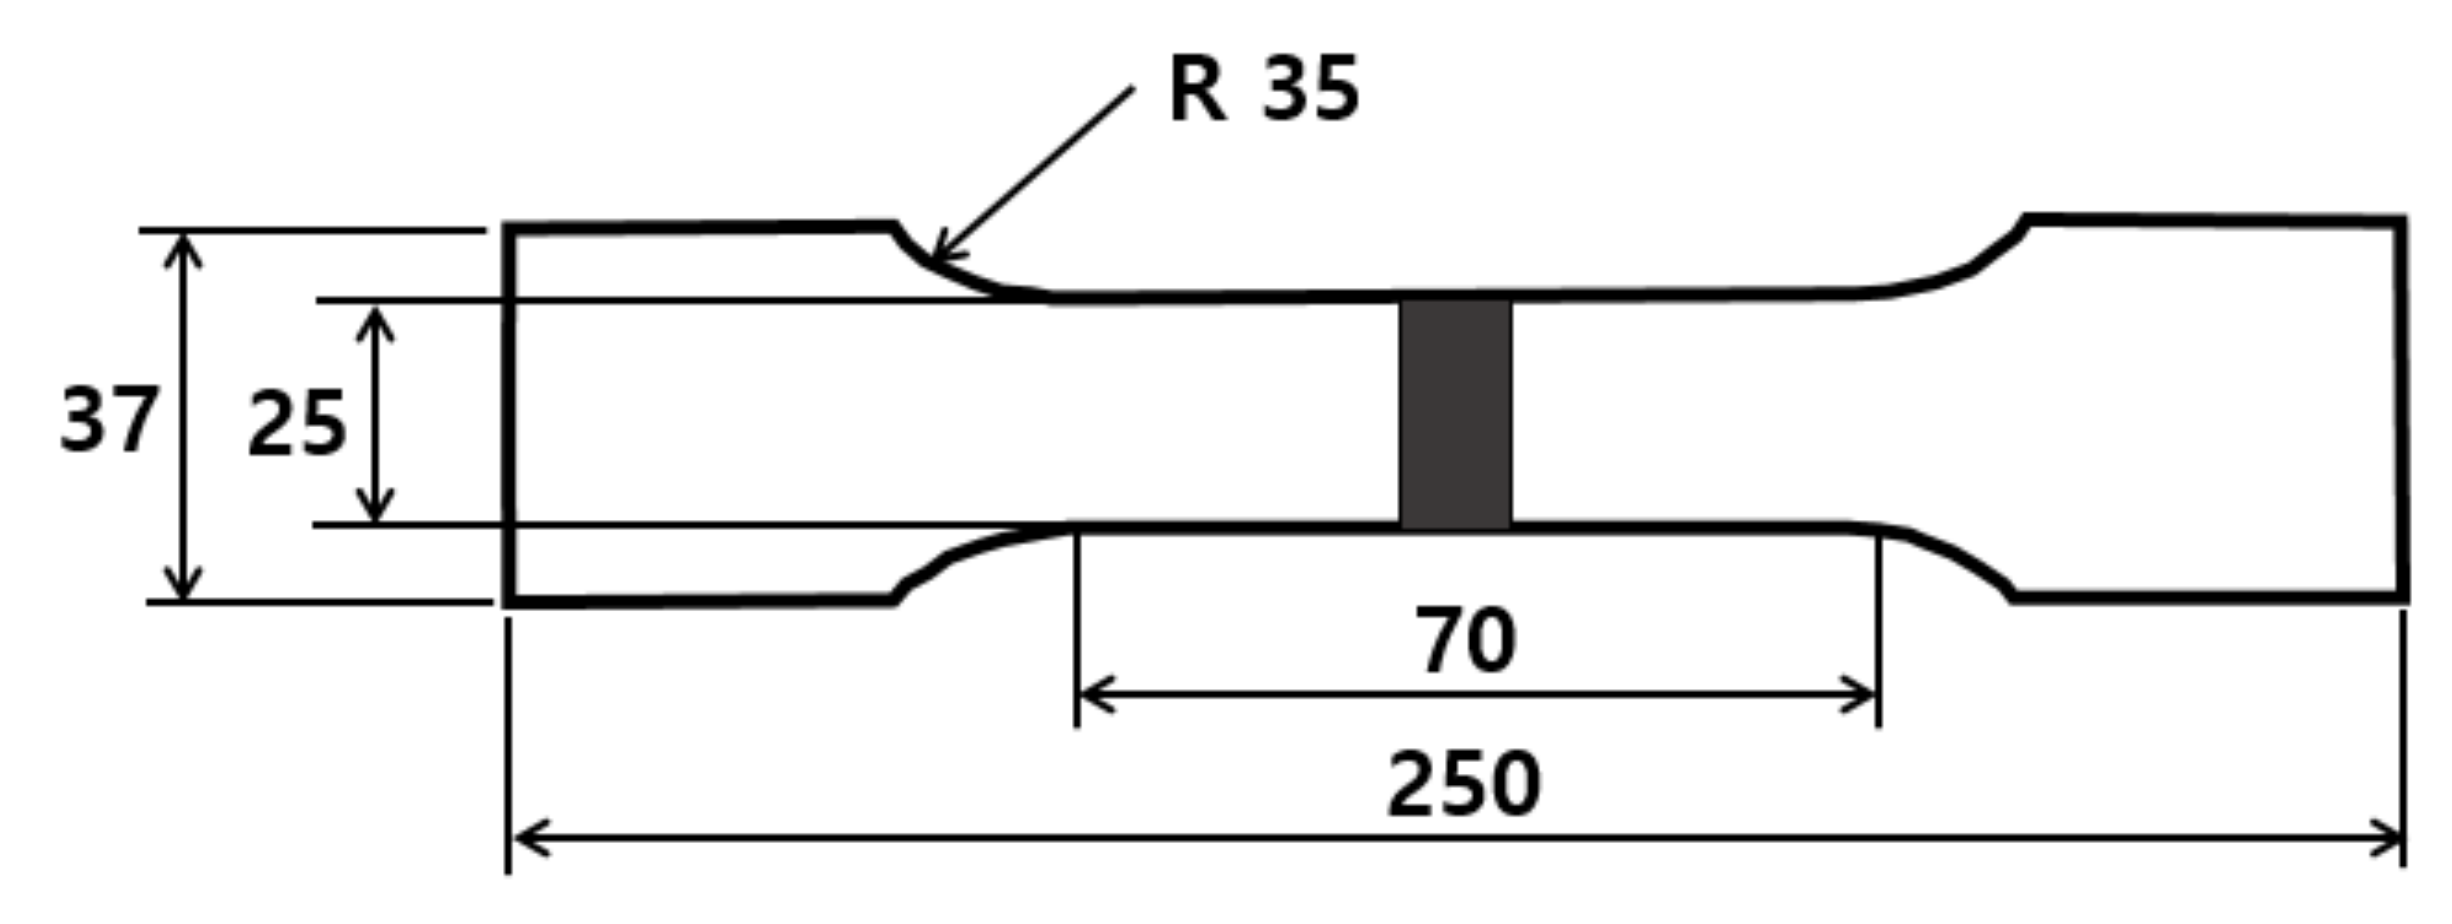
Figure 5.
Butt-weld fatigue specimen, thickness 10 mm.
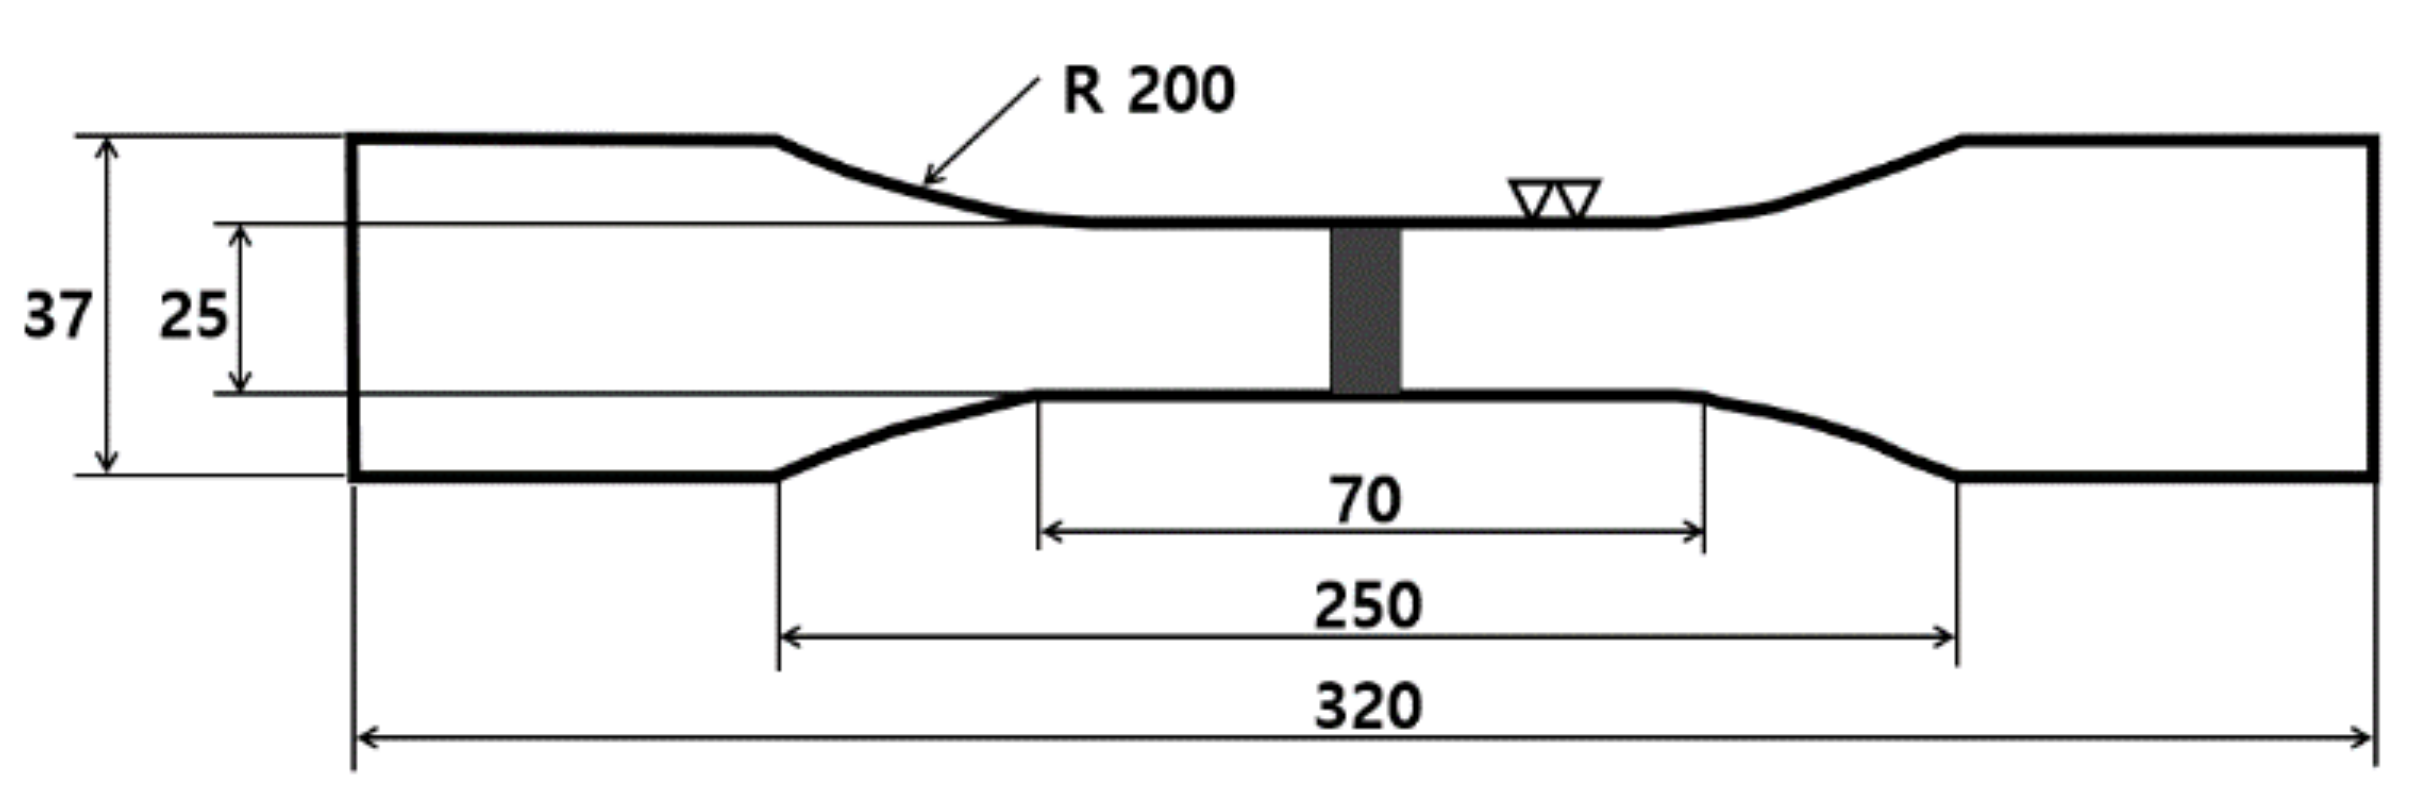
Figure 6.
Configuration of the real-size beam and fatigue test setup. (a) Side view of the box-shaped beam; (b) detail ‘J’; (c) setup for three-point bending fatigue test [4].
Figure 6.
Configuration of the real-size beam and fatigue test setup. (a) Side view of the box-shaped beam; (b) detail ‘J’; (c) setup for three-point bending fatigue test [4].

Figure 7.
Specimens after tensile tests.
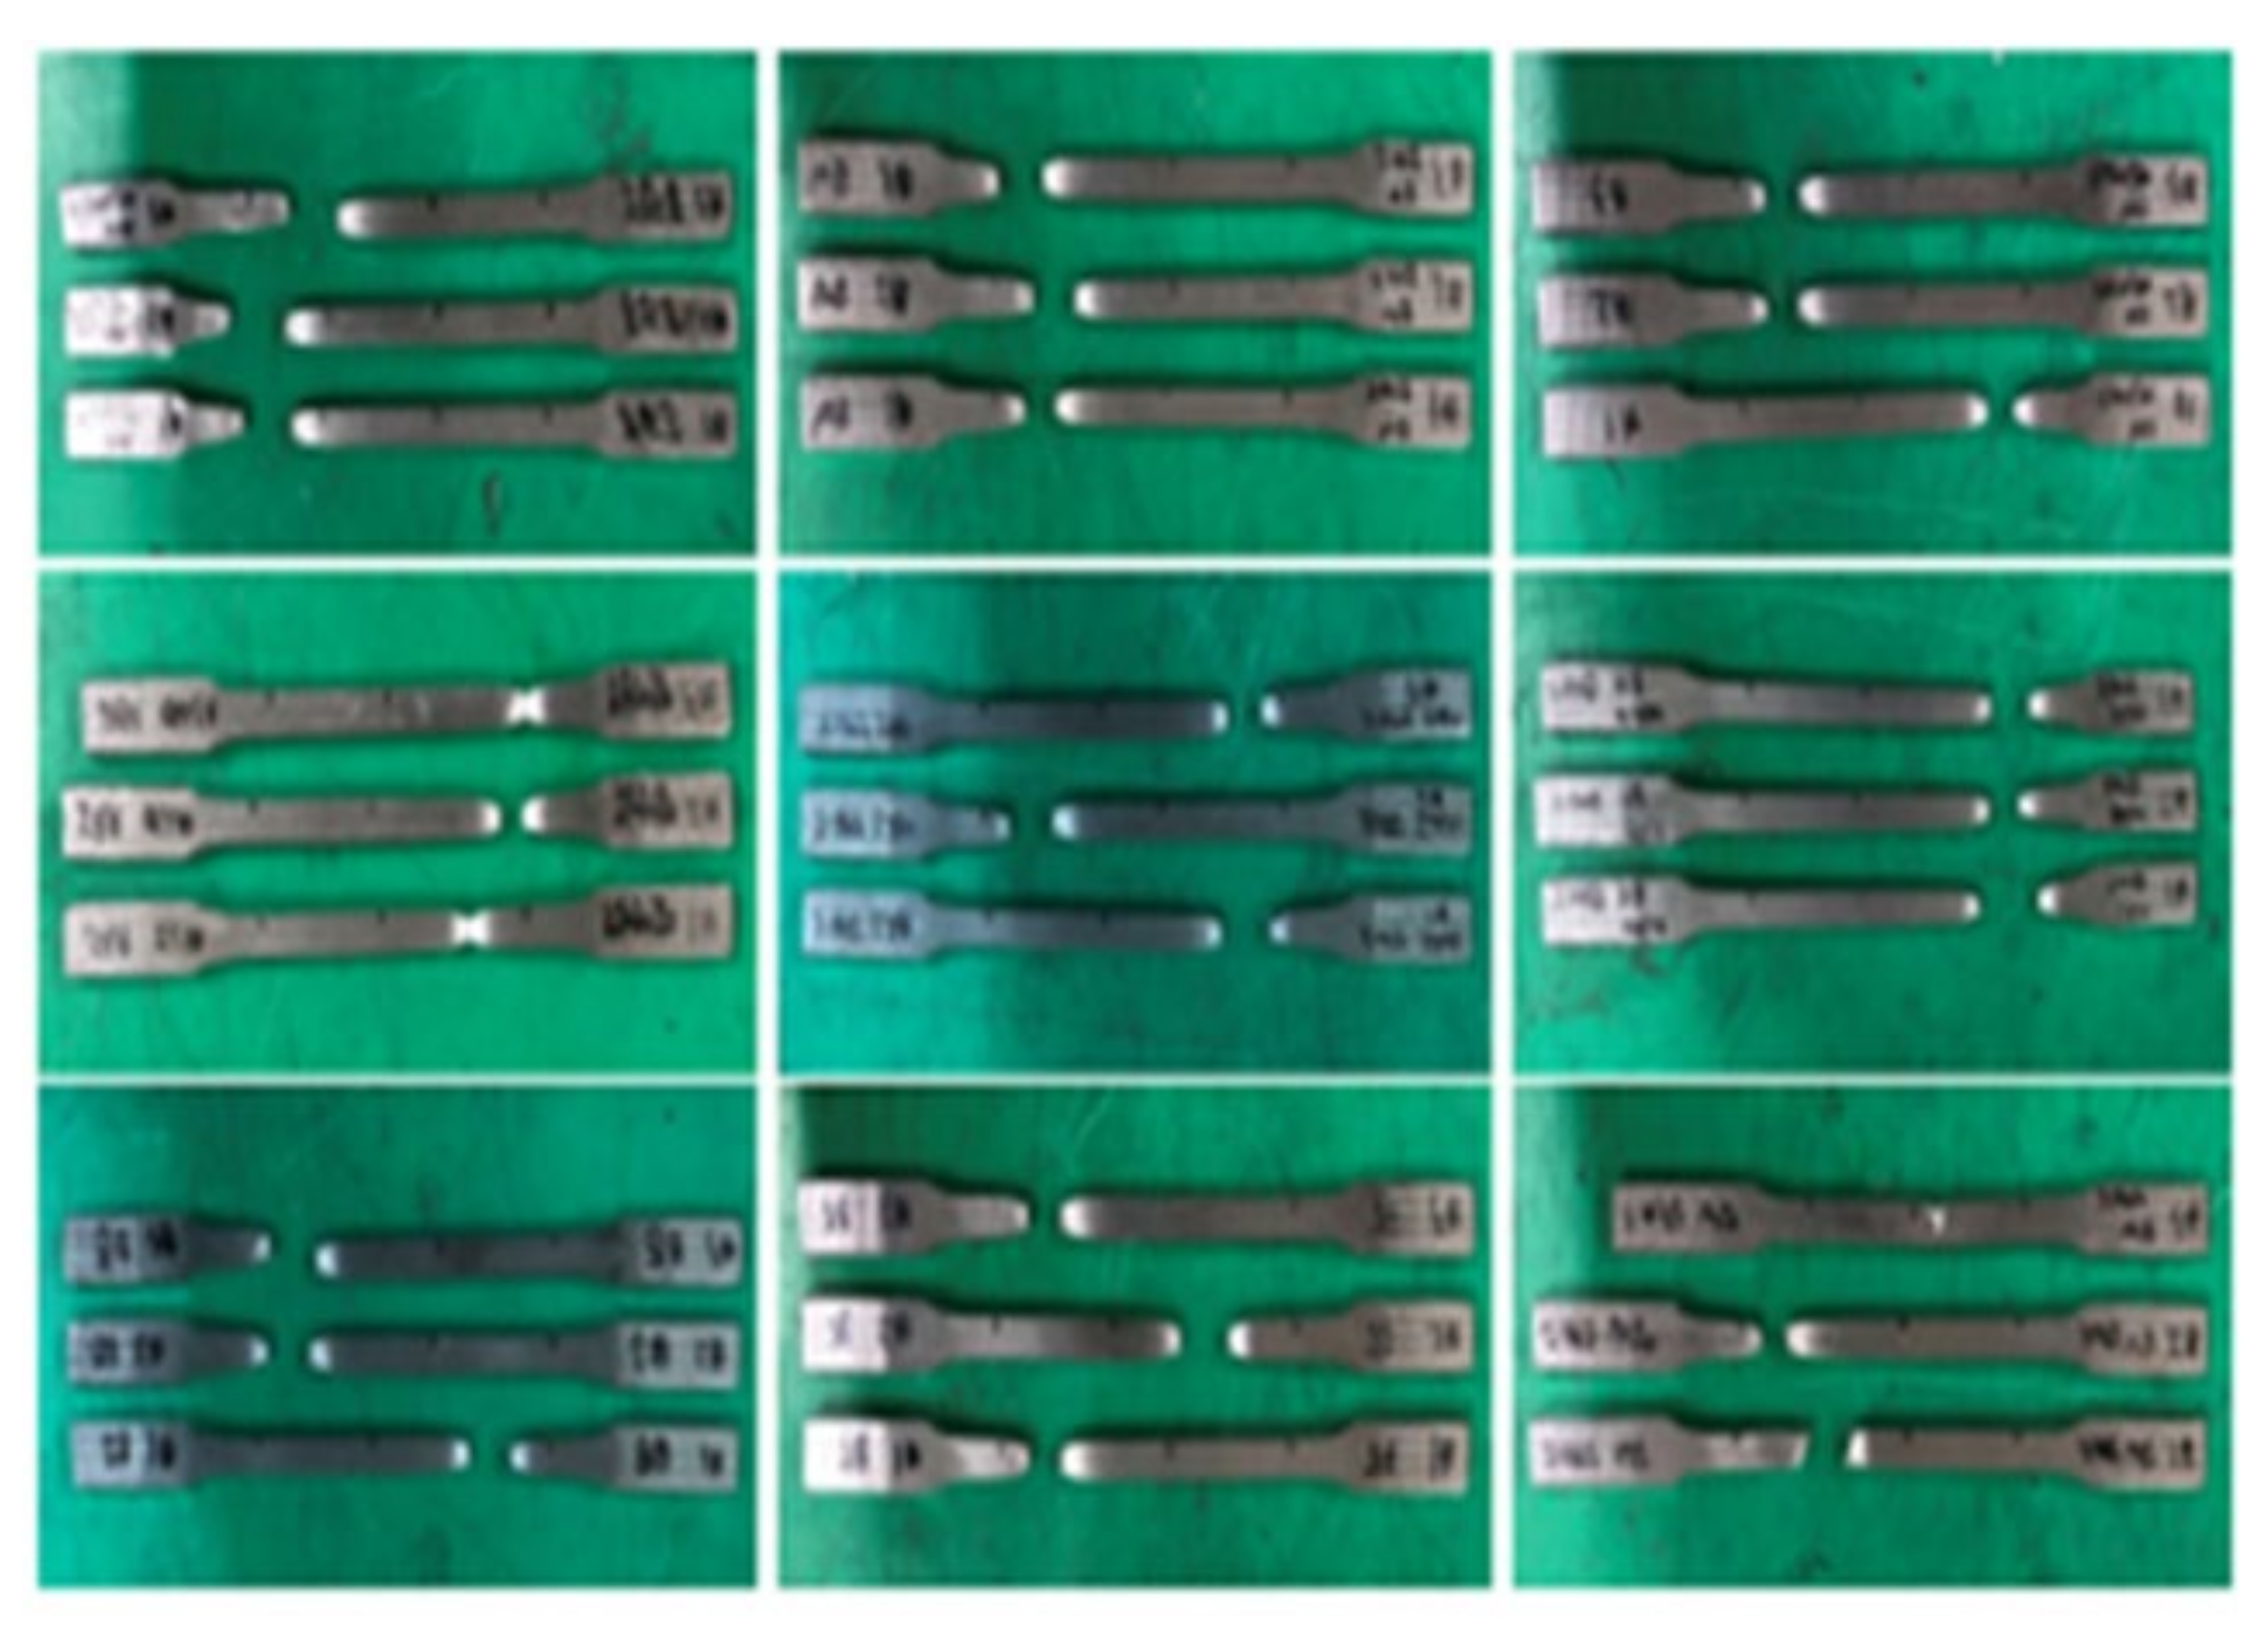
Figure 8.
Strain-stress curve. (a) Parent material; (b) HAZ; and (c) weld metal.

Figure 9.
Comparison of tensile curves of parent, HAZ and weld metal. (a) Non PWHT (b) PWHT at 590 °C; (b) PWHT at 590 °C; (c) PWHT at 800 °C.
Figure 9.
Comparison of tensile curves of parent, HAZ and weld metal. (a) Non PWHT (b) PWHT at 590 °C; (b) PWHT at 590 °C; (c) PWHT at 800 °C.

Figure 10.
Comparison of yield stresses. P, parent material non heat treated; P5, parent heat treated at 590 °C; P8, parent heat treated at 800 °C; H, HAZ non heat treated; H5, HAZ heat treated at 590 °C; H8, HAZ heat treated at 800 °C; W, weld metal non heat treated; W5, weld metal heat treated at 590 °C; W8, weld metal heat treated at 800 °C. (a) Yield stress; (b) tensile stress; and (c) elongation rates.
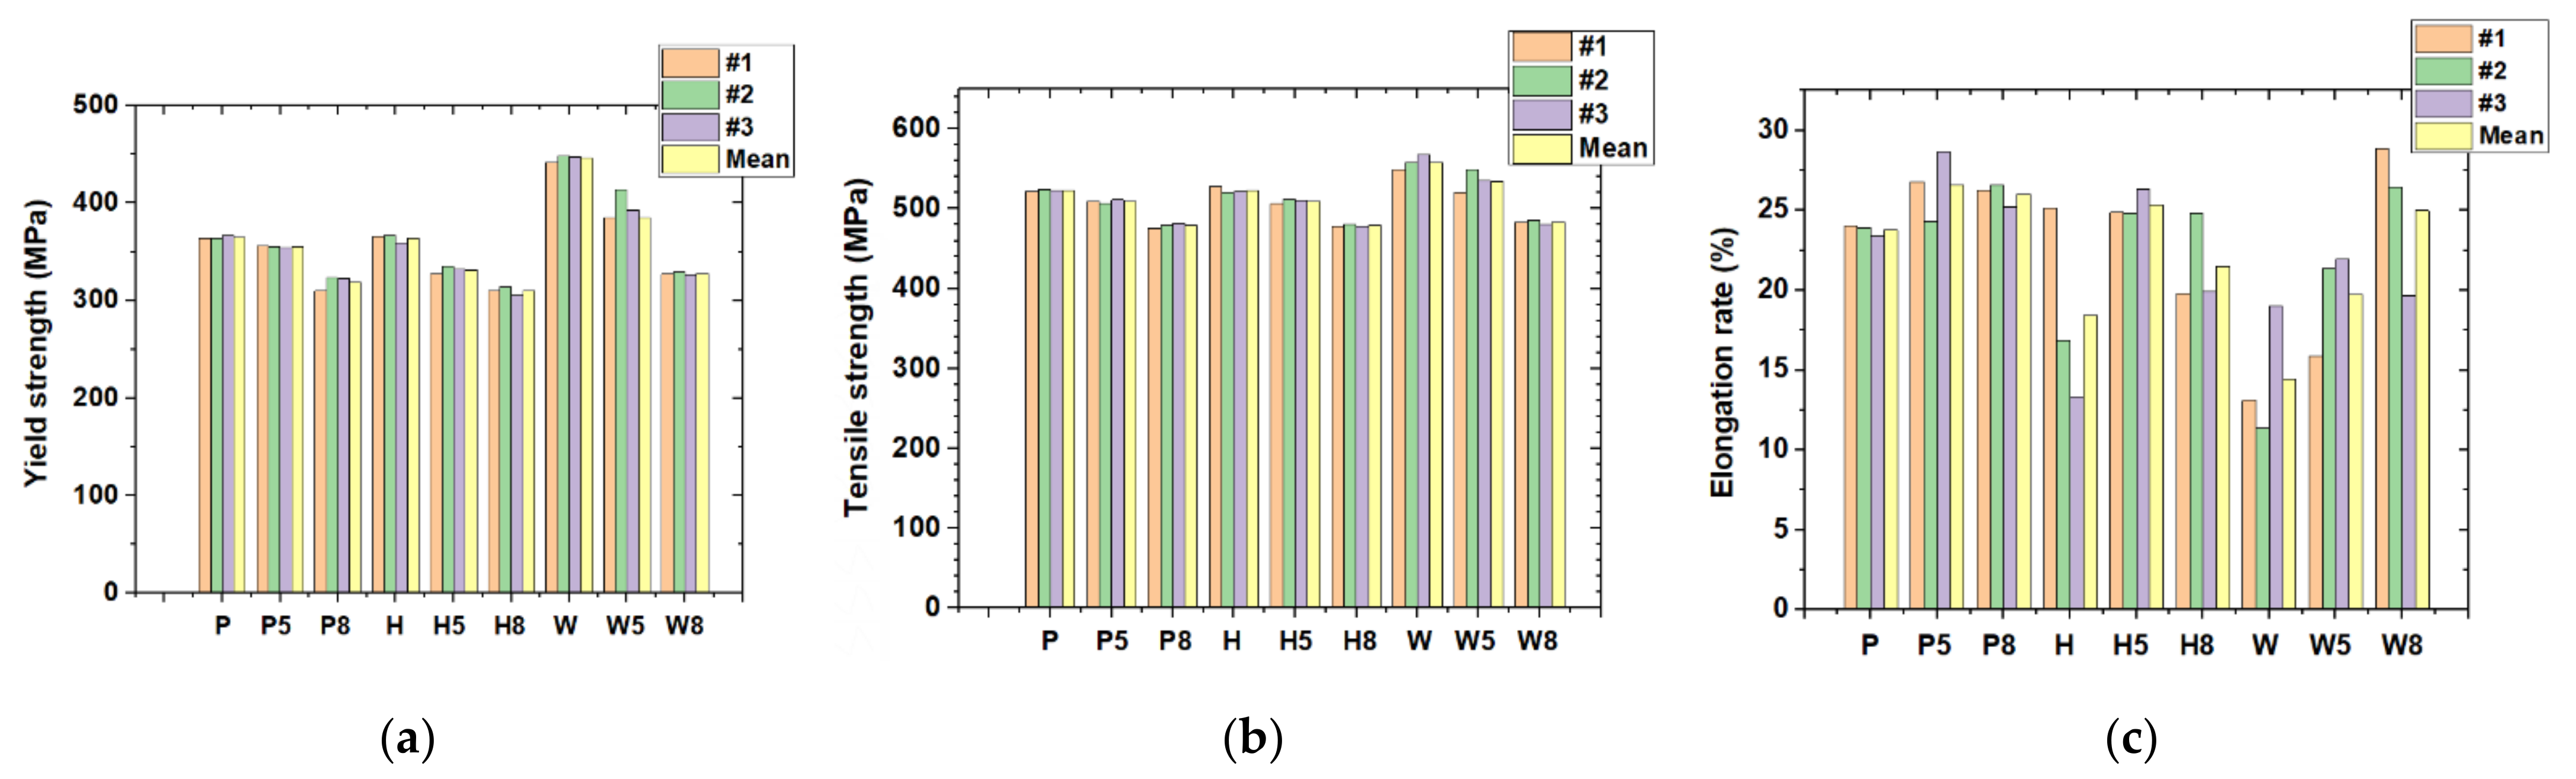
Figure 11.
Micro hardness distribution.
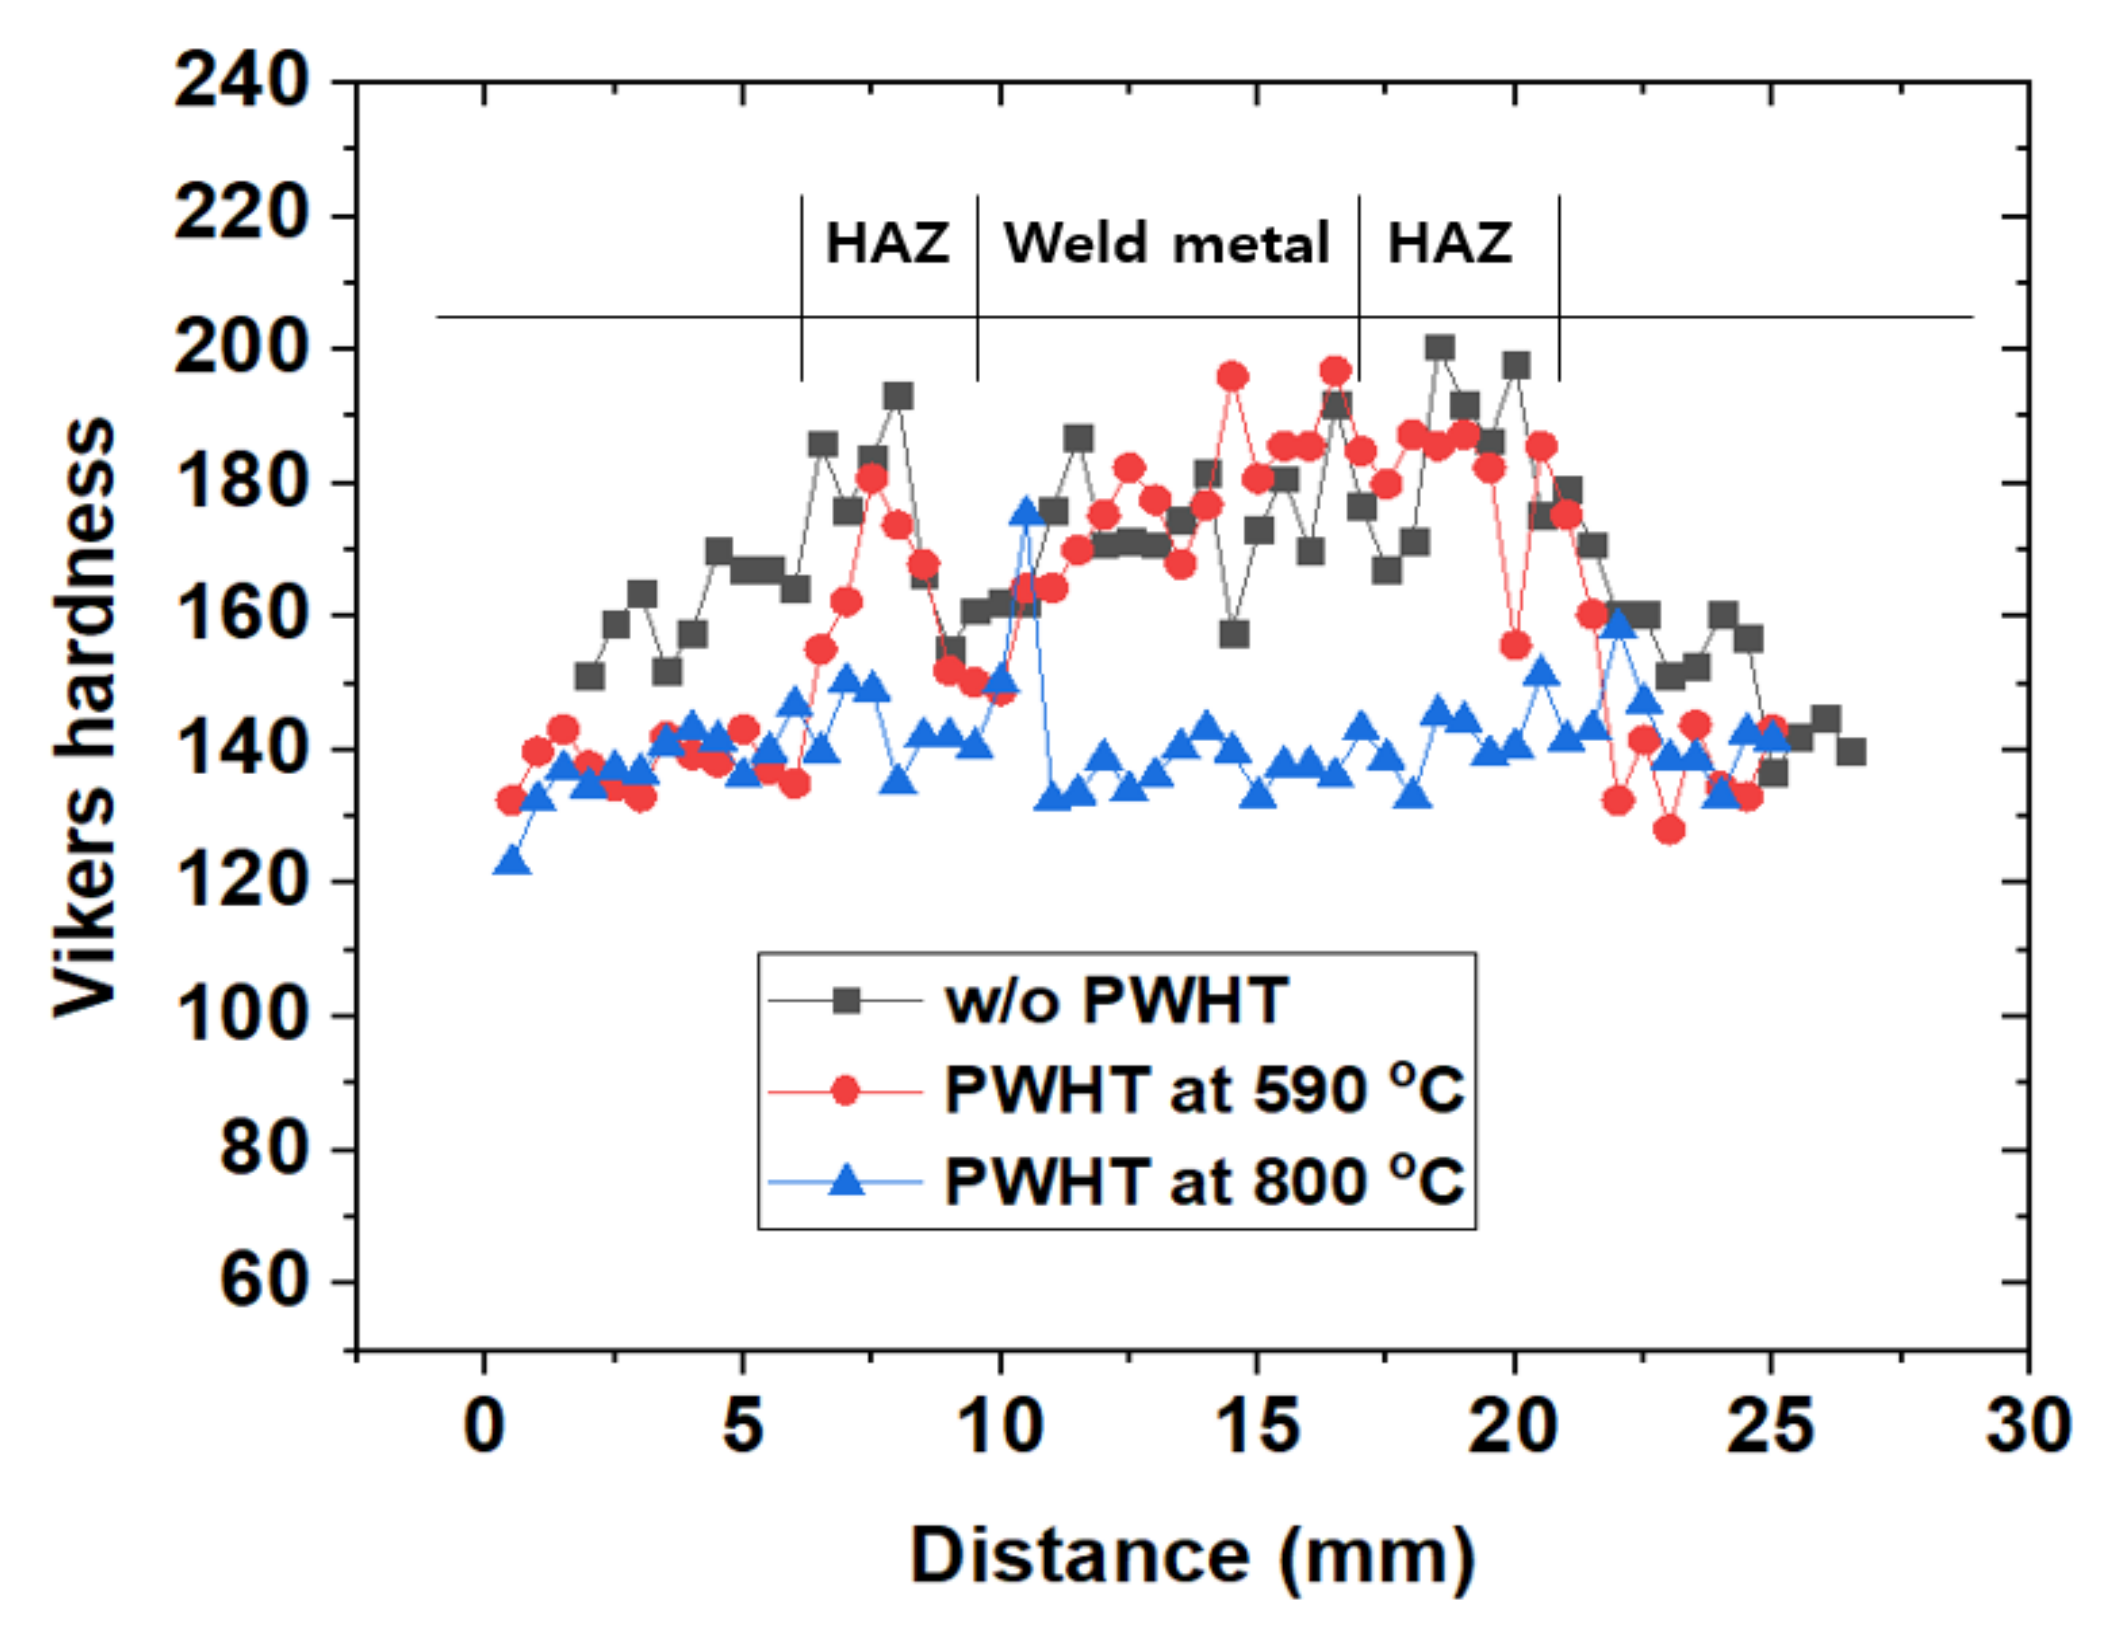
Figure 12.
Microstructure of the as-welded specimen. (a) Parent material; (b) HAZ; and (c) weld metal.
Figure 12.
Microstructure of the as-welded specimen. (a) Parent material; (b) HAZ; and (c) weld metal.
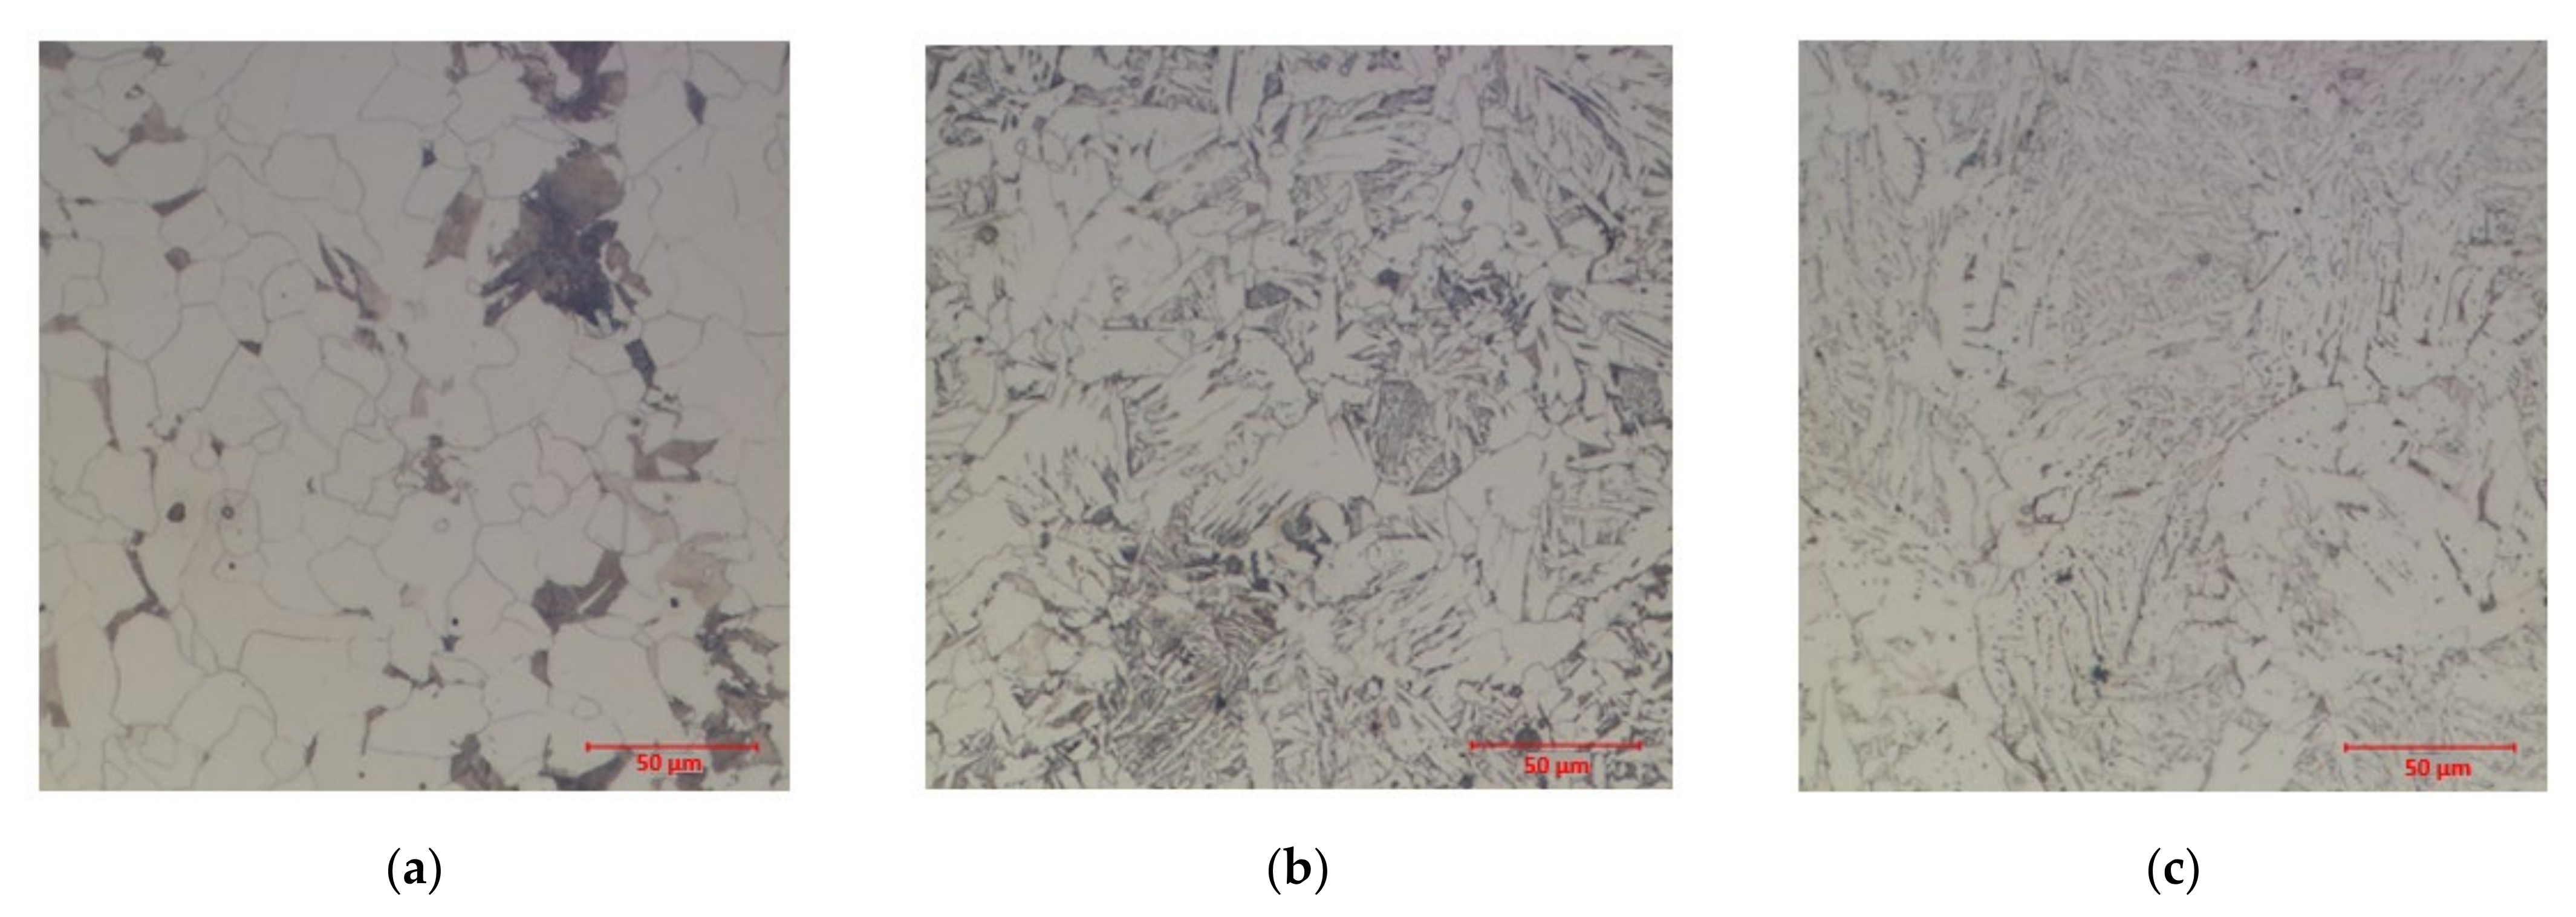
Figure 13.
Microstructure of the heat-treated specimen at 590 °C. (a) Parent material; (b) HAZ; and (c) weld metal.
Figure 13.
Microstructure of the heat-treated specimen at 590 °C. (a) Parent material; (b) HAZ; and (c) weld metal.

Figure 14.
Microstructure of the heat-treated specimen at 800 °C. (a) Parent material; (b) HAZ; and (c) weld metal.
Figure 14.
Microstructure of the heat-treated specimen at 800 °C. (a) Parent material; (b) HAZ; and (c) weld metal.

Figure 15.
Charpy impact absorption energy.
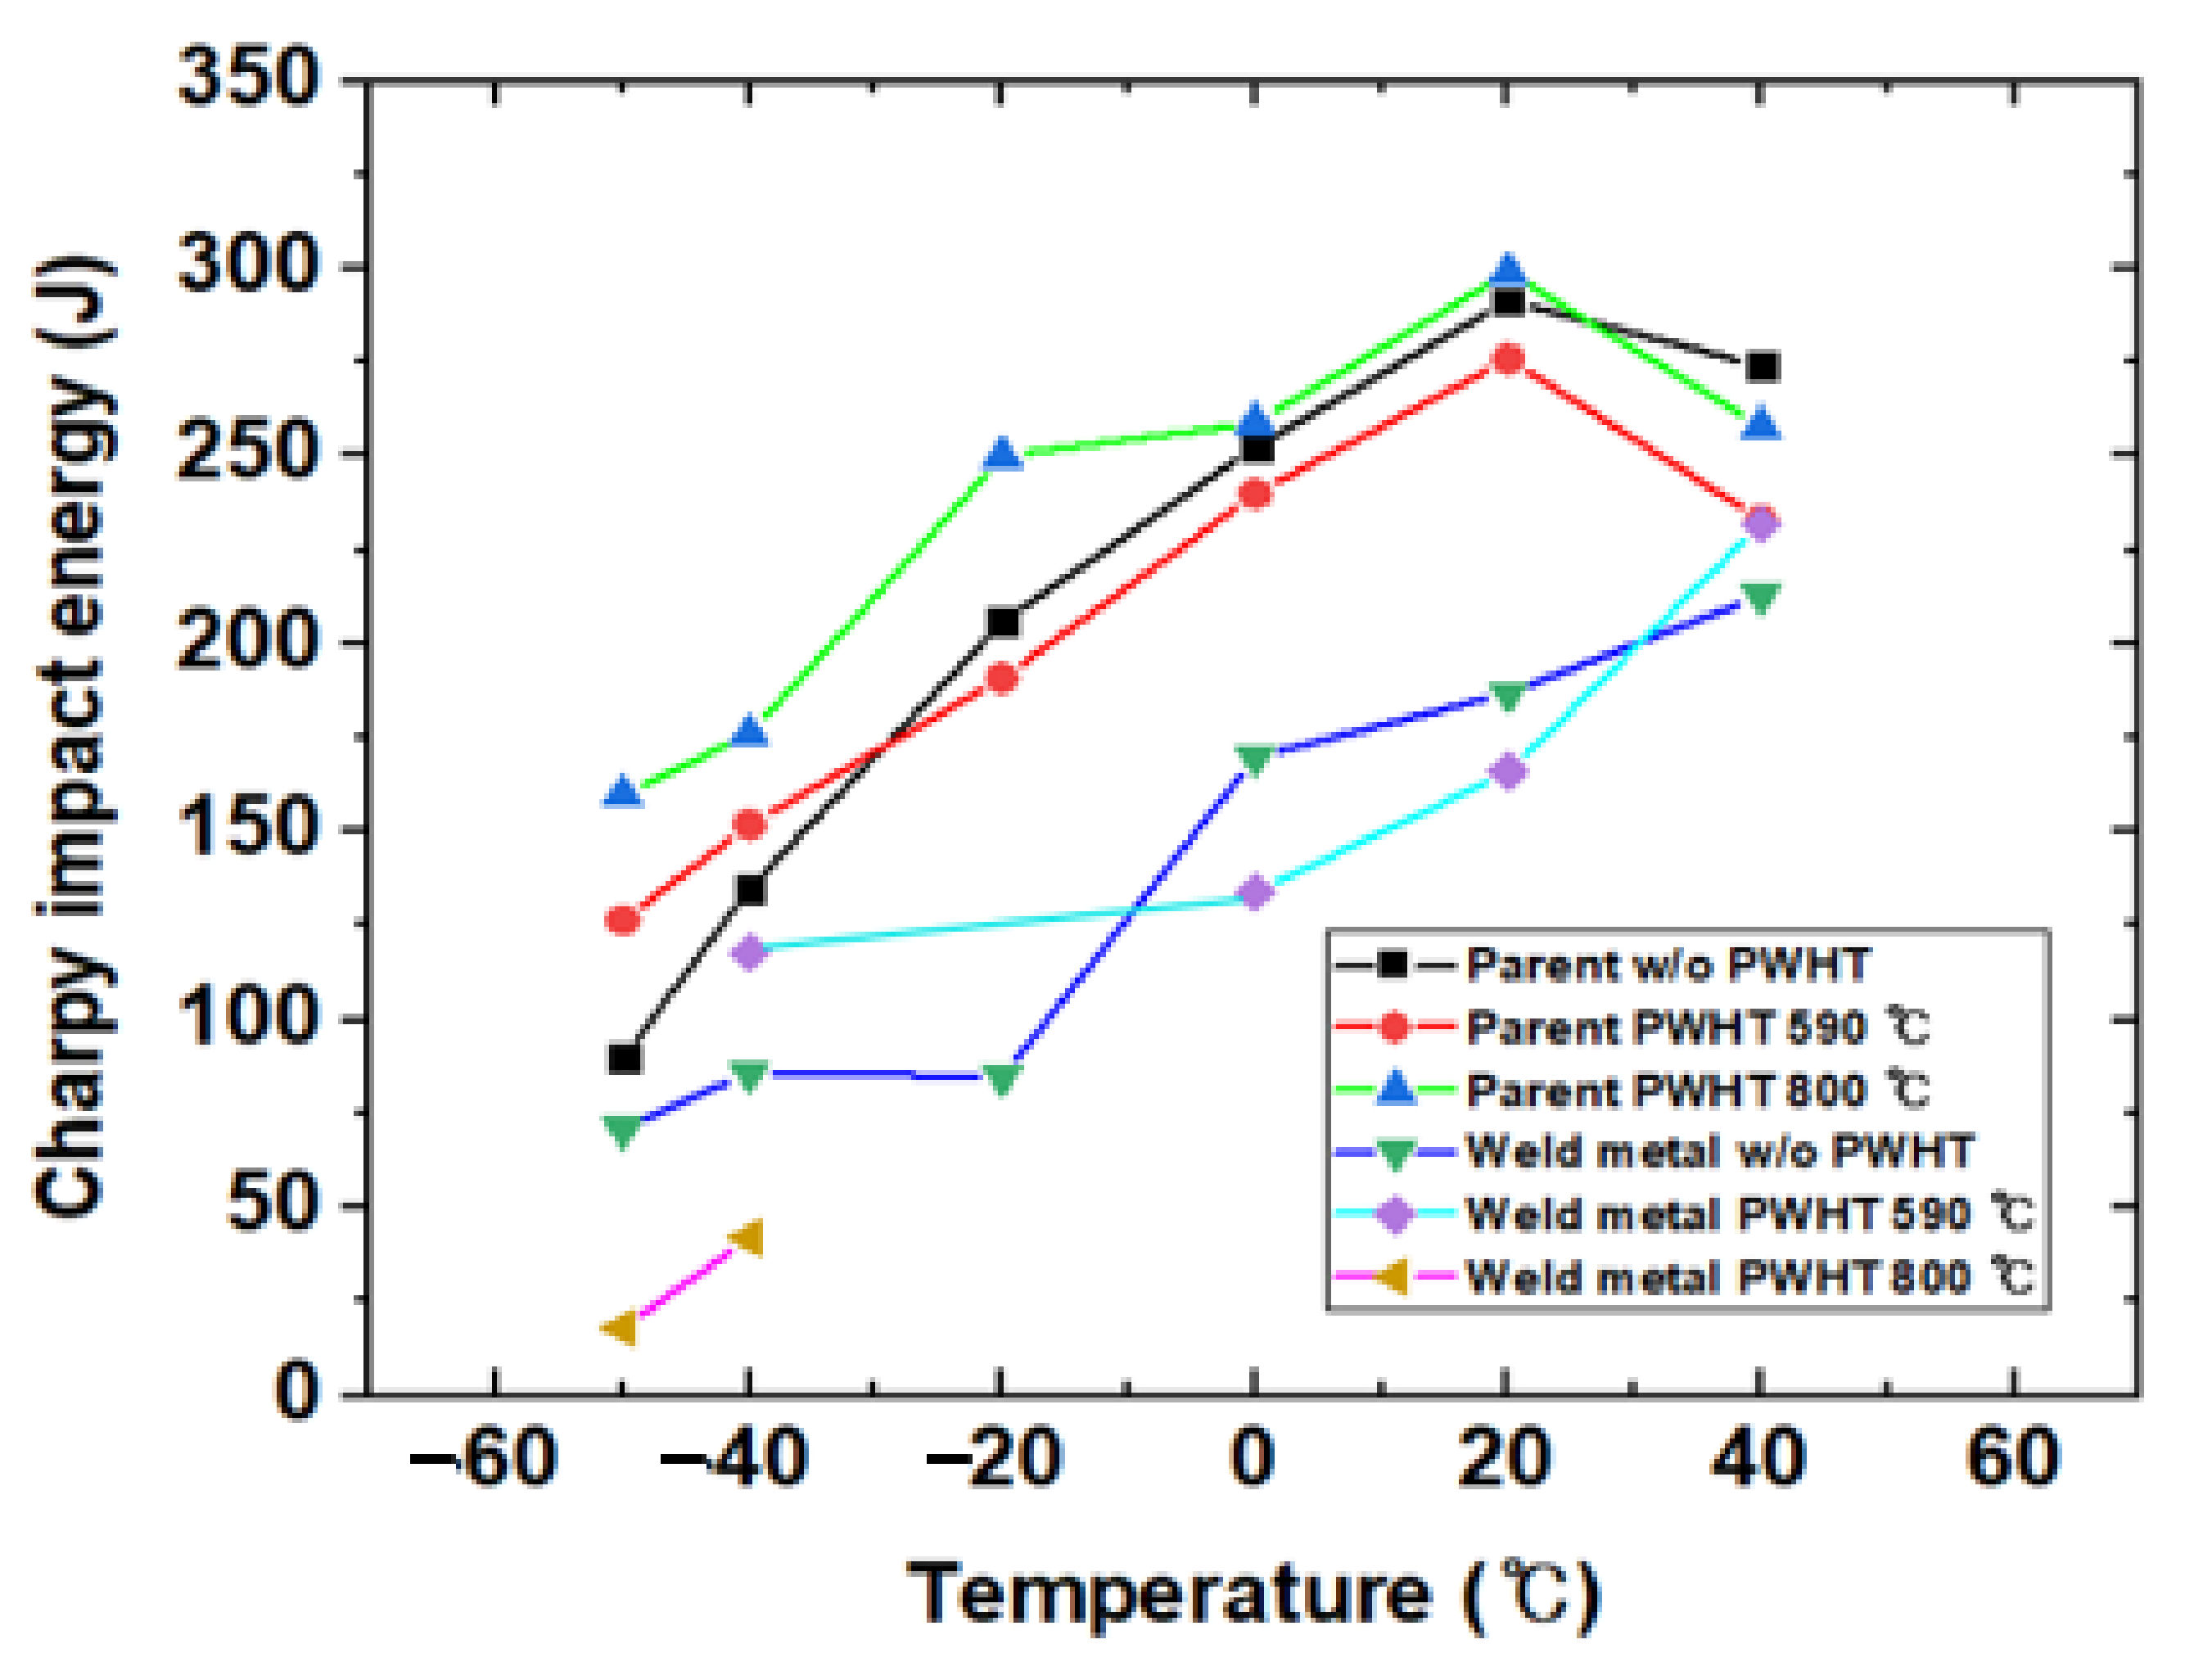
Figure 16.
Microstructures (×200). (a) Parent material, non PWHT; (b) HAZ, non PWHT; (c) parent material, PWHT at 590 °C; (d) HAZ, PWHT at 590 °C.
Figure 16.
Microstructures (×200). (a) Parent material, non PWHT; (b) HAZ, non PWHT; (c) parent material, PWHT at 590 °C; (d) HAZ, PWHT at 590 °C.
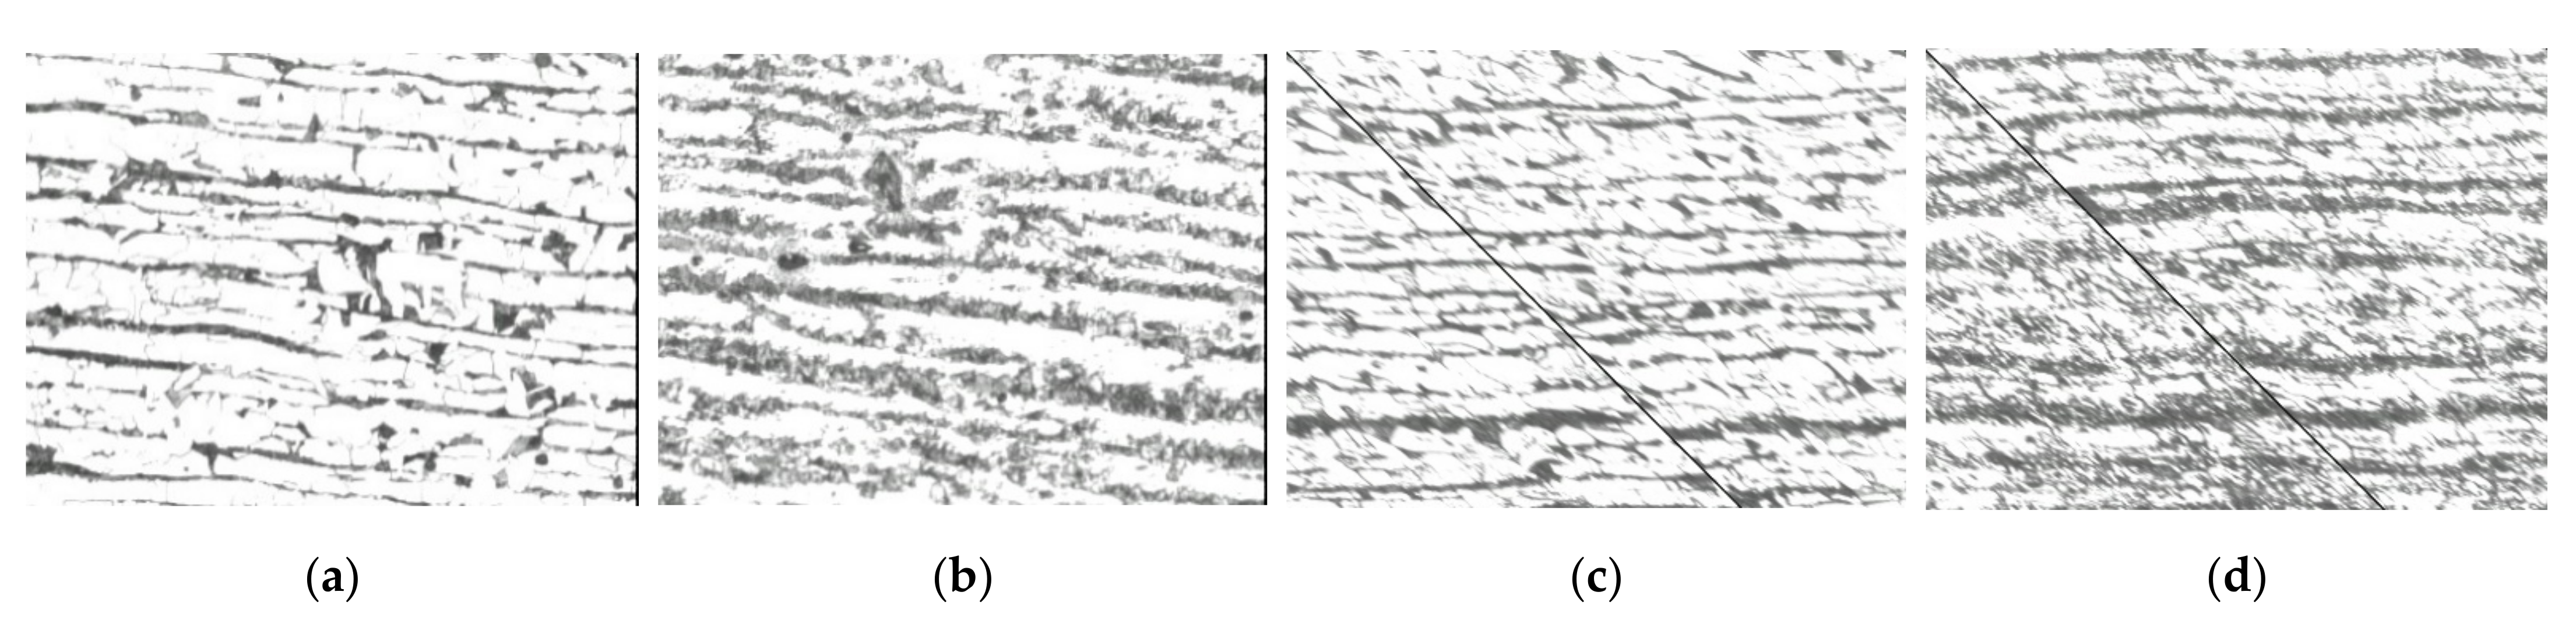
Figure 17.
Micro hardness distribution, AAN: non PWHT, AAY: PWHT at 590 °C. (a) −1 mm deep; (b) −5 mm; and (c) −9 mm.
Figure 17.
Micro hardness distribution, AAN: non PWHT, AAY: PWHT at 590 °C. (a) −1 mm deep; (b) −5 mm; and (c) −9 mm.

Figure 18.
Tensile curves. BMY: parent, PWHT at 590 °C; BMN: parent non PWHT; AAY: Butt weld, PWHT at 590 °C; AAN: butt weld, non PWHT; GAY: butt weld, ground and PWHT at 590 °C; GAN: butt weld, ground and non PWHT.
Figure 18.
Tensile curves. BMY: parent, PWHT at 590 °C; BMN: parent non PWHT; AAY: Butt weld, PWHT at 590 °C; AAN: butt weld, non PWHT; GAY: butt weld, ground and PWHT at 590 °C; GAN: butt weld, ground and non PWHT.

Figure 19.
Comparison of S-N curves. (a) Comparison between BMN and BMY; (b) comparison between AAN and AAY; (c) comparison between GAN and GAY; (d) comparison between AAN and GAN; and (e) comparison between AAY and GAY.
Figure 19.
Comparison of S-N curves. (a) Comparison between BMN and BMY; (b) comparison between AAN and AAY; (c) comparison between GAN and GAY; (d) comparison between AAN and GAN; and (e) comparison between AAY and GAY.

Figure 20.
Specimen cut by wire electrical discharge machining.

Figure 21.
Measured displacement normal to the cut surface.
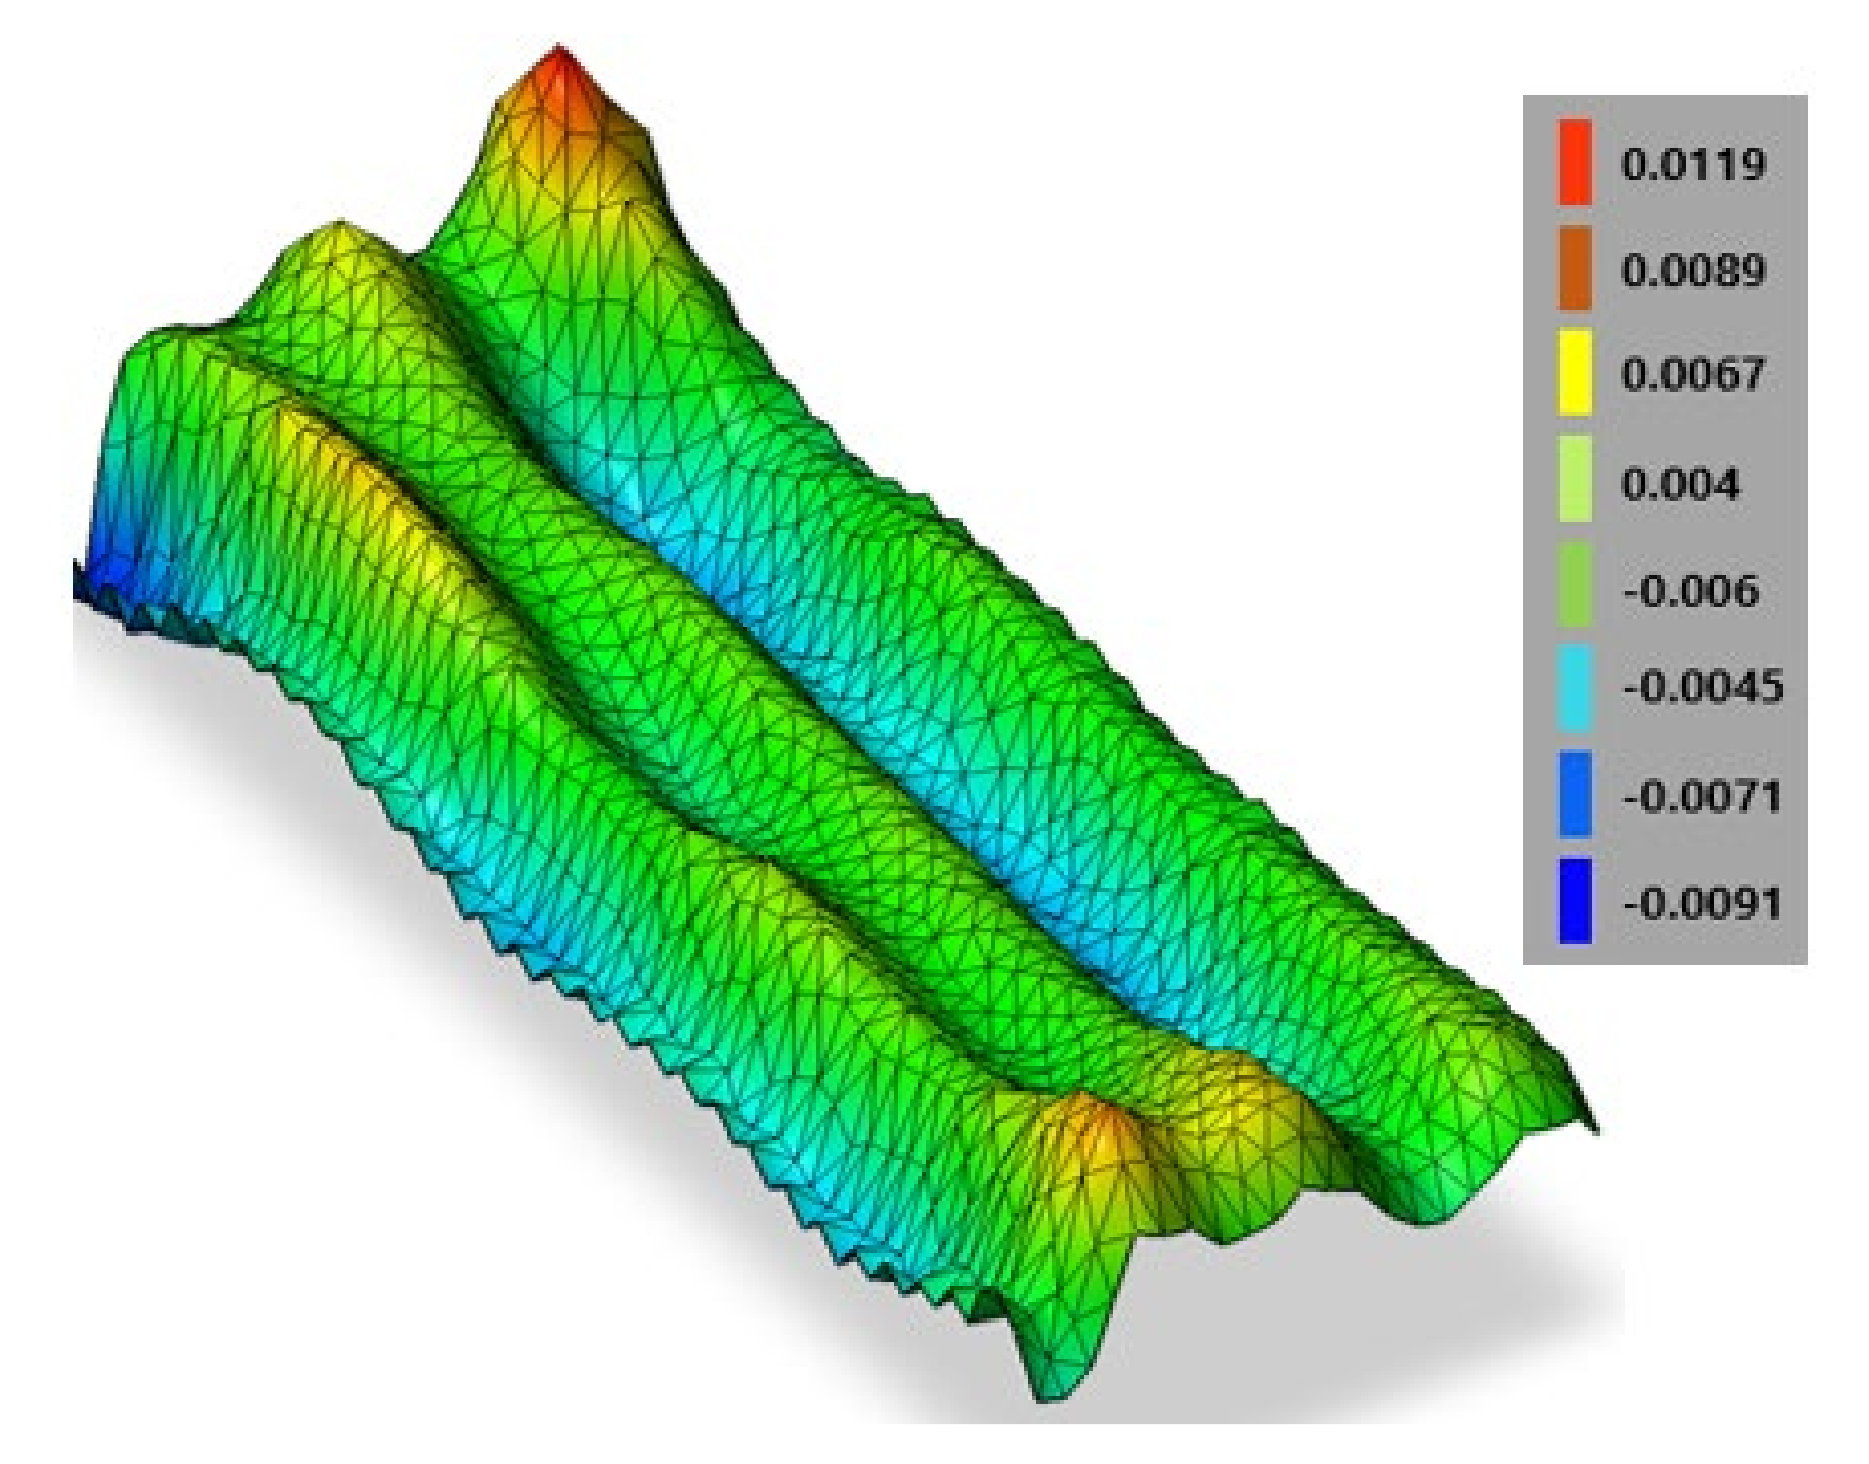
Figure 22.
Residual stress distribution in the right part of the specimen shown in Figure 20. (a) Max principal stress; (b) stress component normal to the cut surface.
Figure 22.
Residual stress distribution in the right part of the specimen shown in Figure 20. (a) Max principal stress; (b) stress component normal to the cut surface.
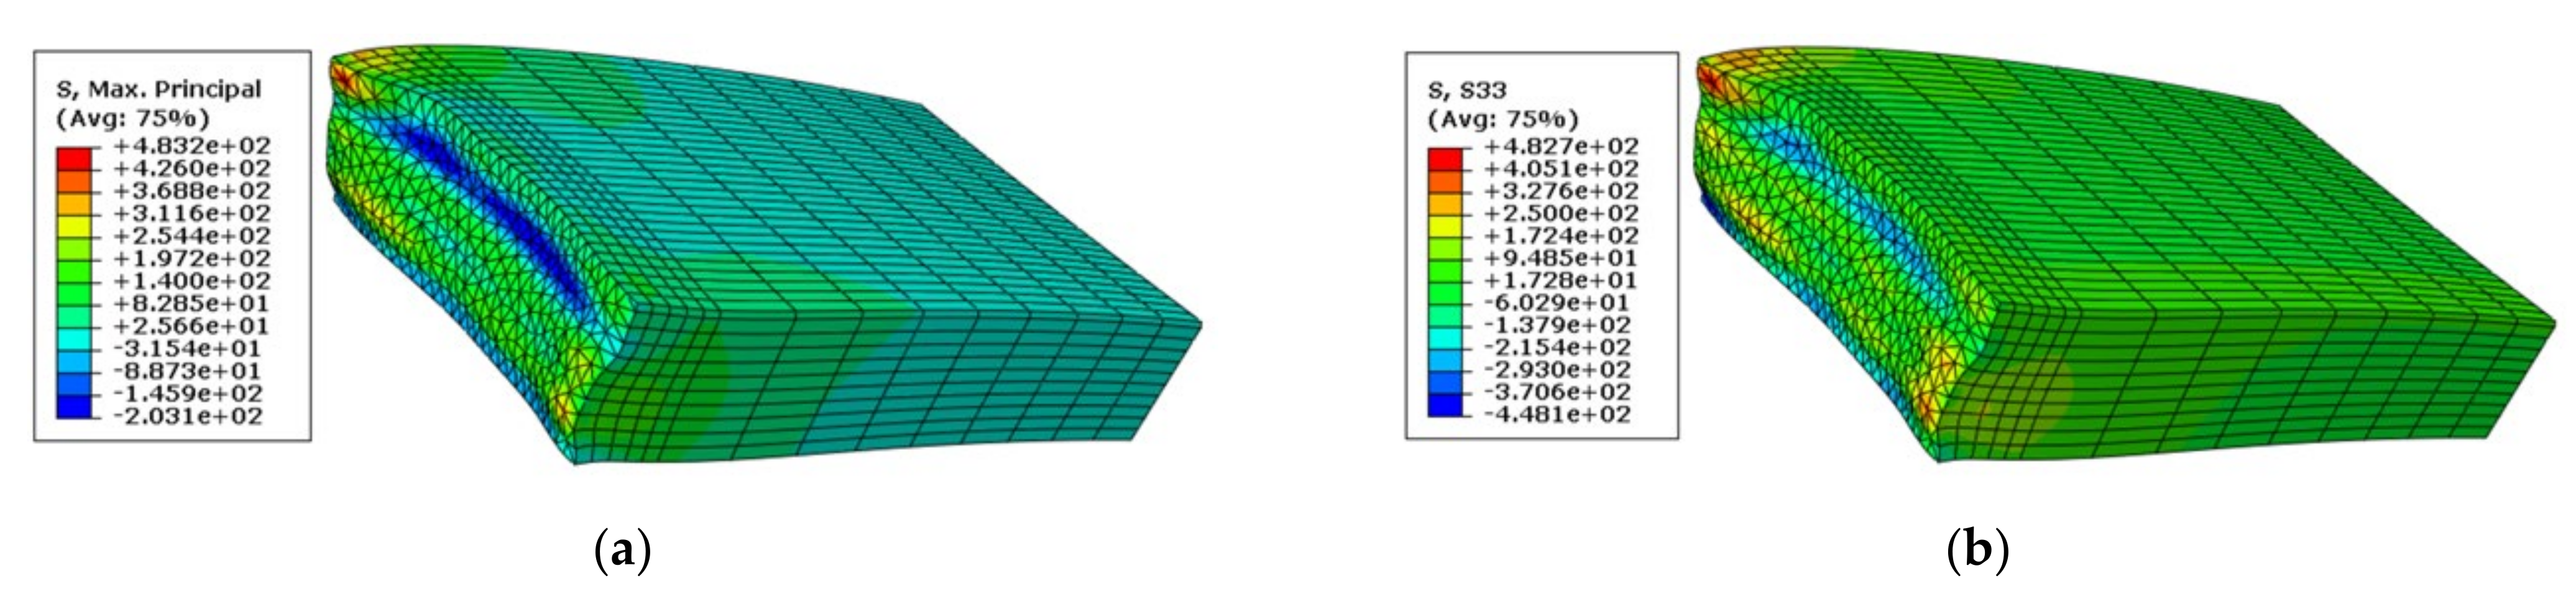
Figure 23.
S-N curves of real-size specimens.
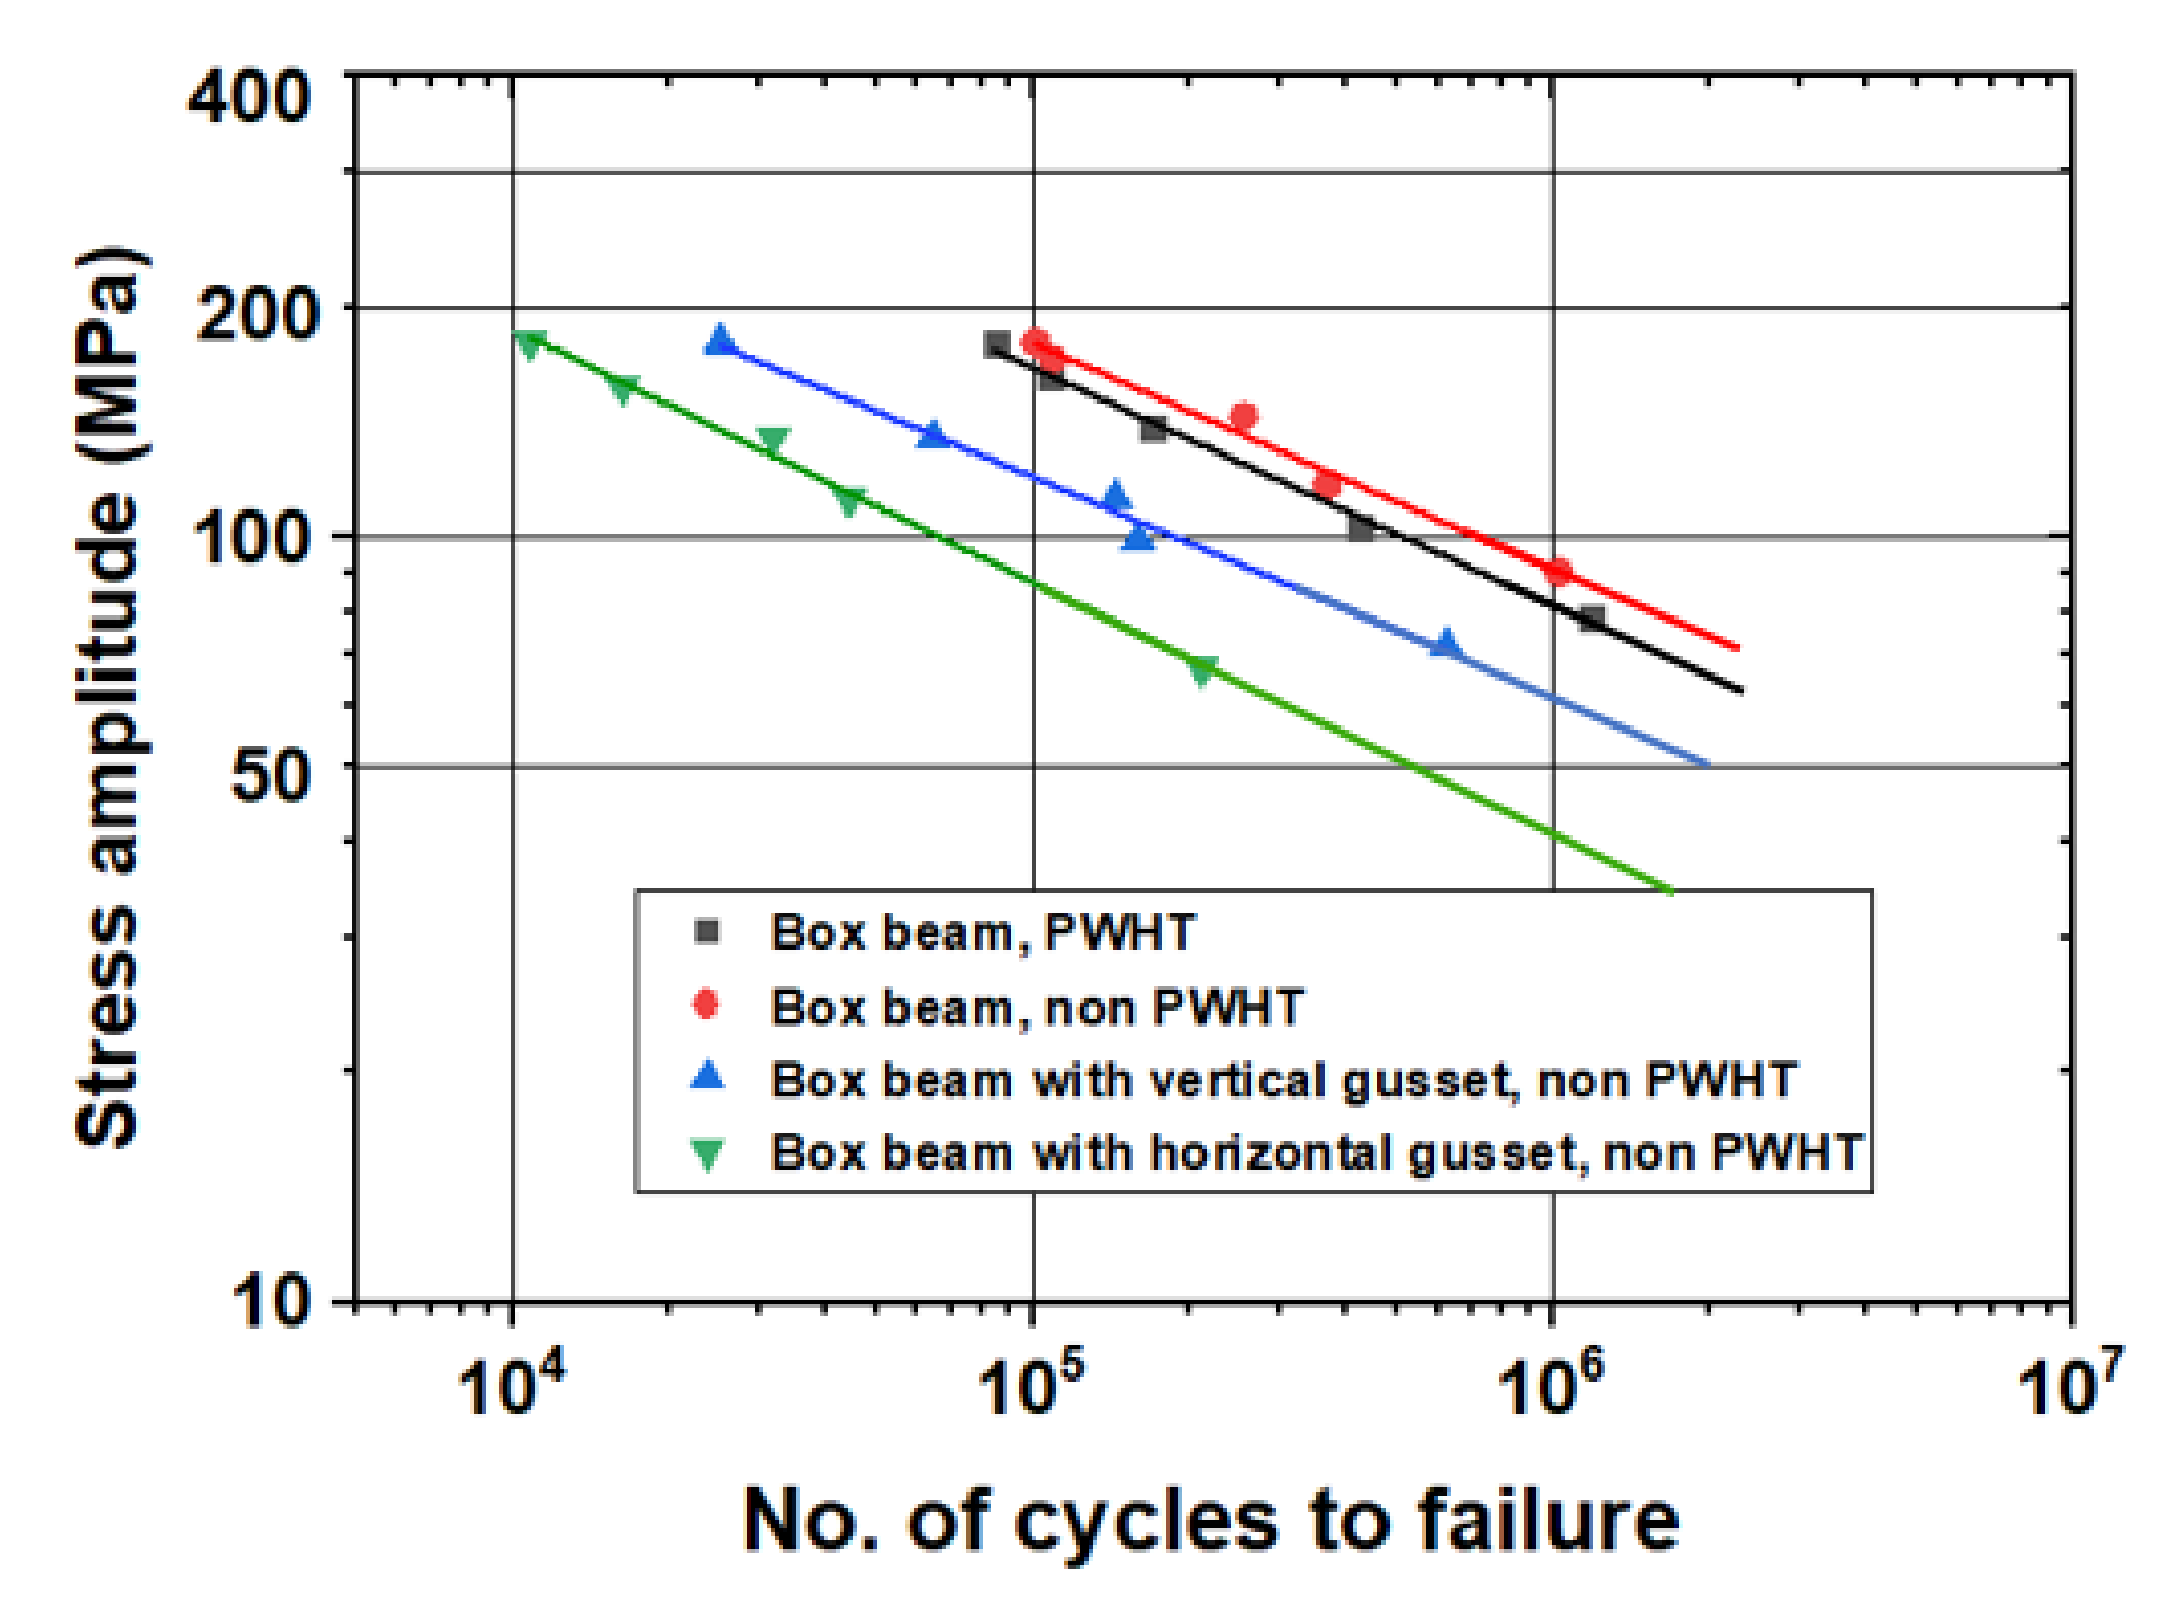
Figure 24.
Fatigue crack initiation and propagation of real-size beams. (a) box beam, non PWHT; (b) box beam, PWHT; (c) box beam V with a vertical gusset, non PWHT; (d) box beam H with a horizontal gusset, non PWHT.
Figure 24.
Fatigue crack initiation and propagation of real-size beams. (a) box beam, non PWHT; (b) box beam, PWHT; (c) box beam V with a vertical gusset, non PWHT; (d) box beam H with a horizontal gusset, non PWHT.

Table 1.
Yield strength, tensile strength, and elongation rate of the parent material.
| Item | Parent Material as Welded | Parent Material Heat Treated at 590 °C | Parent Material Heat Treated at 800 °C | ||||||
|---|---|---|---|---|---|---|---|---|---|
| Specimen | No. 1 | No. 2 | No. 3 | No. 1 | No. 2 | No. 3 | No. 1 | No. 2 | No. 3 |
| (MPa) | 364 | 363 | 366 | 356 | 355 | 354 | 310 | 323 | 322 |
| (MPa) | 522 | 524 | 524 | 509 | 506 | 511 | 475 | 479 | 482 |
| (%) | 24.0 | 23.9 | 23.4 | 26.8 | 24.3 | 28.7 | 26.2 | 26.6 | 25.2 |
Table 2.
Yield strength, tensile strength, and elongation rate of the HAZ material.
| Item | HAZ as Welded | HAZ Heat Treated at 590 °C | HAZ Heat Treated at 800 °C | ||||||
|---|---|---|---|---|---|---|---|---|---|
| Specimen | No. 1 | No. 2 | No. 3 | No. 1 | No. 2 | No. 3 | No. 1 | No. 2 | No. 3 |
| (MPa) | 366 | 366 | 359 | 327 | 335 | 332 | 310 | 314 | 305 |
| (MPa) | 529 | 521 | 522 | 506 | 511 | 510 | 478 | 480 | 478 |
| (%) | 25.1 | 16.8 | 13.3 | 24.8 | 24.8 | 26.3 | 19.8 | 24.8 | 19.9 |
Table 3.
Yield strength, tensile strength, and elongation rate of the weld metal.
| Item | Weld Metal as Welded | Weld Metal Heat Treated at 590 °C | Weld Metal Heat Treated at 800 °C | ||||||
|---|---|---|---|---|---|---|---|---|---|
| Specimen | No. 1 | No. 2 | No. 3 | No. 1 | No. 2 | No. 3 | No. 1 | No. 2 | No. 3 |
| (MPa) | 442 | 449 | 448 | 385 | 413 | 393 | 327 | 329 | 327 |
| (MPa) | 549 | 557 | 568 | 520 | 549 | 535 | 483 | 486 | 481 |
| (%) | 13.1 | 11.3 | 19.0 | 15.9 | 21.3 | 21.9 | 28.9 | 26.4 | 19.7 |
Table 4.
Vickers hardness maximum.
| Hardness Value (Hv) | Parent Material | HAZ | Weld Metal |
|---|---|---|---|
| As-welded | 170.0 | 193.3 | 192.0 |
| Heat treated at 590 °C | 143.1 | 180.7 | 196.9 |
| Heat treated at 800 °C | 139.8 | 150.1 | 175.2 |
Table 5.
Parameter values of the S-N curves (Log Δσ = a Log N + b).
| Specimen | a | b | Fatigue Strength at 2 × 10⁶ Cycles (MPa) | R2 (Coefficient of Determination) |
|---|---|---|---|---|
| BMN | −0.10848 | 2.83143 | 140.5 | 0.99 |
| BMY | −0.0940 | 2.74645 | 142.6 | 0.91 |
| AAN | −0.23124 | 3.35092 | 78.3 | 0.91 |
| AAY | −0.1734 | 3.04473 | 89.5 | 0.97 |
| GAN | −0.22232 | 3.31668 | 82.3 | 0.89 |
| GAY | −0.21682 | 3.26416 | 79.1 | 0.88 |
Table 6.
Parameter values of the S-N curves (Log Δσ = a Log N + b).
| Specimen | a | b | Fatigue Strength at 2 × 10⁶ Cycles (MPa) | R2 (Coefficient of Determination) |
|---|---|---|---|---|
| Box beam, non PWHT | 0.29716 | 3.74015 | 73.7 | 0.98 |
| Box beam, PWHT | 0.31092 | 3.77661 | 65.7 | 0.99 |
| Box beam V, non PWHT | 0.28614 | 3.50966 | 50.9 | 0.98 |
| Box beam H, non PWHT | 0.33162 | 3.59949 | 32.4 | 0.99 |
Publisher’s Note: MDPI stays neutral with regard to jurisdictional claims in published maps and institutional affiliations. |
© 2021 by the author. Licensee MDPI, Basel, Switzerland. This article is an open access article distributed under the terms and conditions of the Creative Commons Attribution (CC BY) license (https://creativecommons.org/licenses/by/4.0/).
Share and Cite
MDPI and ACS Style
Goo, B.-C. Effect of Post-Weld Heat Treatment on the Fatigue Behavior of Medium-Strength Carbon Steel Weldments. Metals 2021, 11, 1700. https://doi.org/10.3390/met11111700
AMA Style
Goo B-C. Effect of Post-Weld Heat Treatment on the Fatigue Behavior of Medium-Strength Carbon Steel Weldments. Metals. 2021; 11(11):1700. https://doi.org/10.3390/met11111700
Chicago/Turabian StyleGoo, Byeong-Choon. 2021. "Effect of Post-Weld Heat Treatment on the Fatigue Behavior of Medium-Strength Carbon Steel Weldments" Metals 11, no. 11: 1700. https://doi.org/10.3390/met11111700
Note that from the first issue of 2016, this journal uses article numbers instead of page numbers. See further details here.