Abstract
Brazing joints of Ti/Ti under ultrasonic vibration (USV) and compression load were investigated using optimized and modified filler alloys of Al-Si-Cu-(Ni)-(Sr) group prepared in the lab. Preliminary trails at semisolid to liquid states were conducted using the ready Al-Si-Cu-(Mg) alloy as a filler, then the brazing cycle was redesigned and enhanced according to the microstructural observations of the produced joints. USV assisted brazing at the semisolid state of low solid fraction was able to produce joints with round silicon morphology and granular , while at a high solid fraction, USV was only able to affect the silicon and intermetallic particles. Applying a compression load after ultrasonic vibration, at a designed solid fraction, was proved to be a successful technique for improving the quality of the joints by reducing the porosity, enhancing the soundness of the joint, and the diffusion at the interface. Based on alloy composition and the improved brazing cycle, joints of thin intermetallic layer and high shear strength (of 93 MPa average value) were achieved. The microstructures and the mechanical behavior were discussed based on the filler compositions and brazing parameters.
1. Introduction
In the previous work [1], a detailed insight into a brazing process that combined initial load and ultrasonic vibration (USV) was presented. That study included the distribution of the acoustic pressure within the filler at brazing temperature; the effect of the initial load, USV, and Si percent on the interface; and the resulted microstructures at multiple brazing conditions/filler materials. Within the experimental conditions of the brazing process [1], ultrasonic vibration led to reducing the size and number of the primary silicon particles. However, the brazed joints using Al-13Si were characterized by an acicular morphology of the eutectic silicon and a long needle morphology of Fe intermetallic as a result of the low cooling speed and filler composition. To address those microstructures issues, modified filler alloys and/or optimized brazing cycle should be considered, where the formation of the harmful phases can be reduced or eliminated.
In pure titanium, the transformation occurs after . Following the binary phase diagrams for Ti with other elements, alloying elements shift this temperature and stabilize the allotropic forms or to either higher or lower temperatures. Brazing at low temperature, lower than the transformation temperature, and lower than any heat treatment temperature of the base metal, is a preferred choice for brazing the thin-wall structures [2]. During the application of ultrasonic vibration (USV) a fast breakage of the oxide layer takes place combined with an enhanced movement of the molten filler [3,4,5]. Using ultrasonic vibration as an assisted tool in brazing adds more complexity to the ordinary brazing process, this complexity comes from the interaction between the paraments of USV and the ordinary brazing parameters such as the filler thickness and the temperature. Although reducing filler thickness usually is favorable in brazing, for effective and defect-free ultrasonic-assisted brazing, there is an optimal ratio between the filler thickness and the vibration amplitude which was proved experimentally and numerically [1,6,7].
The formation of sharp edges and coarse microstructures in Al-Si alloys affects their mechanical properties. Si particle fracture is the most common form of damage development in Al-Si alloys. Cast Al alloys with low ductility are observed to have coarse and elongated Si particles, which promotes fast damage evolution [8,9]. The addition of elements such as Sr, Na, Ba, and Ca is found to modify the coarse acicular eutectic Si into the fibrous form [10,11]. Several mechanisms were proposed and discussed on modification of Si by Sr, such as the impurity induced twinning model and restricted growth theory [12]. The addition of Sr to Al-Si alloys increases the strength slightly by modifying the eutectic silicon and reducing the presence of the primary silicon [13,14]. After Sr addition (0.25%) to the composite of Al-9.6Si-2.2Cu-0.25Mg-0.8Fe alloy/ [15] the eutectic silicon particles were spheroidized and particles were changed from plate to globular, as well as, both of them were homogeneously distributed.
The strength of the filler itself is one of the factors that affect the overall joint strength especially for the joint with a relatively wide joint gap. In aluminum alloys, adding the transition alloying elements such as Cu, Ni is an effective way to improve the strength for high-temperature applications [16]. The addition of Cu to aluminum alloys is used to achieve high-performance alloys that are often used for aerospace and aircraft applications. High percent Cu in brazing alloys did not produce an acceptable strength [17]. Therefore, hypoeutectic Al-Cu alloys with a relatively low percent of Cu should be considered. The addition of Ni increases the alloy strength, on the other side, the melting point starts to increase noticeably after passing the eutectic point 2.7 wt.% [18]. Moreover, the excess addition of Ni has no effect or negative effect on the strength of the alloy. Therefore, the addition of Ni should be limited according to the designed melting temperature of the filler alloy and by considering the contribution of the alloy bulk properties on the joint strength.
According to Yang et al. [16], by increasing Cu content, Ni-rich phases participated as γ-phase, the highest strength was for the alloy (Al-12.87Si-5.45Cu-0.19Fe-0.2Mn-1.04Mg-1.83Ni-0.114Ti-0.0052P), where the ratio of Cu to Ni is around 3. The addition of Ni to Al increased the tensile strength and the hardness but decreased the elongation. For the wear rate, the addition of Ni up to 3% decreased it, then the rate was increased for further additions of Ni. This behavior was attributed to the tendency for embrittlement and microcracking caused by the hard fibrous intermetallic [19].
Although, adding Sr increased porosity in Al-Si-Cu alloy [20,21]. Sr addition (around 96 ppm) to 319 alloy resulted, through the increased number of silicon particles available as nucleation sites, in increasing the portion of the blocky and causing porosity, Nevertheless, the application of USV which is a part of the brazing process in this work was proved as an effective tool in reducing the porosity in aluminum alloys including Al-Si-Cu alloys [22].
During aluminum casting, the formation of the intermetallic compounds may be coincident with porosity. Some intermetallic compounds favor the formation of shrinkage porosity by blocking the interdendritic feeding channels, for instance, , or in hypoeutectic Al-Si alloys [23]. Shrinkage porosity can also be found as scattered microshrinkage or microporosity in the interstices of dendritic solidification zones. This kind of shrinkage porosity is observed in alloys of a large melting range [24]. Since the brazing joint is composed of multiple components and usually surrounded or fixed within a complex combination of materials, the solidification of the joint under a proper load could improve the joint quality and reduce the possible defects that might be developed during solidification.
To control the formation of the intermetallic at the interface and to avoid or reduce the formation of the harmful microstructures in the joint, the brazing time-temperature cycle should be carefully optimized. It was found that brazing temperature around the solidus point has less effect on the formation of the harmful microstructures within the joint, in addition, the formed intermetallic at the interface was minimum at relatively high Si content [1]. Holding at the liquid state of the filler increases the loss of the filler outside the joint and could damage the microstructures of the joint which are obtained after the USV treatment.
Following all the mentioned issues and considerations, two Al-Si-Cu-(Ni)-(Sr) filler alloys were produced in the lab and tested, along with the alloy Al-3Cu-9Si-(Mg), under a variety of brazing conditions. First, ultrasonic-assisted brazing followed by compression load was investigated at different solid fractions using the filler Al-3Cu-9Si-(Mg). Then brazing cycle was optimized to combine liquid and semisolid brazing conditions. Using the optimized brazing cycle, the fabricated filler alloys from Al-Si-Cu-(Ni)-(Sr) alloys system were tested under multiple conditions. The effects of the loads and the USV were evaluated at selected solid fractions of the filler alloys. The additions of Ni and Sr in the Al-Si-Cu-(Ni)-(Sr) filler system were evaluated and the resulted microstructures, interface reactions, and strengths were discussed.
2. Materials and Methods
2.1. Preparation of Bulk Filler Alloys
For producing the required filler alloys, master alloys of Al-Ni, Al-Cu binary systems were first prepared in the lab from their pure elements, while Al-13Si alloy was cut from its ingot, remelted, and degassed. An electrical resistance furnace equipped with a PID temperature controller was used for melting processes under a normal air atmosphere. An additional electric furnace was used for heating the mold. External K-type thermocouples and an NI–9211 temperature input module from National Instruments were used for temperature readings (for the mold and the melt). The master alloys Al-Cu and Al-Ni were prepared by melting their pure elements in a crucible of zirconia stabilized with magnesia at temperatures 750–800 °C and 850–900 °C, respectively. After each melting process and before pouring, the alloys were degassed for around 10 min, gentle stirring was applied from time to time for a few seconds. To increase the cleanness of the master alloys, they were re-melted two times. At the end of each melting process, a degassing process was performed. After casting, the casted alloy was removed from the mold and cooled by compressed air followed by water.
With the proper additions of pure aluminum, two filler alloys were then prepared using both the prepared and available master alloys. The prepared filler alloys were Al-9Si-4Cu and Al-8Si-4Cu-2Ni with the addition of (0.02–0.026) wt.% Sr. No Ti was added to the filler alloys during the preparation nor ultrasonic treatment was applied since Ti tends to dissolve during the USV treatment using the available Ti-6Al-4V sonotrodes [25]. The commercial Al-9Si-3Cu-(Mg) alloy was used as it is (only degassed). Al-9Si-3Cu-(Mg) has a composition near to the fabricated alloys but with a higher percent of Fe, Mg, and a few minor elements without Sr. The filler alloy preparation ended with a 10 min degassing by Ar and then pouring from 720–730 °C in a 200 °C mold. After pouring directly, the mold (with the cast) was immersed in a tap water container. Table 1 presents the composition of the master alloys, while Table 2 presents the composition of the final filler alloys, where F0, F1, and F2 were used as a simple coding for the filler alloys. The microstructures of the master and filler alloys are shown in Figure 1 and Figure 2, respectively.

Table 1.
Compositions of the master alloys.
Table 2.
Compositions of the filler alloys (wt.%).
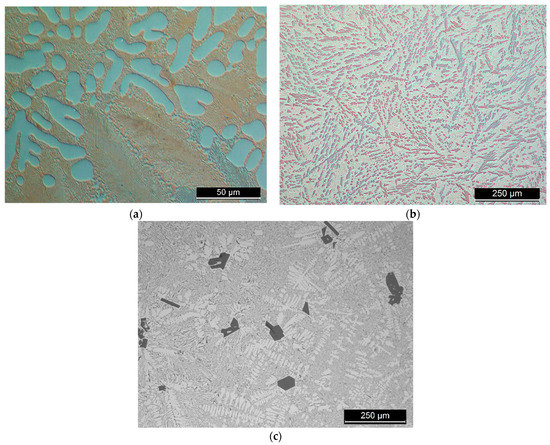
Figure 1.
Light microscope images of the master alloys, (a) Al-27Cu; (b) Al-16Ni; (c) Al-13Si.
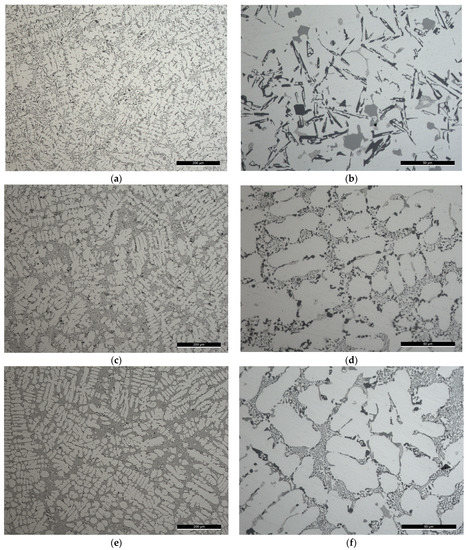
Figure 2.
Light microscope images of the filler alloys where: (a,b) The degassed filler alloy Al-9Si-3Cu-(Mg) or F0 from its ingot; while the prepared filler alloys from the master alloys are Al-9Si-4Cu-(Sr) or F1 filler alloy in (c,d); and Al-8Si-4Cu-2Ni-(Sr) or F2 filler alloy in (e,f). The scale on the figures (a,c,e) is , while on (b,d,f) is .
2.2. Preparation of the Brazing Assembly
The filler materials slices were cut and prepared from the casts with a thickness of and dimensions of for F1 and F2 alloys, and for F0 alloy (except for F0-4 and F0-5 brazing conditions). The base metal parts of were cut from a sheet of titanium (Al-6Al-4V). The active joint side/part is the parent metal part which is connected to the sonotrode. More details about the lap joint assembly, the preparation process, and the filler form can be found in [1].
2.3. Fillers and Joints Characterization
The chemical compositions of the filler alloys (Table 2) were determined using SPECTROMAXx optical emission spectroscopy (SPECTRO, AMETEK Materials Analysis Division). A standard sample with accurate composition was used for further calibration of the measurements.
JSM-6010LV (JEOL, Japan) Scanning Electron Microscope (SEM) equipped with an energy dispersive spectroscope (EDS) (INCAx-act, PentaFET Precision, Oxford Instruments) was used for microstructures characterization of the joint’s cross-section and the chemical composition analyses of the phases. EDS analysis at the largest possible radius was conducted also to verify the composition of the master alloy that could not be measured with the mentioned optical emission spectroscopy. Tensile tests were carried out at room temperature using Universal Testing Machine (INSTRON-Model 8874, MA, USA) with 1 mm/min strain rate. The shear strength of each single-lap joint was calculated by dividing the ultimate strength on the actual brazed area. During the test, spacers were fitted to the two ends of the tested joint at the clamping areas. An image processing package Fiji (ImageJ, 1.53 k, National Institutes of Health, Bethesda, MD, USA) was used for any further related measurements.
After the brazing process, the brazed joints were cut at the middle (approximately 0.5 mm around the centerline), The sectioned samples for the microstructure and chemical analyses were ground using a series of increasingly fine SiC papers up to P4000 and then polished with polycrystalline 1 µm diamond suspension followed by 0.02 µm of colloidal silica. All the samples were ultrasonically cleaned. A light microscope LEICA DM 2500 M (Leica Microsystems, Germany) was used for the evaluationevaluation of the microstructure and for observing the cleanness of the bulk filler alloys and master alloys. A part of the samples used for microstructure characterization by light microscope was etched using Keller’s reagent and anodized using a solution of 1.25% fluoroboric acid in distilled water.
2.4. Experimental Set-Up
The brazing trials were done using a special experimental brazing apparatus. Using this apparatus, load and temperature were real-time monitored and controlled. In addition, any expansion in the pressing mechanism parts or any change in the filler state during the brazing cycle were detectable and recorded along with the corresponded time and temperature. All the parts including the brazing assembly were calibrated to a horizontal position. The unloaded ultrasonic stack delivers 17–20 µm (P–P) at its free end (the end of the sonotrode) at room temperature (without attaching the active part of the base metal). More details about the brazing equipment, the vibration behavior, and the acoustic pressure were reported elsewhere [1]. Figure 3 shows a detailed schematic diagram of ultrasonic brazing equipment with the sample.
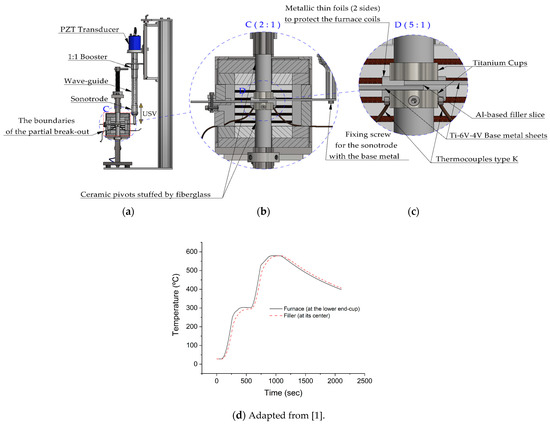
Figure 3.
Detailed schematic diagram of the ultrasonic brazing device shows (a) Ultrasonic stack parts; (b) and (c) The position of the brazing assembly in the furnace and further details of the brazing assembly; (d) A temperature-time cycle (thermal cycle) (adapted from the authors’ previous work [1] since the conditions are identical) measured at the lower end-cup and within the filler Al-9Si-3Cu without USV. The filler temperature was measured using a K-type thermocouple, Ø 0.25 mm, of a special error range (0.4%).
2.5. Cooling Curves and Solid Fraction Calculation
The remelted quantities for cooling curves recording were not re-treated by Ar. The temperature measurements were done using thermocouples type K of 0.25 mm diameter of a special error range (0.4%). Then, the first and the second cooling curves derivatives were calculated (Figure 4) and the important points during solidification were accordingly determined (Table 3).
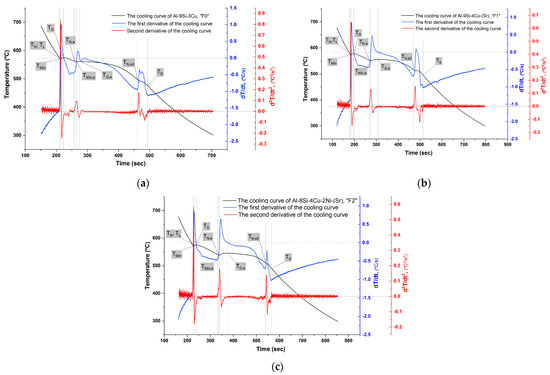
Figure 4.
The cooling curves of the filler alloys: (a) F0; (b) F1; and (c) F2.
Table 3.
The main solidification stages of the fillers F0, F1, and F2 in Figure 4.
In the formation of Al-Si eutectic, the nucleation temperature , the minimum temperature , and the growth temperature decreased by the addition of Sr and further decreased by the addition of Ni. In all filler alloys, the undercooling temperature and time did not change. However, the nucleation temperatures were lower than the growth temperatures in the modified filler alloys F1 and F2 by Sr addition. Both the recalescence temperature and recalescence time increased from 1 6 7 °C and from 9 33 35 s for F0, F1, and F2, respectively. The clear change in recalescence characteristics between F0 and the modified fillers alloys F1 and F2 shows that Sr addition affected the growth stage of Si and its morphology which was changed to the fibrous one [26,27,28,29].
The solidification of Al-Si-Cu alloys (without any other additions) starts with the Al dendrite crystallization , followed by the eutectic reaction , and ended by second, ternary eutectic reaction . These main reactions can be recognized by the three summits on the first derivative curve of the cooling curve. When other typical element additions (of relativity a small amount) exist in Al-Si-Cu alloys, the general shape of the curves (the cooling curve and its first and second derivatives) will show further variations and shifting, without essential change in the general shape especially the first and the second peaks. Adding Ni might result in shifting of to the end of reaction favoring the formation of by the presence of sufficient Cu. When adding Mg, the solidus temperature would be lower than in the original alloy since Mg forms complex intermetallic of Al-Cu-Mg-Si as the last stage of solidification [30,31].
Since the iron has low solubility in solid , it tends to combine with other elements to form intermetallic phase particles of different types. Whenever there is sufficient manganese, the phases (script-like) (platelets morphology) that form in Al alloys with the presence of Si and Fe change to [32]. The intermetallic phase with script-like morphology was observed in the Al-9Si alloys with an addition of 0.5 wt.% Mn [33]. In unmodified, non-grain refined hypoeutectic Al-(5,10)Si-1Cu-0.5Mg alloys, it was found that solidified prior or after or as the initial component of the ternary eutectic with aluminum and silicon according to iron and silicon content of the alloy [34]. The presence of the phase negatively affects the tensile strength and elongation since it is much more easily prone to fracture under tensile load than the aluminum matrix or the modified silicon particles, while phase has less detrimental effects on the mechanical properties [35].
In the semisolid processes, reliable information concerning the solid fraction is necessary to characterize the solidification process in casting [36,37,38] or the semisolid brazing process [39,40,41]. The Newtonian method [42,43,44,45] was used for calculating the solid fraction using a single thermocouple. The Newtonian model assumes that the temperature gradients are negligible inside of the system, in addition, the heat conduction inside the mass is much faster than the heat lost from its surface by convection (lumped system). The temperature-dependent variable that stays in the heat balance equation is the overall heat transfer coefficient.
During the solidification of a casted metal within a mold, the metal is losing heat and its temperature is decreasing by during a time , the heat lost by metal is () where , , and are the volume of the casted metal, its density, and specific heat, respectively. While the mold temperature is increased to comparing with the ambient temperature or its initial temperature. The heat transferred to the mold is ()) where U is the heat transfer coefficient and A is the surface area. The heat balance equation for the (casted metal-mold) can be written as [42,43,44,45]:
where: is the heat generated by the phase transformation, is the latent heat of solidification.
By re-arranging the Equation (1) where the metal mass:
where the curve corresponding to Equation (2) is representing the cooling curve derivative and to Equation (3) is representing the Newtonian zero curve or the baseline. The total latent heat can be calculated by subtracting Equation (3) from Equation (2) and integrating the temperatures changes along with the solidification range from at ( to at (Figure 4):
The Newtonian zero curve was calculated by following the procedures in Figure 5 and Figure 6, then the solid fraction at each point during solidification (Figure 7) was found by finding the cumulative area between the cooling curve derivative and the zero curve from to the required point, then dividing it on the total mentioned area from to .
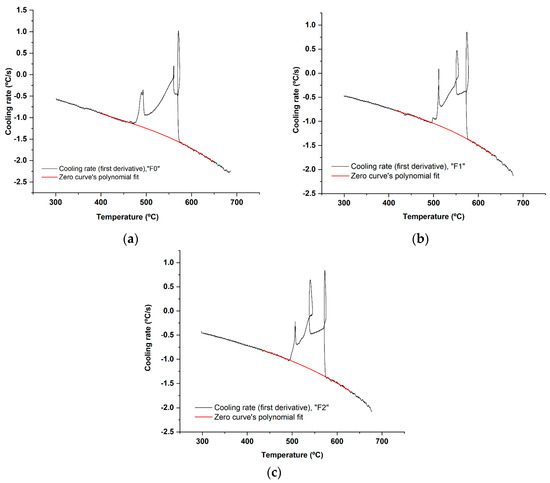
Figure 5.
The first derivative vs. temperature of the cooling curve and the fitted polynomial of the zero curve between the solidus and liquidus for each filler alloy: (a) F0; (b) F1; and (c) F2. The resulting regression equation was used to calculate the baseline (zero curve) [43], at all temperature points in Figure 6.
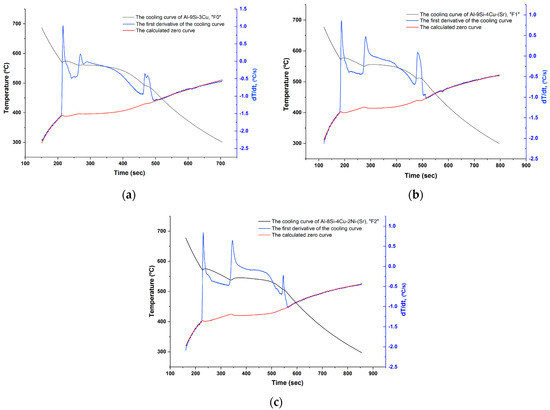
Figure 6.
First derivative of the cooling curve and the calculated base line (zero curve) for each filler alloy: (a) F0; (b) F1; and (c) F2.
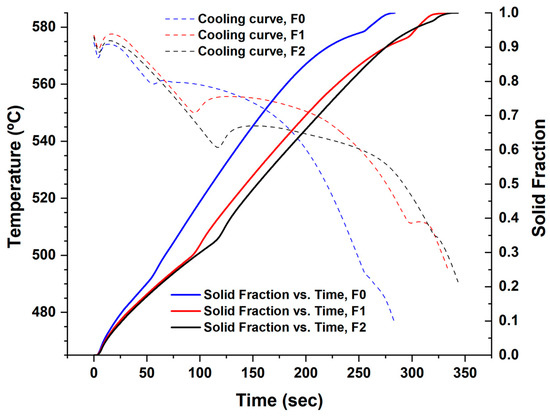
Figure 7.
Solidification of the filler alloys F0, F1, and F2 (the time was standardized for all the filler alloys).
2.6. Brazing Methods and Conditions
In this work, brazing was tested according to two main cycles, F0 filler alloy was tested according to the first brazing cycle, while F1 and F2 filler alloys were tested according to the second one. The first cycle (Brazing cycle A, Figure 8a) included the application of USV at semisolid states starting with a high solid fraction (at 550 °C) and ending at the liquid state (at 580 °C) to examine the effectiveness of USV on the joint properties at different solid fractions. To re-establish the soundness of the joint after disturbing the filler at a semisolid state and improve joint filling, a compression second load (Table 4) was applied directly after USV. In addition, the same load value was applied after a small temperature interval after brazing at the liquid state for the sake of comparison.
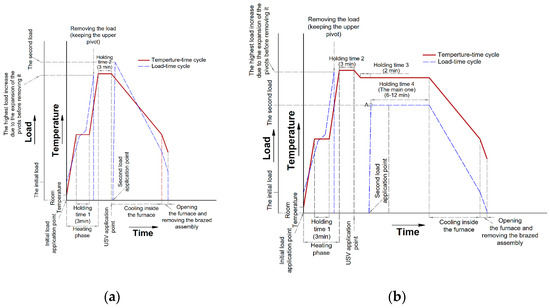
Figure 8.
(a) Brazing cycle A, where the load was applied directly after USV (except for F0-3, Table 4). The diagram shows a sketch for the observed load changes due to the expansion of the ceramic pivots including the titanium end cups (Figure 3), after application of the primary load, the load was not removed until it starts to decrease after passing the solidus temperature of the filler to prevent any displacement of the filler before reaching the USV application point, more details about this point can be found in [1]. The furnace was turned off after holding for 3 min and just before USV activation. Once the USV was stopped, a second load was applied; (b) Brazing cycle B where the second load was applied at a specific semisolid point lower and relatively far from the USV application point. Similar to Brazing cycle A in (a), no heating was applied from the furnace during USV. During the heating phase and before USV the holding times started −5 ◦C to the required temperature. Before the main holding time (holding time 4) in Brazing cycle B, another short holding time was imposed for 2 min (Holding time 3), the purpose was to stabilize the temperature and reach the required solid fraction before load application. At point “A” in (b), once the load is applied, it shows a slight and sharp decrease before it starts to increase slowly during the holding time 4.
Table 4.
Brazing trials parameters.
For further optimization and to understand the role of the second load, the filler alloy F0 that brazed at (565 °C), was brazed without load and with a reduced load of kg or 6 MPa pressure.
The second brazing cycle (Brazing cycle B, Figure 8b) was the optimized one based on the observations collected from the first brazing cycle and to correspond to circumstances mentioned in the introduction. The mechanical strength was evaluated for the second brazing cycle at different brazing parameters. In this last batch of trials, the lab-made filler alloys F1 and F2 were used and the applied pressure by the second load was varied from 8 to 16 MPa. Table 4 summarizes the parameters used in the brazing cycles A and B.
3. Results and Discussion
3.1. Results by Using Brazing Cycle A
At a high solid fraction (0.73–0.75) under F0-1 brazing condition, the followed brazing cycle (F0-1) was capable of affecting the eutectic silicon and the intermetallic compounds favoring the formation of the round morphology, but USV was not capable of refining the primary grains of Al (Figure 9a). Increasing temperature/reducing solid fraction enhanced the effect of USV. At higher brazing temperature (565 °C), USV was capable of refining the grains of Al (Figure 9b).
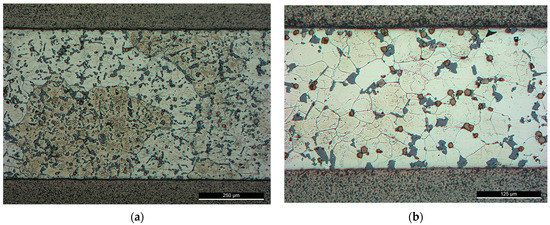
Figure 9.
Brazed joints using F0 filler alloy, brazing cycle A: (a) At 550 °C—brazing conditions (F0-1); (b) At 565 °C—brazing conditions (F0-2).
Although the primary grains were not affected by the USV at a high solid fraction ratio, the silicon was largely affected. The relatively round edges of the silicon and intermetallic compounds imply that partial melting may have happened around the affected phases in the aluminum matrix. Increasing the process temperature by 15 °C decreases the solid fraction largely from (0.73) at 550 °C to (0.18) at 565 °C which made the refining of Al grains possible. However, the applied load followed USV was large enough to affect the distribution of the intermetallic, i.e., increase the agglomeration of silicon and the intermetallic.
Brazing at a semisolid state reduces largely the intermetallic formation at the interface. The intermetallic at the middle of the interfaces was irregular and discontinue where the largest thickness did not exceed , nevertheless, increasing temperature to 565 °C increased the liquid portion and increased the interfacial interaction introduced by cavitation (Figure 10). In addition, ultrasonic-assisted brazing at a semisolid state was an effective method for avoiding the harmful microstructures and achieving better morphology of Si under the current brazing conditions compared with the brazing at liquid state which followed in [1]. Generally, compared with the original microstructures (Figure 2), more round intermetallic compounds and silicon particles were produced at brazing conditions F0-1 and F0-2, adding to that the round morphology of the aluminum grains in F0-2 (Figure 9). Table 5, Table 6, Table 7 and Table 8 show the EDS analyses results and the estimated phases for the corresponding points in Figure 10.
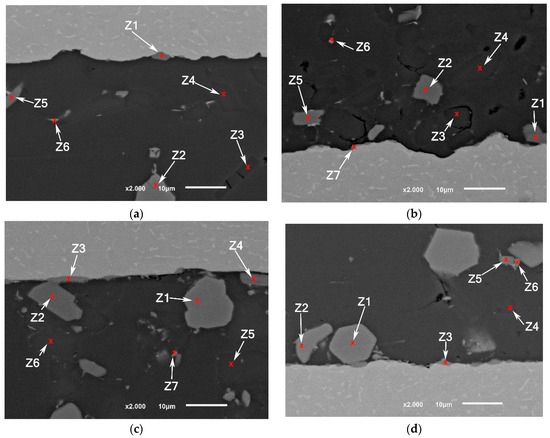
Figure 10.
SEM images (a,b) F0-1 brazed joints at 550 °C; (c,d) F0-2 brazed joints at 565 °C.
Table 5.
EDS points analyses (at. %) for Figure 10a.
Table 6.
EDS points analyses (at. %) for Figure 10b.
Table 7.
EDS points analyses (at. %) for Figure 10c.
Table 8.
EDS points analyses (at. %) for Figure 10d.
Although the samples were subjected to careful preparation for microscope observation and EDS analysis, it is possible to have some defects in the brittle phases such as breakage or detaching. Nevertheless, it can be noticed that the joints brazed at a higher solid fraction have a higher number of defects especially voids around several silicon particles compared with the joints brazed at higher temperature (Figure 10). Due to the short application of USV on a semisolid filler added to that the short total holding time at brazing temperature, the chemical composition of the intermetallic at the interface could be reflecting some transit states rather than stable ones.
In the previous work [1], the brazing using Al-9Si-3Cu or F0 filler alloy was done without load, for the sake of comparison, the load was applied after the USV treatment at filler temperature less by 10–11 °C than the temperature at which USV was applied according to brazing condition (F0-3). Although the second load application in F0-3 and F0-2 was at close solid fractions, it resulted in the formation of inhomogeneously distributed and large intermetallic compounds or colonies in F0-3 joints (Figure 11).
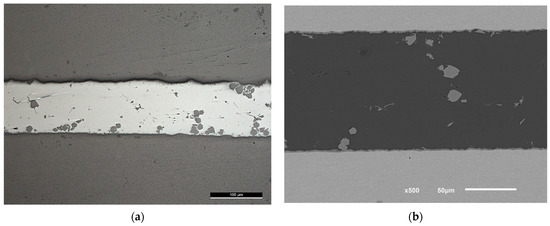
Figure 11.
(a) Light microscope and (b) SEM images of F0-3 brazed joints at 580 °C followed by 12 MPa pressure. The gray bulky intermetallic is , (the scale is in (a)).
The formation of the intermetallic at the interface in F0-3 was of a higher rate compared with the samples brazed at lower temperatures, but within acceptable thickness that could be optimized later. Usually, brazing is done at 15 to 20 °C higher than the solidus temperature of the filler alloy, however, using USV at a temperature close to the solidus temperature for 10 s was enough to initiate a minimum thickness of the intermetallic at the interface. The application of load, in this case, should be separated from the USV application point, otherwise, will result in unhomogenized microstructures as is clear in Figure 11.
After the application of USV on the molten filler, it starts to solidify with a large number of nucleation sites activated at the joint interfaces and within the filler, adding to that the small thickness of the filler compared with the surrounded base metal. Therefore, the behavior of the filler during the cooling could be shifted compared with the bulk, however, the recorded cooling curves for the bulk form of the filler can still be used as a reference for comparison.
Application of the load after USV should take into consideration the state of the materials and their microstructures. Directly, after the limited application of USV, and due to the heat and the strong disruption inputs, the sample is easy to deform, therefore the load value should be limited or the load application should be delayed.
Brazing at 565 °C, (F0-2), could be optimized for better microstructures distribution. Further trials at a brazing temperature of 565 °C were conducted with reduced load value ( or 6 MPa as pressure in F0-4) and without load (F0-5). At this value of 6 MPa, although voids of relatively small size could be noticed in some examined locations, the distribution of the intermetallic was better across the joint (Figure 12a) compared with 12 MPa pressure (F0-2 in Figure 9b). While brazing without load at the same conditions produced a joint with relatively large voids (Figure 12b), which reflects the importance of optimizing the load value at a specific semisolid state after USV.
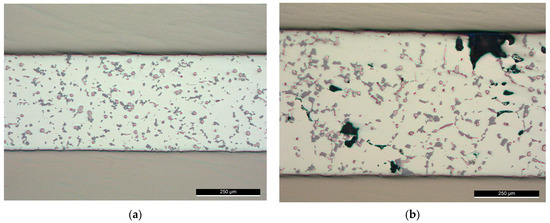
Figure 12.
Brazed joints at 565 °C with (a) Reduced load (F0-4); (b) Without load (F0-5).
Employing USV at a high solid fraction enhanced the microstructures. By further optimization of the brazing conditions, joints with high quality can be produced. Even though the increase in the thickness of the intermetallic at the interface was frequently reported as a cause of increasing the interface defects and reducing the joint strength, an optimized interaction at the interface is necessary to establish the joint. Carrying out the current brazing process at low temperature/high solid fraction could require considerable time to achieve the necessary interaction at the interface. A limited interaction at the interface in a relatively short time is preferable and could be a start point for further optimization until reaching the optimal value. An acceptable reaction at the joint interfaces can be achieved by initial load (during the heating phase) and USV application at a temperature close to the liquidus temperature. On the other side, since the application of a second load near to the liquidus temperature did not affect positively the joint characteristics, therefore, the application of load should be evaluated at a higher solid fraction. Based on these notes and observations and besides the before mentioned design considerations in the introduction, brazing cycle B was developed and tested using lab-made filler alloys.
3.2. Results by Using Brazing Cycle B
In Brazing cycle B (Figure 8b and Table 4), the new lab-made alloys F1 and F2 were used, those alloys were made with the modification of silicon by Sr addition. This modification was made for improving the morphology of Si reported by the results of the previous work [1]. When USV was applied close to the liquidus temperature, even though it helped in reducing the size and number of the primary silicon particles, the eutectic silicon was affected by the thermal cycle and did not show an improved morphology. Adding Si modifier was a proposed solution in this work (Figure 13). The brazing cycle resulted, anyway, in coarser modified eutectic silicon, but it still gives much better morphology compared with the unmodified fillers, which should logically improve the load-carrying capability of the brazed joints. On the other side, the microstructures after ultrasonic assisted brazing showed refined grains, which can be better maintained by decreasing the holding temperature.
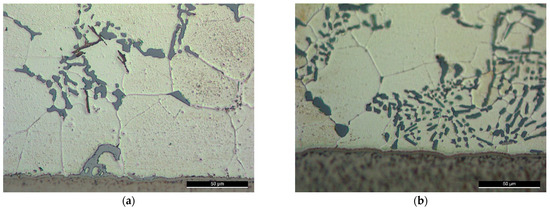
Figure 13.
Brazed joints according to the brazing cycle B under high second-load ( or 16 MPa as a pressure) using the filler alloys F1 and F2 with Sr addition (around the joint center) according to the conditions: (a) F2-3; (b) F1-3.
The detailed microstructures under the highest brazing conditions (time and load) in F2-3 and F1-3 are presented in Figure 14 and Figure 15. As initial observations, the joints brazed using 16 MPa pressure showed some defects at the joint interfaces between the filler and the intermetallic layer. On the other side, the formation of the intermetallic at the interfaces near the joint edges was intermittent (Figure 14a and Figure 15a). Besides, the joint microstructures showed more contact areas between grains, where an increased displacement of the phases of the low melting points occurred letting more contact areas between grains (Figure 15a). Table 9 and Table 10 show the EDS analyses results and the estimated phases for the corresponding points in Figure 14a and Figure 15b,d.
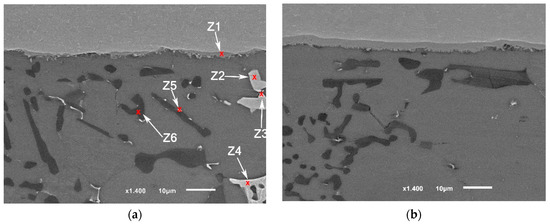
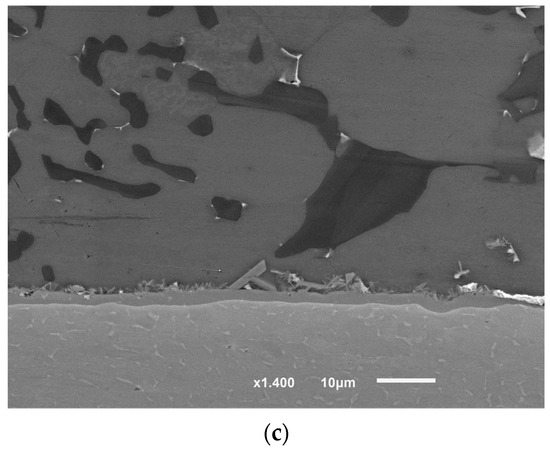
Figure 14.
SEM images (SEI) of F1-3 brazed joint under the load of or 16 MPa as a pressure: (a) Near the joint edge; (b) Close to the middle of the joint; (c) The interface at the other side (the passive side).
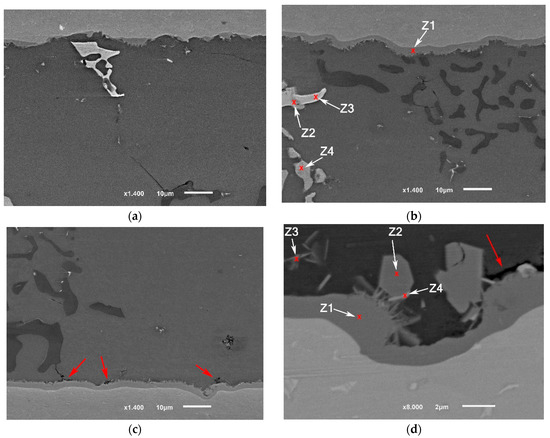
Figure 15.
SEM images (SEI) of F2-3 brazed joints under the load of 16 MPa: (a) Near the joint edge; (b) Close to the middle of the joint; (c) The interface at the other side (at the passive side); (d) Higher magnification of the interface (at the passive side) (BEC image). The red arrows in (c) and (d) show some defects at the interface at the filler side.
Table 9.
EDS points analyses (at. %) of F1-3 brazed joint presented in Figure 14a.
Table 10.
EDS points analyses (at. %) of F2-3 brazed joint presented in Figure 15b,d.
3.3. The Effect of the Second Load and Filler Composition on the Mechanical Properties
Brazing was done according to the brazing cycle B (Figure 8b and Table 4). The results of the tested conditions are presented in Figure 16. The results showed that the brazed joints using F1 filler alloy exhibited higher strength compared with the joints brazed using F2 filler. The highest obtained joints were for the condition F1-2.
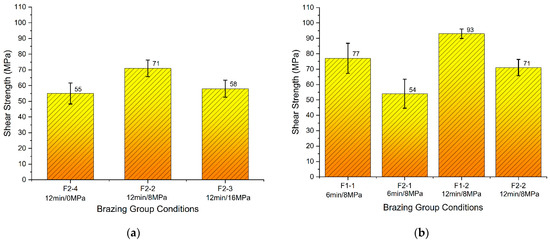
Figure 16.
Shear strength of brazed joints: (a) F2 using brazing cycle B under different load values; (b) F1 and F2 using brazing cycle B under different holding times.
Generally, brazed joints showed higher strength when the holding time was increased to 12 min, compared with 6 min under the same pressure of 8 MPa. Brazed joints using F2 filler under the pressure of 8 MPa showed higher strength in comparison with both cases: the joints brazed with a higher pressure of 16 MPa or without application of pressure (Figure 16a).
Developing a strong Ti-Al interface by developing a thin and strong interaction layer supported by a thin and stiff filler material are the main design considerations for achieving high joint strength. In the overlapped joint, the stresses are not equally distributed over the bonding area. The edges of the joint are under the highest stress in comparison with the rest of the joint [46,47,48], the concentration of the stress would be similar to the numerical model of a brazed joint under tensile loading presented in Figure 17.
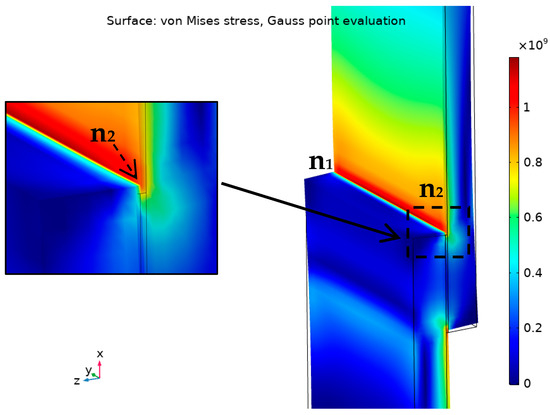
Figure 17.
Demonstration of von Mises stress distribution (Gauss-point evaluation) in Ti/F1/Ti joint under maximum tensile load using COMSOL Multiphysics® v. 5.4. (COMSOL AB, Stockholm, Sweden).
According to Figure 17, the stress concentrates at the edges of the joint: at parent/filler interfaces then to the filler itself at the corners. That means a weak bonding at the interface or a defect in the filler at the edges would be the default starting point of the failure under the loading. The order of expected failure locations, at the edge n1-n2 for instance, is the interface on the right, then the filler, then the opposite interface. In the studied brazed joints, the weak bonding at the interface could result from a relatively thick intermetallic layer or insufficient interaction between the filler and the base metal or due to any defects or oxides at the joint edges.
As the overlap increases, the distribution of the von Mises stress becomes less uniform. It was reported that the lap joints under the shear strength failed when von Mises stress exceeded a certain critical value over 5% of the joint length starts at the edge [49]. That length was defined as a 10% damaged zone criteria (5% from each side).
Examining the fracture surface of the joints (Figure 18) revealed that the fracture propagation in the joints started from the interface to the filler itself. In the joints of the highest strength, the fracture propagation through the filler was dominant. This observation suggests that a relationship exists between the failure location at the edges and the obtained strength value. Adding to that, in the joints brazed without compression load at semisolid state, the propagation of the fracture was not consistent through the filler (Figure 18d), a similar observation was found in F2-3 but it was less intense and not for all the samples. In addition to the interaction behavior at the joint interfaces at specific solid fraction and filler material, F2 compared with F1 has a higher percent of intermetallic compounds, therefore, during the tensile test, the crack is easier to propagate in F2 than F1. Increasing the second load to (or 16 MPa as a pressure) did not result in better interaction at the interface at the edges, on the contrary, the interfaces have more defects, and in the filler more displacement of the phases of lower melting points took place. As a result, the interaction at the interfaces seems to be interrupted (Figure 15). Therefore, the mentioned causes increase the probability of crack propagation at the interface through the filler/intermetallic layer or at the parent metal side depending on the interface interaction level and the existed defects (Figure 15 and Figure 18c).
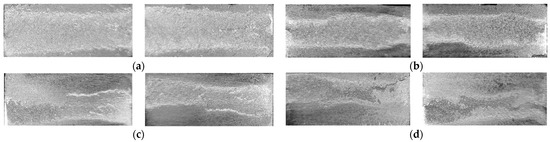
Figure 18.
Fracture surfaces after tensile tests of brazed joints from: (a) F1-2 (12 min/8 MPa); (b) F2-2 (12 min/8 MPa); (c) F2-3 (12 min/16 MPa); (d) F2-4 (12 min/No load).
The application of the second compression pressure 8 MPa at a high solid fraction caused the following: Increasing the internal contact in the filler between the grains by disconnecting the intermetallic formation around them without causing significant accumulation of the intermetallic; forcing and maintaining the good contact between the filler and the base metal which caused oxide layer breakage and enhanced the diffusion at the interface (Figure 19a,b).
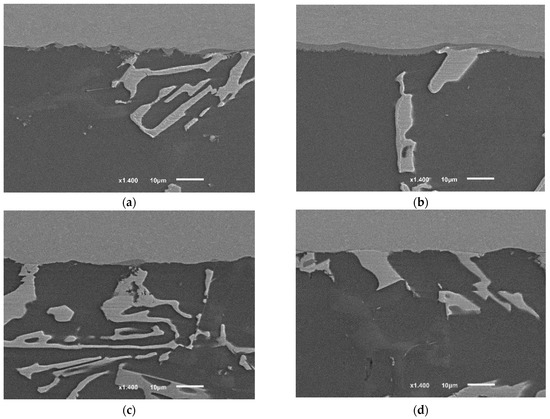
Figure 19.
The interfaces of brazed joints using: (a,b) F2 filler, 8 MPa, 12 min (F2-2); (c,d) F2-No-pressure-12 min (F2-4). The images of the joints’ cross-sections were taken from similar joints’ edges (from the active part of parent metal), starting from 1 mm distance from the edge toward the middle of the joint. Between 1 and 2 mm, the interface of the joint (F2-2) showed a continuous intermetallic layer (~) which separated the other internal intermetallic and phases from the titanium interface. While the other joint (F2-4) showed almost no interaction yet at a similar distance from the edge. It is worth mentioning that figures were taken along the middle cross-section (the cross-section A-A explained in [1]), therefore, the intermetallic growth will not be the same at other cross-sections, taking into account Figure 18.
The joints brazed according to the condition (F2-4), where the brazing was done without a second load, showed one of the lowest joint strengths. By examining the interfaces at the edges, it is clear that the interfacial interaction at the joint’s edges was limited (Figure 19c,d), unlike the joints of higher strength using the same filler but with 8 MPa pressure (F2-2).
After initial load application followed by USV treatment, the examined joints were free from observable oxides layer [1]. However, even when the interface did not show at a microscale a clear oxide layer or the intermetallic interaction was not observed at the joint edges, that does not mean necessarily there are no elements segregation or/and oxide layer at the examined joint interfaces. According to Zhang et al.’s study [50] Si, Mg and O were distributed inversely at the interface where Si content reached ~4 at% in 20 nm layer width after a very short time of ultrasonic welding of AA6111–TiAl6V4 (~520 °C peak temperature). It was assumed that the residual oxides and Si are acting as a barrier that retards the growth of the intermetallic at the interface. In titanium brazing with Al-Si filler alloys, It was assumed the solution of Si in suppressed the growth rate of itself [51]. The affinity between Si and Ti atoms is stronger than the one between Al and Si. The driving force of Si segregation to the interface can be explained by the tendency of lowering the free energy of the system. In the joint assembly, Ti is already in contact with the filler that contains Si, therefore Si will segregate to the interface of Ti/Al since the chemical mixing enthalpy of Ti-Si is the lowest among the chemical mixing enthalpies of the other elements pairs in the filler itself [50]. Imposing the second load during the holding time at 0.7 solid fraction, increased the metal-metal contact through the remained oxide layer and therefore enhanced the diffusion, Figure 20, Figure 21, Figure 22 and Figure 23 show the interface composition and the Si segregation to the interface after applying load at holding time at semisolid state, the analyses were taken at the same locations in both joints.
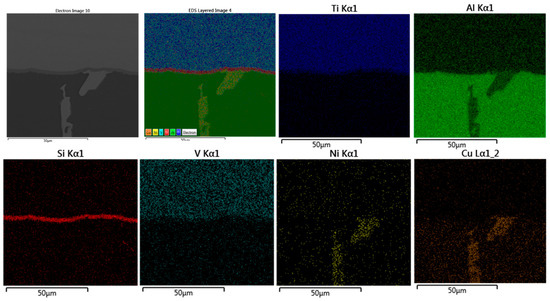
Figure 20.
EDS map of brazed joint interface from the condition F2-2 at the distance of 1–2 mm from the edge of the active part (Figure 19b). At this distance, the formation of the intermetallic begins to be continuous at the interface, where Si diffused and concentrated at the joint interface.
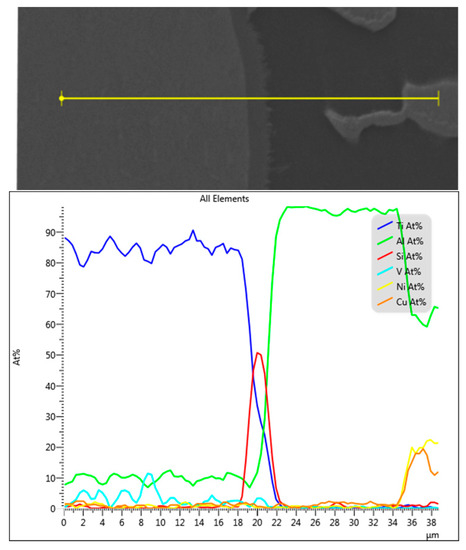
Figure 21.
EDS line position and analysis of the interface in Figure 20.
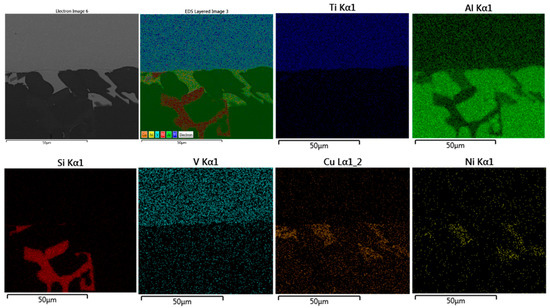
Figure 22.
EDS map of brazed joint interface from the condition F2-4 without second load, 12 min) at the distance of 1–2 mm from the edge of the active part (Figure 19d). At this distance, the formation of the intermetallic was minimum and discontinued, no continuous Si diffusion was observed at the interface except in limited points.
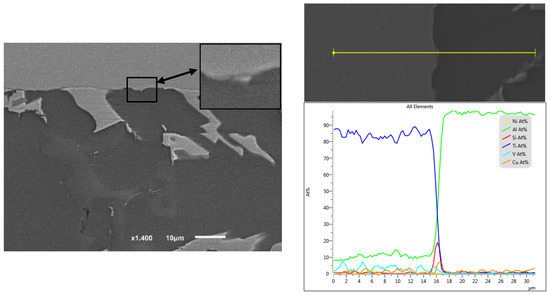
Figure 23.
EDS line position and analysis of the interface in Figure 22.
Once the intermetallic growth is optimal for providing the highest possible strength, then the joint strength would depend on the properties of the filler material as a confined layer between two sides of the parent metal(s) rather than the strength of the related bulk where the filler was taken from originally.
4. Conclusions
Ultrasonic vibration is capable of affecting the intermetallic and silicon phases at a high solid fraction favoring the formation of the round morphology. When applying ultrasonic at semisolid, the limited cavitation and the direct mechanical interaction were able to break, gather and reform the silicon and the intermetallic compounds. At a low portion of the solid phase, ultrasonic vibration is also capable of producing joints with round grains of . The filler state is easy to displace directly after USV treatment at a low solid fraction, therefore the applied second load at this point should be minimum and sufficient to remove any voids, otherwise aggregation of intermetallic and silicon would increase.
To achieve high joint strength, the fracture should be moved from the interface to the filler itself, optimizing the developed interaction at the interface backed by a strong and defect-free filler are essential to achieve that. It was shown practically that to achieve higher joint strength, the joint must have strong and defect-free interfaces at its edges.
The results showed that the brazed joints using Al-9Si-4Cu-(Sr) filler alloy exhibited higher strength compared with the joints brazed with Al-8Si-4Cu-2Ni-(Sr) filler. The highest obtained joints were brazed under the condition F1-2 (8 MPa-12 min using Al-9Si-4Cu-(Sr)) where the average highest shear strength reached 93 MPa.
Application of a moderate second load on USV brazed joints at semisolid state improved the quality and the strength of the joints according to the optimized brazing cycle (B). Choosing the application point of the load and its value is essential in achieving high quality and high strength brazed joints. In the brazing cycle B, adding Sr to the filler alloys improved the silicon morphology while the ultrasonic treatment at the liquid state produced finer Al grains. The ultrasonic treatment was followed with a holding time at a high solid fraction which preserved the refined grains state, enhanced the integration between the joint components, and enhanced the diffusion at the interface. The intermetallic formation at the interface was limited and controlled according to brazing cycle B with the designed filler alloys.
Author Contributions
Conceptualization, data curation, formal analysis, investigation, methodology, visualization, and writing—original draft: A.M.; resources: A.M. and J.B.; supervision: J.B.; validation: A.M. and J.B. All authors have read and agreed to the published version of the manuscript.
Funding
This work was done with the support of the PEACE II, Erasmus Mundus Lot 2 Project (2013-2443/001-001-EMA2), and the Global Platform for Syrian Students in Portugal.
Conflicts of Interest
The authors declare no conflict of interest.
References
- Muhrat, A.; Barbosa, J. Ultrasonic-Assisted Brazing of Titanium Joints Using Al-Si Based Fillers: Numerical and Experimental Process Design. Metals 2021, 11, 1686. [Google Scholar] [CrossRef]
- Shapiro, A.E.; Flom, Y.A. Brazing of Titanium at Temperatures below 800 °C: Review and Prospective Applications. DVS Ber. 2007, 243, 254. [Google Scholar]
- Chen, X.; Yan, J.; Gao, F.; Wei, J.; Xu, Z.; Fan, G. Interaction Behaviors at the Interface between Liquid Al-Si and Solid Ti–6Al–4V in Ultrasonic-Assisted Brazing in Air. Ultrason. Sonochem. 2013, 20, 144–154. [Google Scholar] [CrossRef]
- Chen, X.; Xie, R.; Lai, Z.; Liu, L.; Zou, G.; Yan, J. Ultrasonic-Assisted Brazing of Al–Ti Dissimilar Alloy by a Filler Metal with a Large Semi-Solid Temperature Range. Mater. Des. 2016, 95, 296–305. [Google Scholar] [CrossRef]
- Chen, X.; Yan, J.; Ren, S.; Wei, J.; Wang, Q. Microstructure and Mechanical Properties of Ti–6Al–4V/Al1060 Joints by Ultrasonic-Assisted Brazing in Air. Mater. Lett. 2013, 95, 197–200. [Google Scholar] [CrossRef]
- Li, Z.; Xu, Z.; Ma, L.; Wang, S.; Liu, X.; Yan, J. Cavitation at Filler Metal/Substrate Interface during Ultrasonic-Assisted Soldering. Part I: Cavitation Characteristics. Ultrason. Sonochem. 2018, 49, 249–259. [Google Scholar] [CrossRef]
- Elrefaey, A.; Wojarski, L.; Pfeiffer, J.; Tillmann, W. Preliminary Investigation on Ultrasonic-Assisted Brazing of Titanium and Titanium/Stainless Steel Joints. Weld. J. 2013, 92, 148–153. [Google Scholar]
- Wang, Q.G.; Caceres, C.H.; Griffiths, J.R. Damage by Eutectic Particle Cracking in Aluminum Casting Alloys A356/357. Met. Mater. Trans. A 2003, 34, 2901–2912. [Google Scholar] [CrossRef]
- Joseph, S.; Kumar, S.; Bhadram, V.S.; Narayana, C. Stress States in Individual Si Particles of a Cast Al–Si Alloy: Micro-Raman Analysis and Microstructure Based Modeling. J. Alloys Compd. 2015, 625, 296–308. [Google Scholar] [CrossRef]
- Timpel, M.; Wanderka, N.; Schlesiger, R.; Yamamoto, T.; Lazarev, N.; Isheim, D.; Schmitz, G.; Matsumura, S.; Banhart, J. The Role of Strontium in Modifying Aluminium–Silicon Alloys. Acta Mater. 2012, 60, 3920–3928. [Google Scholar] [CrossRef]
- Djurdjevic, M.; Stockwell, T.; Sokolowski, J. The Effect of Strontium on the Microstructure of the Aluminium-Silicon and Aluminium-Copper Eutectics in the 319 Aluminium Alloy. Int. J. Cast Met. Res. 1999, 12, 67–73. [Google Scholar] [CrossRef]
- Mazahery, A.; Shabani, M.O. Modification Mechanism and Microstructural Characteristics of Eutectic Si in Casting Al-Si Alloys: A Review on Experimental and Numerical Studies. JOM 2014, 66, 726–738. [Google Scholar] [CrossRef]
- Omran, A.; Ali, M.; Kh, M.; Ezzeldien, M. Effect of strontium content on the mechanical properties of hypo and hyper al-si cast alloys. J. Al-Azhar Univ. Eng. Sect. 2018, 13, 1322–1331. [Google Scholar] [CrossRef]
- Sun, X.; Wu, W.; Wang, D.; Deng, P. The Influence of Sr Addition on the Microstructure and Mechanical Properties of Aluminum Die-Casting Alloys. MATEC Web Conf. 2016, 67, 05027. [Google Scholar] [CrossRef]
- Qingjie, W.; Hong, Y.; Yuan, L.; Zhi, H. Effect of Sr Modification on Microstructures and Mechanical Properties of Al3Ti/ADC12 Composites. Rare Met. Mater. Eng. 2018, 47, 742–747. [Google Scholar] [CrossRef]
- Yang, Y.; Yu, K.; Li, Y.; Zhao, D.; Liu, X. Evolution of Nickel-Rich Phases in Al–Si–Cu–Ni–Mg Piston Alloys with Different Cu Additions. Mater. Des. 2012, 33, 220–225. [Google Scholar] [CrossRef]
- Muhrat, A.; Puga, H.; Barbosa, J. Low-Temperature Brazing of Titanium Using Al-Based Filler Alloys. Adv. Mater. Sci. Eng. 2018, 2018, 4570120. [Google Scholar] [CrossRef]
- Školáková, A.; Novák, P.; Mejzlíková, L.; Průša, F.; Salvetr, P.; Vojtěch, D. Structure and Mechanical Properties of Al-Cu-Fe-X Alloys with Excellent Thermal Stability. Materials 2017, 10, 1269. [Google Scholar] [CrossRef] [PubMed]
- Koç, F.G.; Karakulak, E.; Yamanoğlu, R.; Zeren, M. Mechanical properties of al-ni cast alloys. Mater. Test. 2014, 7, 1283–1287. [Google Scholar]
- Samuel, A.M.; Samuel, F.H. Effect of Melt Treatment, Solidification Conditions and Porosity Level on the Tensile Properties of 319.2 Endchill Aluminium Castings. J. Mater. Sci. 1995, 30, 4823–4833. [Google Scholar] [CrossRef]
- Cáceres, C.H.; Djurdjevic, M.B.; Stockwell, T.J.; Sokolowski, J.H. The Effect of Cu Content on the Level of Microporosity in Al-Si-Cu-Mg Casting Alloys. Scr. Mater. 1999, 40, 631–637. [Google Scholar] [CrossRef]
- Eskin, G.I.; Eskin, D.G. Ultrasonic Treatment of Light Alloy Melts; CRC Press: Boca Raton, FL, USA, 2014. [Google Scholar]
- Shabestari, S. The Effect of Iron and Manganese on the Formation of Intermetallic Compounds in Aluminum–Silicon Alloys. Mater. Sci. Eng. A 2004, 383, 289–298. [Google Scholar] [CrossRef]
- Pehlke, R.D. Formation of Porosity During Solidification of Cast Metals. In Foundry Processes; Katz, S., Landefeld, C.F., Eds.; Springer: Boston, MA, USA, 1988; pp. 427–445. ISBN 978-1-4612-8292-1. [Google Scholar]
- Muhrat, A.; Puga, H.; Barbosa, J. Ultrasonic Vibration as a Primary Mixing Tool in Accelerating Aluminum–Copper Alloys Preparation from Their Pure Elements. Metals 2019, 9, 781. [Google Scholar] [CrossRef]
- De Giovanni, M.; Kaduk, J.A.; Srirangam, P. Modification of Al-Si Alloys by Ce or Ce with Sr. JOM 2019, 71, 426–434. [Google Scholar] [CrossRef]
- Farahany, S.; Ourdjini, A.; Bakar, T.A.A.; Idris, M.H. On the Refinement Mechanism of Silicon in Al-Si-Cu-Zn Alloy with Addition of Bismuth. Met. Mater. Trans. A 2014, 45, 1085–1088. [Google Scholar] [CrossRef]
- Djurdjevic, M.; Jiang, H.; Sokolowski, J. On-Line Prediction of Aluminum–Silicon Eutectic Modification Level Using Thermal Analysis. Mater. Charact. 2001, 46, 31–38. [Google Scholar] [CrossRef]
- Farahany, S.; Ourdjini, A.; Idris, M.H. The Usage of Computer-Aided Cooling Curve Thermal Analysis to Optimise Eutectic Refiner and Modifier in Al–Si Alloys. J. Therm. Anal. Calorim. 2012, 109, 105–111. [Google Scholar] [CrossRef]
- Tupaj, M.; Orłowicz, A.W.; Mróz, M.; Trytek, A.; Dolata, A.J.; Dziedzic, A. A Study on Material Properties of Intermetallic Phases in a Multicomponent Hypereutectic Al-Si Alloy with the Use of Nanoindentation Testing. Materials 2020, 13, 5612. [Google Scholar] [CrossRef] [PubMed]
- Fang, L.; Ren, L.; Geng, X.; Hu, H.; Nie, X.; Tjong, J. Solidification and Microstructure of Ni-Containing Al-Si-Cu Alloy. IOP Conf. Ser. Mater. Sci. Eng. 2018, 301, 012002. [Google Scholar] [CrossRef]
- Taylor, J.A. The Effect of Iron in Al-Si Casting Alloys. In Proceedings of the 35th Australian Foundry Institute National Conference, Adeiaide, SA, Australia, 31 October–3 November 2004. [Google Scholar]
- Dinnis, C.M.; Taylor, J.A.; Dahle, A.K. Porosity formation and eutectic growth in Al-Si-Cu-Mg alloys containing Iron and Manganese. In Proceedings of the Proceedings of the 9th International Conference on Aluminium Alloys (ICAA9), Brisbane, Australia, 2–5 August 2004; pp. 1016–1021. [Google Scholar]
- Taylor, J.A.; Schaffer, G.B.; StJohn, D.H. The Role of Iron in the Formation of Porosity in Al-Si-Cu-Based Casting Alloys: Part III. A Microstructural Model. Met. Mater. Trans. A 1999, 30, 1657–1662. [Google Scholar] [CrossRef]
- Taylor, J.A. Iron-Containing Intermetallic Phases in Al-Si Based Casting Alloys. Procedia Mater. Sci. 2012, 1, 19–33. [Google Scholar] [CrossRef]
- Feng, Y.; Založnik, M.; Thomas, B.; Phillion, A. A 3D Discrete-Element Model for Simulating Liquid Feeding during Dendritic Solidification of Steel. IOP Conf. Ser. Mater. Sci. Eng. 2019, 529, 012031. [Google Scholar] [CrossRef]
- Pola, A.; Tocci, M.; Kapranos, P. Microstructure and Properties of Semi-Solid Aluminum Alloys: A Literature Review. Metals 2018, 8, 181. [Google Scholar] [CrossRef]
- Perez, M.; Barbé, J.-C.; Neda, Z.; Bréchet, Y.; Salvo, L. Computer Simulation of the Microstructure and Rheology of Semi-Solid Alloys under Shear. Acta Mater. 2000, 48, 3773–3782. [Google Scholar] [CrossRef][Green Version]
- Shi, L.; Yan, J.; Peng, B.; Han, Y. Deformation Behavior of Semi-Solid Zn–Al Alloy Filler Metal during Compression. Mate. Sci. Eng. A 2011, 528, 7084–7092. [Google Scholar] [CrossRef]
- Xiao, J.; Li, S.; Bai, S.; Xiong, D.; Tang, Y. Semisolid Compression Brazing of Al50Si Alloy Using Zn-Al-Cu Filler Metal Assisted by SiC Particles. Adv. Mater. Sci. Eng. 2019, 2019, 3275810. [Google Scholar] [CrossRef]
- Yu, X.; Xing, W.; Ding, M. Ultrasonic Semi-Solid Coating Soldering 6061 Aluminum Alloys with Sn–Pb–Zn Alloys. Ultrason. Sonochem. 2016, 31, 216–221. [Google Scholar] [CrossRef]
- Emadi, D.; Whiting, L.V.; Djurdjevic, M.; Kierkus, W.T.; Sokolowski, J. Comparison of Newtonian and Fourier Thermal Analysis Techniques for Calculation of Latent Heat and Solid Fraction of Aluminum Alloys. MJoM 2004, 10, 91–106. [Google Scholar] [CrossRef]
- Marchwica, P.; Sokolowski, J.H.; Kierkus, W.T. Fraction Solid Evolution Characteristics of AlSiCu Alloys—Dynamic Baseline Approach. J. Achiev. Mater. Manuf. Eng. 2011, 47, 22. [Google Scholar]
- Upadhya, K.G.; Stefanescu, D.M.; Lieu, K.; Yeager, D.P. Computer-Aided Cooling Curve Analysis: Principles and Applications in Metal Casting. In Transactions American Foundrymen’s Soc; American Foundry Society: Schaumburg, IL, USA, 1989; Volume 97, pp. 61–66. [Google Scholar]
- Fras, E.; Kapturkiewicz, W.; Burbielko, A.; Lopez, H.F. A New Concept in Thermal Analysis of Castings. 8. AFS Trans. 1993, 101, 505–511. [Google Scholar]
- Chaturvedi, M.C.; Chaturvedi, M.C. (Eds.) Welding and Joining of Aerospace Materials; Woodhead Publishing in Materials; WP, Woodhead Publishing: Oxford, UK, 2012; ISBN 978-0-85709-516-9. [Google Scholar]
- Riggs, B.; Benatar, A.; Alexandrov, B.T.; Xu, R. Experimental Validation of Damage Zone Models for Lap Shear Brazed Joints Using DIC. Weld. J. 2017, 96, 8. [Google Scholar]
- Broughton, W.R.; Hinopoulos, G. Evaluation of the Single-Lap Joint Using Finite Element Analysis. Mater. Sci. 1999. Available online: https://eprintspublications.npl.co.uk/1281/ (accessed on 20 October 2021).
- Flom, Y.; Wang, L. Flaw tolerance in lap shear brazed joints-part 1. Weld. J. 2004, 83, 32–38. [Google Scholar]
- Zhang, C.; Robson, J.D.; Haigh, S.J.; Prangnell, P.B. Interfacial Segregation of Alloying Elements During Dissimilar Ultrasonic Welding of AA6111 Aluminum and Ti6Al4V Titanium. Met. Mater. Trans. A 2019, 50, 5143–5152. [Google Scholar] [CrossRef]
- Takemoto, T.; Okamoto, I. Intermetallic Compounds Formed during Brazing of Titanium with Aluminium Filler Metals. J. Mater. Sci. 1988, 23, 1301–1308. [Google Scholar] [CrossRef]


Publisher’s Note: MDPI stays neutral with regard to jurisdictional claims in published maps and institutional affiliations. |
© 2021 by the authors. Licensee MDPI, Basel, Switzerland. This article is an open access article distributed under the terms and conditions of the Creative Commons Attribution (CC BY) license (https://creativecommons.org/licenses/by/4.0/).