
Evaluation of Sulfide Inclusions before and after Deformation of Steel by Using the Electrolytic Extraction Method


Abstract
:1. Introduction
2. Materials and Methods
2.1. Materials and Sample Preparations
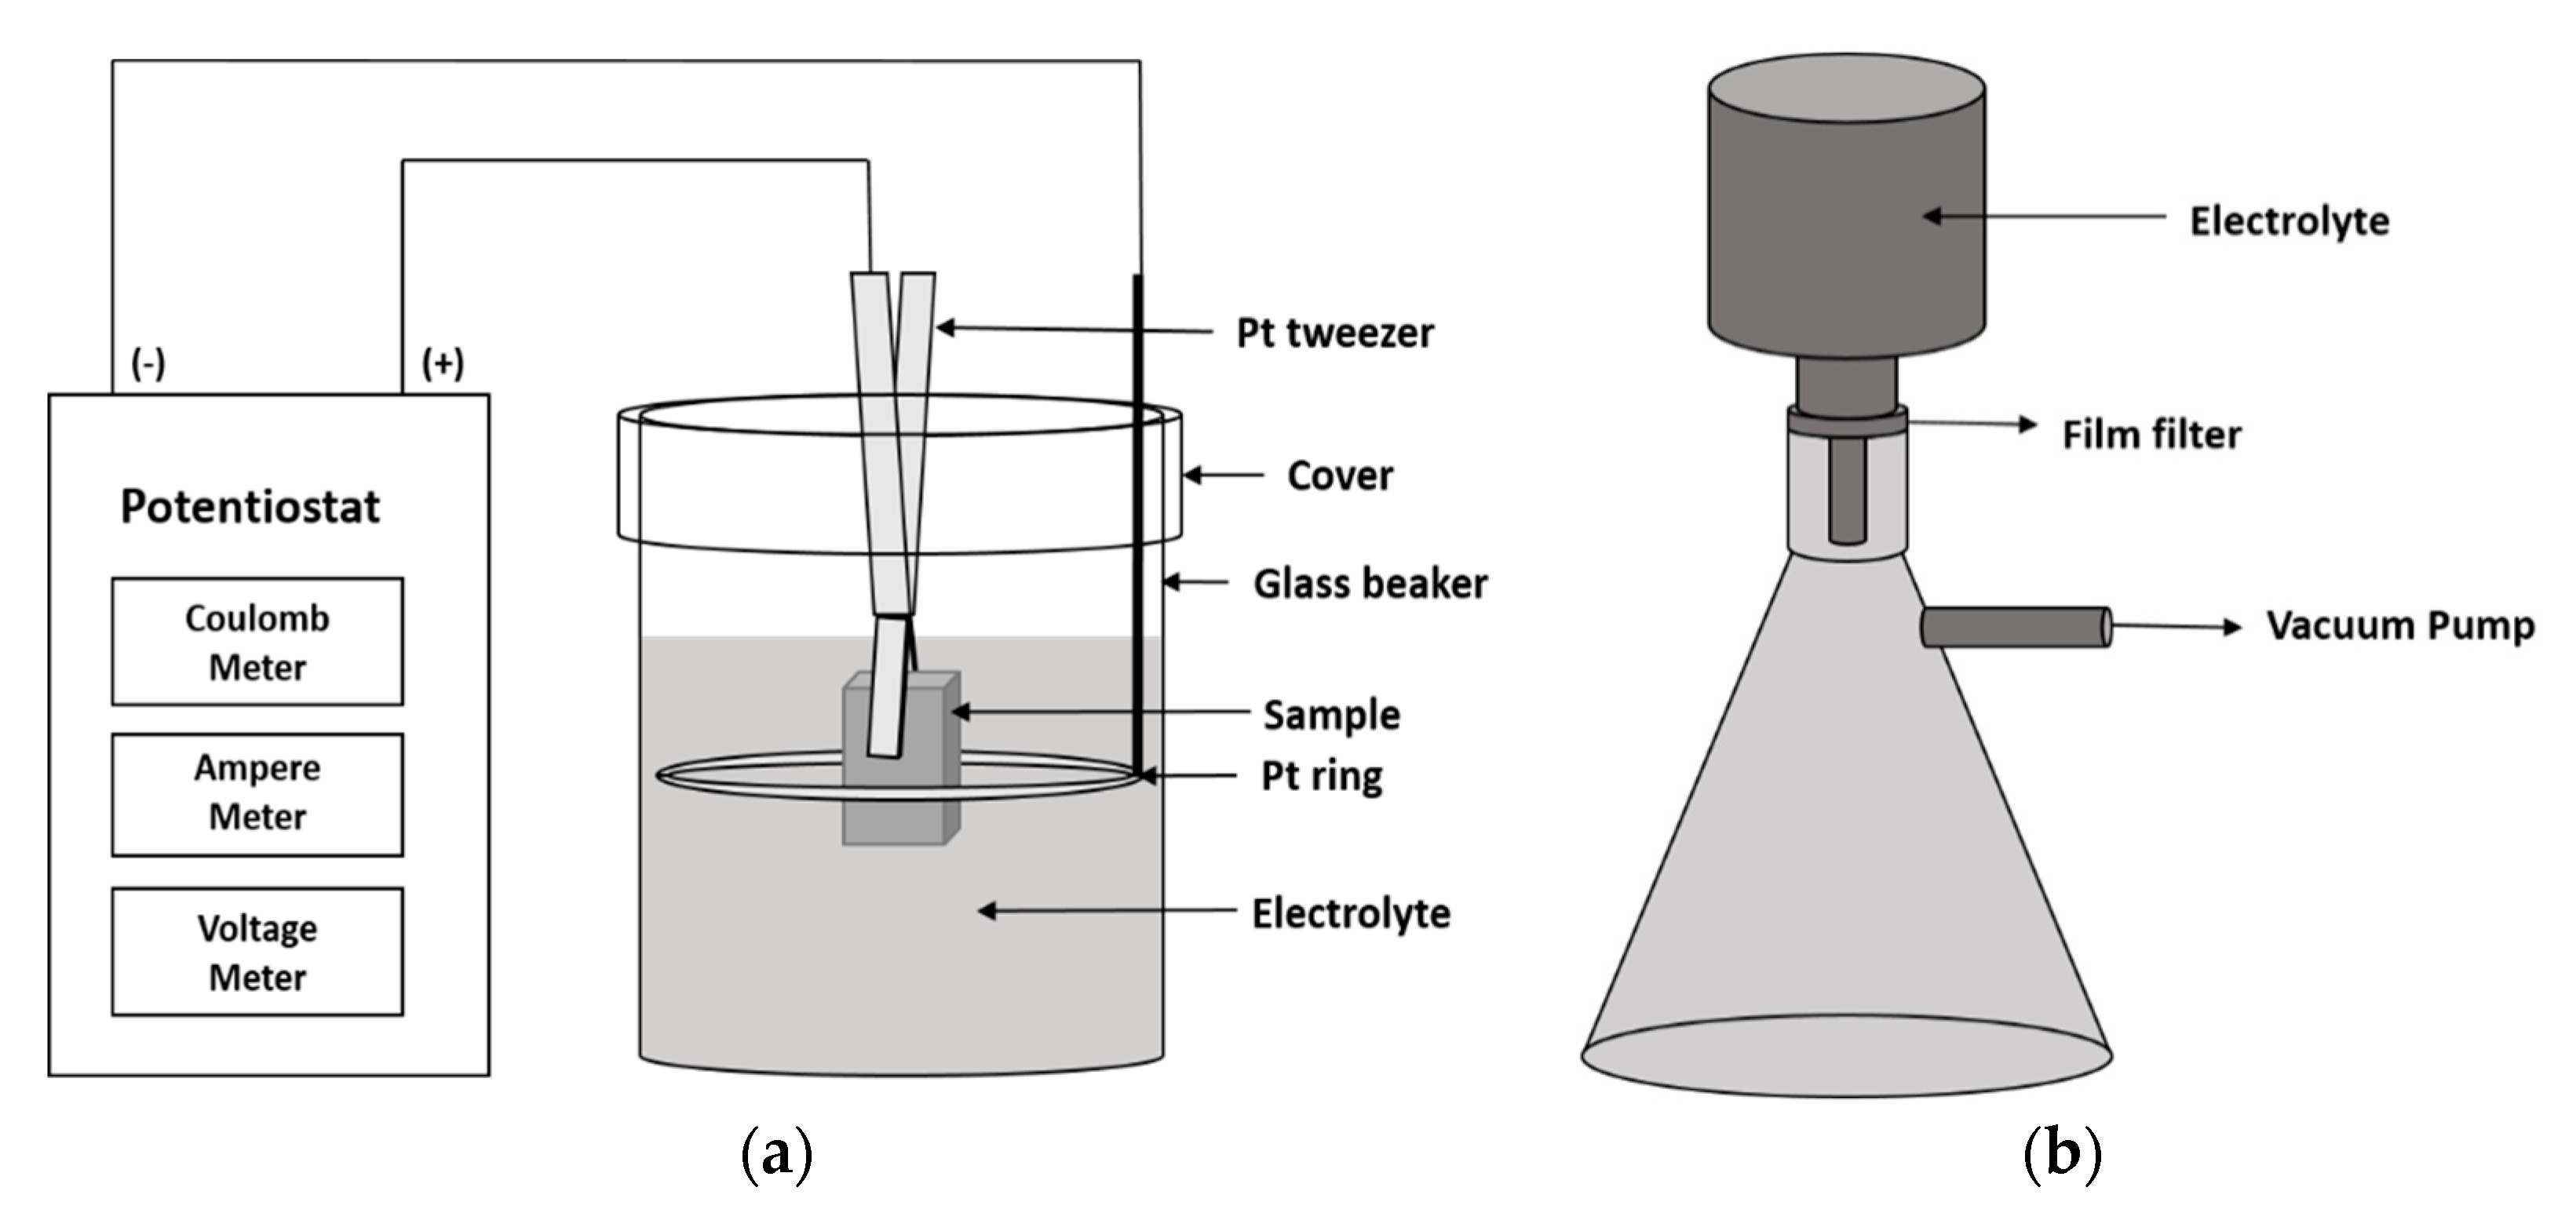
2.2. Electrolytic Extraction Method (3D EE)
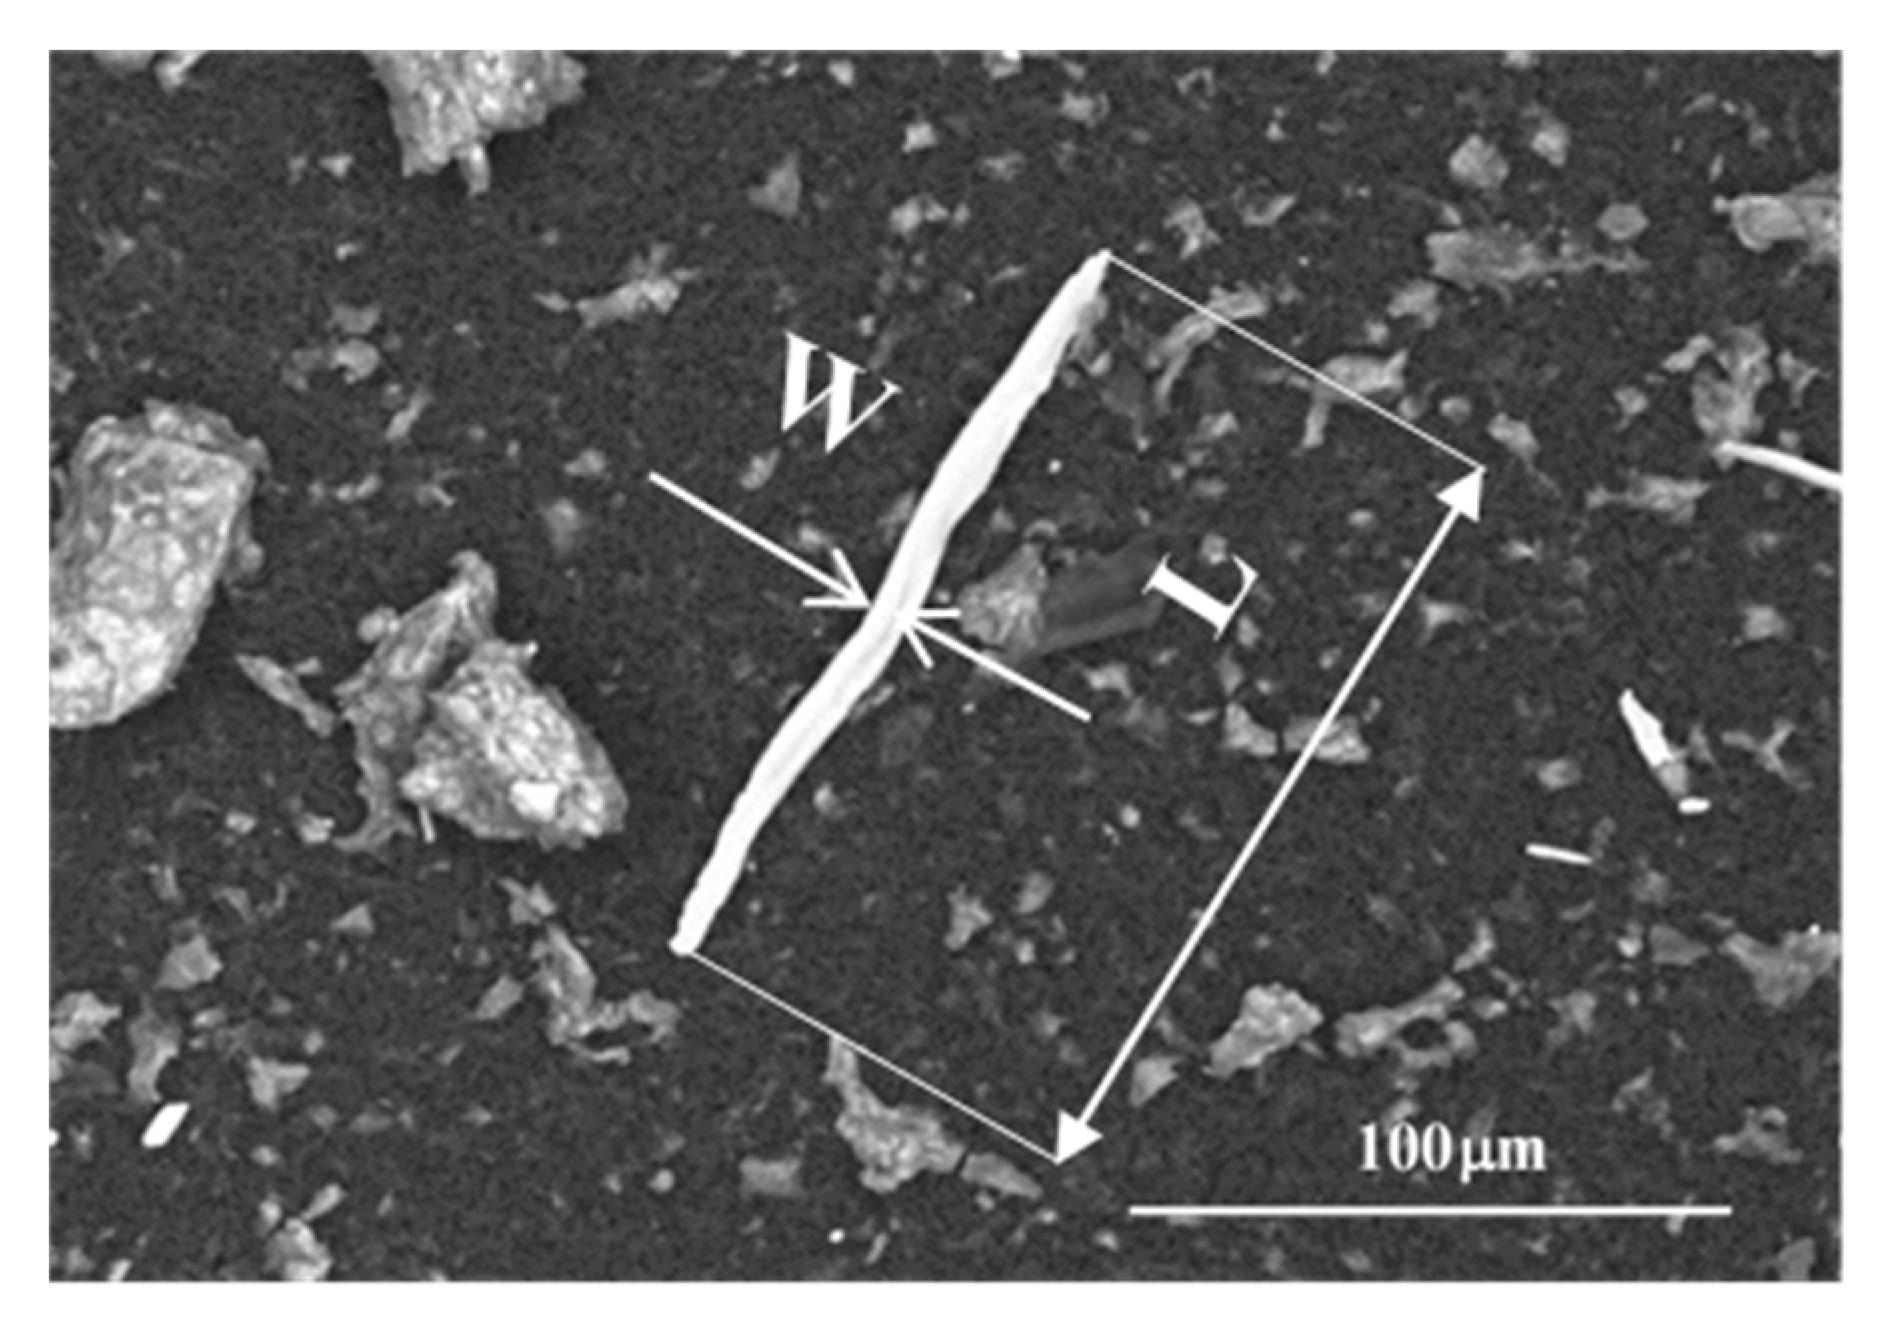
2.3. Scanning Electron Microscope (SEM) Determinations
3. Results
3.1. Application of EE for Studies of Deformed NMIs in Different Steels
3.1.1. Data for Stainless Steels (<0.1% C)
3.1.2. Data for Steels Containing 0.15% C and 0.42% C
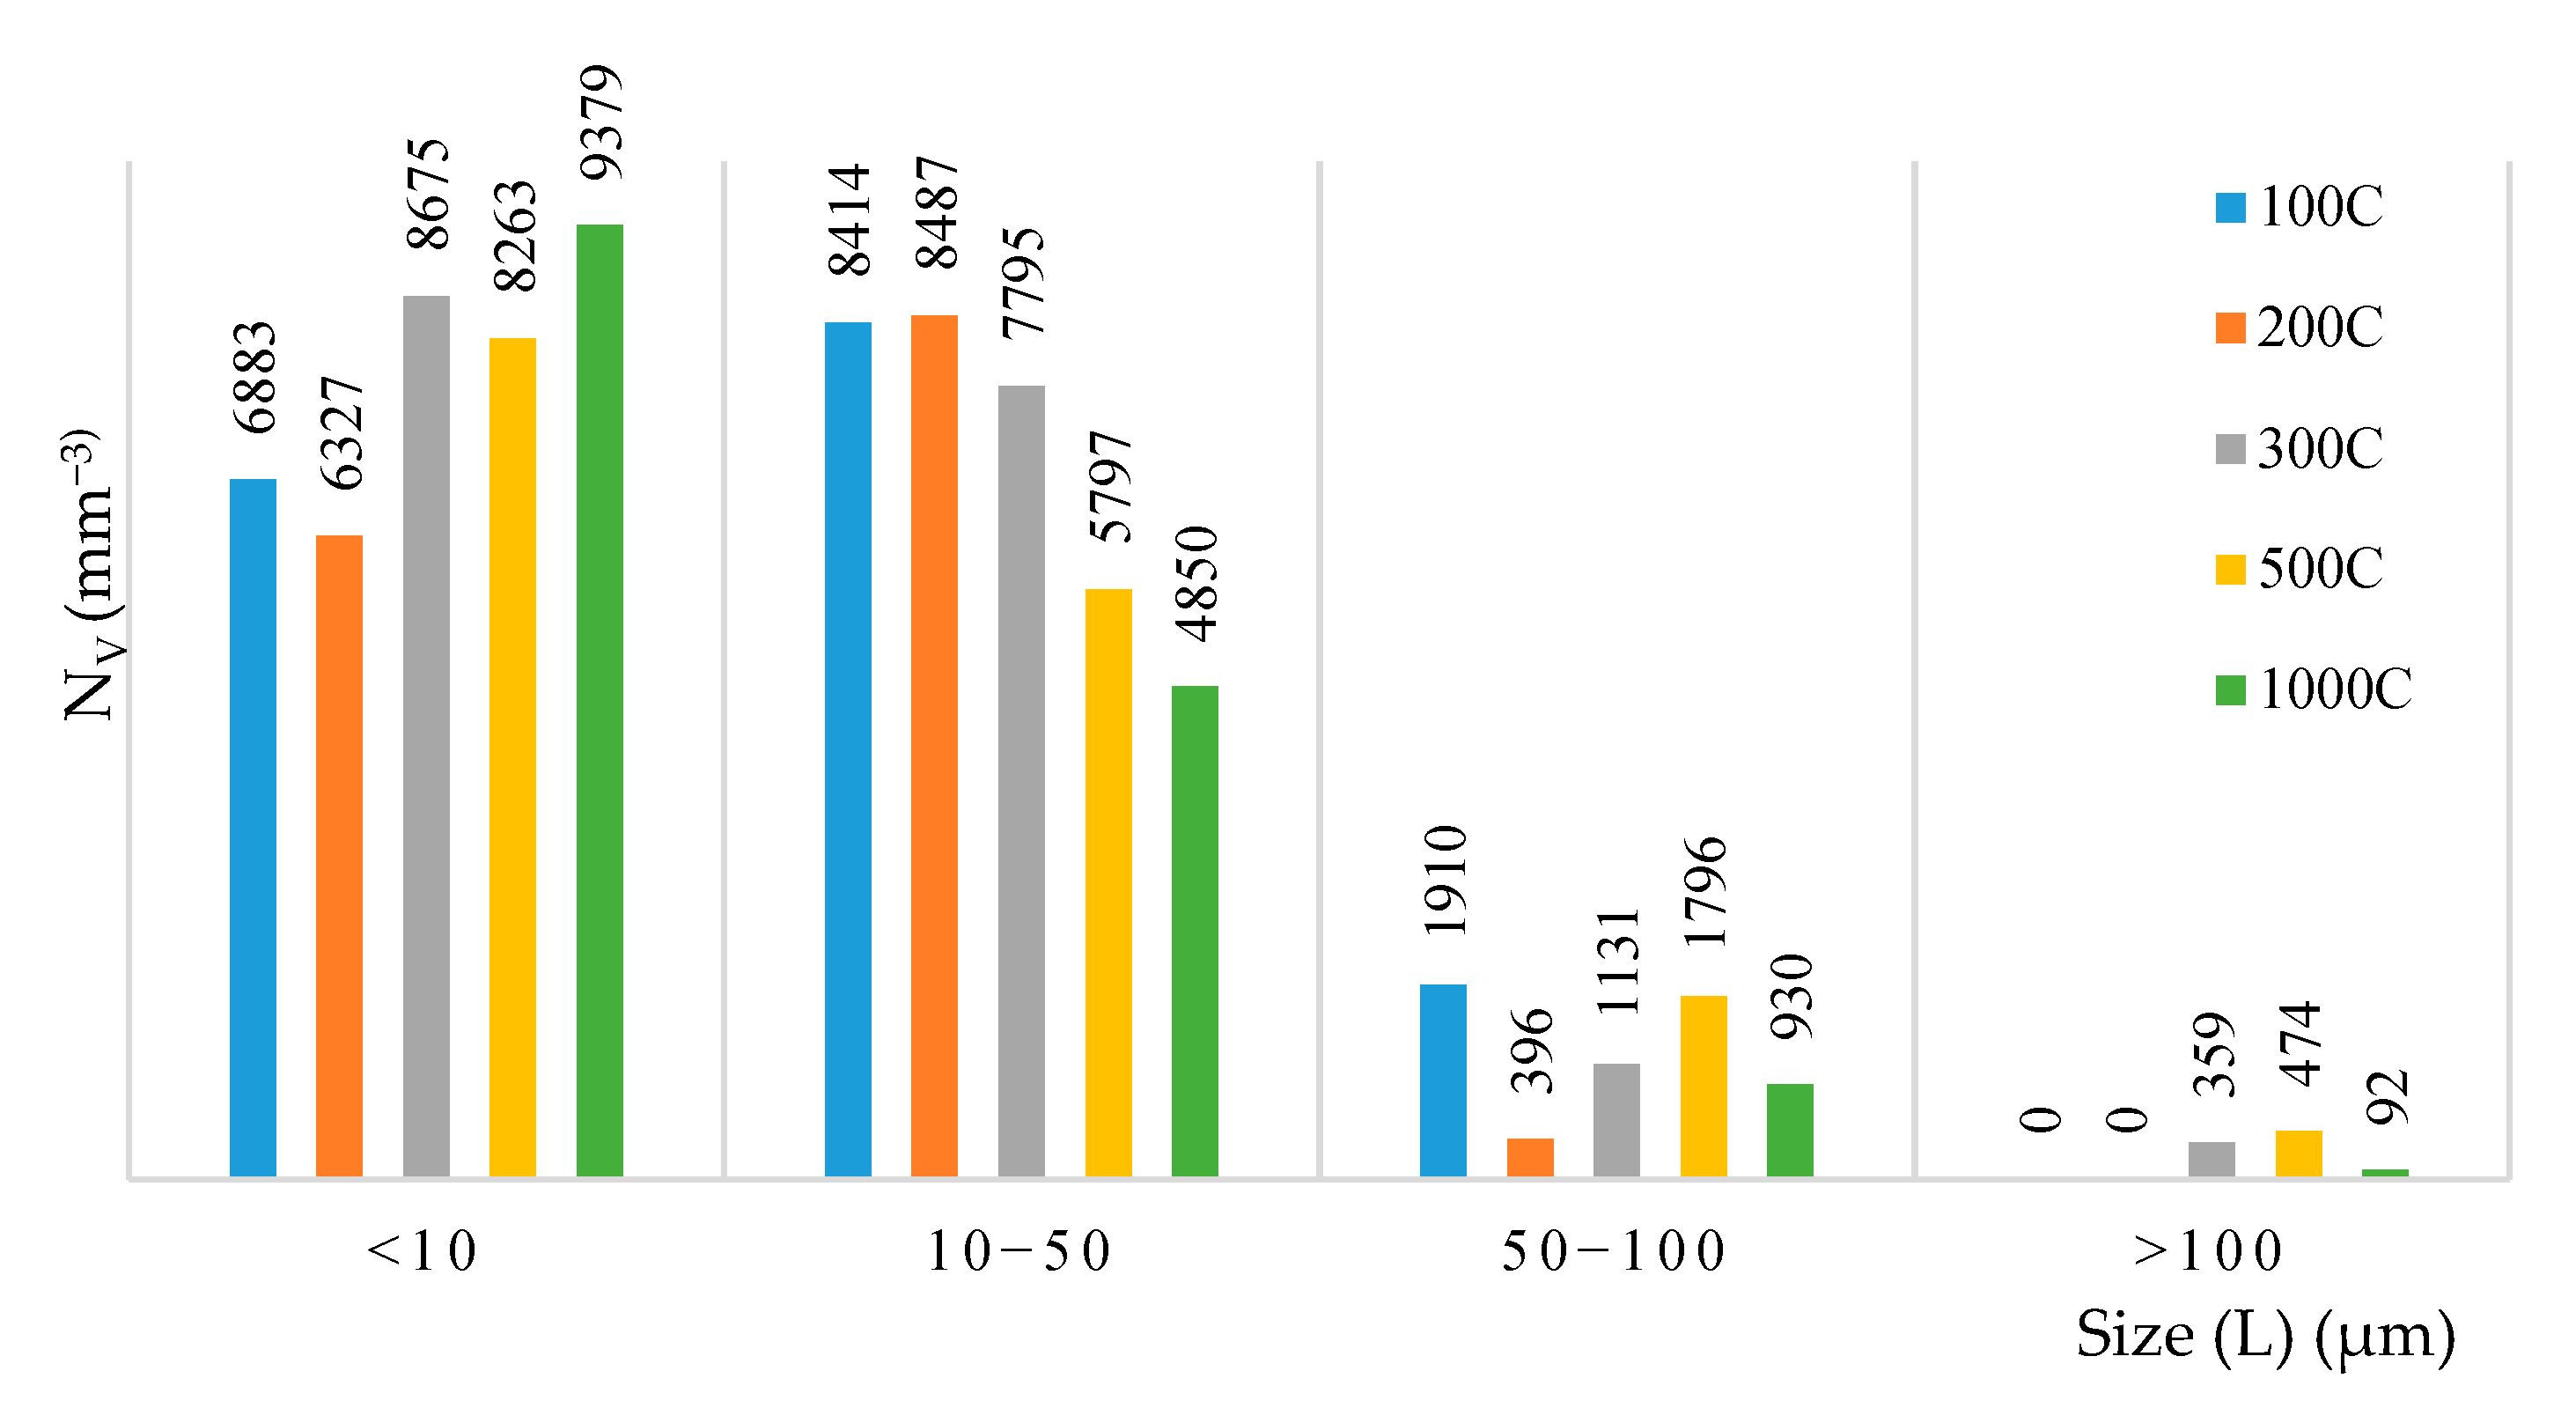
3.2. Effect of the Dissolved Metal Layer during the EE Process
3.3. Effects of Heat Treatment on the Fraction of U/B and Morphology of Inclusions
4. Conclusions
- The electrolytic extraction method can successfully be applied for stainless steels containing less than 0.1 mass% carbon and for tool steels containing 0.15 mass% C and 0.42 mass% carbon by using a 10% AA electrolytes.
- For tool steels containing more than 0.15% C, carbides were extracted from the steel matrix during the EE process and they covered other inclusions. Therefore, an additional heat treatment is needed to investigate the inclusions after EE. The results show that a heat treatment at 900 °C for 5 min can successfully dissolve the carbides during phase transformation in steel samples so that the inclusions (MnS) can then be precisely investigated after EE.
- The sulfide inclusions from the as-cast sample (42CrMo4) can be classified into three main groups—namely, (i) type I (regular), (ii) type II (irregular), and (iii) type III (rod-like), corresponding to 64, 16 and 20% of the total number of sulfide inclusions, respectively. Depending on the morphology of deformed MnS inclusions, the sulfides in the rolled steel samples were classified as rod-like (RS), plate-like (PS) and oxysulfides (OSs). The RS and PS inclusions’ compositions correspond to pure MnS and the OS inclusions are complex MnS-(Al,Si)O particles. It was found that the rolled 316L stainless steel (0.02% C and 0.007% S) contains about 97% of RS inclusions and only 2% of PS and 1% of OS inclusions. The 3R65 stainless steel (≤0.03% C and ≤0.015% S) contains about 46% of RS, 51% of PS and only 3% of OS inclusions. In the 13HMF (0.15% C and 0.012% S) and 42CrMo4 (0.42% C and 0.025% S) tool steels, most of observed deformed sulfides correspond to RS (~92% and 96%, respectively) and PS (~8 and 4%, respectively).
- In the rolled and heat-treated steel, 42CrMo4, having 0.42% C, only ~34–39% of the inclusions correspond to undamaged (unbroken–unbroken—UU) inclusions. For the stainless steel having a lower content of C, the frequency of undamaged sulfides significantly increased by up to 88% in the 13HMF steel and up to 97% in the 3R65 and 316L stainless steels.
- The sample preparation, EE process and the thickness of the metal layer dissolved during electrolytic extraction (~26–237 μm) have a negligible effect on the morphology and frequency of the undamaged (UU) sulfides observed in deformed low-carbon steels.
- The preliminary heat treatment for 5–30 min at 900 °C did not practically affect the morphology and fragility of deformed sulfides in both groups of steels containing less than 0.1 mass% C and steels having carbon contents ranging between 0.15 and 0.42 mass%.
Author Contributions
Funding
Informed Consent Statement
Data Availability Statement
Acknowledgments
Conflicts of Interest
References
- Isobe, K.; Kusano, Y.; Maede, H. The Effect of Oxygen Content on the Formation Behavior of Sulfides of MnS System and the Machinability of Low Carbon Resulphurized Steel. Tetsu-to-Hagane 1994, 80, 890–895. [Google Scholar] [CrossRef] [Green Version]
- Baker, T.J.; Gave, K.B.; Charles, J.A. Inclusion deformation and toughness anisotropy in hot-rolled steels. Met. Technol. 1976, 3, 183–193. [Google Scholar] [CrossRef]
- Hosseini, S.B.; Temmel, C.; Karlsson, B.; Ingesten, N.-G. An In-Situ Scanning Electron Microscopy Study of the Bonding between MnS Inclusions and the Matrix during Tensile Deformation of Hot-Rolled Steels. Met. Mater. Trans. A 2007, 38, 982–989. [Google Scholar] [CrossRef]
- Matsuno, F.; Nishikida, S.-I.; Ikesaki, H. Mechanical properties of manganese sulphides in the temperature range between room temperature and 1000.DEG.C. Trans. Iron Steel Inst. Jpn. 1985, 25, 989–998. [Google Scholar] [CrossRef]
- Temmel, C.; Ingesten, N.-G.; Karlsson, B. Fatigue anisotropy in cross-rolled, hardened medium carbon steel resulting from MnS inclusions. Met. Mater. Trans. A 2006, 37, 2995–3007. [Google Scholar] [CrossRef]
- Ohta, H.; Suito, H. Characteristics of Particle Size Distribution of Deoxidation Products with Mg, Zr, Al, Ca, Si/Mn and Mg/Al in Fe-10mass%Ni Alloy. ISIJ Int. 2006, 46, 14–21. [Google Scholar] [CrossRef] [Green Version]
- Kanbe, Y.; Karasev, A.; Todoroki, H.; Jönsson, P.G. Analysis of Largest Sulfide Inclusions in Low Carbon Steel by Using Statistics of Extreme Values. Steel Res. Int. 2010, 82, 313–322. [Google Scholar] [CrossRef]
- Janis, D.; Inoue, R.; Karasev, A.; Jönsson, P.G. Application of Different Extraction Methods for Investigation of Nonmetallic Inclusions and Clusters in Steels and Alloys. Adv. Mater. Sci. Eng. 2014, 2014, 1–7. [Google Scholar] [CrossRef] [Green Version]
- Kanbe, Y.; Karasev, A.; Todoroki, H.; Jönsson, P.G. Application of Extreme Value Analysis for Two- and Three-Dimensional Determinations of the Largest Inclusion in Metal Samples. ISIJ Int. 2011, 51, 593–602. [Google Scholar] [CrossRef] [Green Version]
- Inoue, R.; Kimura, R.; Ueda, S.; Suito, H. Applicability of Nonaqueous Electrolytes for Electrolytic Extraction of Inclusion Particles Containing Zr, Ti, and Ce. ISIJ Int. 2013, 53, 1906–1912. [Google Scholar] [CrossRef] [Green Version]
- McFarland, W.H.; Cronn, J.T. Spheroidization of type II manganese sulfides by heat treatment. Met. Mater. Trans. A 1981, 12, 915–917. [Google Scholar] [CrossRef]
- Murty, Y.V.; Morral, J.E.; Kattamis, T.Z.; Mehrabian, R. Initial coarsening of manganese sulfide inclusions in rolled steel during homogenization. Met. Mater. Trans. A 1975, 6, 2031–2035. [Google Scholar] [CrossRef]
- Shao, X.; Wang, X.; Jiang, M.; Wang, W.; Huang, F. Effect of Heat Treatment Conditions on Shape Control of Large-sized Elongated MnS Inclusions in Resulfurized Free-cutting Steels. ISIJ Int. 2011, 51, 1995–2001. [Google Scholar] [CrossRef] [Green Version]
- Inoue, R.; Ueda, S.; Ariyama, T.; Suito, H. Extraction of Nonmetallic Inclusion Particles Containing MgO from Steel. ISIJ Int. 2011, 51, 2050–2055. [Google Scholar] [CrossRef] [Green Version]
- Inoue, R.; Kiyokawa, K.; Tomoda, K.; Ueda, S.; Ariyama, T. Three dimensional estimation of multi-component inclusion particle in steel. Yejin Fenxi/Metall. Anal. 2012, 32, 1–8. [Google Scholar]
- Inoue, R.; Ariyama, T.; Suito, H. Extraction and evaluation of inclusion particles in steel. In Proceedings of the Asia Steel International Conference, S11–16; Korean Institute of Metals and Materials: Seoul, Korea, 2009; pp. 1–9. [Google Scholar]
- Du, H.Y.; Karasev, A.; Jönsson, P.G. Three-dimensional Investigations of Non-metallic Inclusions in Stainless Steels before and after Machining. ISIJ Int. 2021, in press. [Google Scholar] [CrossRef]
- Matsuoka, N.; Terano, M.; Ishiguro, T.; Abe, E.; Yukawa, N.; Ishikawa, T.; Ueshima, Y.; Yamamoto, K.; Isobe, K. Computer Simulation of Deformation Behavior of Non-metallic Inclusion in Hot-rolling. Procedia Eng. 2014, 81, 120–125. [Google Scholar] [CrossRef] [Green Version]
- Kaynak, C.; Ankara, A.; Baker, T.J. Initiation and early growth of short fatigue cracks at inclusions. Mater. Sci. Technol. 1996, 12, 421–426. [Google Scholar] [CrossRef]


| Steel Grade | C | Mn | S | O | Cr | Si | P | Ni | Mo | Al | V |
|---|---|---|---|---|---|---|---|---|---|---|---|
| 3R65 | ≤0.03 | 1.70 | ≤0.015 | - | 17.0 | 0.40 | 0.040 | 11.5 | 2.1 | - | - |
| 316L | 0.02 | 1.60 | 0.007 | 0.002 | 17.0 | 0.40 | - | 11.2 | 2.0 | 0.004 | - |
| 42CrMo4 | 0.42 | 0.80 | 0.025 | <0.001 | 1.0 | 0.20 | ≤0.025 | - | 0.23 | 0.019 | 0.004 |
| 13HMF | 0.15 | 0.49 | 0.012 | - | 0.36 | 0.29 | 0.025 | 0.04 | 0.59 | <0.005 | 0.26 |
| Steel Grade | Heating Temperature | Atmosphere | Heating Time (Minutes) | Samples | Cooling | |||
|---|---|---|---|---|---|---|---|---|
| 42CrMo4 | 900 °C | Air | 5 | - | - | - | As cast | Quenching in water |
| 5 | 10 | 15 | 30 | Rolled | ||||
| 13HMF | 5 | - | - | - | ||||
| 3R65 | 5 | - | 15 | 30 | ||||
| Sample | Coulomb (C) | Wdis (g) | Ddis (μm) | Aobs (mm2) | Num. (NMIs) | Size (L, μm) |
|---|---|---|---|---|---|---|
| 3R65 | 500 | 0.1158 | 66.7 | 1.1229 | 96 | 19 ± 27.5 (3.2–273.3) |
| 316L | 500 | 0.0878 | 104.2 | 1.1229 | 71 | 15 ± 16.7 (2.9–210.7) |
| Steel | Type | RS | PS | OS |
|---|---|---|---|---|
| 3R65 | Num. (NMIs) | 79 | 87 | 6 |
| L (μm) | 34.9 ± 25.2 (3.2–150.2) | 16.2 ± 16.1 (3.9–85.3) | 27.1 ± 24.5 (8.8–36.2) | |
| AR | 20.7 ± 10.6 (6.5–47.9) | 9.8 ± 7.4 (3.7–14.4) | 12.6 ± 5.6 (9.7–14.2) | |
| Composition | MnS(pure) | MnS(pure) | MnS-(Al,Si)O | |
| Frequency (%) | ~46 | ~51 | ~3 | |
| 316L | Num. (NMIs) | 167 | 3 | 2 |
| L (μm) | 15.9 ± 16.7 (2.0–210.7) | 12.7 ± 5.8 (8.8–20.9) | 10.1 ± 5.5 (4.5–15.6) | |
| AR | 8.7 ± 6.6 (2.0–76.4) | 6.7 ± 2.3 (3.5–8.8) | 4.2 ± 1.7 (2.5–5.8) | |
| Composition | MnS(pure) | MnS(pure) | MnS-(Al,Si)O | |
| Frequency (%) | ~97 | ~2 | ~1 |
| Type | UU | UB | BB |
|---|---|---|---|
| Typical photo | 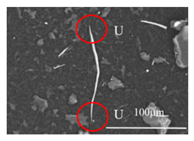 | 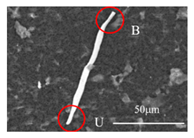 | 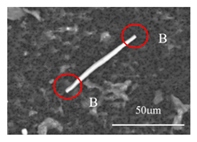 |
| Steel | Type | UU | UB | BB |
|---|---|---|---|---|
| 3R65 | L (μm) | 3.2–150.2 | 6.1–48.4 | - |
| AR | 6.5–47.9 | 3.9–17.5 | - | |
| Frequency (%) | ~97 | ~3 | - | |
| 316L | L (μm) | 2.0–210.7 | 4.9–35.0 | 8.9–20.9 |
| AR | 2.0–76.4 | 1.2–5.6 | 3.5–8.8 | |
| Frequency (%) | ~97 | ~2 | ~1 |
| Samples | Before Heat Treatment | After Heat Treatment |
|---|---|---|
| (42CrMo4) Ingot | 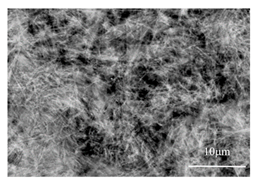 |  |
| (42CrMo4) Rolling | 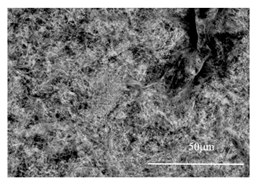 | 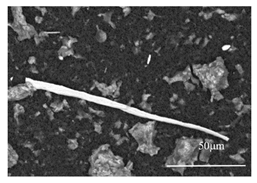 |
| Steel | Type | I (Regular) | II (Irregular) | III (Rod) |
|---|---|---|---|---|
| 42CrMo4 (Ingot) | Typical photo | 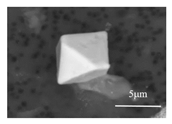 |  | 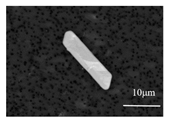 |
| Size (μm) | 4.3–20.1 | 7.1–23.3 | 18.9–49.5 | |
| Frequency (%) | 64 | 16 | 20 | |
| Type | RS | PS | OS | |
| 42CrMo4 (Rolling) | Typical photo | 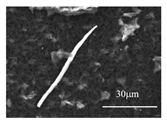 |  | - |
| L (μm) | 6.6–216.3 | 15.5–98.3 | - | |
| AR | 7.4–81.2 | 3.3–9.0 | - | |
| Frequency (%) | 96 | 4 | - |
| Sample | Time (min) | Coulomb (C) | Wdis (g) | Ddis (μm) | Aobs (mm2) | Num. (NMIs) | Size (L, μm) | Nv (mm−3) |
|---|---|---|---|---|---|---|---|---|
| 42CrMo4/05 | 5 | 500 | 0.1159 | 102 | 2.0081 | 112 | 6.6–200.3 | 4510 |
| 42CrMo4/10 | 10 | 500 | 0.1291 | 104 | 2.0081 | 127 | 9.1–216.9 | 4576 |
| 42CrMo4/15 | 15 | 500 | 0.1240 | 103 | 2.0081 | 123 | 10.8–207.3 | 4623 |
| 42CrMo4/30 | 30 | 500 | 0.1221 | 104 | 2.0081 | 119 | 9.1–185.6 | 4542 |
| Sample | Type * | UU | UB | BB |
|---|---|---|---|---|
| 42CrMo4/05 | L (μm) | 6.6–169.6 | 9.5–200.3 | 9.7–148.8 |
| AR | 3.2–81.2 | 3.3–66.7 | 3.7–52.3 | |
| Frequency (%) | ~39 | ~30 | ~31 | |
| 42CrMo4/10 | L (μm) | 9.1–139.4 | 10.7–216.3 | 26.7–151.5 |
| AR | 4.1–47.1 | 5.0–71.9 | 5.6–44.2 | |
| Frequency (%) | ~36 | 39 | ~25 | |
| 42CrMo4/15 | L (μm) | 10.8–207.3 | 11.2–165.0 | 12.5–118.5 |
| AR | 6.3–51.2 | 5.7–47.4 | 5.4–35.6 | |
| Frequency (%) | 34 | 34 | 32 | |
| 42CrMo4/30 | L (μm) | 9.1–164.5 | 21.7–161.6 | 15.2–185.6 |
| AR | 6.8–49.5 | 7.2–43.2 | 6.3–54.7 | |
| Frequency (%) | ~35 | 32 | ~33 |
| Sample | Coulomb (C) | Wdis (g) | Ddis (μm) | Aobs (mm2) | Num. (NMIs) | Size (L, μm) | Nv (mm−3) |
|---|---|---|---|---|---|---|---|
| 13HMF/05 | 500 | 0.1344 | 85 | 0.504 | 147 | 1.7–110.3 | 20,313 |
| Type | RS | PS | OS |
| Typical photo |  |  | - |
| L (μm) | 1.7–92.8 | 3.2–110.3 | - |
| AR | 2.6–40.6 | 6.6–30.0 | - |
| Composition | MnS(pure) | MnS(pure) | - |
| Frequency (%) | 92 | 8 | - |
| Type | UU | UB | BB |
| Typical photo |  |  |  |
| L (μm) | 1.7–110.3 | 18.2–82.3 | 19.6–44.5 |
| AR | 2.6–37.9 | 5.5–19.3 | 3.0–12.9 |
| Composition | MnS(pure) | MnS(pure) | MnS(pure) |
| Frequency (%) | 88 | 8 | 4 |
| Sample | Coulomb (C) | Num. (NMIs) | Wdis (g) | Ddis (μm) | Aobs (mm2) | Nv (mm−3) | Size (L, μm) | AR | UU% |
|---|---|---|---|---|---|---|---|---|---|
| 316L | 100 | 45 | 0.0218 | 26 | 1.1229 | 17,207 | 2.68–82.40 | 3.23–37.30 | ~98 |
| 200 | 77 | 0.0422 | 50 | 1.1229 | 15,210 | 3.36–72.84 | 2.52–28.07 | ~97 | |
| 300 | 131 | 0.0608 | 72 | 1.1229 | 17,960 | 2.63–171.54 | 2.18–33.68 | ~98 | |
| 500 | 172 | 0.0878 | 104 | 1.1229 | 16,330 | 2.19–210.72 | 0.04–62.39 | ~97 | |
| 1000 | 365 | 0.1995 | 237 | 1.1229 | 15,251 | 2.06–154.43 | 1.93–76.42 | ~99 |
| Sample | Size Range (μm) | (μm) | UU% | RS% | PS% | OS% | |
|---|---|---|---|---|---|---|---|
| 100C | <10 | 6.63 ± 1.97 | 6.37 ± 2.10 | 100 | ~98 | ~2 | - |
| 10–50 | 24.93 ± 10.83 | 11.66 ± 4.82 | ~95 | ||||
| 50–100 | 67.57 ± 11.16 | 22.49 ± 10.27 | 100 | ||||
| >100 | - | - | - | ||||
| 200C | <10 | 7.06 ± 1.76 | 6.43 ± 2.18 | ~85 | ~96 | ~3 | ~1 |
| 10–50 | 17.65 ± 8.32 | 10.18 ± 4.57 | 100 | ||||
| 50–100 | 64.01 ± 8.82 | 20.53 ± 2.91 | 100 | ||||
| >100 | - | - | - | ||||
| 300C | <10 | 5.73 ± 2.01 | 4.88 ± 1.62 | 100 | ~97 | ~2 | ~1 |
| 10–50 | 20.93 ± 9.47 | 10.40 ± 3.88 | ~97 | ||||
| 50–100 | 62.84 ± 8.62 | 17.79 ± 9.26 | 100 | ||||
| >100 | 135.43 ± 25.53 | 24.86 ± 8.78 | 100 | ||||
| 500C | <10 | 5.33 ± 2.12 | 4.84 ± 2.09 | ~99 | ~99 | ~1 | - |
| 10–50 | 23.68 ± 11.96 | 13.13 ± 7.28 | ~90 | ||||
| 50–100 | 67.79 ± 13.41 | 27.26 ± 11.47 | ~95 | ||||
| >100 | 152.63 ± 31.51 | 46.92 ± 9.32 | 100 | ||||
| 1000C | <10 | 5.42 ± 1.94 | 4.53 ± 1.70 | ~99 | ~97 | ~2 | ~1 |
| 10–50 | 22.49 ± 11.01 | 10.34 ± 5.68 | ~98 | ||||
| 50–100 | 66.69 ± 13.60 | 17.92 ± 7.56 | 100 | ||||
| >100 | 143.06 ± 11.37 | 51.31 ± 25.11 | 100 |
| Sample | Temperature (°C) | Time (min) | Wdis (g) | Ddis (μm) | Aobs (mm2) | Num. (NMIs) | Size (L, μm) | Nv (mm−3) |
|---|---|---|---|---|---|---|---|---|
| 3R65/00 | 25 | 0 | 0.1079 | 74 | 2.2458 | 172 | 3.2–150.2 | 6643 |
| 3R65/05 | 900 | 5 | 0.1097 | 69 | 2.2458 | 170 | 3.7–273.3 | 6458 |
| 3R65/15 | 900 | 15 | 0.1070 | 66 | 2.2458 | 167 | 4.2–217.2 | 6504 |
| 3R65/30 | 900 | 30 | 0.1081 | 69 | 2.2458 | 169 | 5.0–197.5 | 6515 |
| Steel | Type | UU | UB | BB |
|---|---|---|---|---|
| 3R65/00 | Size (L, μm) | 29.8 ± 28.4 (3.2–150.2) | 19.7 ± 14.7 (5.6–48.3) | - |
| AR | 12.8 ± 8.1 (3.5–49.2) | 9.7 ± 5.0 (3.8–17.5) | - | |
| Frequency (%) | ~97 | ~3 | - | |
| 3R65/05 | Size (L, μm) | 32.6 ± 23.9 (3.7–273.3) | 18.6 ± 9.6 (6.1–29.1) | - |
| AR | 15.9 ± 10.8 (3.2–49.6) | 10.1 ± 6.5 (4.0–20.7) | - | |
| Frequency (%) | ~97 | ~3 | - | |
| 3R65/15 | Size (L, μm) | 28.0 ± 31.2 (4.2–217.2) | 14.9 ± 9.9 (3.5–65.6) | - |
| AR | 13.6 ± 9.8 (3.9–49.1) | 8.1 ± 3.9 (3.4–13.6) | - | |
| Frequency (%) | ~98 | ~2 | - | |
| 3R65/30 | Size (L, μm) | 29.0 ± 21.6 (5.0–197.5) | 19.1 ± 10.8 (10.2–72.8) | - |
| AR | 15.2 ± 8.9 (4.0–47.7) | 10.8 ± 11.7 (5.1–32.2) | - | |
| Frequency (%) | ~98 | ~2 | - |
Publisher’s Note: MDPI stays neutral with regard to jurisdictional claims in published maps and institutional affiliations. |
© 2021 by the authors. Licensee MDPI, Basel, Switzerland. This article is an open access article distributed under the terms and conditions of the Creative Commons Attribution (CC BY) license (http://creativecommons.org/licenses/by/4.0/).
Share and Cite
Guo, S.; Karasev, A.V.; Tilliander, A.; Jönsson, P.G. Evaluation of Sulfide Inclusions before and after Deformation of Steel by Using the Electrolytic Extraction Method. Metals 2021, 11, 543. https://doi.org/10.3390/met11040543
Guo S, Karasev AV, Tilliander A, Jönsson PG. Evaluation of Sulfide Inclusions before and after Deformation of Steel by Using the Electrolytic Extraction Method. Metals. 2021; 11(4):543. https://doi.org/10.3390/met11040543
Chicago/Turabian StyleGuo, Shuo, Andrey Vladimirovich Karasev, Anders Tilliander, and Pär Göran Jönsson. 2021. "Evaluation of Sulfide Inclusions before and after Deformation of Steel by Using the Electrolytic Extraction Method" Metals 11, no. 4: 543. https://doi.org/10.3390/met11040543