Article

Hot Deformation Behavior of a Ni-Based Superalloy with Suppressed Precipitation

by
Franco Lizzi
1,2,3,
Kashyap Pradeep
3,4,
Aleksandar Stanojevic
5,
Silvana Sommadossi
1,2 and
Maria Cecilia Poletti
3,4,*
1
Materials Characterization, Comahue National University, Neuquén 8300, Argentina
2
IITCI CONICET-UNCo, Neuquén 8300, Argentina
3
Christian Doppler Laboratory for Design of High-Performance Alloys by Thermomechanical Processing, 8010 Graz, Austria
4
Institute of Materials Science, Joining and Forming, Graz University of Technology, 8010 Graz, Austria
5
Voestalpine Böhler Aerospace GmbH & Co KG, 8605 Kapfenberg, Austria
*
Author to whom correspondence should be addressed.
Metals 2021, 11(4), 605; https://doi.org/10.3390/met11040605
Submission received: 7 March 2021 / Revised: 18 March 2021 / Accepted: 23 March 2021 / Published: 8 April 2021
(This article belongs to the Special Issue High-Temperature Behavior of Metals)

Abstract

:
Inconel®718 is a well-known nickel-based super-alloy used for high-temperature applications after thermomechanical processes followed by heat treatments. This work describes the evolution of the microstructure and the stresses during hot deformation of a prototype alloy named IN718WP produced by powder metallurgy with similar chemical composition to the matrix of Inconel®718. Compression tests were performed by the thermomechanical simulator Gleeble®3800 in a temperature range from 900 to 1025 °C, and strain rates scaled from 0.001 to 10 s−1. Flow curves of IN718WP showed similar features to those of Inconel®718. The relative stress softening of the IN718WP was comparable to standard alloy Inconel®718 for the highest strain rates. Large stress softening at low strain rates may be related to two phenomena: the fast recrystallization rate, and the coarsening of micropores driven by diffusion. Dynamic recrystallization grade and grain size were quantified using metallography. The recrystallization grade increased as the strain rate decreased, although showed less dependency on the temperature. Dynamic recrystallization occurred after the formation of deformation bands at strain rates above 0.1 s−1 and after the formation of subgrains when deforming at low strain rates. Recrystallized grains had a large number of sigma 3 boundaries, and their percentage increased with strain rate and temperature. The calculated apparent activation energy and strain rate exponent value were similar to those found for Inconel®718 when deforming above the solvus temperature.

1. Introduction

Inconel®718 nickel-based superalloy is well known for its high mechanical and creep resistances. It presents high fatigue resistance at high temperatures and is suitable for use in corrosive environments [1]. These characteristics of Inconel®718 allow its use in a wide application range, such as in the aeronautical and energy production industries [2,3]. The alloy is used in aerospace engines, where creep resistance at the service temperature is required [4]. The most well-known feature that makes Inconel®718 very attractive for its best mechanical properties is the presence of different types of precipitates [5]. The alloy presents four distinct phases: the FCC matrix γ, and the precipitates γ’, γ” and δ. The γ’ phase is Ni3(Al,Ti) with a cubic (L12) crystal structure; the γ” phase has a composition Ni3Nb and bct (D022) crystal structure; and the δ phase is described by Ni3Nb and has an orthorhombic (D0a) crystal structure [6,7]. The first two precipitates are responsible for the hardening effect, while the δ phase can be used to control the grain size, thus improving hardness and ductility [8]. The material can be cast and forged or produced by powder metallurgy (PM). Nickel-based superalloys produced by this technique have shown high fatigue resistance, hot-corrosion resistance, high-temperature mechanical properties, and high oxidation resistance up to 900 °C [9]
Inconel®718 is also characterized by being a material with low stacking fault energy [10]. During hot deformation, dynamic recovery (DRV) due to the annihilation and arrangement of dislocations into subgrain boundaries is fast overcome by the formation of new grains due to discontinuous dynamic recrystallization (dDRX) [11]. In the initial stages of deformation, dislocation multiplication results in strain hardening. In low stacking fault energy alloys, DRV hardly proceeds due to the restricted movement of dislocations and their decomposition into stable partial dislocations [12]. The material undergoes dDRX at strains over the critical strain by the formation of nuclei and their growth by the movement of the high-angle grain boundary [13,14]. In the specific case of Inconel®718, it the formation of annealing twins during recrystallization is widely accepted. It is reported that twins with boundaries type ∑3 are promoted at higher temperatures and lower strain rates [15]. The main restoration process during forging is dynamic recrystallization (DRX), which, in competition with the DRV, reduces the stored energy [16,17]. However, it is precisely after hot forming at an industrial scale where meta-dynamic (mDRX) and post-dynamic (pDRX) recrystallization play an important role in nickel-based superalloys, especially at high strain rates [18]. The final microstructures then depend on the deformation parameters, such as temperature, strain, and strain rate, and also on the material history after deformation.
The presence of solutes and precipitates reduces the mobility of dislocations and boundaries in general. The most well-known temperature–time transformation (TTT) diagram of Inconel®718 [19] shows that precipitates can be formed before deformation below 930 °C during the soaking time. This precipitation is accelerated if the deformation is applied before the annealing treatment as shown by Renhof, L. et al. [20]. The solvus of the δ phase occurs between 990 and 1020 °C [21]. Other works [22,23] concluded that the δ phase can partially dissolve and fracture during deformation. The remaining particles can further stimulate the nucleation of DRX grains by inducing the generation and rotation of subgrains. In the presence of δ phase particles, grain growth can be hindered by the Zener pinning effect [24]. Many studies have been done to characterize the behavior of standard Inconel®718 alloys under different conditions. The behavior of the low-temperature deformation is affected by the presence of precipitates, especially of the δ phase with a solvus temperature between 990 and 1020 °C, depending on the chemical composition [25]. Primary γ’ precipitates can also promote the recrystallization process by a mechanism called heteroepitaxial recrystallization [26]. In this case, the recrystallized grains grow with the same crystallographic orientation as the precipitate.
The present work focuses on the study of the behavior of an alloy where the precipitation is strongly reduced. In this context, the main objective of the present work is to describe the hot deformation behavior of a nickel-based superalloy with modified chemical composition to simulate the behavior of the matrix Inconel®718 without the massive interaction with δ, γ’ and γ”. The outcome is compared with standard Inconel®718.

2. Materials and Methods

2.1. Materials

The innovative investigated material identified as “IN718WP” is a nickel-based superalloy based on the chemical composition of the γ phase of a standard Inconel®718 after precipitation of the other phases [27]. The precipitation of γ’, γ” and δ phases is therefore strongly reduced. To achieve this, two main requirements for fundamental deviations from the chemical composition of standard Inconel®718 were changed. Firstly, Cr and Fe contents were slightly increased as solid solution strengtheners. Secondly, Al, Ti, and Nb contents were significantly decreased to avoid the formation of γ”, γ’ and δ phases. C was kept low to reduce the formation of carbides. With the above-mentioned changes in the chemical composition, an IN718WP disc of diameter 195 mm was produced by powder metallurgy at Voestalpine BÖHLER Edelstahl GmbH (Kapfenberg, Austria). The chemical composition of the IN718WP (in weight percentage) is shown in Table 1. The nominal chemical composition of Inconel®718 alloy is included for comparison [28]. Powder metallurgy was used to produce a material with a homogeneous small grain size, avoiding any grain coarsening expected to occur during upsetting. The hot compression trials studied here were meant to close the micro-porosity of the as-received condition.

2.2. Compression Tests

Samples of 8 mm diameter and 15 mm length were compressed in the Gleeble®3800 simulator at 5 different strain rates (0.001, 0.01, 0.1, 1 and 10 s−1) and 6 different temperatures (900, 925, 950, 975, 1000 and 1025 °C), up to a maximum strain of 0.8. A K-type thermocouple was spot-welded at the surface of the specimen to measure and control the temperature during the process. The samples were (i) heated by direct resistance at 5 °C/s to the selected temperature; (ii) homogenized for 2 min at the same temperature; (iii) compressed; and (iv) in situ water-quenched with water jets to freeze the microstructure. Graphite and tantalum foils were used between the edges of the specimens and the anvils to reduce the effects of friction during hot deformation and to decrease the temperature gradient along the sample. An Ar atmosphere was used to mitigate oxidation during the tests. The flow curves obtained experimentally were temperature-corrected to represent isothermal deformation conditions based on the literature [29,30] as described by P. Wang et al. [31]. The flow curves were not corrected by friction. Contrary to the tendency obtained in the work of G. Tan et al. [32] and in many other publications, the largest barrelling observed in our work occurred at the smallest strain rate. This must be related to a different mechanism of barrelling, such as wedge cracking promoted by diffusion, already observed by S.C. Medeiros et al. [33].
The interdependence of peak flow stress σ, strain rate ε ˙ and deformation temperature T was described using semi-empirical equations, as done for Mg alloys by C. Poletti et al. [34] and for steels by M. El Mehtedi et al. [35]. The analysis of the flow stress at the peak value was carried out using the universal constitutive equation proposed by Sellars and Tegart [36]:
A sinh α σ n = ε ˙   exp Q / RT = Z
where A and α are material constants, R is the gas constant (8.314 J/kmol), T is the absolute temperature, Q is the apparent energy of activation, and n is the stress exponent. The last term is identified as the Zener–Hollomon parameter Z. The α constant was obtained from Equation (2):
α = β n 1
The coefficients β and n1 are obtained from Equations (3) and (4)
ε ˙   exp Q / RT =   A 1 σ n 1
ε ˙   exp Q / RT =   A 2 exp β σ
The slope of ln ( ε ˙ ) vs. ln ( σ ) gives n 1 , while the slope of ln ( ε ˙ ) vs. σ gives β.
The power law equation was additionally used for comparison:
A P σ n P = ε ˙   exp Q P / RT   = Z P
The subscript p refers to the power law. The power law is useful at low strain rates and high temperatures (low Z), but it deviates from this relationship at higher Z values.
The relative softening is calculated using the difference of the stress values at the peak and the stress value at a given strain and divided by the stress at the peak. This relative softening was then plotted as a function of the strain. Additionally, the relative softening at 0.6 of strain was compared with values obtained from the literature for Inconel®718.

2.3. Microstructure Characterization

The samples were cut in the compression direction at their center, embedded in resin, ground and polished, and chemically attacked with a mixture of ethanol, hydrochloric acid, and hydrogen peroxide (75 mL C2H5OH + 33 mL HCl + 3 mL H2O2) for optical microscopy. The selected samples were observed with an optical microscope provided by the company Zeiss, and the grain size was obtained following the interception method recommended by the American Society for Testing and Materials (ASTM) in the norm ASTM E112-12 [37].
Some samples without etching were analyzed with a field emission gun scanning electron microscope (FEG-SEM) model Mira3 of the TESCAN company (Brno, Czech Republic) using an accelerating voltage between 18 and 20 kV and step sizes of 0.1 μm (for high resolution) and 0.7 µm (for lower resolution). A backscattered electron (BSE) detector was used to identify carbides and pores within the matrix. A Hikari detector provided by EDAX (AMETEK GmbH, Weiterstadt, Germany) was used for electron backscattered diffraction (EBSD) to measure the local crystal orientation. OIM Analysis™ software (AMETEK GmbH, Weiterstadt, Germany) was used to determine the grain size and recrystallization percentages. Firstly, a cleaning process was applied to the EBSD measurements based on the CI (confidence index) standardization and neighborhood correlation. The following parameters were used: grain tolerance angle of 15°, a minimal grain size of 2 pixels, and a CI higher than 0.9. Recrystallized grains were identified by two features: a grain boundary angle larger than 15° and a grain orientation spread (GOS) smaller than 2.5 [38]. The average recrystallized grain size was obtained out of these criteria and the recrystallization fraction was obtained by dividing the area covered by the recrystallized grains with the inspected area (120 µm × 200 µm). Due to the formation of annealing twins during dynamic recrystallization (DRX), the reconstruction of the grains was performed once, considering all high-angle grain boundaries (with twins), and the second time by considering the annealing twins Σ3 and Σ9 to belong to the grain (without twins). Finally, the recrystallized grain size R X was correlated with the Zener–Hollomon parameter, rearranging the equation presented by G. Shen et al. [39] for a Waspaloy as follows:
ln Z = B + C ln RX
where B and C are materials constants.

3. Results

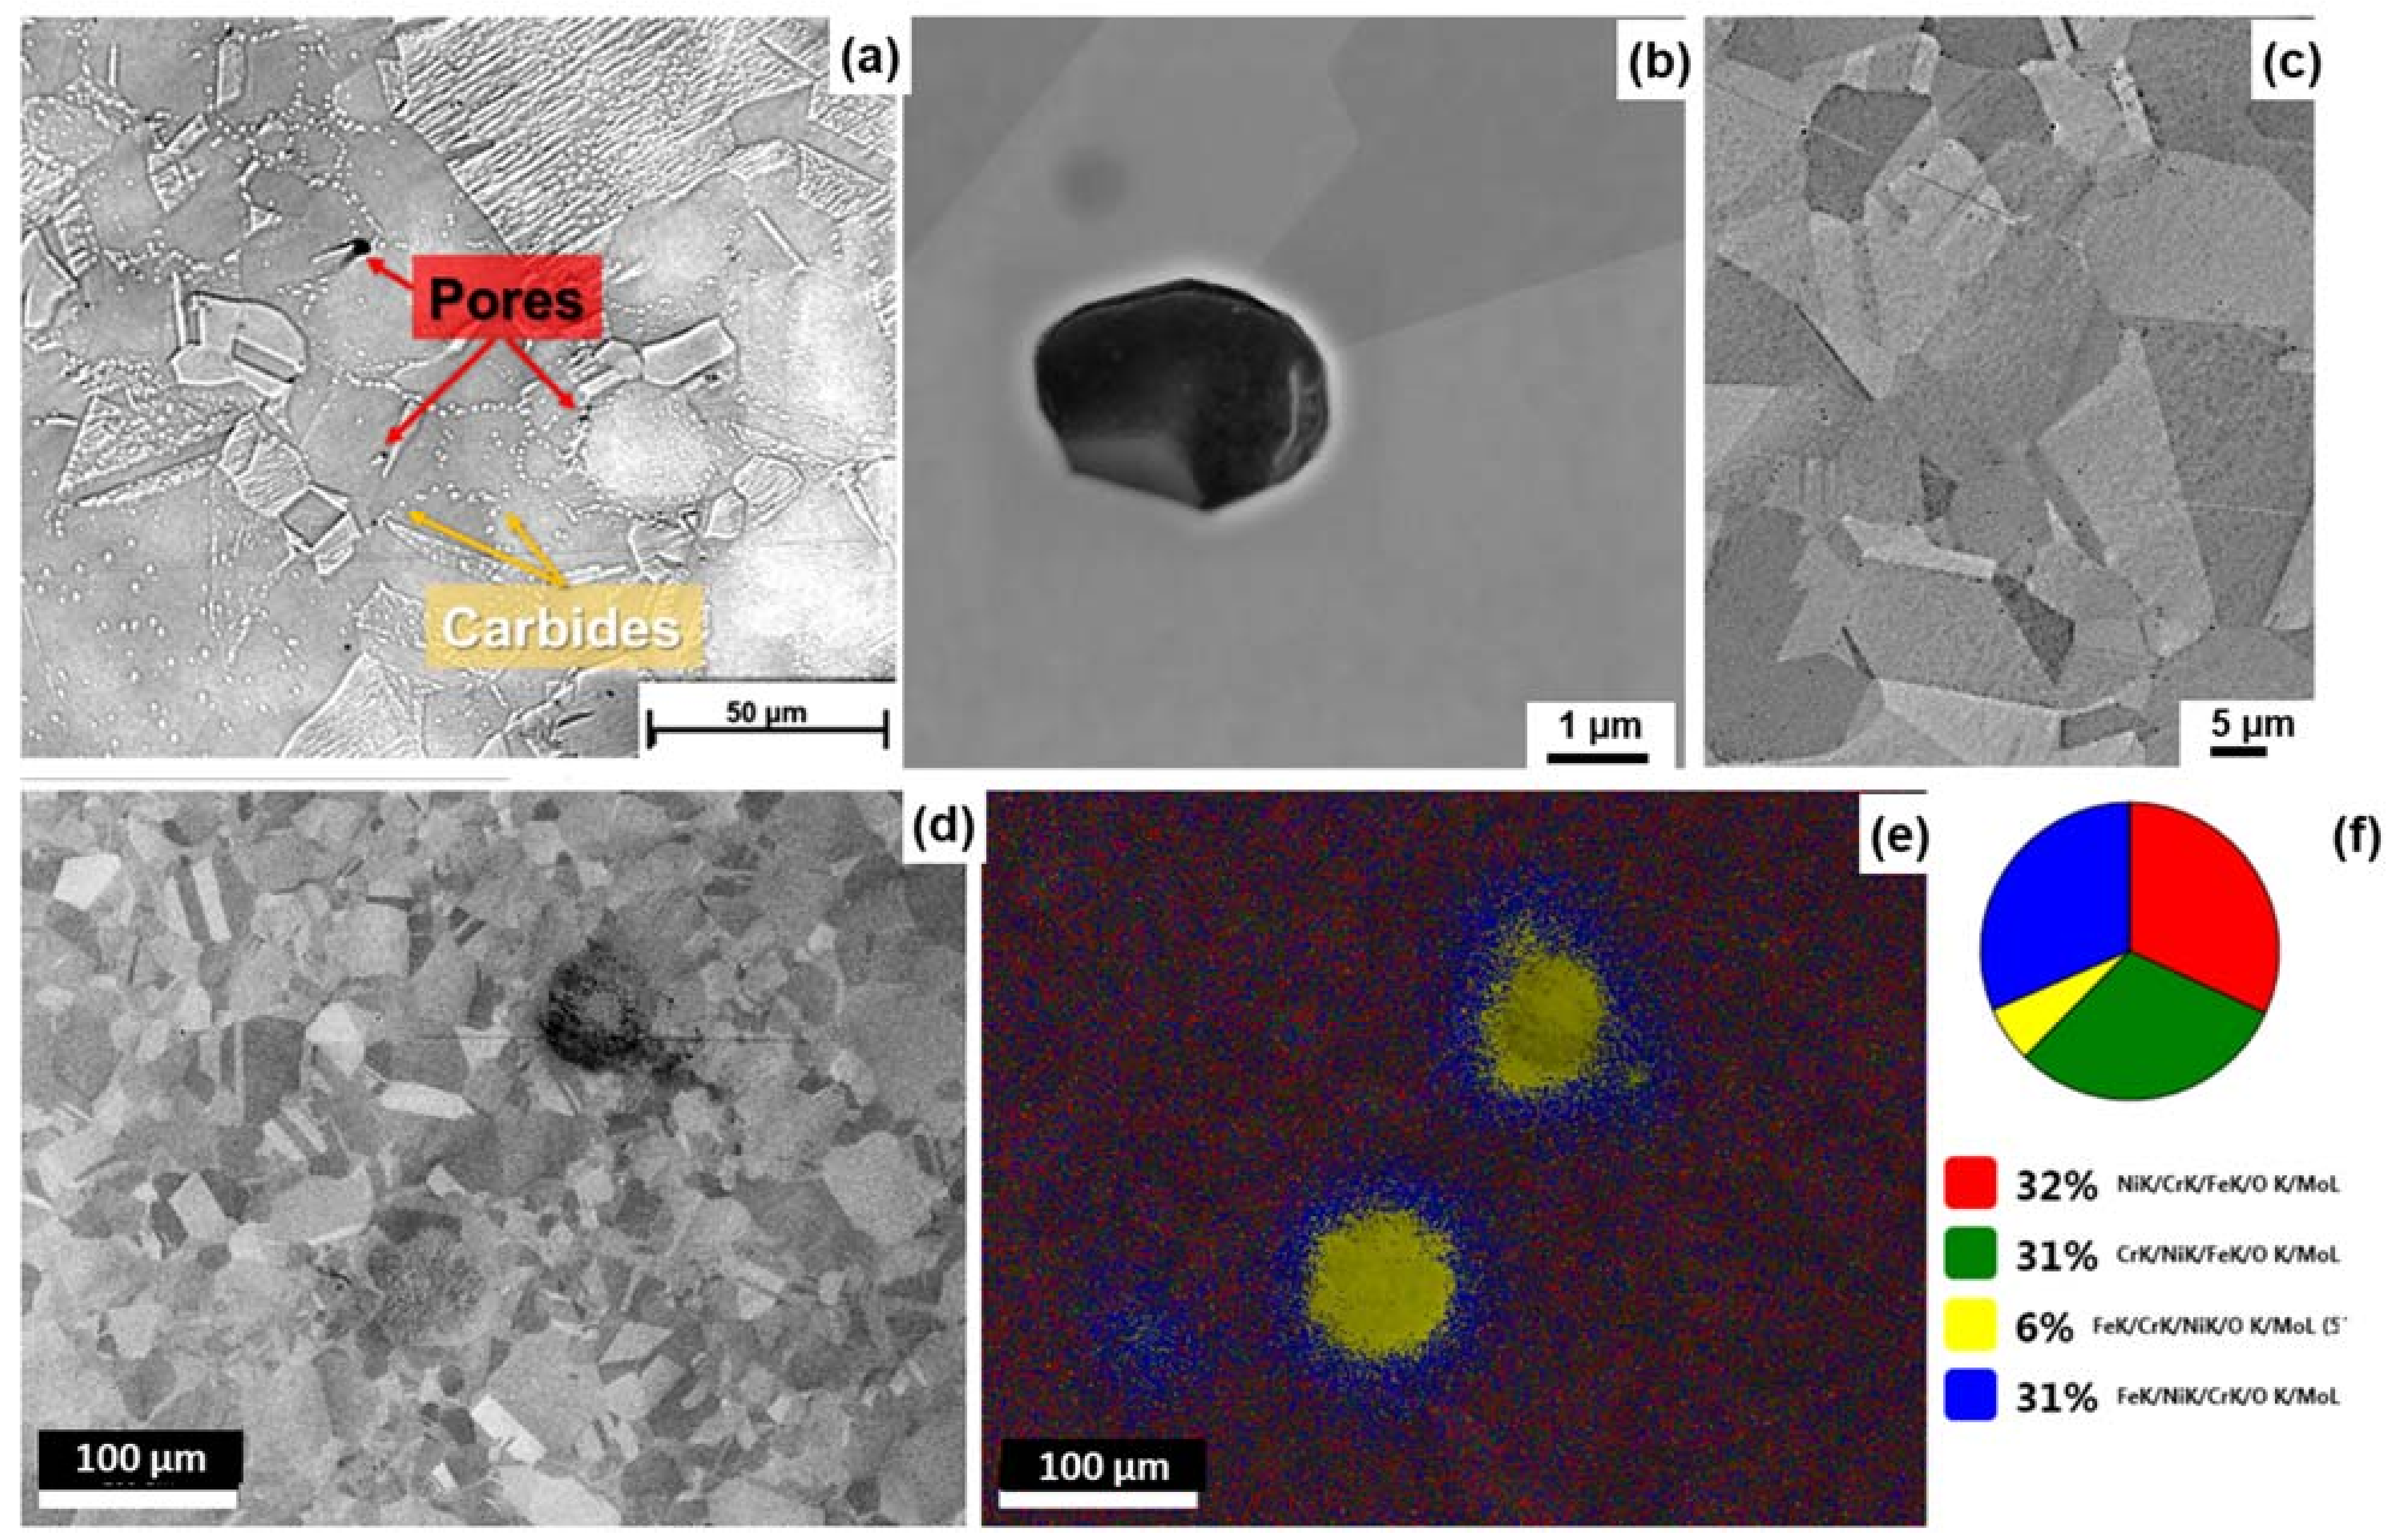
3.1. Initial Microstructure
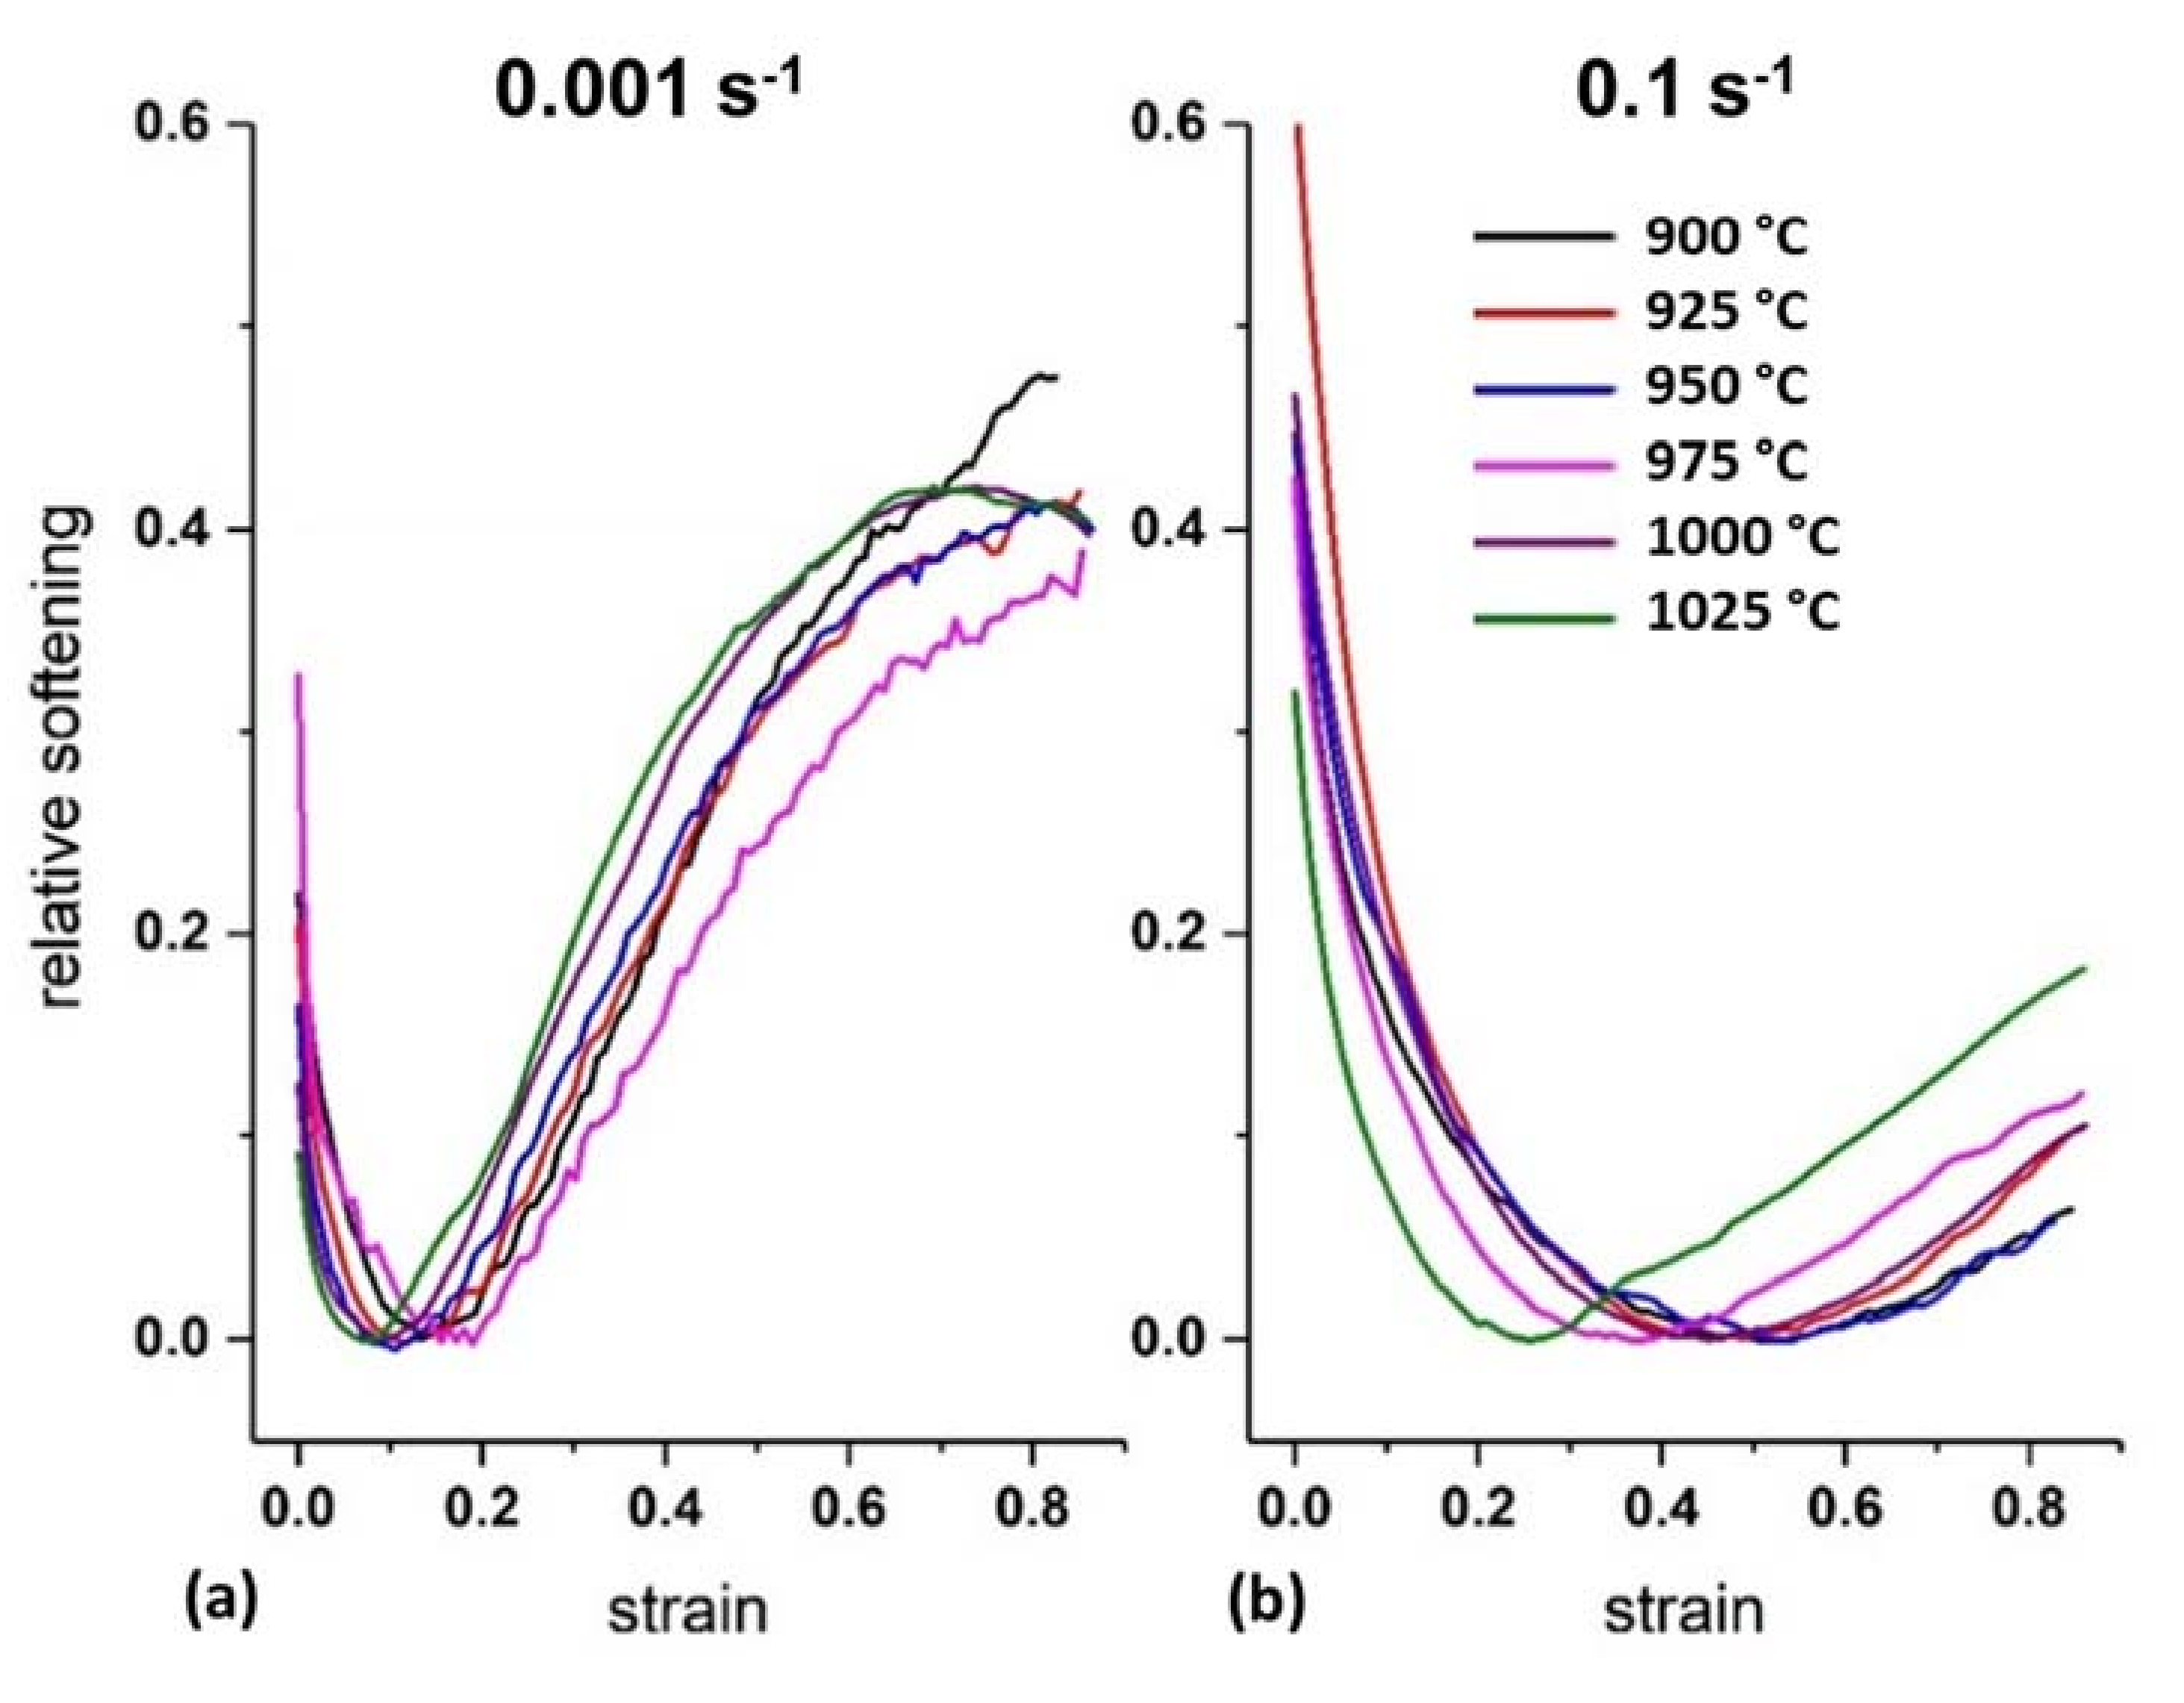
The initial microstructure of the as-received material was characterized by a mean grain diameter (without twins) of 20.4 µm. The microstructure showed annealing twins, as identified with the optical microscope in Figure 1a,b. Light optical images also showed the presence of micropores at some grain boundaries and carbides with sizes smaller than 1 µm decorating the grain boundaries. Micropores are typical features in powder metallurgy products [40]. Apart from the carbides, no other precipitates were detected, even at high resolution (Figure 1b,c). Additionally, Fe-rich regions were observed regularly in the sample with sizes between 60 and 100 µm (see Figure 1d,e), due to a lack of Fe mixing in the matrix during the sintering process. These Fe-rich regions occupied 1.25% of the volume.
The measured hardness of the as-received material was 199 HV, a value lower than the standard Inconel®718 alloy after solid solution treatment (245 HV), and much lower than the values of the standard Inconel®718 alloy after heat treatments (up to 500 HV) [41].

3.2. Flow Curves

The experimental flow curves corrected by temperature are shown in Figure 2. The curves present the typical characteristic of DRX: a single peak up to the peak stress, preceded by a rapid rise [18]. After the peak had been reached, the stress drops reached steady-state flow stress and suggested that recrystallization was not completed for all deformations. The strains at which the peak stress values are reached are a function of the temperature and the strain rate. The higher the temperature and the slower the deformation, the smaller the strains to start (just before peak stress) and finish (flow steady-state) the recrystallization. The increase with a large slope of the stress is a characteristic of alloys with low stacking fault energy (SFE) [11], such as the nickel alloy studied here.
In the whole temperature range, the peak stress decreased with increasing temperature and decreasing strain rate. Softening was more noticeable in the flow curves of the lowest strain rates (0.001–0.1 s−1). The curves corresponding to the highest strain rates (1 and 10 s−1) showed lower yield stress than the values reported for Inconel®718 at any temperature [42,43]. At high strain rates and low temperatures, a very small yield strength was calculated, and two hardening slopes were identified in Figure 2a. These phenomena could be related to the activity of deformation bands.
The relative softening was plotted as a function of the strain in Figure 3. This softening was highly dependent on the strain rate, while the temperature had a negligible influence on the softening values and the shape of the curves. In general, it can be observed that at the strain rates between 0.1 and 10 s−1, the hardening part consisted of a curve with two slopes. Then, the curves reached a minimum, corresponding to the peak stress. This minimum occurred at higher strains. The temperature plays a secondary role, as observed for comparison in Figure 4. It can be seen that the temperature has an influence on the hardening slope and on the strain at the peak stress, where the softening reaches zero. The higher the temperature, the lower the strain required to reach this condition. Furthermore, the softening rate, given by the slope after the zero value, is not influenced by the temperature at the measured conditions.
While the softening at high strain rates is comparable with values in the literature for Inconel®718 [18,42,43], much larger values of softening are observed at strain rates below 0.01s−1. The softening of the model alloy IN718WP can reach 40% at the lowest strain rates, and only 5% at the highest strain rate (Figure 5).

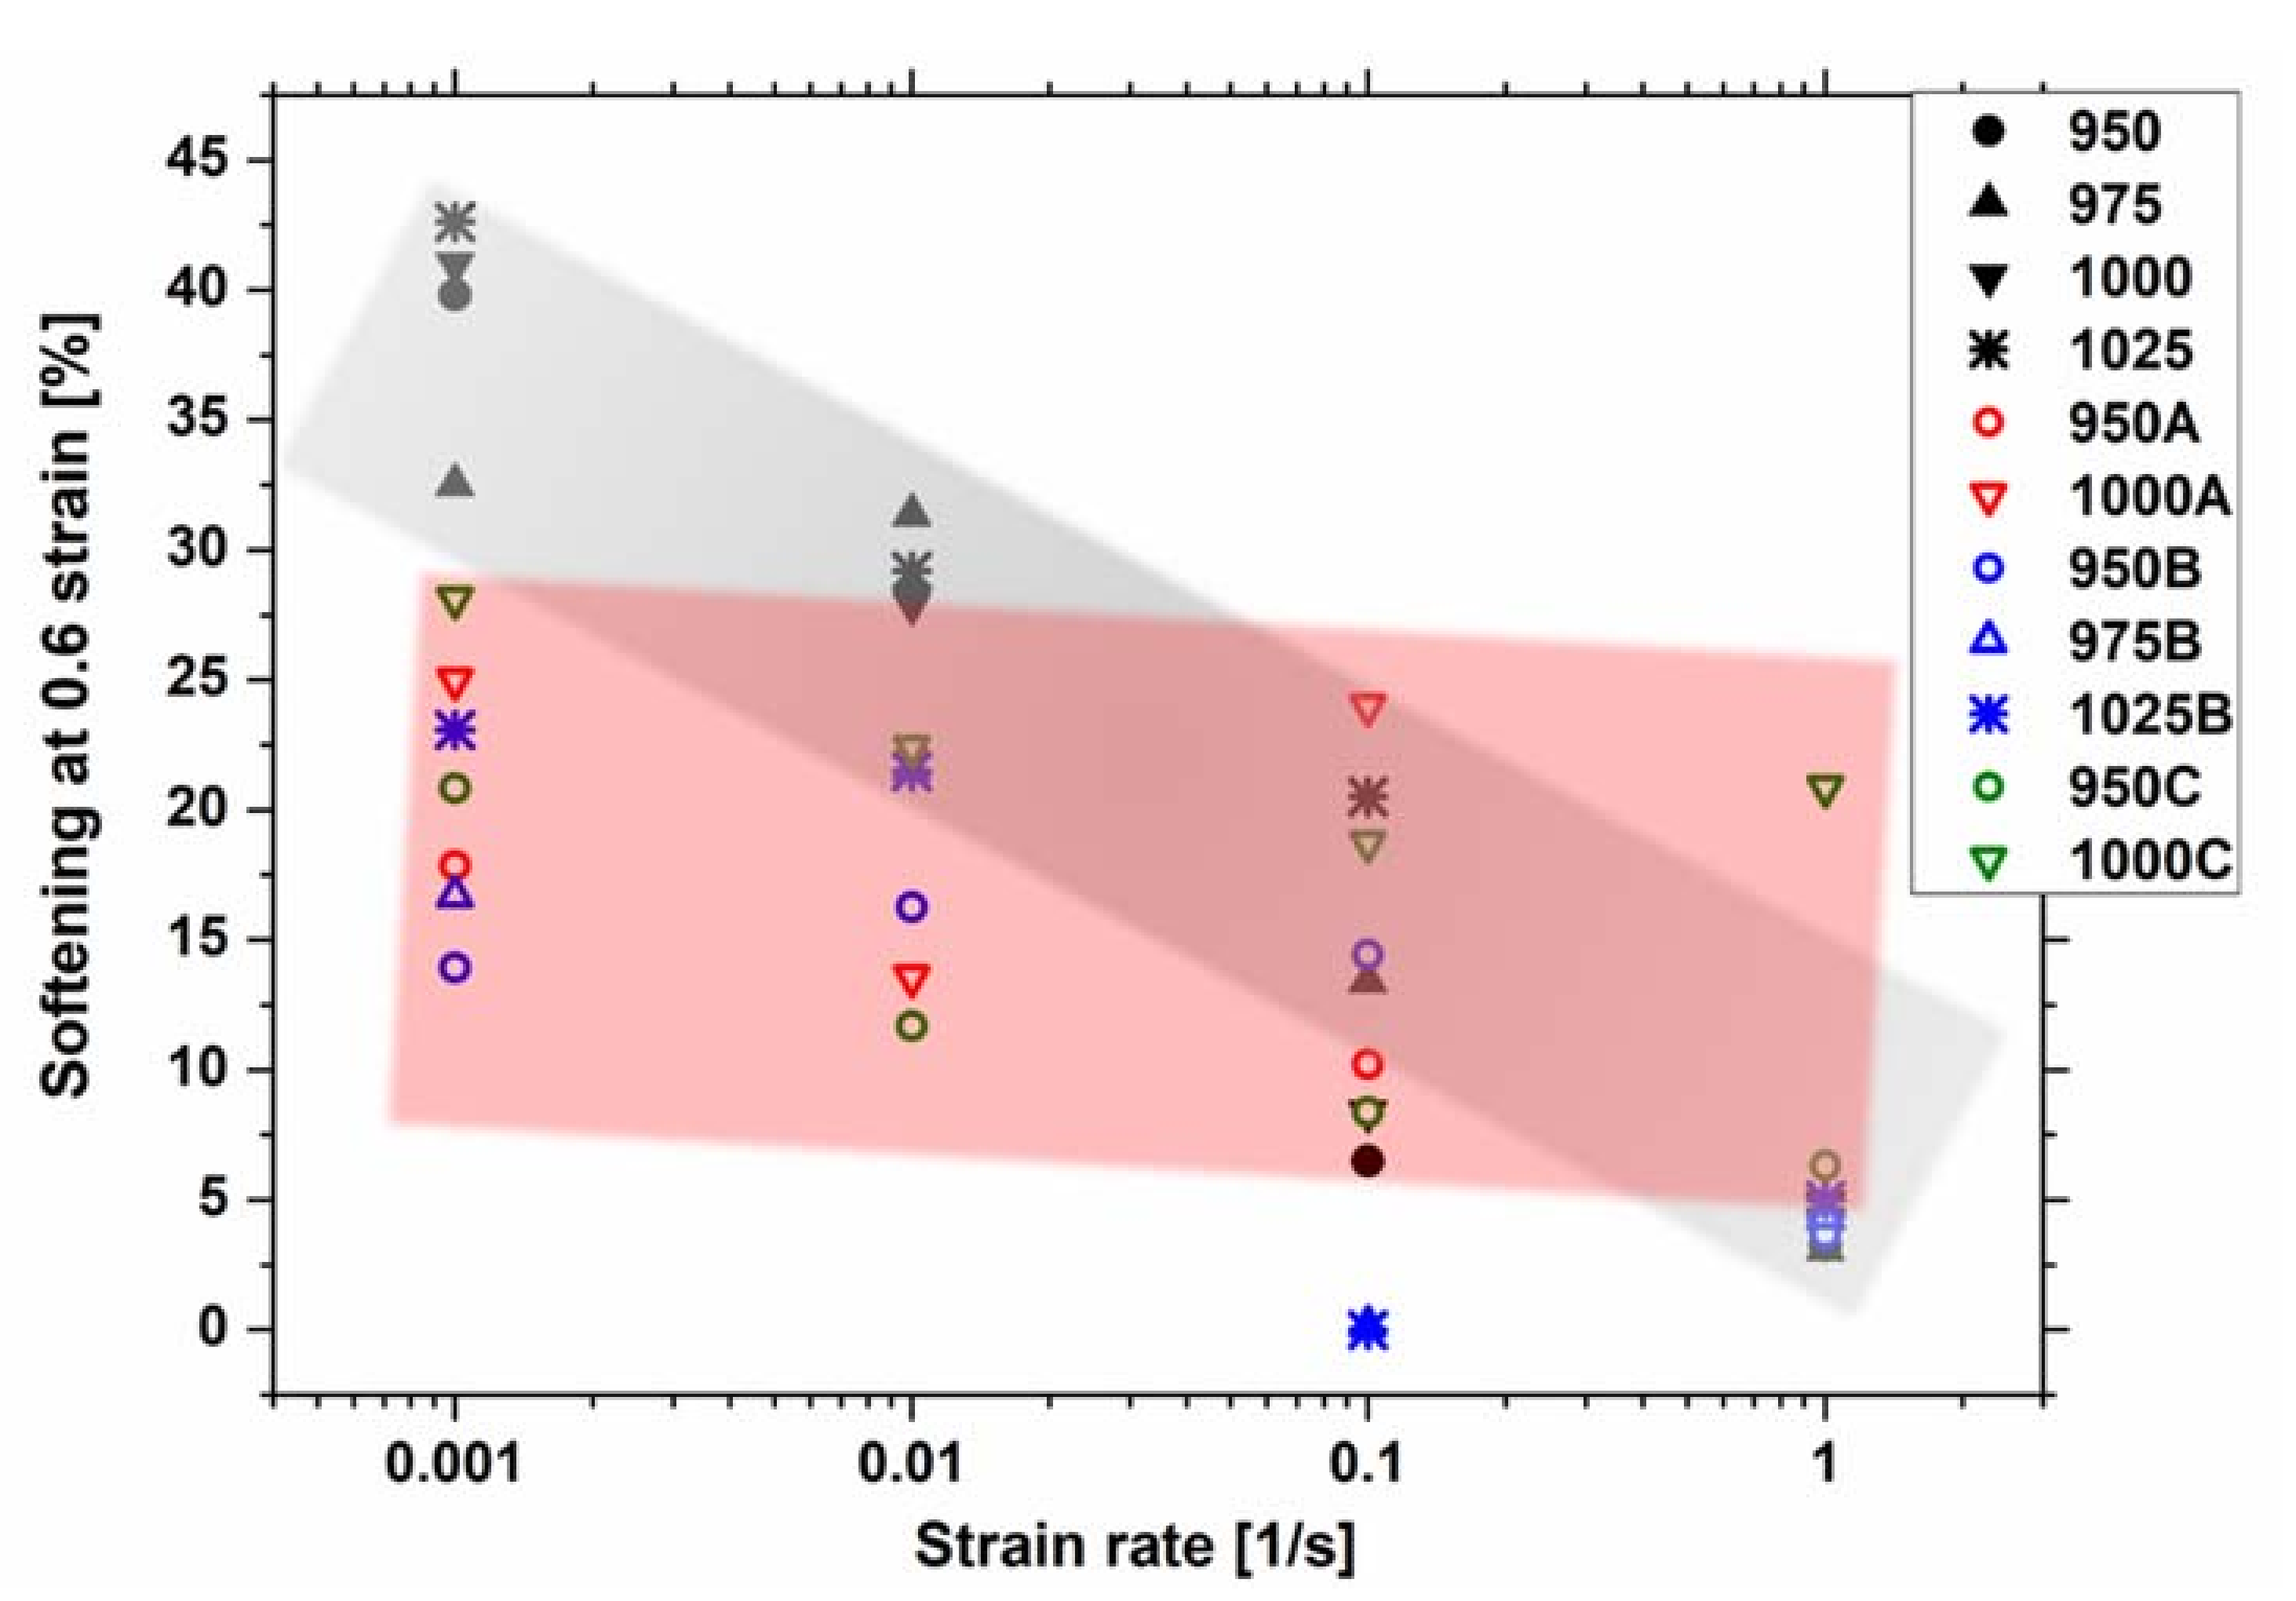
3.3. Phenomenological Relationships

The peak stresses were correlated with the Zener–Hollomon parameter using Equations (1) and (4). The calculated average values of β and n1 calculated from Equations (2) and (3) were 0.0275 and 60,282, respectively. The activation energy Q = 450 kJ/mol, the stress exponent n = 4.76, and α = 0.0046 were obtained using the sinh relationship (Equation (1)). The mean values of n and Q obtained for the creep law (Equation (4)) are n = 6 and Q = 400 kJ/mol. Using the creep relationship, Q has shown to be highly dependent on the strain rate ε ˙ . Figure 6 shows the correlation of the peak stress with the Zener–Hollomon parameter calculated using both approaches. It can be seen that the correlation provided with Equation (1) deviates less at higher Z values than the power law (Equation (4)).
The values of the apparent activation energies Q obtained using Equations (1) and (4) are in agreement with the literature for Inconel®718 [8,23,43,44,45] (see Table 2) using similar α values for the sinh equation type. On the other hand, the stress exponents n found in the literature for Inconel®718 are similar to the value found here (4.76) when deforming above the solvus temperature. This must be related to a similar plastic deformation mechanism for both materials. A dependency of n with temperature was reported in the literature as well ([8,23]). The high values at low temperatures were attributed to the interaction of dislocations with particles [8]. This observation was in contradiction with the dependency of n with the temperature [23].

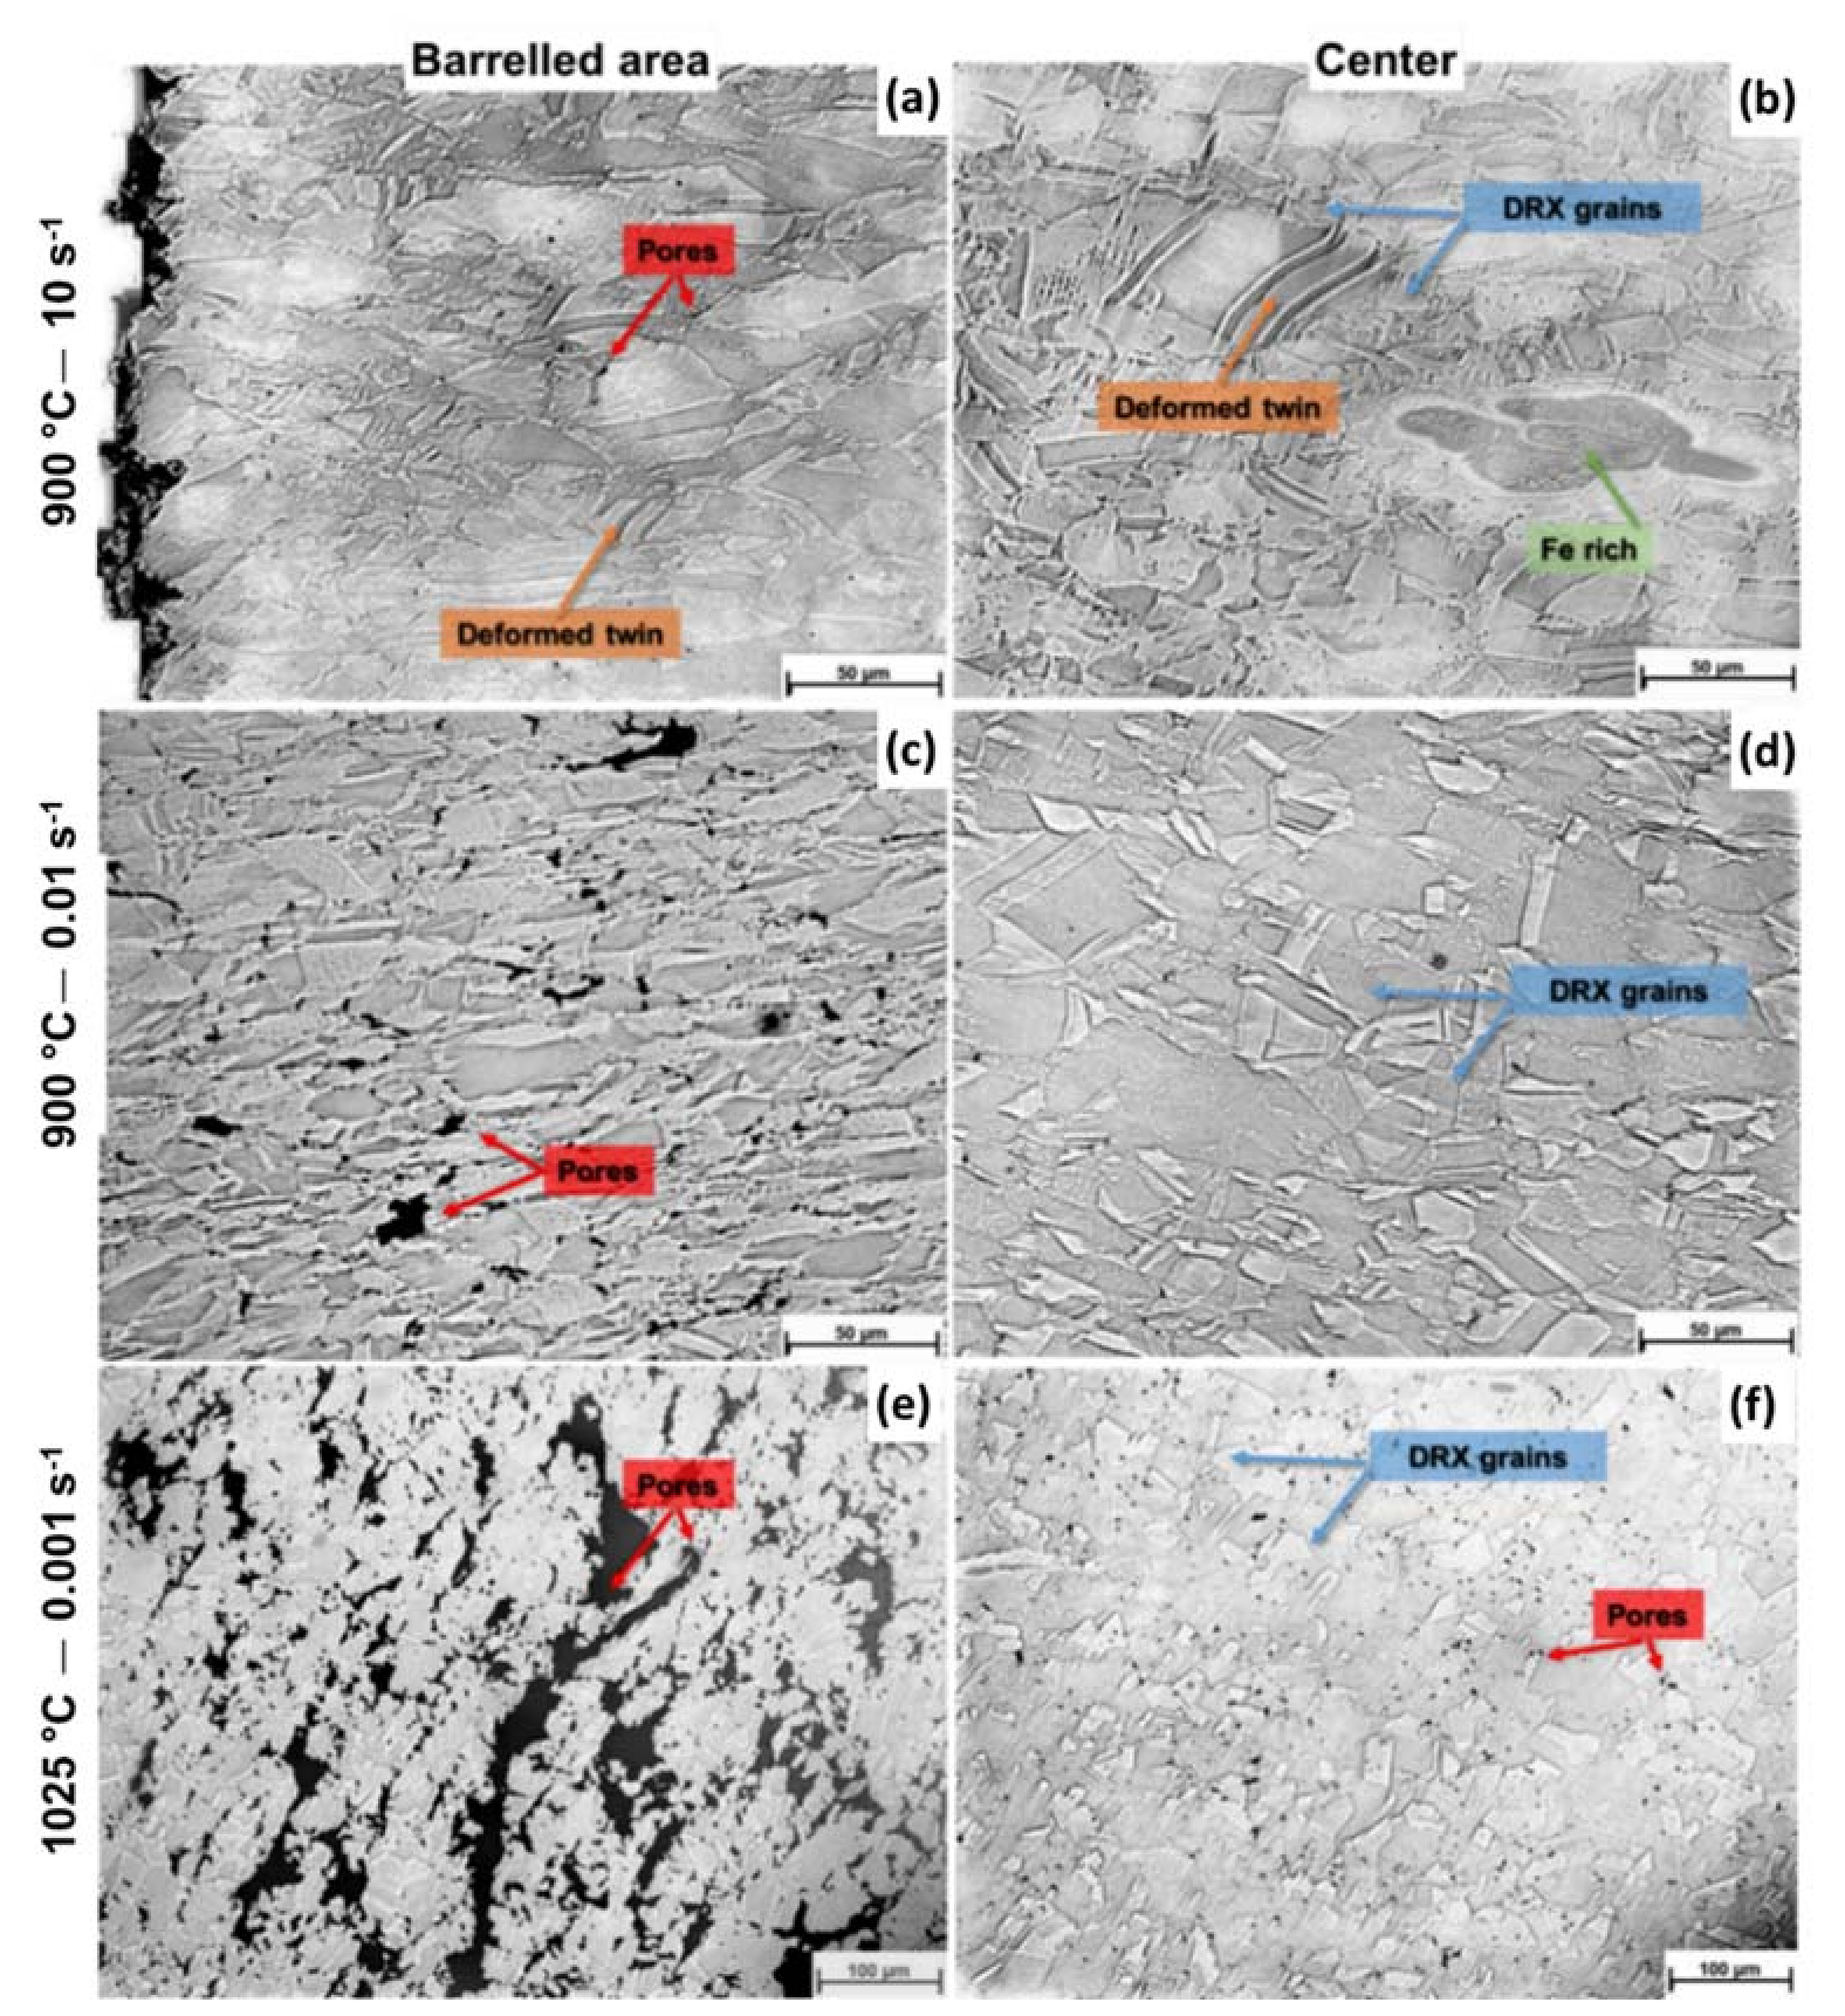
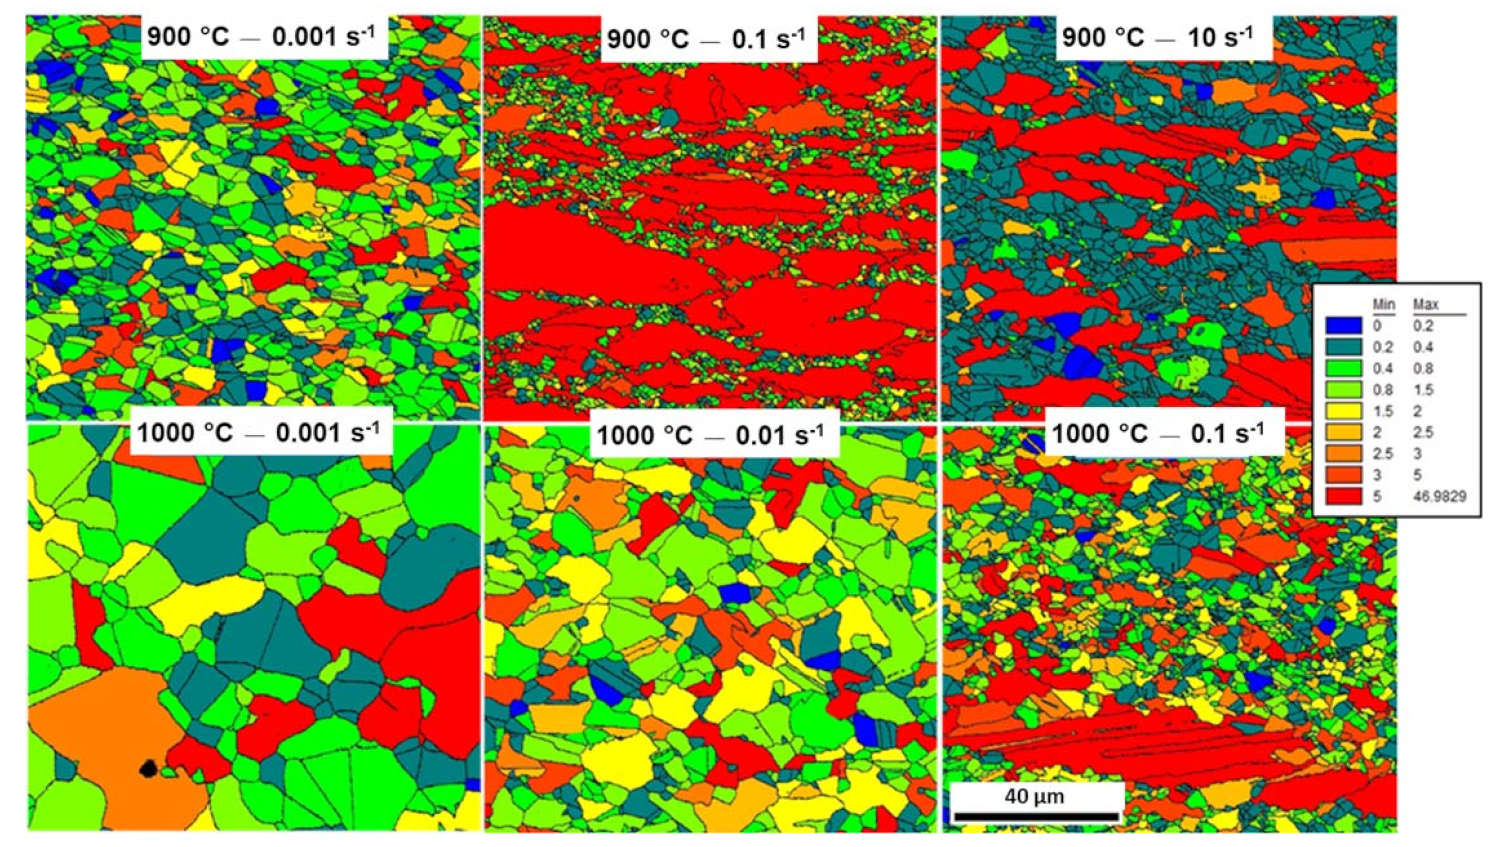
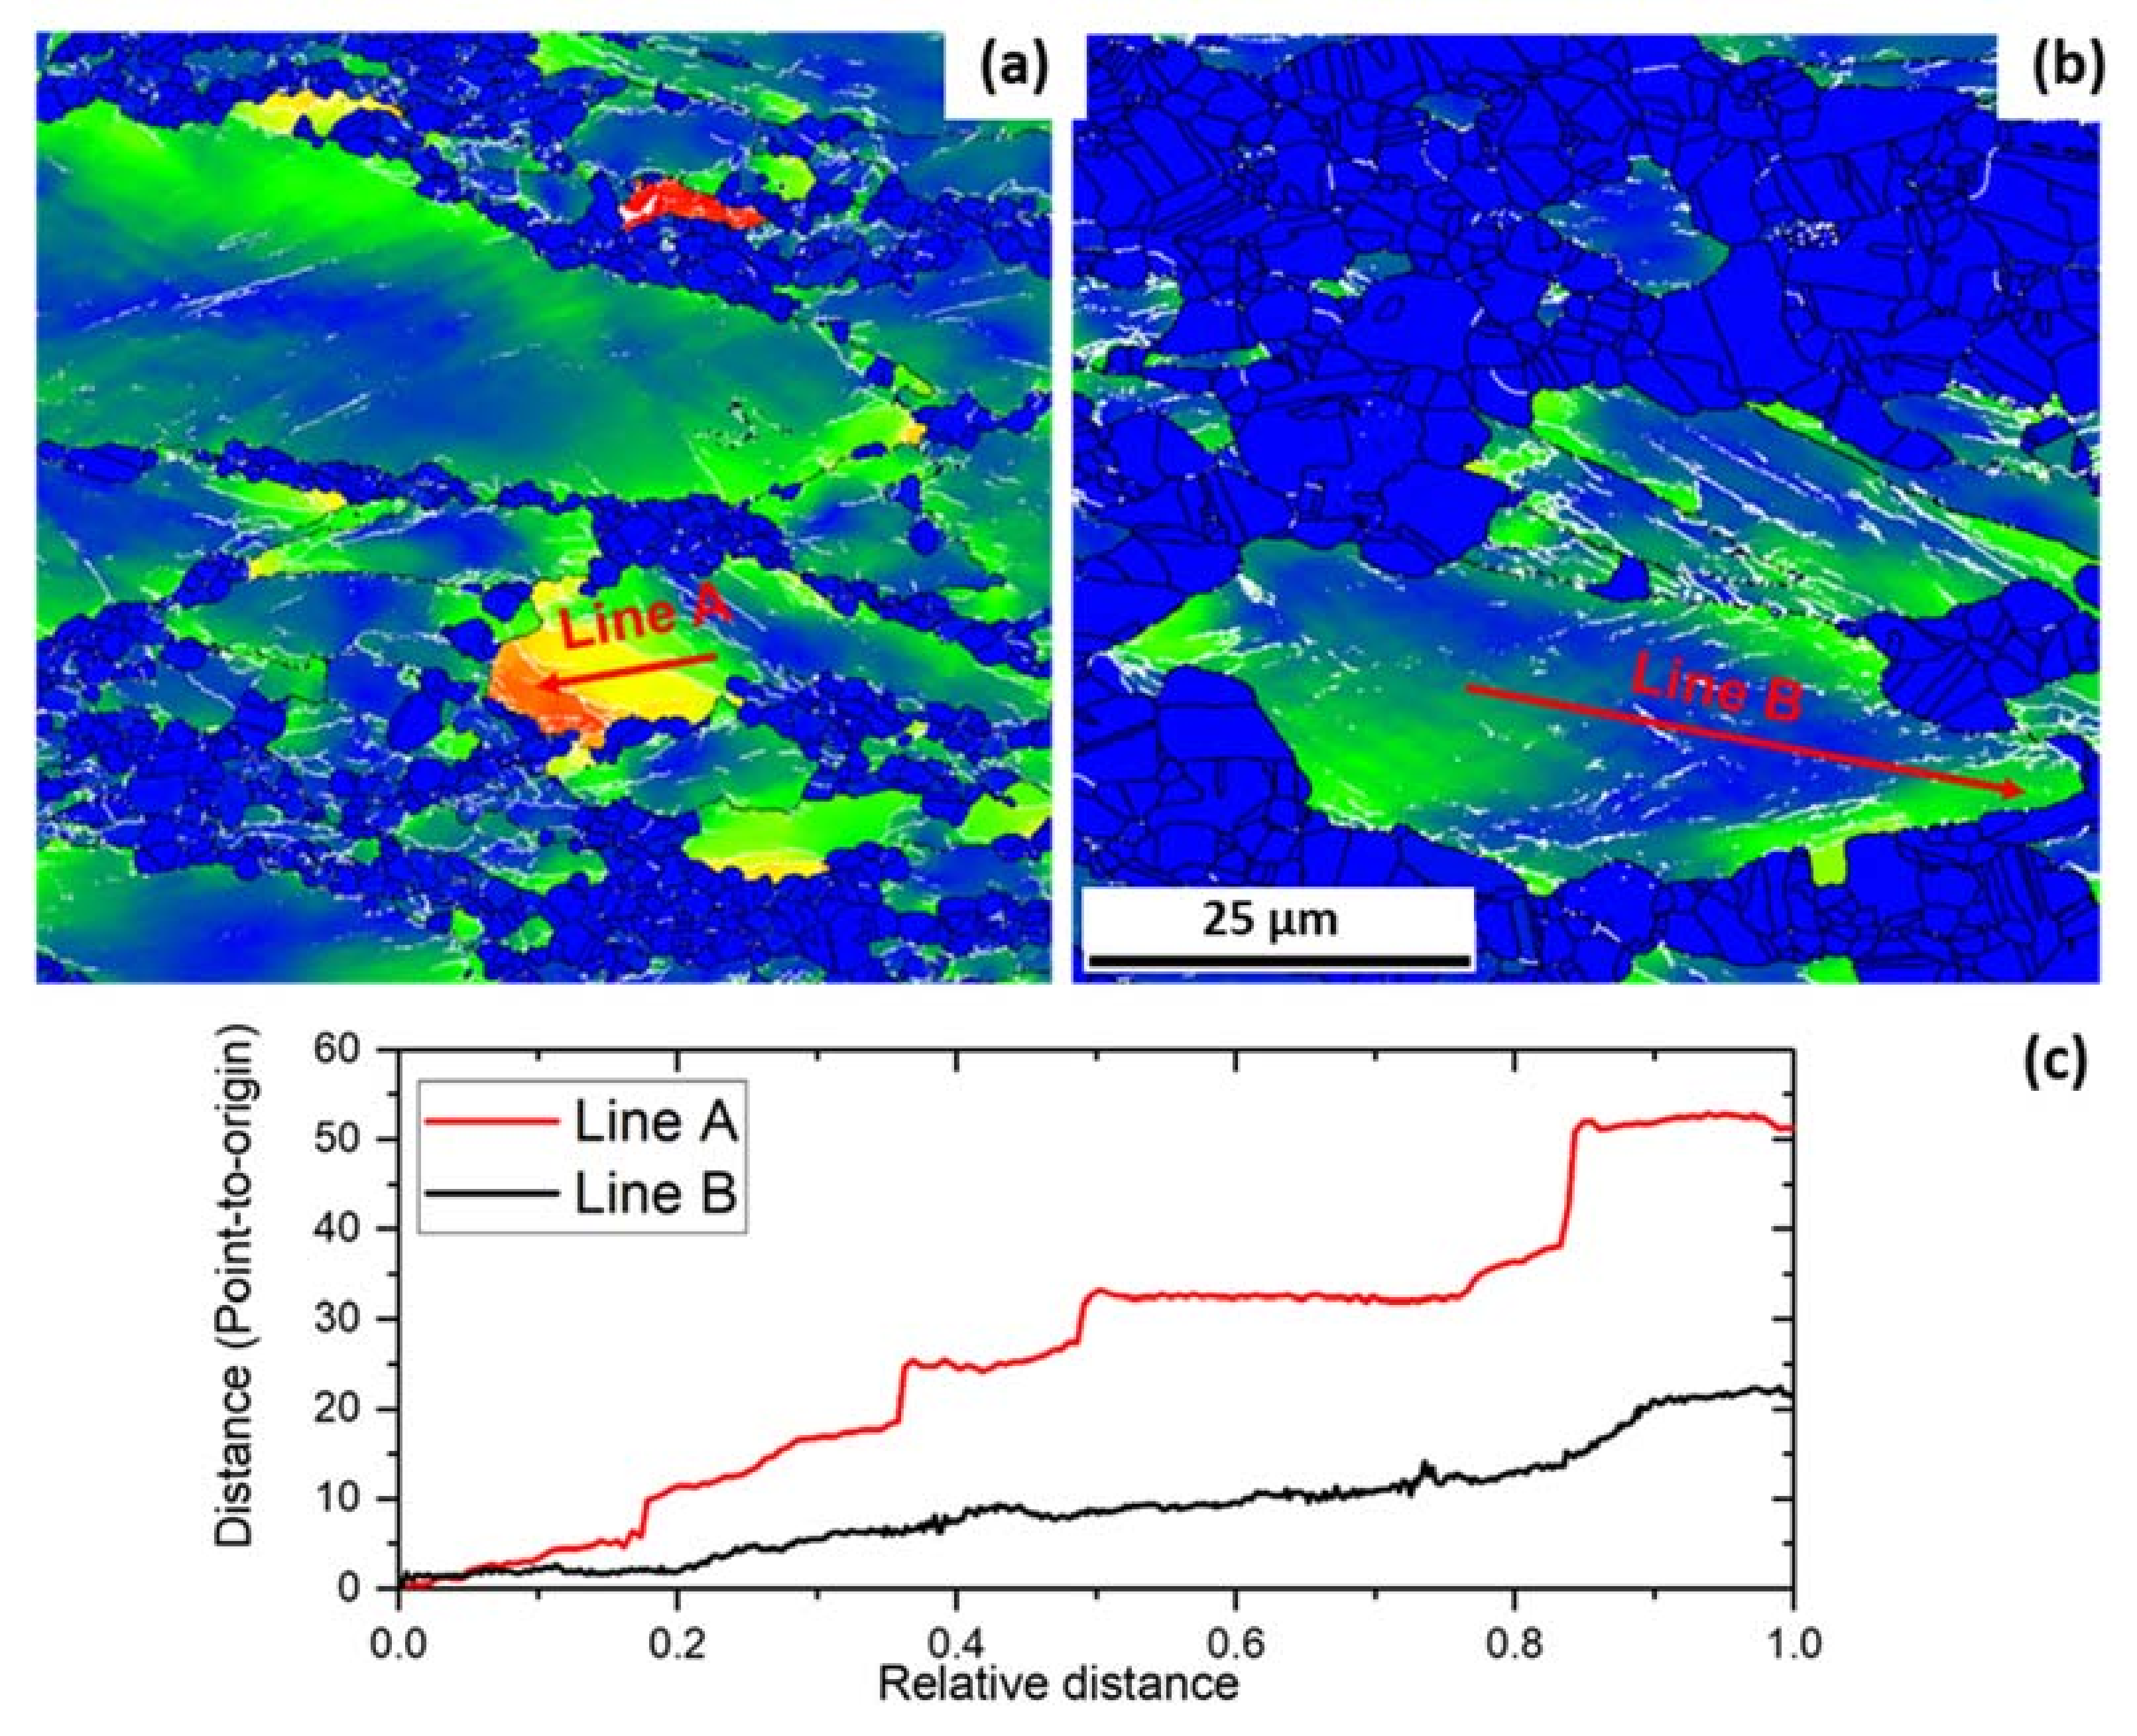
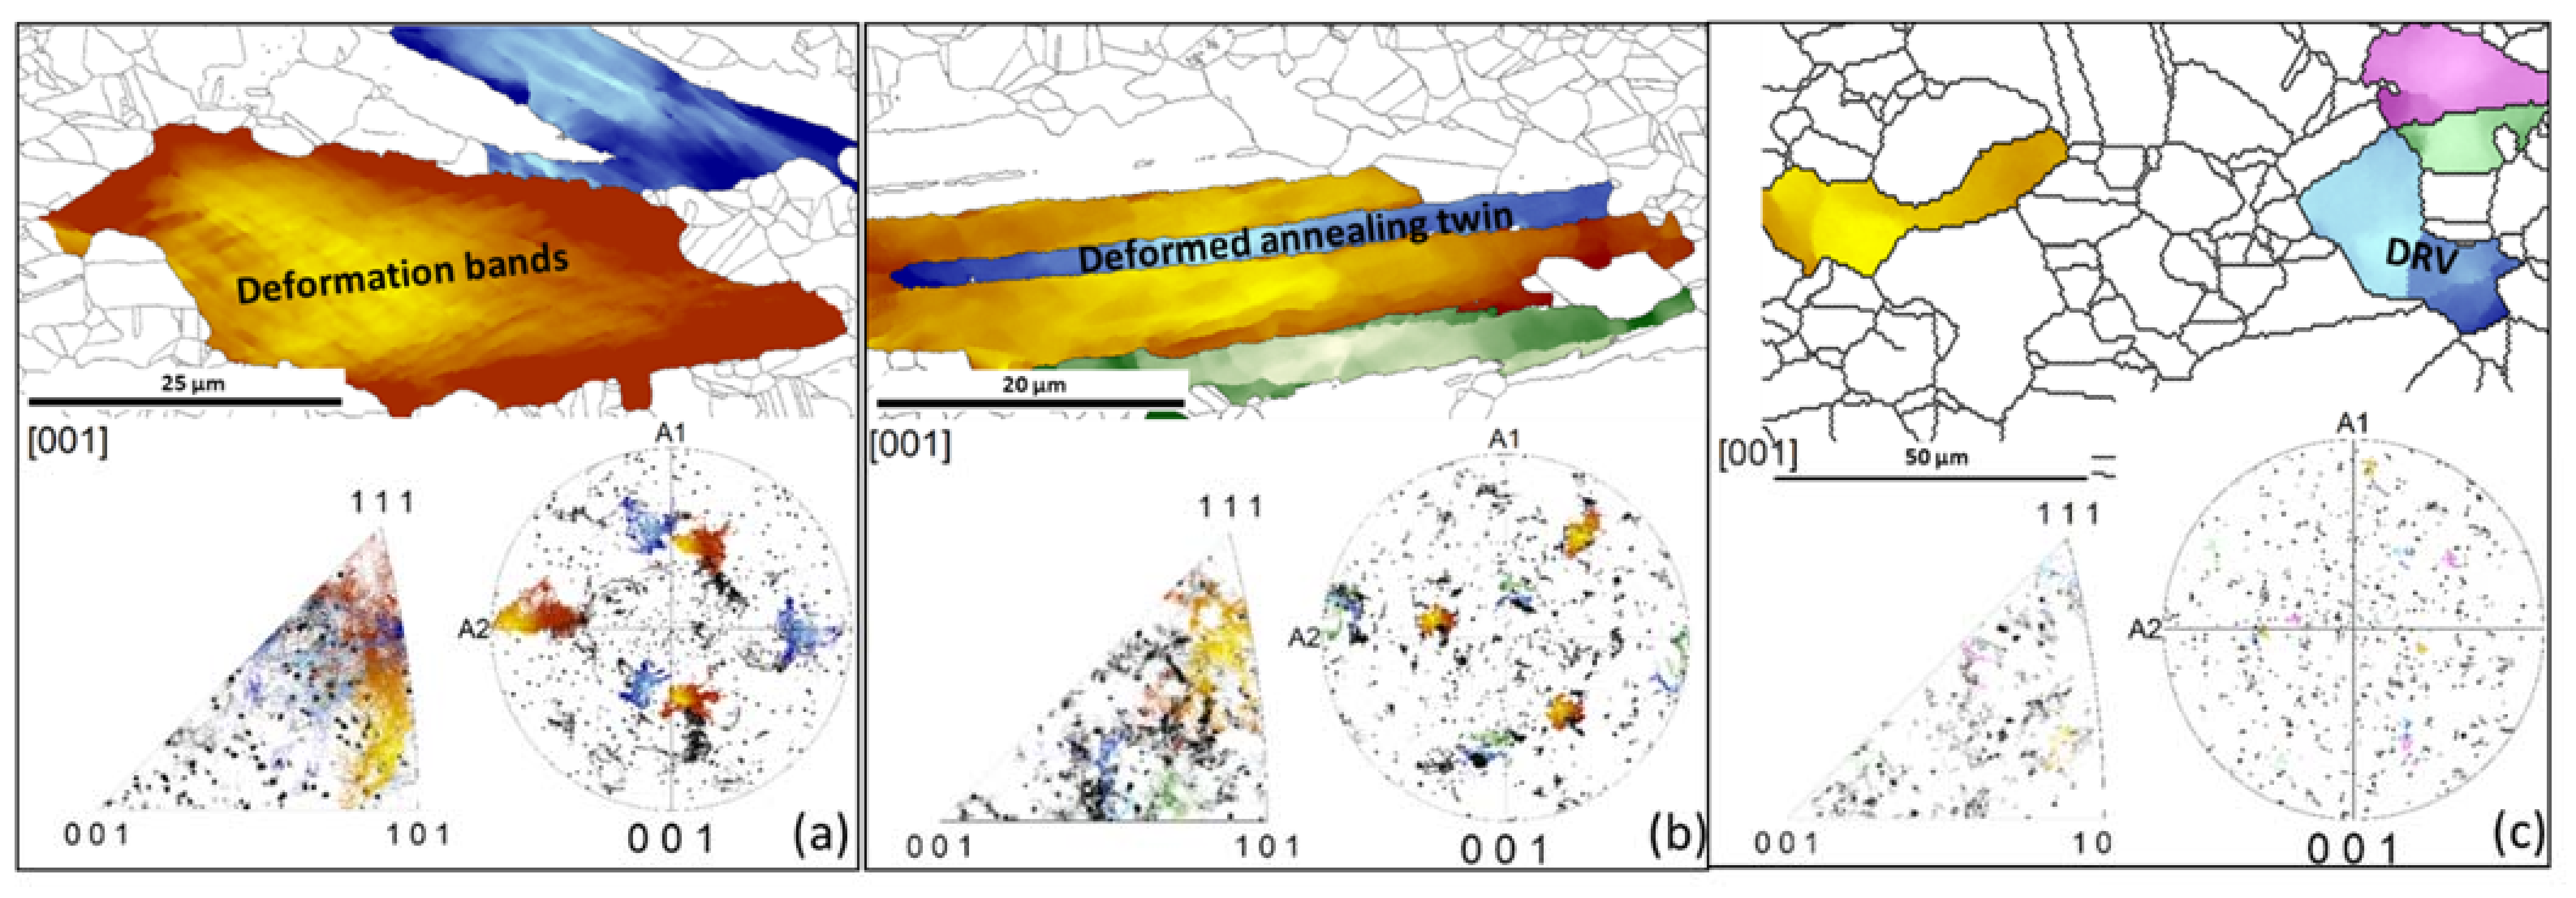
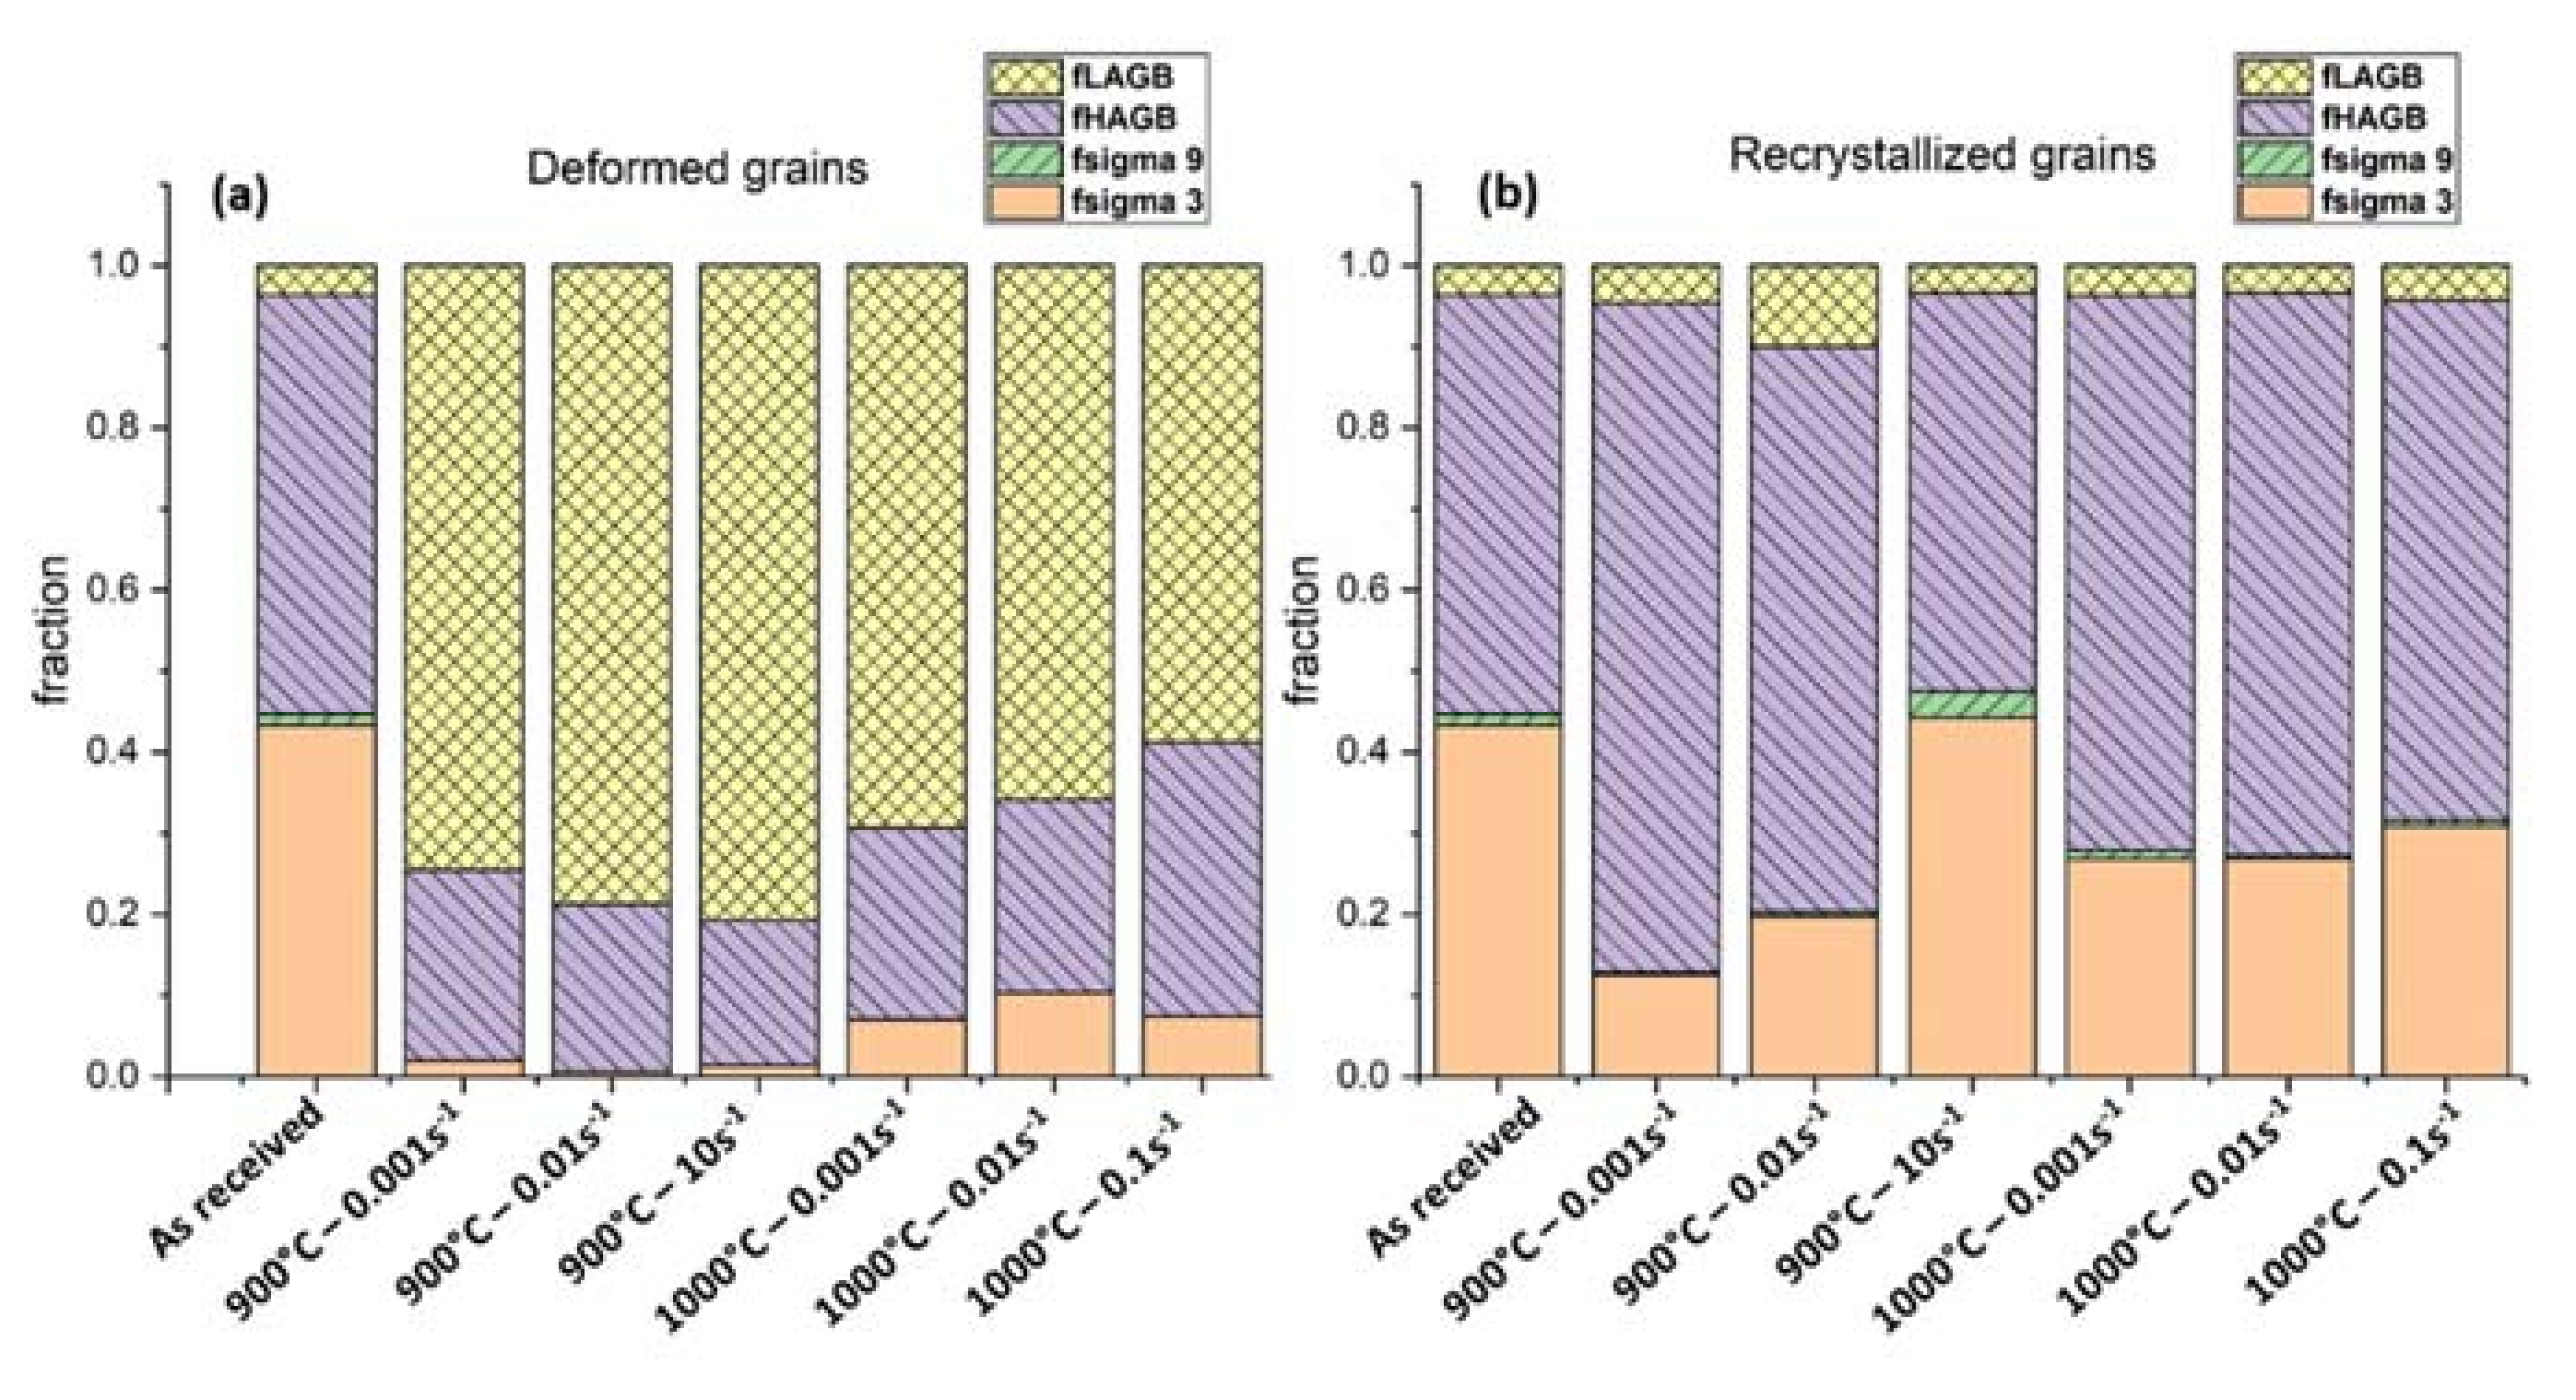
3.4. Microstructure after Deformation and Damage

The light optical micrographs shown in Figure 7 depict the microstructure after deformation. Two main features can be distinguished: the presence of DRX grains, and the presence of damage (pore coarsening). Recrystallization twins are present within new recrystallized grains, and deformed annealed twins are observed inside deformed grains. As the strain rate increases and the deformation temperature decreases, the recrystallization grade is generally lower.
The evolution of the porosity was also studied. Figure 7 shows a larger number of pores for the lower strain rates. Coalescence and growth of micropores resulting in wedge cracking were produced favorably at high temperatures and long times of deformation [46]. This effect was also observed in other powder metallurgy-produced nickel-based alloys deformed at low strain rates [47]. In Figure 7, it can be seen that the damage is particularly large in the barrelled region due to multiaxial stress condition. On the other hand, the center of the sample shows much less porosity.
Figure 8 shows the grain orientation spread (GOS) maps of microstructures after deformation at different conditions of strain rate and temperature. Recrystallized grains were distinguished from the deformed ones by their level of internal misorientation, expressed in this case by the level of the GOS value. In general, the higher the strain rate and lower the temperature, the finer the recrystallized grains, in agreement with the literature for Inconel®718 [15]. Annealing twins were observed in all the recrystallized grains, as reported for Inconel®718 [48].
The results of the recrystallized grain sizes are shown in Figure 9. The tendency shows that the larger the strain rate and the lower the temperature, the smaller the recrystallized grain [17]. The exceptions at high strain rates and low temperatures may be due to mDRX effects. An overestimation of the size occurs when using image analysis of light optical microscopy samples. Further analysis showed that measured recrystallized grain size at the lowest strain rates had a large standard deviation, meaning that there were multiple stages of the recrystallization happening simultaneously.

4. Discussion on the Deformation Mechanisms

This section discusses the evolution of the microstructure and the correlation with the flow curves for the IN718WP. Furthermore, a comparison with Inconel®718 is conducted, where the deformation of the matrix takes place without interacting with precipitates.
The details of the microstructures of two samples partially recrystallized are shown in Figure 10. The grain reference orientation deviation (GROD) maps show the rotation of the grains, especially markedly close to the grain boundaries, and the formation of bands. The highly misoriented regions result in a fragmentation of the grains, especially at high strain rates and low temperatures. This effect corroborates the measurement of the misorientation cumulating along the deformed grain (see Figure 10c).
The intense crystal rotation shown in the deformed grains for strain rates higher than 0.1 s−1 is further illustrated in Figure 11a,b. The rotation of the grain and the change in the crystal orientation can be observed in the pole figure (PF) and the inverse pole figure (IPF). This microstructural aspect is related to the change in the slope during strain hardening shown in the flow curves Figure 2. The formations of bands at grains and existing annealing twins have the same amplitude as the serrations formed at all high-angle grain boundaries. This intense rotation and fragmentation of grains is responsible for the change in the hardening rate, as observed from the change in the slope of the softening curves up to the minimum value (Figure 3). A comparison of the microstructure can be observed when deformation occurs at low strain rate (Figure 11c). In this example, the non-recrystallized grains undergo dynamic recovery before recrystallization, thus reducing the stored energy.
The strain at the peak stress was plotted in Figure 12a. In general, the higher the strain rate, the larger the strain at the peak stress. The recrystallization percentage shows the opposite dependency on the strain rate than the strain at peak stress. The temperature has a negligible effect on the strain at the peak stress at the investigated conditions. Results in Figure 12 show that the percentage of recrystallization increases as the strain rate decreases in the 900–1000 °C range. Both diagrams have the same outcome: longer tests (slower strain rate) promote the formation of new grains, because the process is diffusion-controlled. Regardless of the deformation conditions, a minimum of 50% of recrystallization is always reached. It was shown that post-dynamic recrystallization pDRX can occur isothermally within some seconds [49]. Quenching seems to be fast enough to avoid post-dynamic recrystallization at high strain rates. The delay of 2–3 s as reported by A. Nicolaÿ et al. [50] was drastically reduced to 0.5 s in this work due to the in-situ water jet system. Therefore, the higher the strain rate, the lower the recrystallization grade. Concerning the temperature, lower recrystallization grades were observed at the middle-temperature range. This must be related with the competition of dynamic recovery and dynamic recrystallization: higher stored energy is achieved at lower temperatures, competing with the increment of the mobility of high-angle grain boundaries at high temperatures.
The types of boundaries at deformed and recrystallized grains were analyzed from the EBSD measurements. The fractions (f) of these boundaries are plotted in Figure 13 and are compared with the results obtained from the material in the as-received conditions. The deformed grains present a large number of low-angle grain boundaries (LAGB) due to lattice rotation and formation of deformation bands at high strain rates, and due to the formation of subgrains at smaller strain rates. The sigma 3 boundaries are nonexistent in the deformed grains, due to the progressive transformation of these boundaries into mobile boundaries [4]. Recrystallized grains show a negligible fraction of LAGB (fLAGB), and the microstructure mainly consists of a large fraction of HAGB (fHAGB) and sigma 3 grain boundaries (fsigma3) Figure 13.
Finally, the softening rate, identified as the slope of the relative softening from the peak stress, is plotted in Figure 14. The softening rate is highly dependent on the strain rate, while a temperature tendency could not be identified. The high values of the softening rate at low strain rates are a result of the pores coarsening as well as the fast growth of recrystallized grains without the interaction with any precipitate.
The correlation of the recrystallized grain size with the Zener–Hollomon parameter was determined using both the sinh law (Equation (1)) and the power law (Equation (2)), by Equation (3). The measured grain sizes from EBSD data were analyzed using two approaches: the grain size as measured, and the grain size after extracting the twin boundaries. A linear correlation was obtained in a double logarithmic scale in all cases (Figure 15). When using the grain size, a slope of 3 was obtained using both approaches (Figure 15a), while a slope of 3.5 was obtained when extracting the twin boundaries from the grain size calculation (Figure 15b).

5. Summary and Conclusions

The material free of precipitates, IN718WP produced by powder metallurgy, was tested under hot compression to understand the deformation behavior of this nickel-based superalloy. The following can be concluded:
  • The material IN718WP deforms similarly to Inconel®718: after reaching peak stress, the stresses soften due to DRX;
  • Lower stress values and larger softening than Inconel®718 may be related to the lack of precipitates;
  • The relative stress softening is independent of the temperature, meaning that the growth is only dependent on the strain rate. The large stress softening at a low strain rate may be related to two phenomena: the fast recrystallization rate, and the coarsening of pores driven by diffusion;
  • The growth rate of recrystallization is only dependent on the strain rate at the deformed conditions. This results in larger amounts of Σ3 boundaries within recrystallized grains at high strain rate for a given strain;
  • The recrystallization grade %DRX increases from 45% at low strain rates up to 85% at the slowest deformation;
  • The recrystallization grade reaches a minimum of 70% at 950 °C due to the competition of dynamic recovery and dynamic recrystallization occurring at low strain rates;
  • Deformation takes place by first increasing the amount of low angle grain boundaries, while the Σ3 boundaries become mobile and their fraction decreases with deformation. Recrystallized grains have a large number of Σ3 boundaries, and their fraction increases with increasing strain rate and temperature;
  • The apparent activation energy of 450 kJ/mol found for IN718WP and the strain rate exponent (n = 4.76) value are in agreement with the values found for Inconel®718 when deforming above the solvus temperature, suggesting similar deformation mechanisms.

Author Contributions

Conceptualization, F.L., A.S. and M.C.P.; methodology, F.L., K.P. and M.C.P.; formal analysis, F.L., K.P., A.S., S.S. and M.C.P.; investigation, F.L., K.P. and M.C.P.; resources, A.S. and M.C.P.; data curation, F.L., K.P. and M.C.P.; writing—original draft preparation, F.L.; writing—review and editing, F.L., K.P., A.S., S.S. and M.C.P.; visualization, F.L. and M.C.P.; supervision, S.S. and M.C.P.; project administration, A.S. and M.C.P.; funding acquisition, M.C.P. All authors have read and agreed to the published version of the manuscript.

Funding

This research was funded by Christian Doppler Forschungsgesellschaft, in the framework of CD-Laboratory for Design of High-Performance Alloys by Thermomechanical Processing. The authors accept Open Access Funding by the Graz University of Technology.

Institutional Review Board Statement

Not applicable.

Informed Consent Statement

Not applicable.

Data Availability Statement

The raw/processed data that support the findings of this study are available from the corresponding author, M.C.P. upon request.

Conflicts of Interest

The authors declare no conflict of interest.

References

  1. Akca, E.; Gursel, A. A Review on Superalloys and IN718 Nickel-Based INCONEL Superalloy. Period. Eng. Nat. Sci. 2015, 1. [Google Scholar] [CrossRef]
  2. Mouritz, A.M. (Ed.) Superalloys for Gas Turbine Engines. In Introduction to Aerospace Materials; Woodhead Publishing: Cambridge, UK, 2012; Chapter 12; pp. 251–267. [Google Scholar]
  3. Reed, R.C. The Superalloys: Fundamentals and Applications; Cambridge University Press: Cambridge, UK, 2006. [Google Scholar]
  4. Schafrik, R.E.; Ward, D.D.; Groh, J.R. Application of Alloy 718 in GE Aircraft Engines: Past, Present and Next Five Years. In Superalloys 718, 625, 706 and Various Derivatives; TMS: Pittsburgh, PA, USA, 2001; pp. 1–11. [Google Scholar]
  5. Ahmadi, M.R.; Povoden-Karadeniz, E.; Whitmore, L.; Stockinger, M.; Falahati, A.; Kozeschnik, E. Yield strength prediction in Ni-base alloy 718Plus based on thermo-kinetic precipitation simulation. Mater. Sci. Eng. A 2014, 608, 114–122. [Google Scholar] [CrossRef]
  6. Cozar, R.; Pineau, A. Morphology of y’ and y” precipitates and thermal stability of inconel 718 type alloys. Metall. Trans. 1973, 4, 47–59. [Google Scholar] [CrossRef]
  7. Sundararaman, M.; Mukhopadhyay, P.; Banerjee, S. Some aspects of the precipitation of metastable intermetallic phases in INCONEL 718. Metall. Trans. A 1992, 23, 2015–2028. [Google Scholar] [CrossRef]
  8. Wang, Y.; Shao, W.Z.Z.; Zhen, L.; Zhang, B.Y.Y. Hot deformation behavior of delta-processed superalloy 718. Mater. Sci. Eng. A 2011, 528, 3218–3227. [Google Scholar] [CrossRef]
  9. Gasson, P.C. The Superalloys: Fundamentals and Applications. Aeronaut. J. 2008, 112, 291. [Google Scholar] [CrossRef]
  10. Zhou, L.; Baker, T. Effects of strain rate and temperature on deformation behaviour of IN 718 during high temperature deformation. Mater. Sci. Eng. A 1994, 177, 1–9. [Google Scholar] [CrossRef]
  11. Zhang, H.Y.; Zhang, S.H.; Li, Z.X.; Cheng, M. Hot die forging process optimization of superalloy IN718 turbine disc using processing map and finite element method. Proc. Inst. Mech. Eng. Part B J. Eng. Manuf. 2009, 224, 103–110. [Google Scholar] [CrossRef]
  12. Huang, K.; Logé, R.E. A review of dynamic recrystallization phenomena in metallic materials. Mater. Des. 2016, 111, 548–574. [Google Scholar] [CrossRef]
  13. Humphreys, F.J.; Hatherly, M. Recrystallization and Related Annealing Phenomena; Elsevier: Amsterdam, The Netherlands, 2004. [Google Scholar]
  14. Doherty, R.D.; Hughes, D.A.; Humphreys, F.J.; Jonas, J.J.; Jensen, D.J.; Kassner, M.E.; King, W.E.; McNelley, T.R.; McQueen, H.J.; Rollett, A.D. Current issues in recrystallization: A review. Mater. Sci. Eng. A 1997, 238, 219–274. [Google Scholar] [CrossRef] [Green Version]
  15. Azarbarmas, M.; Aghaie-Khafri, M.; Cabrera, J.M.M.; Calvo, J. Dynamic recrystallization mechanisms and twining evolution during hot deformation of Inconel 718. Mater. Sci. Eng. A 2016, 678, 137–152. [Google Scholar] [CrossRef] [Green Version]
  16. Madeleine Durand-Charre, The Microstructure of Superalloys; CRC Press: Boca Raton, FL, USA, 1998.
  17. Azarbarmas, M.; Aghaie-Khafri, M.; Cabrera, J.M.; Calvo, J. Microstructural evolution and constitutive equations of Inconel 718 alloy under quasi-static and quasi-dynamic conditions. Mater. Des. 2016, 94, 28–38. [Google Scholar] [CrossRef] [Green Version]
  18. Zhou, L.X.; Baker, T.N. Effects on dynamic and metadynamic recrystallization on microstructures of wrought IN-718 due to hot deformation. Mater. Sci. Eng. A 1995, 196, 89–95. [Google Scholar] [CrossRef]
  19. Oradei-Basile, A.; Radavich, J.F. A current T-T-T diagram for wrought alloy 718. In Superalloys 718, 625 and Various Derivates; Loria, E.A., Ed.; The Minerals, Metals & Materials Society: Pittsburgh, PA, USA, 1991; pp. 325–335. [Google Scholar]
  20. Renhof, L.; Krempaszky, C.; Werner, E.; Stockinger, M. Analysis of Microstructural Properties of IN 718 after High Speed Forging. Proc. Int. Symp. Superalloys Var. Deriv. 2005. [Google Scholar] [CrossRef]
  21. Cai, D.Y.; Zhang, W.H.; Nie, P.L.; Liu, W.C.; Yao, M. Dissolution kinetics and behavior of δ phase in Inconel 718. Trans. Nonferrous Met. Soc. China 2003, 13, 1338–1341. [Google Scholar]
  22. Lin, Y.C.; He, D.G.; Chen, M.S.; Chen, X.M.; Zhao, C.Y.; Ma, X.; Long, Z.L. EBSD analysis of evolution of dynamic recrystallization grains and δ phase in a nickel-based superalloy during hot compressive deformation. Mater. Des. 2016, 97, 13–24. [Google Scholar] [CrossRef]
  23. Páramo-Kañetas, P.; Özturk, U.; Calvo, J.; Cabrera, J.M.; Guerrero-Mata, M. High-temperature deformation of delta-processed Inconel 718. J. Mater. Process. Technol. 2018, 255, 204–211. [Google Scholar] [CrossRef]
  24. Song, K.; Aindow, M. Grain growth and particle pinning in a model Ni-based superalloy. Mater. Sci. Eng. A 2008, 479, 365–372. [Google Scholar] [CrossRef]
  25. John, S.R.; Tien, K. (Eds.) Refractory Alloying Elements in Superalloys; American Society for Metals and Associacao Brasileira de Metais: Araxá, Brazil, 1984. [Google Scholar]
  26. Charpagne, M.-A.; Billot, T.; Franchet, J.-M.; Bozzolo, N. Heteroepitaxial recrystallization: A new mechanism discovered in a polycrystalline γ-γ’ nickel based superalloy. J. Alloy. Compd. 2016, 688, 685–694. [Google Scholar] [CrossRef] [Green Version]
  27. Drexler, A.; Oberwinkler, B.; Primig, S.; Turk, C.; Povoden-Karadeniz, E.; Heinemann, A.; Ecker, W.; Stockinger, M. Experimental and numerical investigations of the γ” and γ’ precipitation kinetics in Alloy 718. Mater. Sci. Eng. A 2018, 723, 314–323. [Google Scholar] [CrossRef]
  28. Special Metals INCONEL® Alloy 718. 2007. Available online: https://www.specialmetals.com/ (accessed on 18 March 2021).
  29. Goetz, R.L.; Semiatin, S.L. The adiabatic correction factor for deformation heating during the uniaxial compression test. J. Mater. Eng. Perform. 2001, 10, 710–717. [Google Scholar] [CrossRef]
  30. Yan, L.; Shen, J.; Li, Z.; Li, J.; Yan, X. Microstructure evolution of Al-Zn-Mg-Cu-Zr alloy during hot deformation. Rare Met. 2010, 29, 426–432. [Google Scholar] [CrossRef]
  31. Wang, P.; Hogrefe, K.; Piot, D.; Montheillet, F.; Poletti, M.C. A flow instability criterion for alloys during hot deformation. Proced. Manuf. 2019, 37, 319–326. [Google Scholar] [CrossRef]
  32. Tan, G.; Li, H.Z.; Wang, Y.; Yang, L.; Huang, Z.Q.; Qiao, S.C.; Liu, M.X. Physical-Based Constitutive Modeling of Hot Deformation in a Hot-Extruded Powder Metallurgy Nickel-Based Superalloy. J. Mater. Eng. Perform. 2021, 30, 794–804. [Google Scholar] [CrossRef]
  33. Medeiros, S.C.; Frazier, W.G.; Prasad, Y.V.R.K. Hot deformation mechanisms in a powder metallurgy nickel-base superalloy IN 625. Metall. Mater. Trans. A 2000, 31, 2317–2325. [Google Scholar] [CrossRef]
  34. Poletti, C.; Dieringa, H.; Warchomicka, F. Local deformation and processing maps of as-cast AZ31 alloy. Mater. Sci. Eng. A 2009, 516. [Google Scholar] [CrossRef]
  35. El Mehtedi, M.; Gabrielli, F.; Spigarelli, S. Hot workability in process modeling of a bearing steel by using combined constitutive equations and dynamic material model. Mater. Des. 2014, 53, 398–404. [Google Scholar] [CrossRef]
  36. Sellars, C.M.; McTegart, W.J. On the mechanism of hot deformation. Acta Metall. 1966, 14, 1136–1138. [Google Scholar] [CrossRef]
  37. ASTM E112-12 Standard Test Methods for Determining Average Grain Size; ASTM International: Conshohocken, PA, USA, 2012.
  38. Mitsche, S.; Poelt, P.; Sommitsch, C. Recrystallization behaviour of the nickel-based alloy 80 a during hot forming. J. Microsc. 2007, 227, 267–274. [Google Scholar] [CrossRef]
  39. Shen, G.; Semiatin, S.L.; Shivpuri, R. Modeling microstructural development during the forging of Waspaloy. Metall. Mater. Trans. A 1995, 26, 1795–1803. [Google Scholar] [CrossRef]
  40. Dobrzanski, L.A. (Ed.) Powder Metallurgy—Fundamentals and Case Studies; InTech Open: London, UK, 2017. [Google Scholar]
  41. Slama, C.; Servant, C.; Cizeron, G. Aging of the Inconel 718 alloy between 500 and 750 °C. J. Mater. Res. 1997, 12, 2298–2316. [Google Scholar] [CrossRef]
  42. Chen, F.H.; Liu, J.; Ou, H.; Lu, B.; Cui, Z. Long Flow Characteristics and Intrinsic Workability of IN718 Superalloy; Elsevier BV: Amsterdam, The Netherlands, 2015; Volume 642, pp. 279–287. [Google Scholar]
  43. Gujrati, R.; Gupta, C.; Jha, J.S.; Mishra, S.; Alankar, A. Understanding activation energy of dynamic recrystallization in Inconel 718. Mater. Sci. Eng. A 2019, 744, 638–651. [Google Scholar] [CrossRef]
  44. Si, J.; Liao, X.; Xie, L.; Lin, K. Flow Behavior and Constitutive Modeling of Delta-Processed Inconel 718 Alloy. J. Iron Steel Res. Int. 2015, 22, 837–845. [Google Scholar] [CrossRef]
  45. Zhang, H.; Zhang, K.; Lu, Z.; Zhao, C.; Yang, X. Hot deformation behavior and processing map of a γ’-hardened nickel-based superalloy. Mater. Sci. Eng. A 2014, 604, 1–8. [Google Scholar] [CrossRef]
  46. Ahmadi, M.R.R.; Sonderegger, B.; Yadav, S.D.D.; Poletti, M.C.C. Modelling and Simulation of Diffusion Driven Pore Formation in Martensitic Steels during Creep. Mater. Sci. Eng. A 2018, 712, 466–477. [Google Scholar] [CrossRef]
  47. Higashi, M.; Kanno, N. Effect of initial powder particle size on the hot workability of powder metallurgy Ni-based superalloys. Mater. Des. 2020, 108926. [Google Scholar] [CrossRef]
  48. Wang, Y.; Shao, W.Z.; Zhen, L.; Lin, L.; Cui, Y.X. Investigation on Dynamic Recrystallization Behavior in Hot Deformed Superalloy Inconel 718. Mater. Sci. Forum 2007, 546–549, 1297–1300. [Google Scholar] [CrossRef]
  49. Zouari, M.; Logé, R.; Bozzolo, N. In Situ Characterization of Inconel 718 Post-Dynamic Recrystallization within a Scanning Electron Microscope. Metals 2017, 7, 476. [Google Scholar] [CrossRef] [Green Version]
  50. Nicolaÿ, A.; Fiorucci, G.; Franchet, J.M.; Cormier, J.; Bozzolo, N. Influence of strain rate on subsolvus dynamic and post-dynamic recrystallization kinetics of Inconel 718. Acta Mater. 2019, 174, 406–417. [Google Scholar] [CrossRef]
Figure 1. Microstructure of the as-received material: (a) light optical micrographs showing grains with annealing twins, carbides decorating some boundaries (light) and pores (black); (b) SEM picture in backscattered electron (BSE) mode showing a pore and no precipitate within the matrix; (c) SEM picture in BSE mode showing annealing twin carbides and pores (in black); (d) SEM micrographs in BSE mode; and (e) the corresponding EDS map, showing the grains of based material and the Fe-rich regions, respectively. The percentages are shown in (f).
Metals 11 00605 g001
Figure 2. Flow curves of the IN718WP alloy for all strain rates (0.1–10 s−1) at (a) 900 °C, (b) 925 °C, (c) 950 °C, (d) 1000 °C, (e) 1025 °C, and (f) 1050 °C.
Metals 11 00605 g002
Figure 3. Relative softening as a function of the strain during deformation at (a) 900 °C, (b) 925 °C, (c) 950 °C, (d) 975 °C, (e) 1000 °C and (f) 1025 °C at different strain rates from 0.001 to 10 s−1.
Metals 11 00605 g003
Figure 4. Relative softening showing the influence of the temperature at two different strain rates, at (a) 0.001 s−1 and (b) 0.1 s−1.
Metals 11 00605 g004
Figure 5. Comparison of softening at 0.6 of strain for different deformation conditions compared with standard Inconel® 718 obtained from the literature (A = [17] red, B = [42] blue, C = [43] green). The softening values are grouped in regions: grey, the values of the present work for IN718, and red the values of the literature for Inconel® 718.
Metals 11 00605 g005
Figure 6. Correlation of the peak stress values with the Zener–Hollomon parameter using (a) Equation (1) and (b) Equation (4).
Metals 11 00605 g006
Figure 7. Light optical micrographs of IN718WP deformed after several conditions: (a,b) 900 °C and 10 s−1, (c,d) 900 °C and 0.01 s−1 and (e,f) 1025 °C and 0.001 s−1. The pictures correspond to the center of the sample (b,d,f) and the barrelled area (a,c,e). The micrographs show recrystallized and deformed grains, as well as pores at the center and wedge cracking at the barreled region.
Metals 11 00605 g007
Figure 8. Grain orientation spread (GOS) obtained from SEM-EBDS measurements of samples deformed at several conditions. Grains can be considered as deformed (red and orange) and recrystallized (green, blue, and yellow).
Metals 11 00605 g008
Figure 9. Grain size estimated using different methods: light optical microscopy (LOM), and scanning electron microscopy–electron backscattered diffraction (SEM-EBSD) without extracting the twin boundaries (w/twins) and extracting the twins (w/o twins) from the high-angle grain boundaries (HAGB).
Metals 11 00605 g009
Figure 10. Detail of the microstructure of two samples after hot deformation at (a) 900 °C and 0.1 s−1 and (b) 900 °C and 10 s−1 showing partial recrystallization. Grain reference orientation deviation (min = 0° blue; max = 60° red). Black lines represent high-angle grain boundaries (above 15°), and white lines the low angle grain boundaries. (between 2° and 15°). The results of the misorientation scan through Line A and Line B can be seen in (c).
Metals 11 00605 g010
Figure 11. High-angle grain boundary maps (black lines) of samples after deformation at (a) 900 °C and 10 s−1, (b) 1000 °C and 0.1 s−1 (c) 1000 °C and 0.001 s−1 (dynamic recovered grains—DRV are observed). Rotation of the grains can be observed in the inverse pole figures and pole figures. A1 and A2 refer to the reference axis.
Metals 11 00605 g011
Figure 12. (a) Strain at the peak stress as a function of the temperature and the strain rate, and (b) recrystallization percentages of the IN718WP alloy for temperatures (900–1000 °C) and strain rates (0.1–10 s−1) based on LOM and SEM analysis average values.
Metals 11 00605 g012
Figure 13. Fractions of the different type of boundaries: high-angle grain boundary (fHAGB), low-angle grain boundary (fLAGB); Σ3 (fsigma3) and Σ9 (fsigma9) measured at (a) deformed grains (b) recrystallized grains after different deformation conditions.
Metals 11 00605 g013
Figure 14. Slope of the softening region calculated from the softening curves shown in Figure 4.
Metals 11 00605 g014
Figure 15. Correlation of the Zener–Hollomon parameter with the recrystallized grain size obtained by EBSD measurements (a) without taking into account the twins (b) extracting the twin boundaries.
Metals 11 00605 g015
Table 1. Chemical composition of both standard Inconel®718 and without precipitates IN718WP alloys.
MaterialElemental Composition (wt.%)
NiCrFeMoAlCoSiNbCMnTi
IN718WP50.182322.073.71max 0.280.220.1max 0.28max 0.030.1max 0.03
Inconel®71850–5517–21bal.2.8–3.30.2–0.810.354.75–5.50.080.350.7–1.3
Table 2. Material constant values calculated from Equations (1) and (4) for IN718WP compared the literature for Inconel®718.
Alloyα [MPa−1]Q [kJ/mol]nSource
IN718WP0.00464504.76Equation (1)
-4006Equation (2)
Inconel®7180.00423644.57[43]
0.0061044613.52 (960 °C)
4.23 (1020 °C)
[23]
NA4677.3, 6.3, 5.4 and 5.2[8] (n varies with temperature)
0.00544685.2 [44] (at the peak)
0.0054 427.64.12[45] (above solvus)
Publisher’s Note: MDPI stays neutral with regard to jurisdictional claims in published maps and institutional affiliations.

