Article

Arc Plasma Flow Variation by Obstruction Structures between Anode and Cathode

1
Department of Mechanical Engineering, Changwon National University, Changwon-si 51140, Korea
2
Smart Manufacturing Engineering, Changwon National University, Changwon-si 51140, Korea
3
Korea Textile Machinery Convergence Research Institute, Gyeongsan-si 38542, Korea
*
Author to whom correspondence should be addressed.
Metals 2021, 11(9), 1416; https://doi.org/10.3390/met11091416
Submission received: 29 July 2021 / Revised: 22 August 2021 / Accepted: 3 September 2021 / Published: 7 September 2021

Abstract

:
Arc plasma flow between electrodes has been investigated in several studies. However, in the industrial field, arc plasma flow between electrodes is hindered by interfering materials such as filler metal in arc welding, substrates in chemical vapor deposition, and powders in sintering. Therefore, in this study, high temperature arc plasma flow analysis via three obstruction structure shapes was performed to understand the inter-electrode interference phenomena. COMSOL Multiphysics was used for the analysis; COMSOL interface such as electric field, magnetic field, heat transfer, and fluid flow (laminar flow) was applied and Multiphysics such as plasma heat source and temperature coupling were considered. The temperature and velocity of the arc plasma were determined and the energy transfer between the electrodes was analyzed. We confirmed that the concave shape has a lower average heat flux than the other shapes, with the arc pressure evenly distributed in the anode. It is concluded that the concave shape can reduce the flow of the plasma from the anode and obtain even distribution of the arc plasma in the radial direction.

1. Introduction

Plasma is a gas separated into ions and electrons by the application of heat or strong electromagnetic fields and is often referred to as the fourth state of matter. Arc plasma is generated from two electrodes that are cathode and anode. Seed plasma is generated with initiation of corona discharge in conditions applied to a high voltage between cathode and anode. After that, discharge current increases from glow discharge, which activates discharge and increases density of the plasma. There exist not only charged particles that are electron and ion, but also various neutral species from gas and air in plasmas. Those are called arc plasma or thermal plasma. High temperature arc plasma has recently been applied to many industries such as welding, cutting, spraying, chemical vapor deposition, and sintering [1]. In order to use high temperature arc plasma in various industries, it is necessary to understand its physical mechanism and to develop technologies such as plasma modeling analysis [2]. However, analysis of plasma behavior is very complicated and difficult because it involves many physical aspects such as heat, fluid, and electromagnetism. Therefore, it is important to accurately model the arc plasma numerically. In general, the main purpose of arc plasma analysis is to determine the behavior of arc plasma, and for this, numerical methods mainly using computational fluid dynamics are applied [3].
Assumption is necessary for simulating thermal plasma such as arc plasma. Key assumption considering inside of arc column is collisions between particles that dominate over other physical processes such as applied forces, diffusion or radiation, not chemical reaction, and radiation [4]. This leads to equidistribution of kinetic energy inside the arc column and results in what is commonly called the ‘Local Thermodynamic Equilibrium’ or ‘LTE’. One of the main consequences of the ‘LTE’ assumption is that the average temperatures of each species of particles inside the arc plasma are equal. This assumption of the arc plasma being in ‘LTE’ is commonly considered, it avoids the development of a twin temperature model (separate ions and electron temperatures) for the modeling of the arc plasma area. Basically, many studies have proposed a two-dimensional numerical model assuming a local thermodynamic equilibrium (LTE) for analyzing the interaction between arc plasma and electrodes. Various commercial Computational Fluid Dynamics (CFD) packages such as FLUENT and COMSOL were used to model the plasma flow and the electrodes domain. In addition, the models presented in each study demonstrate a reasonable agreement with the experimental and analytical data provided in the preceding literature. In those studies, the characteristics of thermal plasma such as arc temperature, velocity, and current density distribution are presented and the behavior of arc plasma is systematically analyzed. In addition, the validated model can be applied to different theoretical and experimental configurations to study various parameters for arc behavior [4,5,6,7,8,9,10,11,12,13,14]. For instance, Oleg et al. developed a model assumed by LTE for cathodic heating and cathode arc attachment to achieve reasonable results of heat and current for the conditions present in Gas Metal Arc (GMA) welding [15]. Bolun et al. established an arc plasma simulation model for the application of narrow gap GTA welding and an arc column was assumed in LTE [16]. Junting et al. suggested an arc plasma model considering metal vapor which affected the welding process. A LTE-diffusion method to near arc plasma was applied to predict characteristics of metal vapor flow [17]. Juan Pablo compared the kinetic nonequilibrium and dissipative nonequilibrium model for thermal plasma analysis in LTE [18]. In this study, LTE was assumed and an analysis was performed for ease of analysis.
Xu et al. [19] developed a 3D model for studying transport phenomena in gas metal arc welding and studied the relationship between droplet and plasma using arc plasma, droplet generation, and transport mechanics. Droplets generated in the global mode could interrupt the flow of arc plasma. Degree of influence on plasma flow is changed depending on the shape and size of the droplet, and if the droplet is viewed as an obstruction structure, this structure can be modeled in the simulation.
When arc welding is applied in an industrial field, there are interfering materials that cause arc plasma flow interference between the electrodes, such as filler metals in arc welding, substrates in chemical vapor deposition, and powders in sintering.
Therefore, in this study, high temperature arc plasma flow analysis with three obstruction structure shapes was performed to understand inter-electrode interference phenomena. The shapes considered as the obstruction structure are sphere type, cylinder type, and concave type. These shapes assume the cross-sectional shape of the filler wire supplied by Gas Tungsten Arc Welding (GTAW). If C-type filler wire mainly used in Super Tungsten Inert Gas (TIG) welding is present between arc plasmas and base material, this shape can be assumed to be a concave intermediate structure. A study comparing the flow, temperature distribution, and current distribution of the affected arc plasma was performed. In order to figure out the trend of results, the obstruction structure is assumed to be an insulator, and the heat transfer to the inside of the insulator is not considered for ease of analysis. Since the analysis was performed about the two-dimensional cylindrically symmetry form, it was assumed that the obstruction structure existed with a symmetrical shape between the arc plasma spaces [20]. The purpose of this study is to analyze the tendency for the change of high temperature plasma flow when a structure that does not act as an electrode exists between electrodes to base material. Therefore, Simulation was carried out based on assumptions including a physical basis.

2. Arc Plasma Model

2.1. Assumptions

COMSOL Multiphysics (ALTSOFT, Seoul, Korea) 5.4 versions with AC/DC, fluid flow, heat transfer, and plasma modules were used for the simulation and the analytical model is based on the following assumptions:
(1)
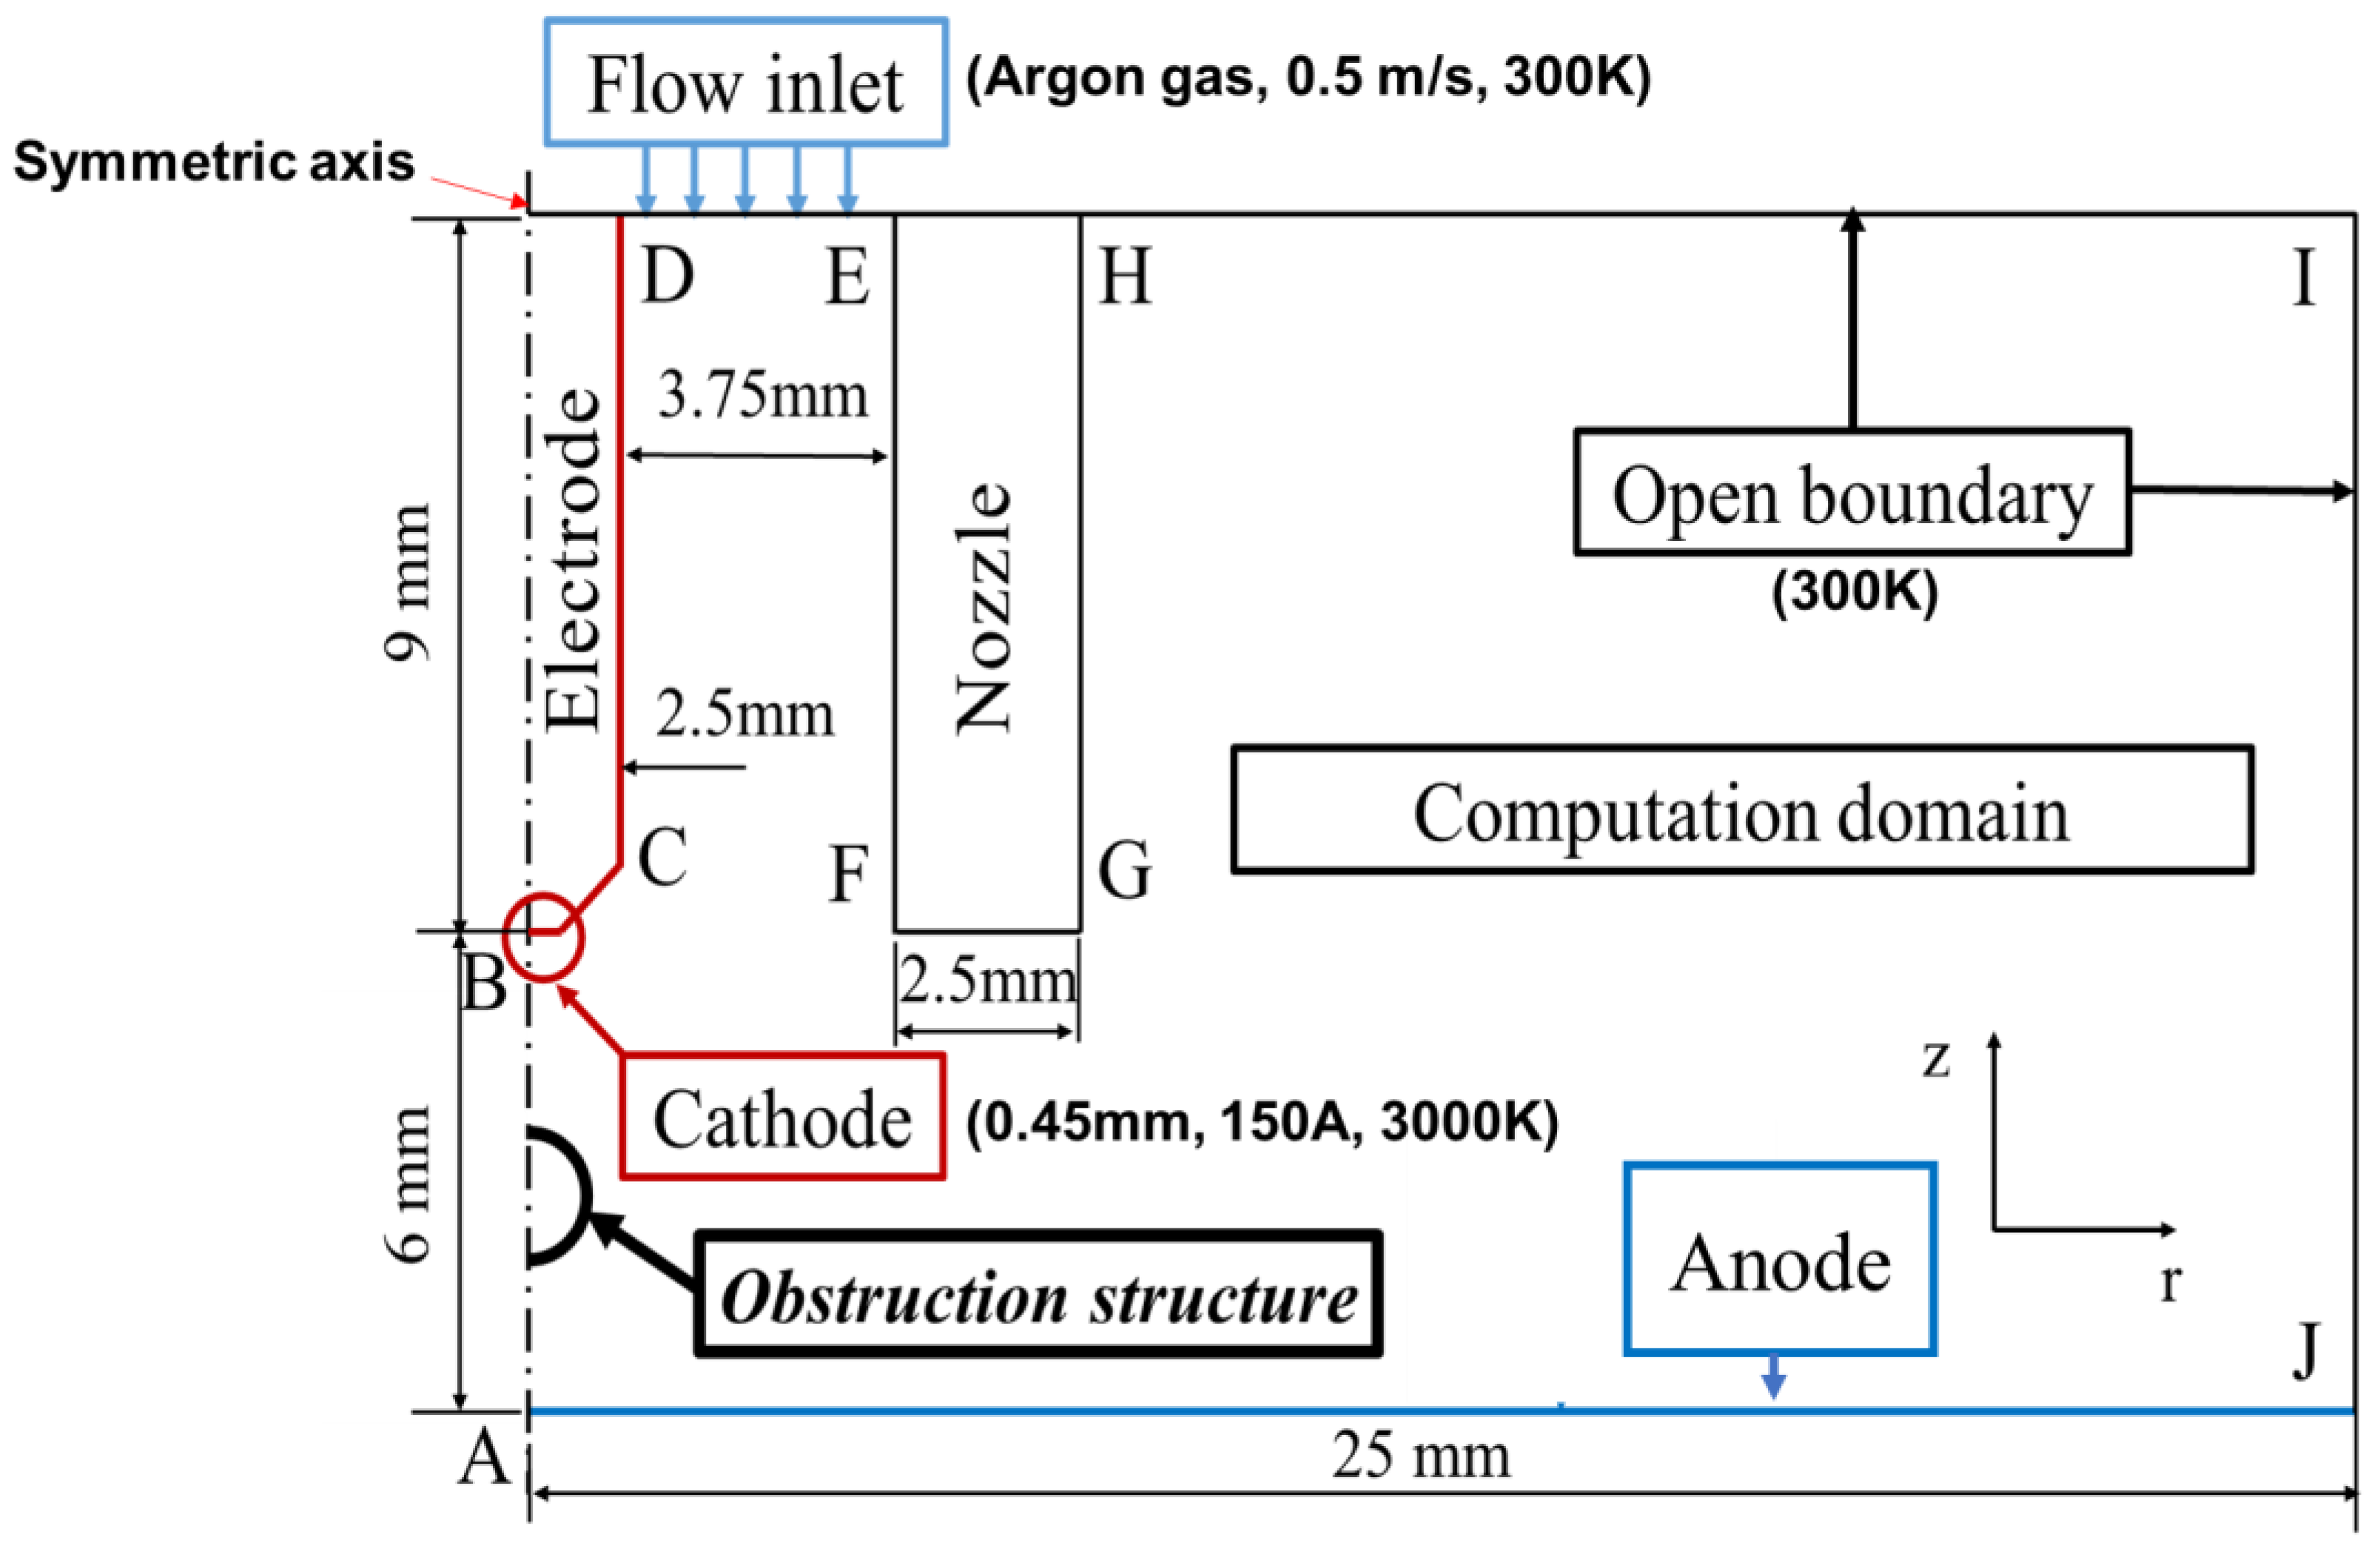
We focused on arc plasma flow variations and used 2D axisymmetric and spatial coordinates (cylindrical) to form geometries;
(2)
Argon was used as the shielding gas and the flow was laminar and steady-state;
(3)
Influence of metal vapor on the transport properties of argon gas is not considered;
(4)
The arc plasma was considered to be in LTE to avoid the need for the development of a twin temperature model for the modelling of the arc plasma area [21];
(5)
Changes in the weld pool and electrodes were not considered.

2.2. Governing Equation

Arc plasma is generated by high voltage electric current and tremendously high temperature plasma was injected. These complex phenomena are governed by several traditional laws of physics. The governing equations are expressed in terms of cylindrical coordinates (r: radial, z: axial) and could be described as follows [22].
Conservation of mass is
ρ t + 1 r r ( r ρ u r ) + z ( ρ u z ) = 0 ,
where ρ is mass density, u r ,   u z are radial and axial velocity, respectively.
Conservation of radial momentum is
ρ u z t + 1 r r ( r ρ u r u r ) + z ( ρ u z u r ) ρ u 2 θ r = p r j z B θ + r [ 2 μ r u r r ] 2 μ u r r 2 + z [ μ ( u r z + u z r ) ] .
Conservation of axial momentum is
ρ u z t + 1 r r ( r ρ u r u z ) + z ( ρ u z u z ) = p z + j r B θ + z [ 2 μ u z r ] + 1 r r [ r μ ( u r z + u z r ) ] + ρ g ,
where p is pressure, μ is viscosity, j r and j z are radial and axial current density, g is the acceleration due to gravity, B θ self-induced magnetic field intensity.
The energy conservation equation is
ρ h t + 1 r r ( r ρ u r h ) + z ( ρ u z h ) = 1 r r ( r k c h r ) + z ( k c h z ) + j r E r + j z E z ψ .
The current continuity equation is
1 r r ( r j r ) + z ( j z ) = 0
and
j r = σ E r ,   j z = σ E z ,
where r is the radial distance, t is the time, h is the enthalpy, c is the specific heat, k is the thermal conductivity, ψ is the radiative emission coefficient, and σ is the electrical conductivity. E r and E z are the radial and axial components of electric field defined by
E r = V r ,   E z = V z ,
where V is the electric potential.
The azimuthal magnetic field B θ induced by the arc current is evaluated by Maxwell’s equation:
1 r r ( r B θ ) = μ 0 j z ,
where μ 0 is the permeability of free space.
The electron and ion currents for the cathode surface are considered and defined based on the Richardson–Dushman equation of thermionic emission as follows:
J R = A R T 2 e x p ( q Φ e f f K B T ) ,
where k B is Boltzmann’s constant and A R is Richardson’s constant depending on cathode material.

2.2.1. Electric Currents

The charge relaxation theory is applied for the calculation of static electric field and current model. The fundamental equations involved are Ohm’s law and the equation of continuity:
· J = Q j ,
J = σ E + J e ,
E = V ,
· J = · ( σ V J e ) = 0 .

2.2.2. Magnetic Fields

The governing equations for magnetic fields can be written using Maxwell’s equations as follows:
× H = J ,
J = σ ( E + v × B ) + J e ,
B = × A .

2.2.3. Heat Transfer

The Heat Transfer in Fluids model uses LTE-considered heat equation as the mathematical model for heat transfer in fluids:
ρ C p u · T + q = Q ,
q = k T .

2.2.4. Laminar Flow

The single-phase fluid-flow interfaces are based on the Navier–Stokes equations:
u t + u · u = p ρ + μ 2 u ,
where u is the fluid velocity, p is pressure, and μ is viscosity.

2.3. Boundary Conditions

The computation domain and boundary conditions of the arc plasma are shown in Figure 1 and Table 1. The model consists of the electrode, nozzle, and ground. The end of the tip of the electrode where the electron is emitted is set to be the cathode, and the current density is set according to the current value. In Figure 1, AJ is applied as an anode as ground. Since electrodes, nozzles, and anodes are not included in the simulation, it is assumed that a certain temperature is reached by applying a temperature boundary condition. The convergence property of simulation is low. In order to increase the convergence characteristics of the simulation, the mesh size near the electrode is more finely applied as shown in Figure 2. Argon used as the shielding gas has unstable physical properties at high temperatures as shown in Figure 3. Thus, the analysis of arc plasma is known to have very low convergence. Therefore, in order to increase the convergence of the analysis, the mesh was created differentially for the area where the arc plasma is generated, by using the mesh control function. The other boundaries are set as open boundaries and Argon shielding gas properties including thermal conductivity, density, dynamic viscosity, heat capacity, electrical conductivity, and radiative emission coefficient are shown in Figure 3. Because arc plasma is a complex multiphysics phenomenon, it considers electric fields, magnetic fields, fluid heat transfer, and fluid flow (laminar flow). It also considers multiphysics such as plasma heat source and temperature coupling in the computational domain. Furthermore, in Figure 3, the properties of argon gas are defined as a function of temperature and are required for plasma modules.
In Table 1, T is the temperature, Q b is the heat source on the boundary and   J e l e c is electron-current density,   J i o n is ion current density, V i o n is plasma’s ionization potential, Φ c is cathode work function, Φ a is anode work function, Φ e f f is effective work function for thermionic emission of the electrode surface at the local surface temperature, J R is Richardson current density, effective Richardson’s constant A R is the thermionic-emission constant for the surface of the cathode, U 0 is the normal inflow speed, n is the normal vector to the boundary, I is the unit diagonal matrix, K is the Lagrange multipliers that are used to implement the boundary condition, p 0 is pressure conditions at the outlet, p 1 is the pressure to adjust the outlet pressure to prevent fluid from entering the domain through the boundary. The value of each term is Φ c , Φ a = 4.15 V, Φ e f f = 2.6 V, A R = 120   A /(K·cm)2, V i o n   = 15.7 V, T 0 = 3000 K, T 1 = 1293.15 K, T 2 = 300 K, U 0 = 0.5 m/s, P 0 = 0 Pa.
In order to analyze the variation of high temperature arc plasma flow via the obstruction structure between electrodes, three obstruction structure shapes were modeled as shown in Figure 4. The first shape is a sphere shape, the second shape is a cylinder shape, and the last shape is a concave shape. Each shape has the surface area gradually increasing for the arc plasma.

3. Results

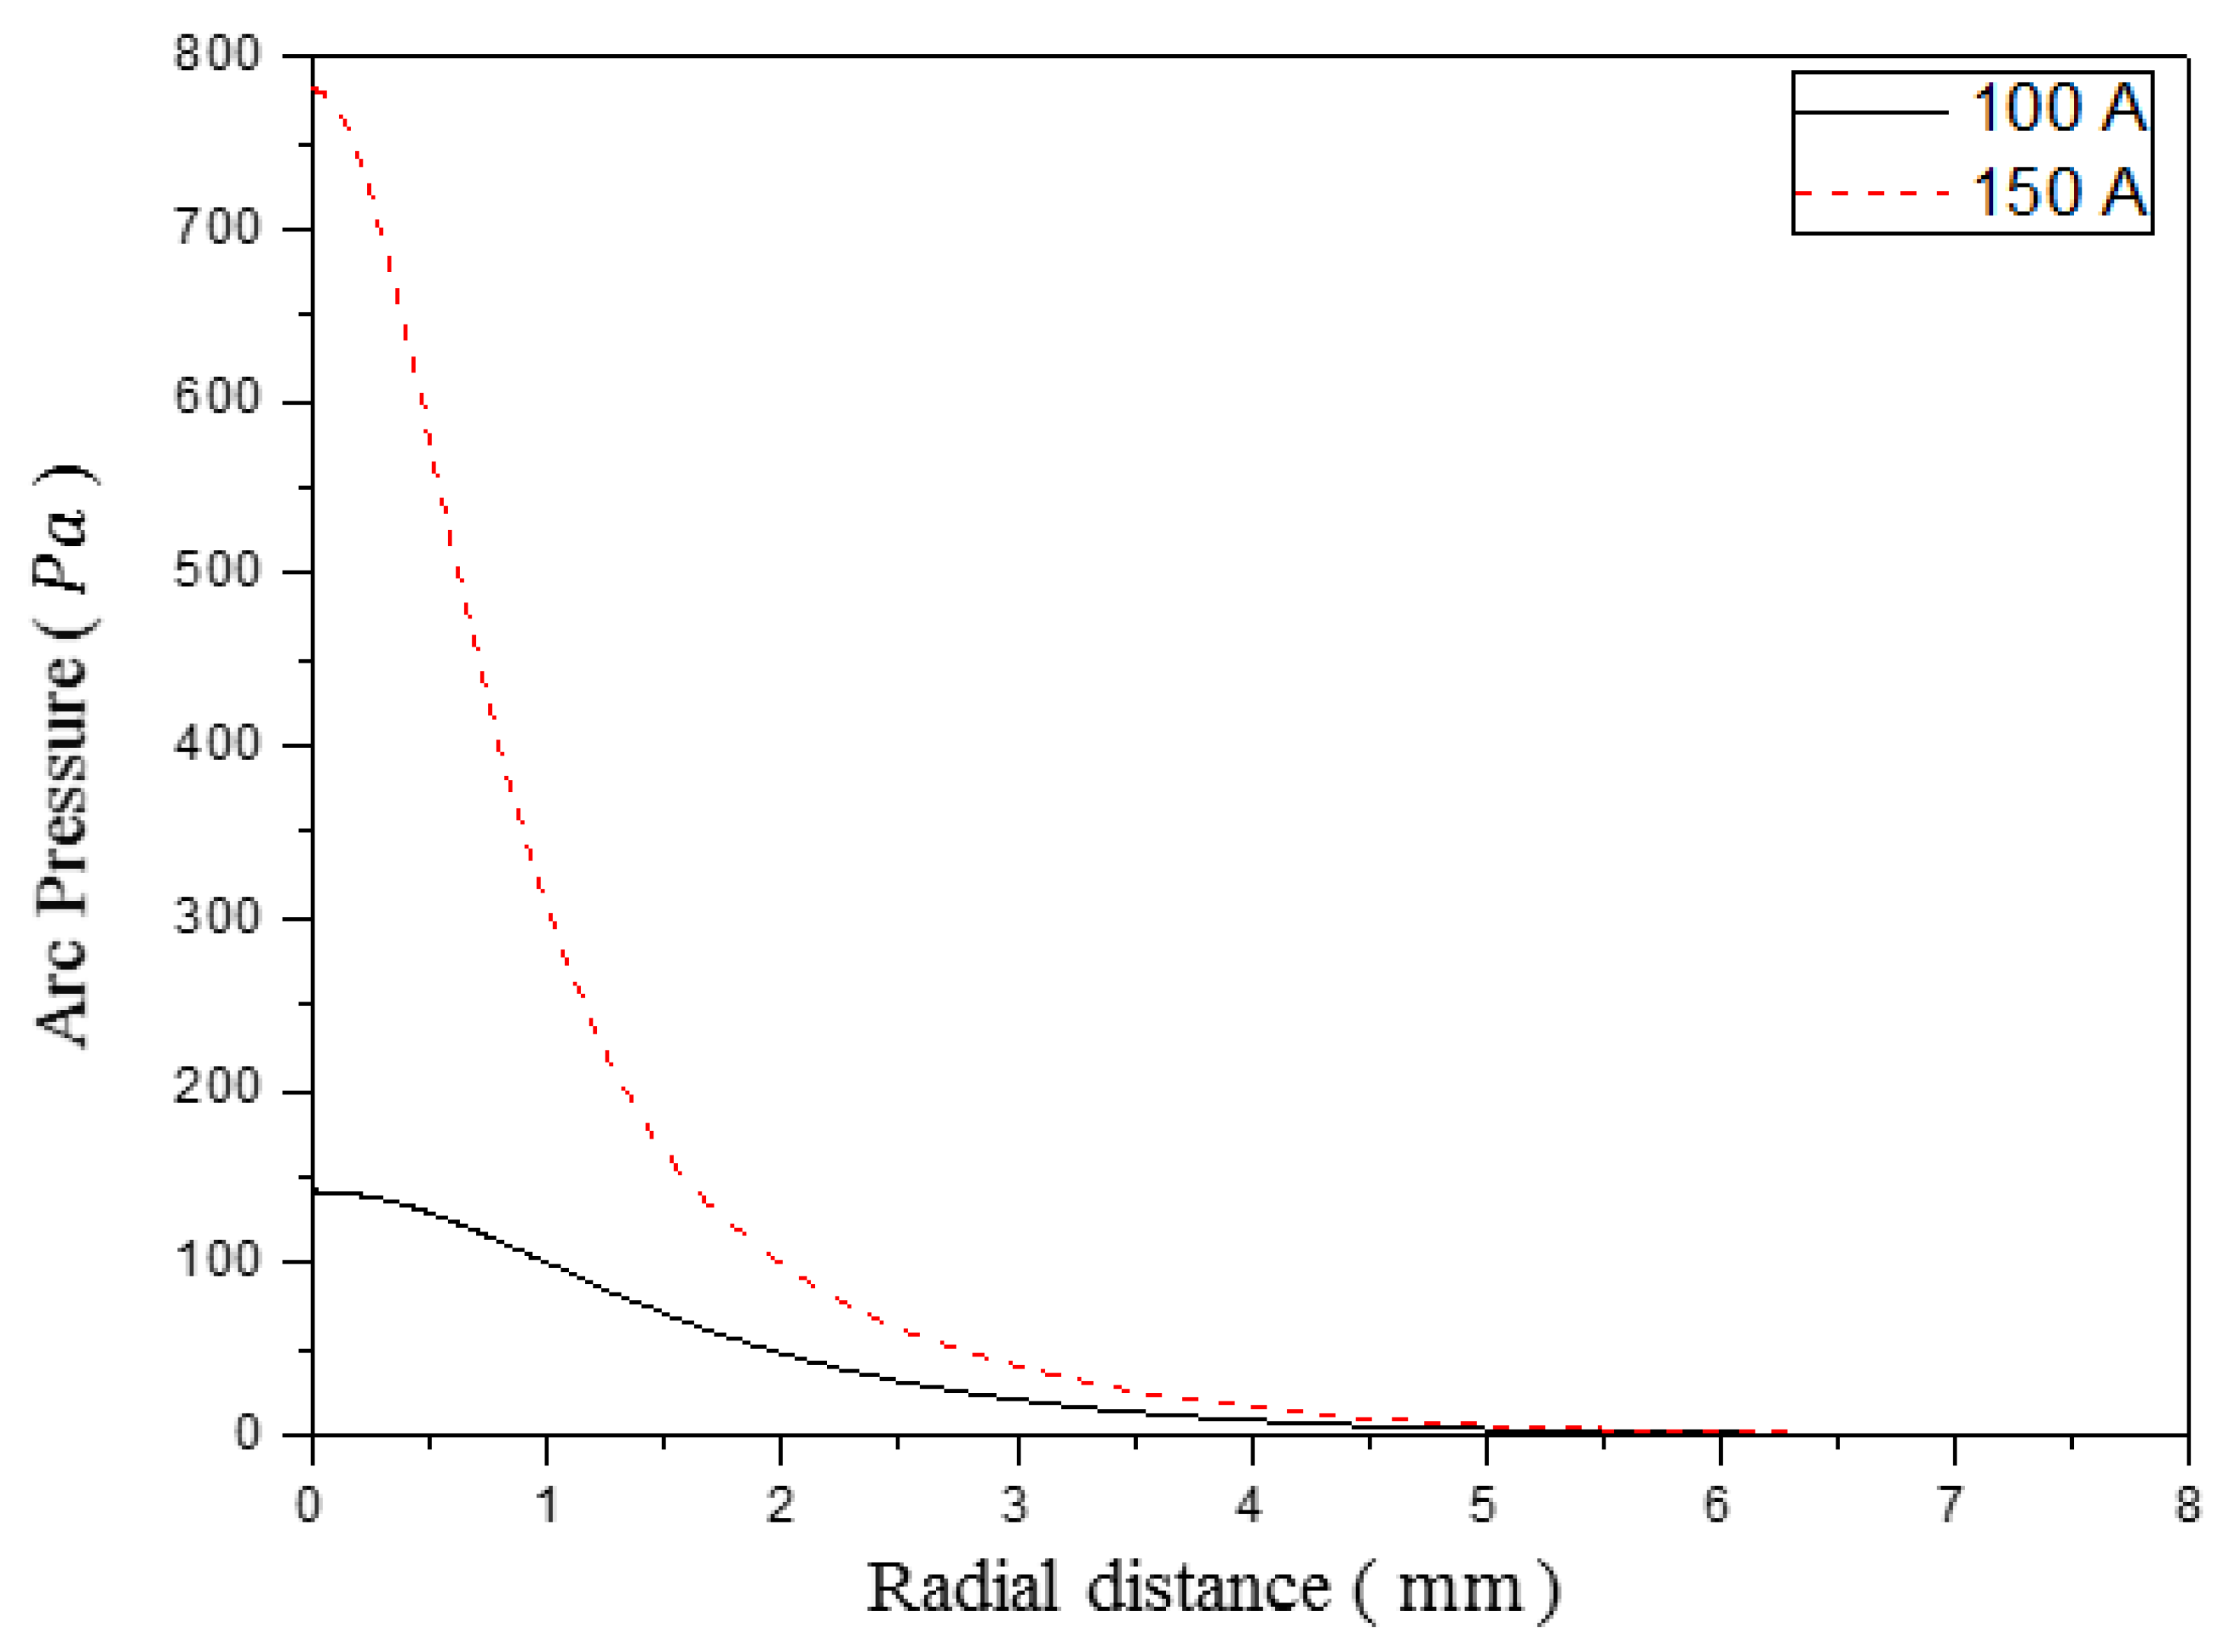
3.1. Arc Plasma Analysis for the Different Current

Arc plasma analysis was carried out for the current of 100 A and 150 A and the temperature distribution results are shown in Figure 5.
Figure 6 shows the velocity distribution of the arc plasma. When the electrical input current is 100 A, the maximum velocity is 207 m/s. When the current is 150 A, the maximum of arc plasma velocity is 460 m/s, which is more than twice as fast as that in the case of 100 A. In the vicinity of 1 mm above the anode, the velocity of arc plasma is about 61 m/s when the current is 100 A, and the result value is 254 m/s when the current is 150 A. Comparing the results, the arc plasma velocity near the anode differed more than four times, and considering that the maximum velocity is 207 m/s when the current is 100 A, it can be seen that the current condition is a very important variable in the velocity of arc plasma.
Figure 7 shows the simulation results of arc pressure on the anode surface. The maximum arc pressure at the anode surface is about 780 Pa when the current is 150 A, which is more than five times that at 100 A. Additionally, the arc pressure on the surface of the cathode is about 1580 Pa when the current is 150 A and about 580 Pa when the current is 100 A, which is about three times different.
In order to verify the reliability of the numerically calculated results in this study, we compared the numerically calculated results such as temperature profile and plasma velocity with the available experimental and analytic data in the literature, which show reasonable agreement. Specifically, the maximum temperature of the arc plasma in TIG welding under the condition of input current 150 A, the distance between the electrode and the base material 6 mm is around 19,000 K in the Yamamoto simulation model [23]. This result was similar to the simulation result of this study, which is 19,000~20,000 K.

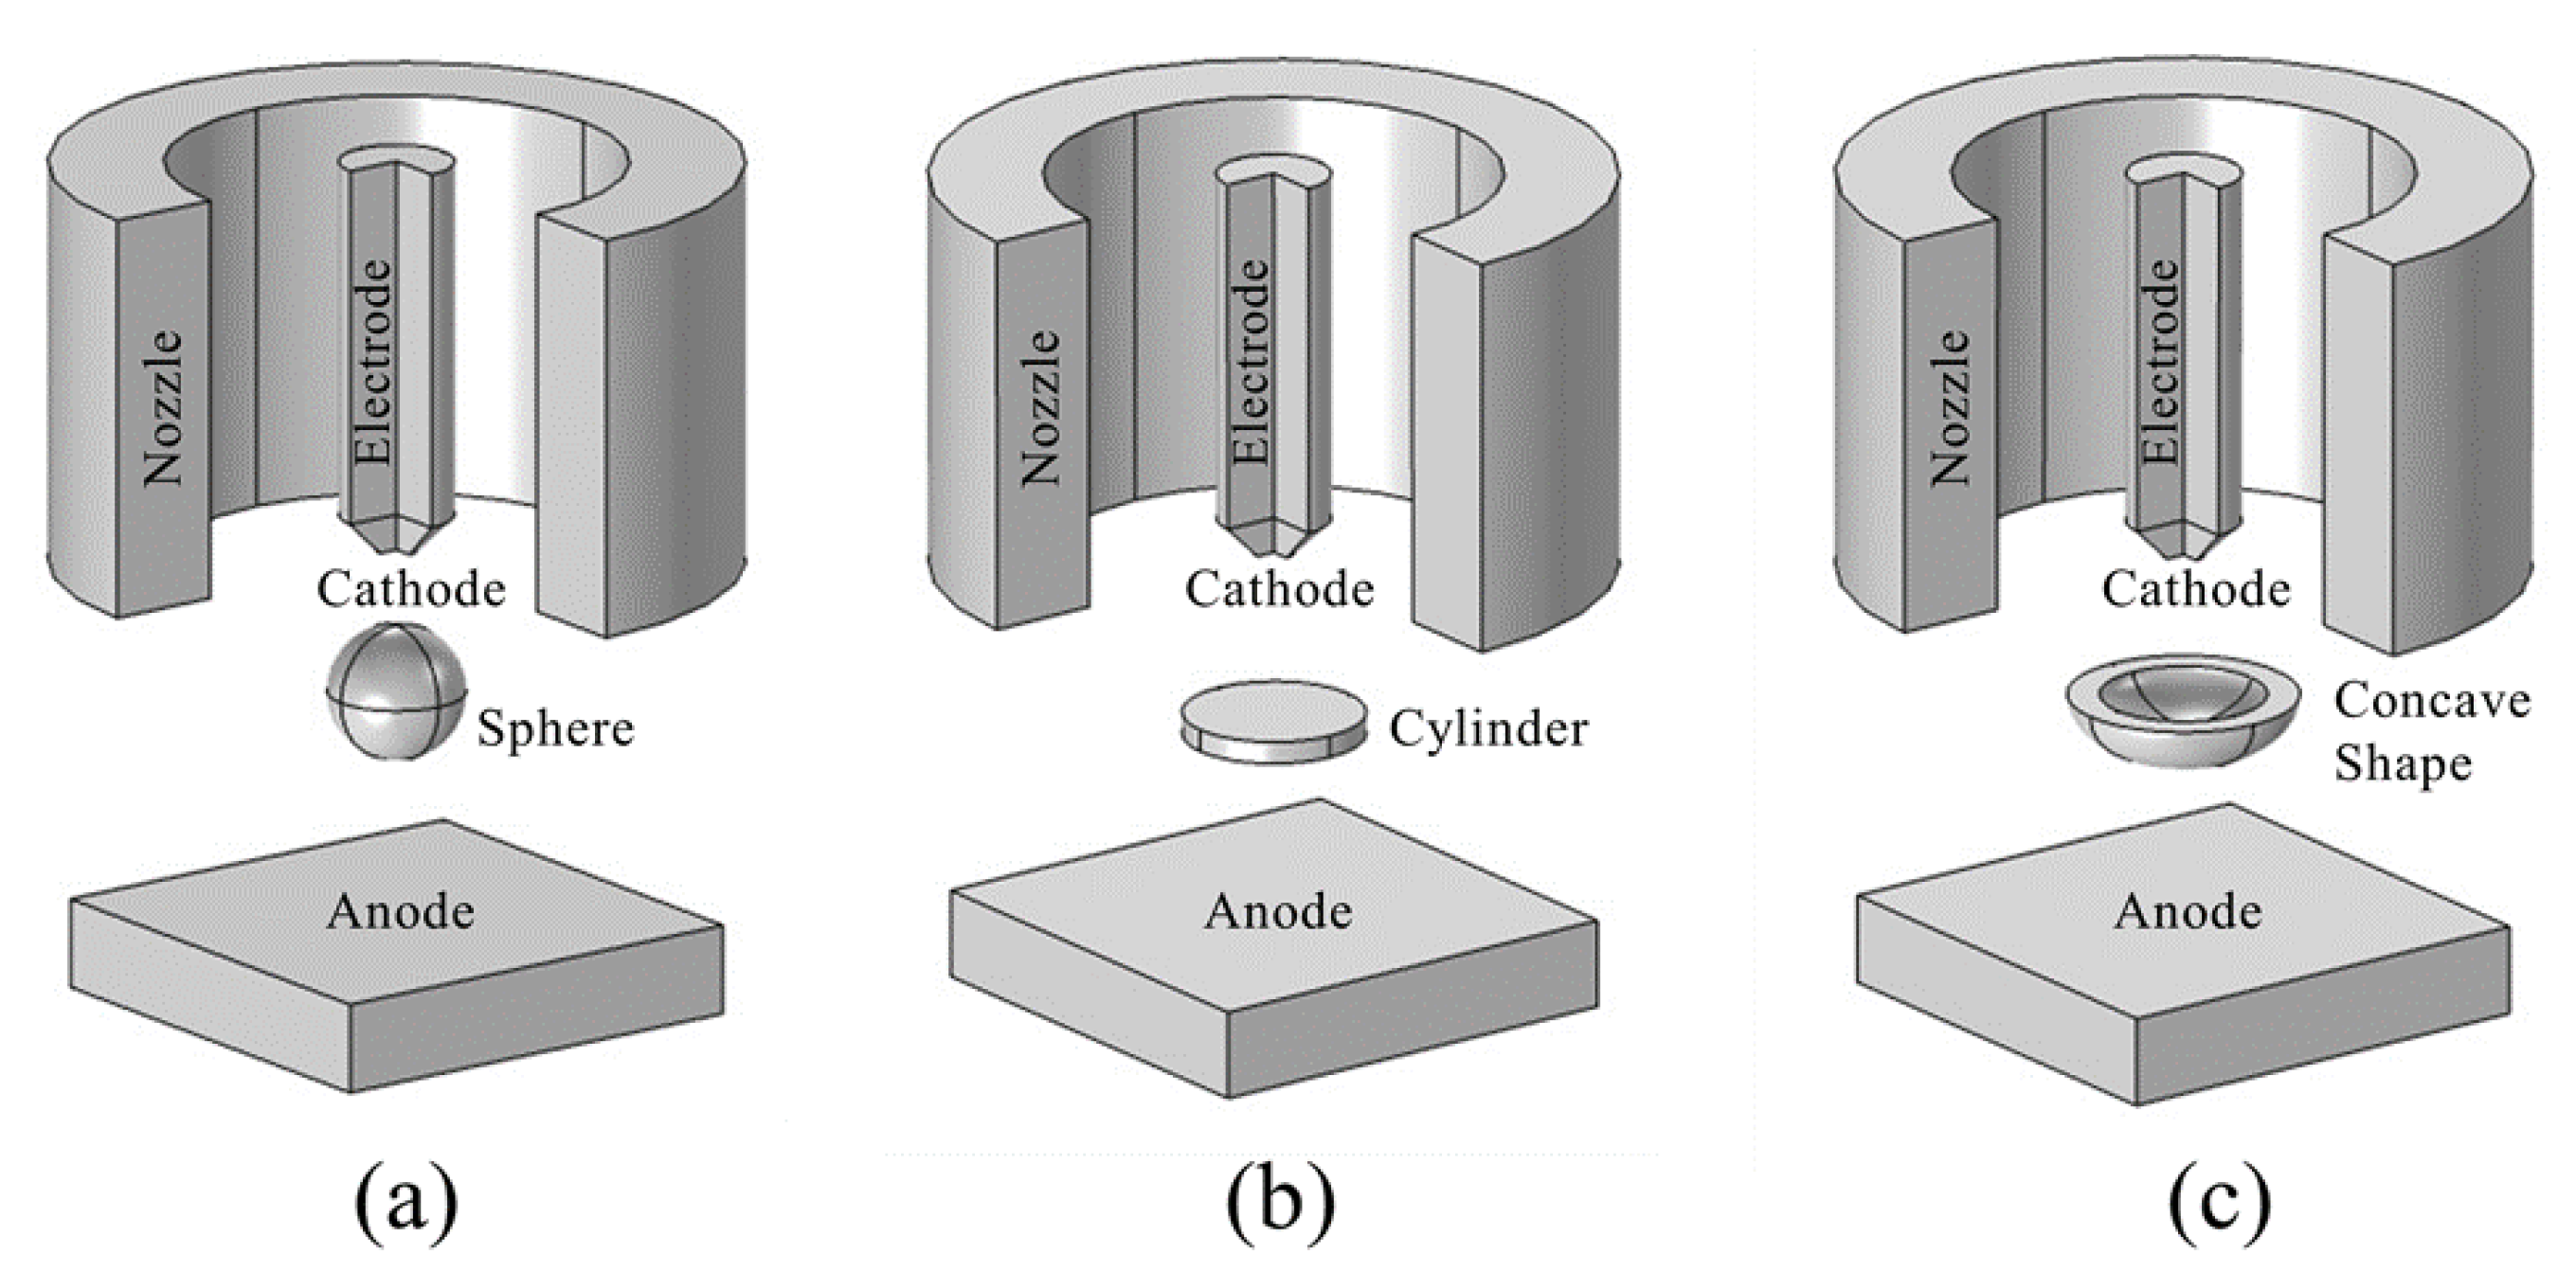
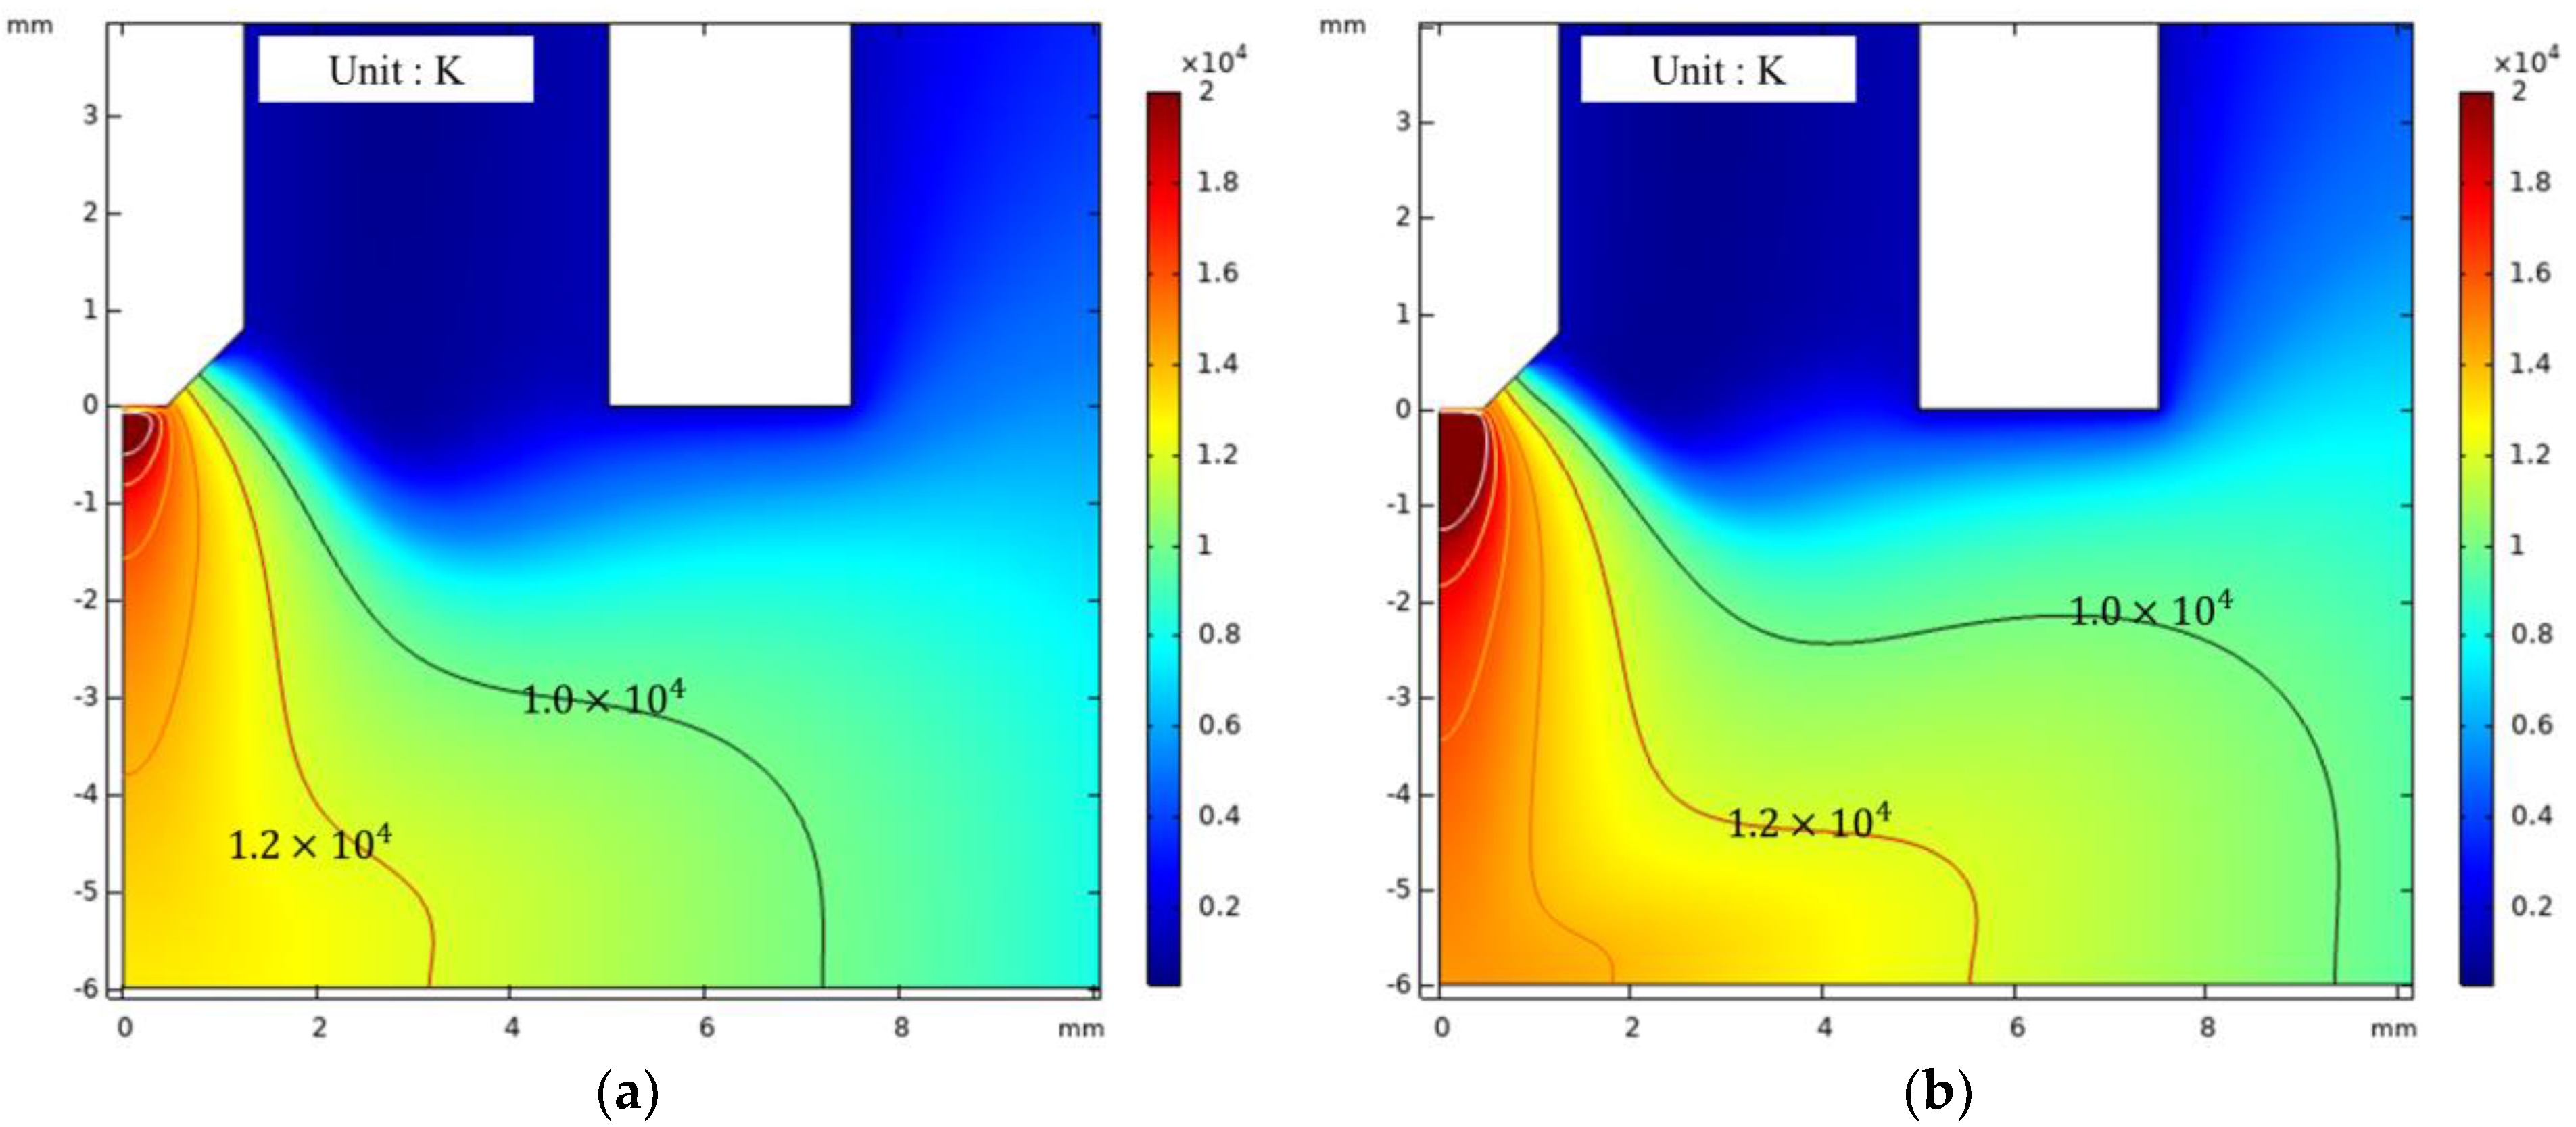
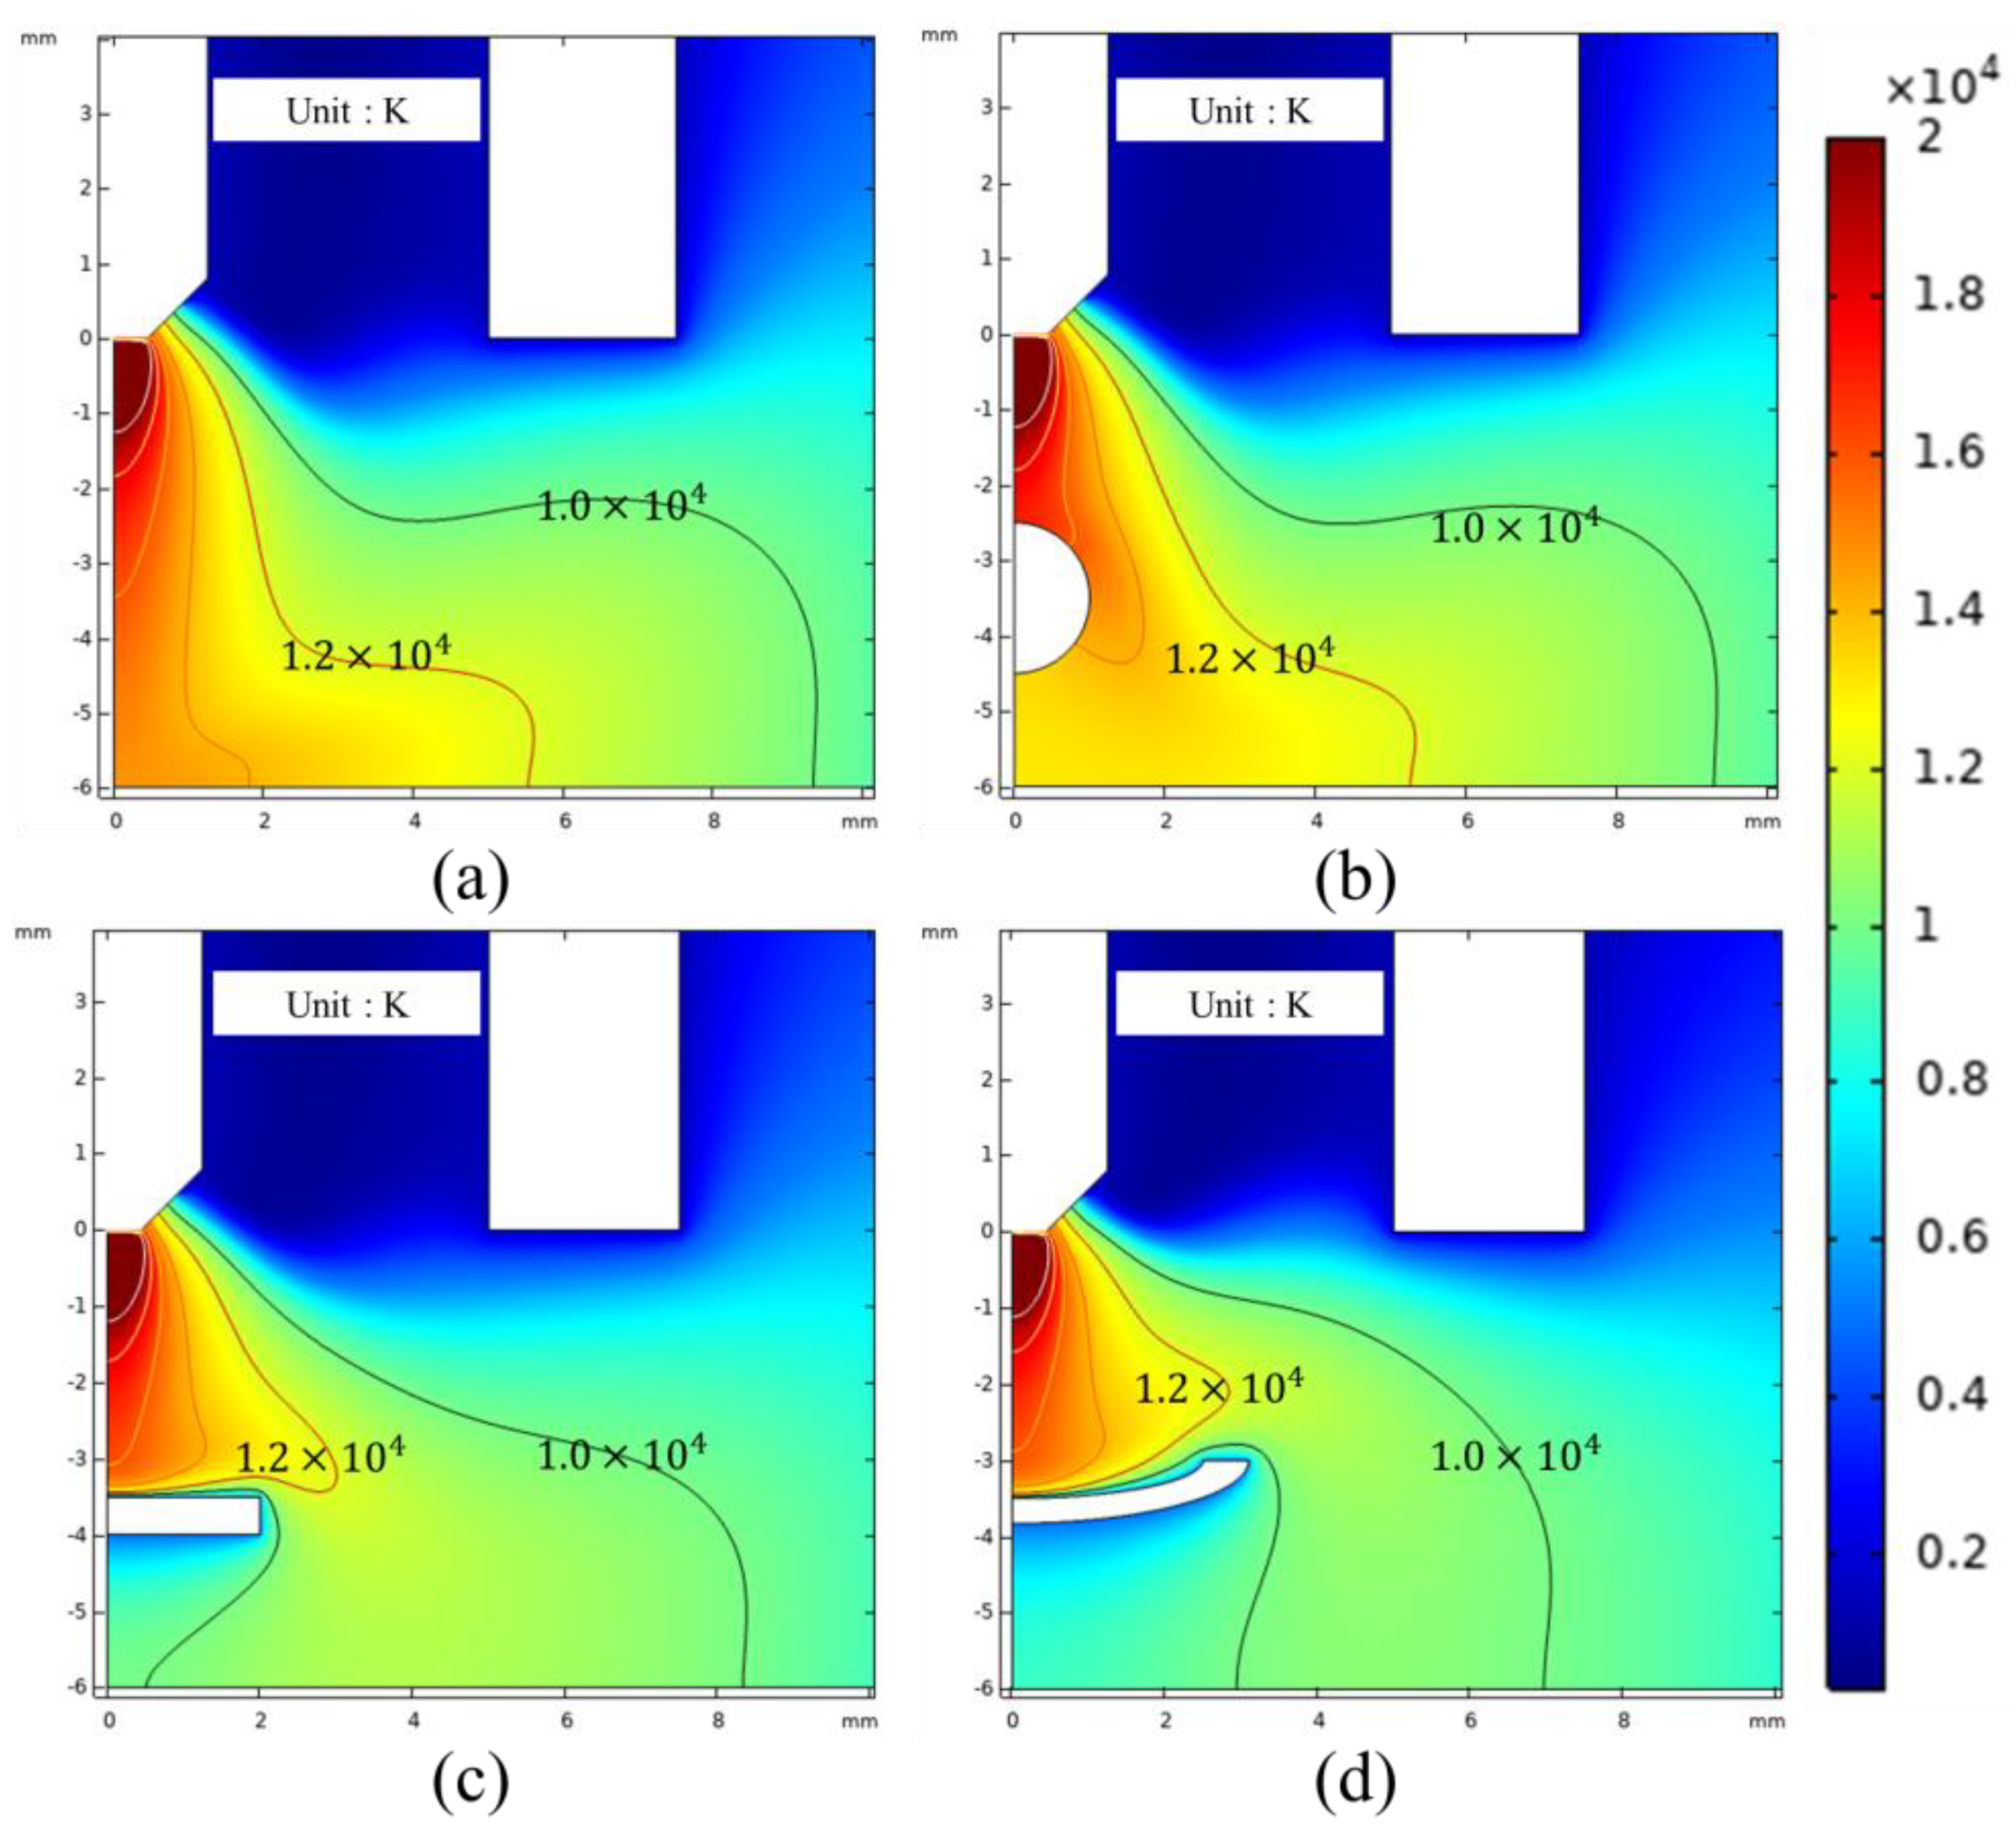
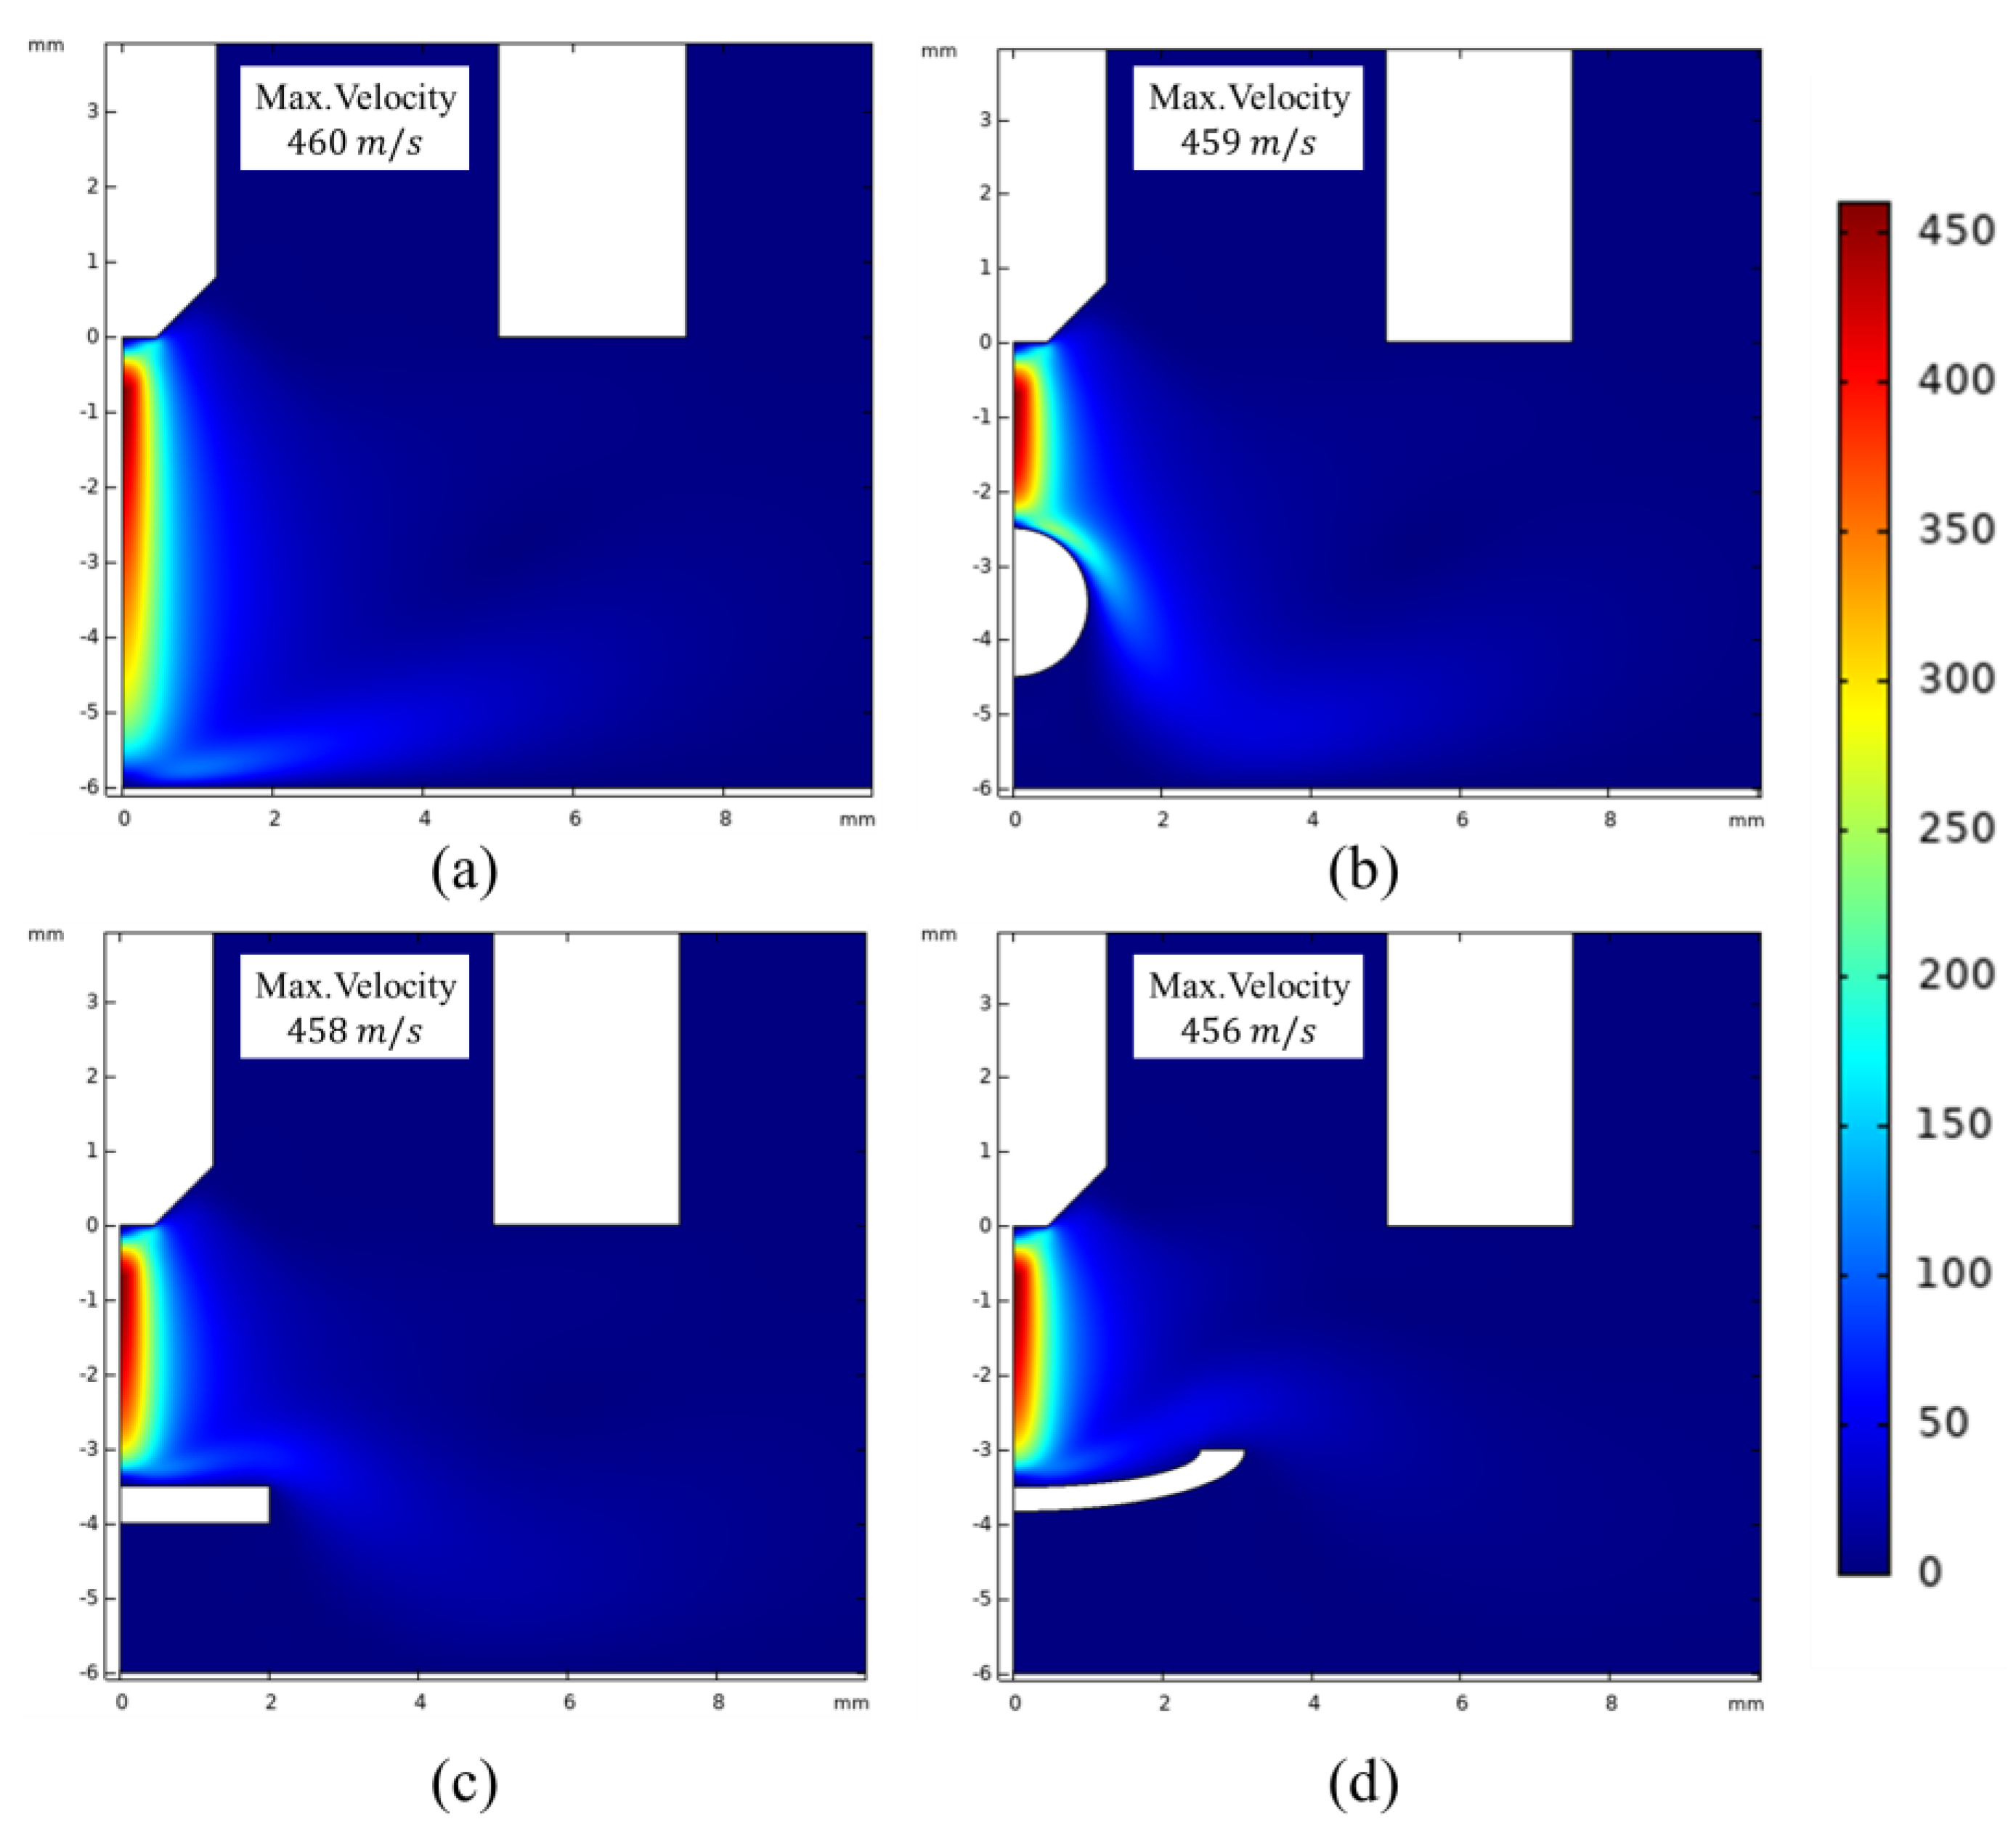
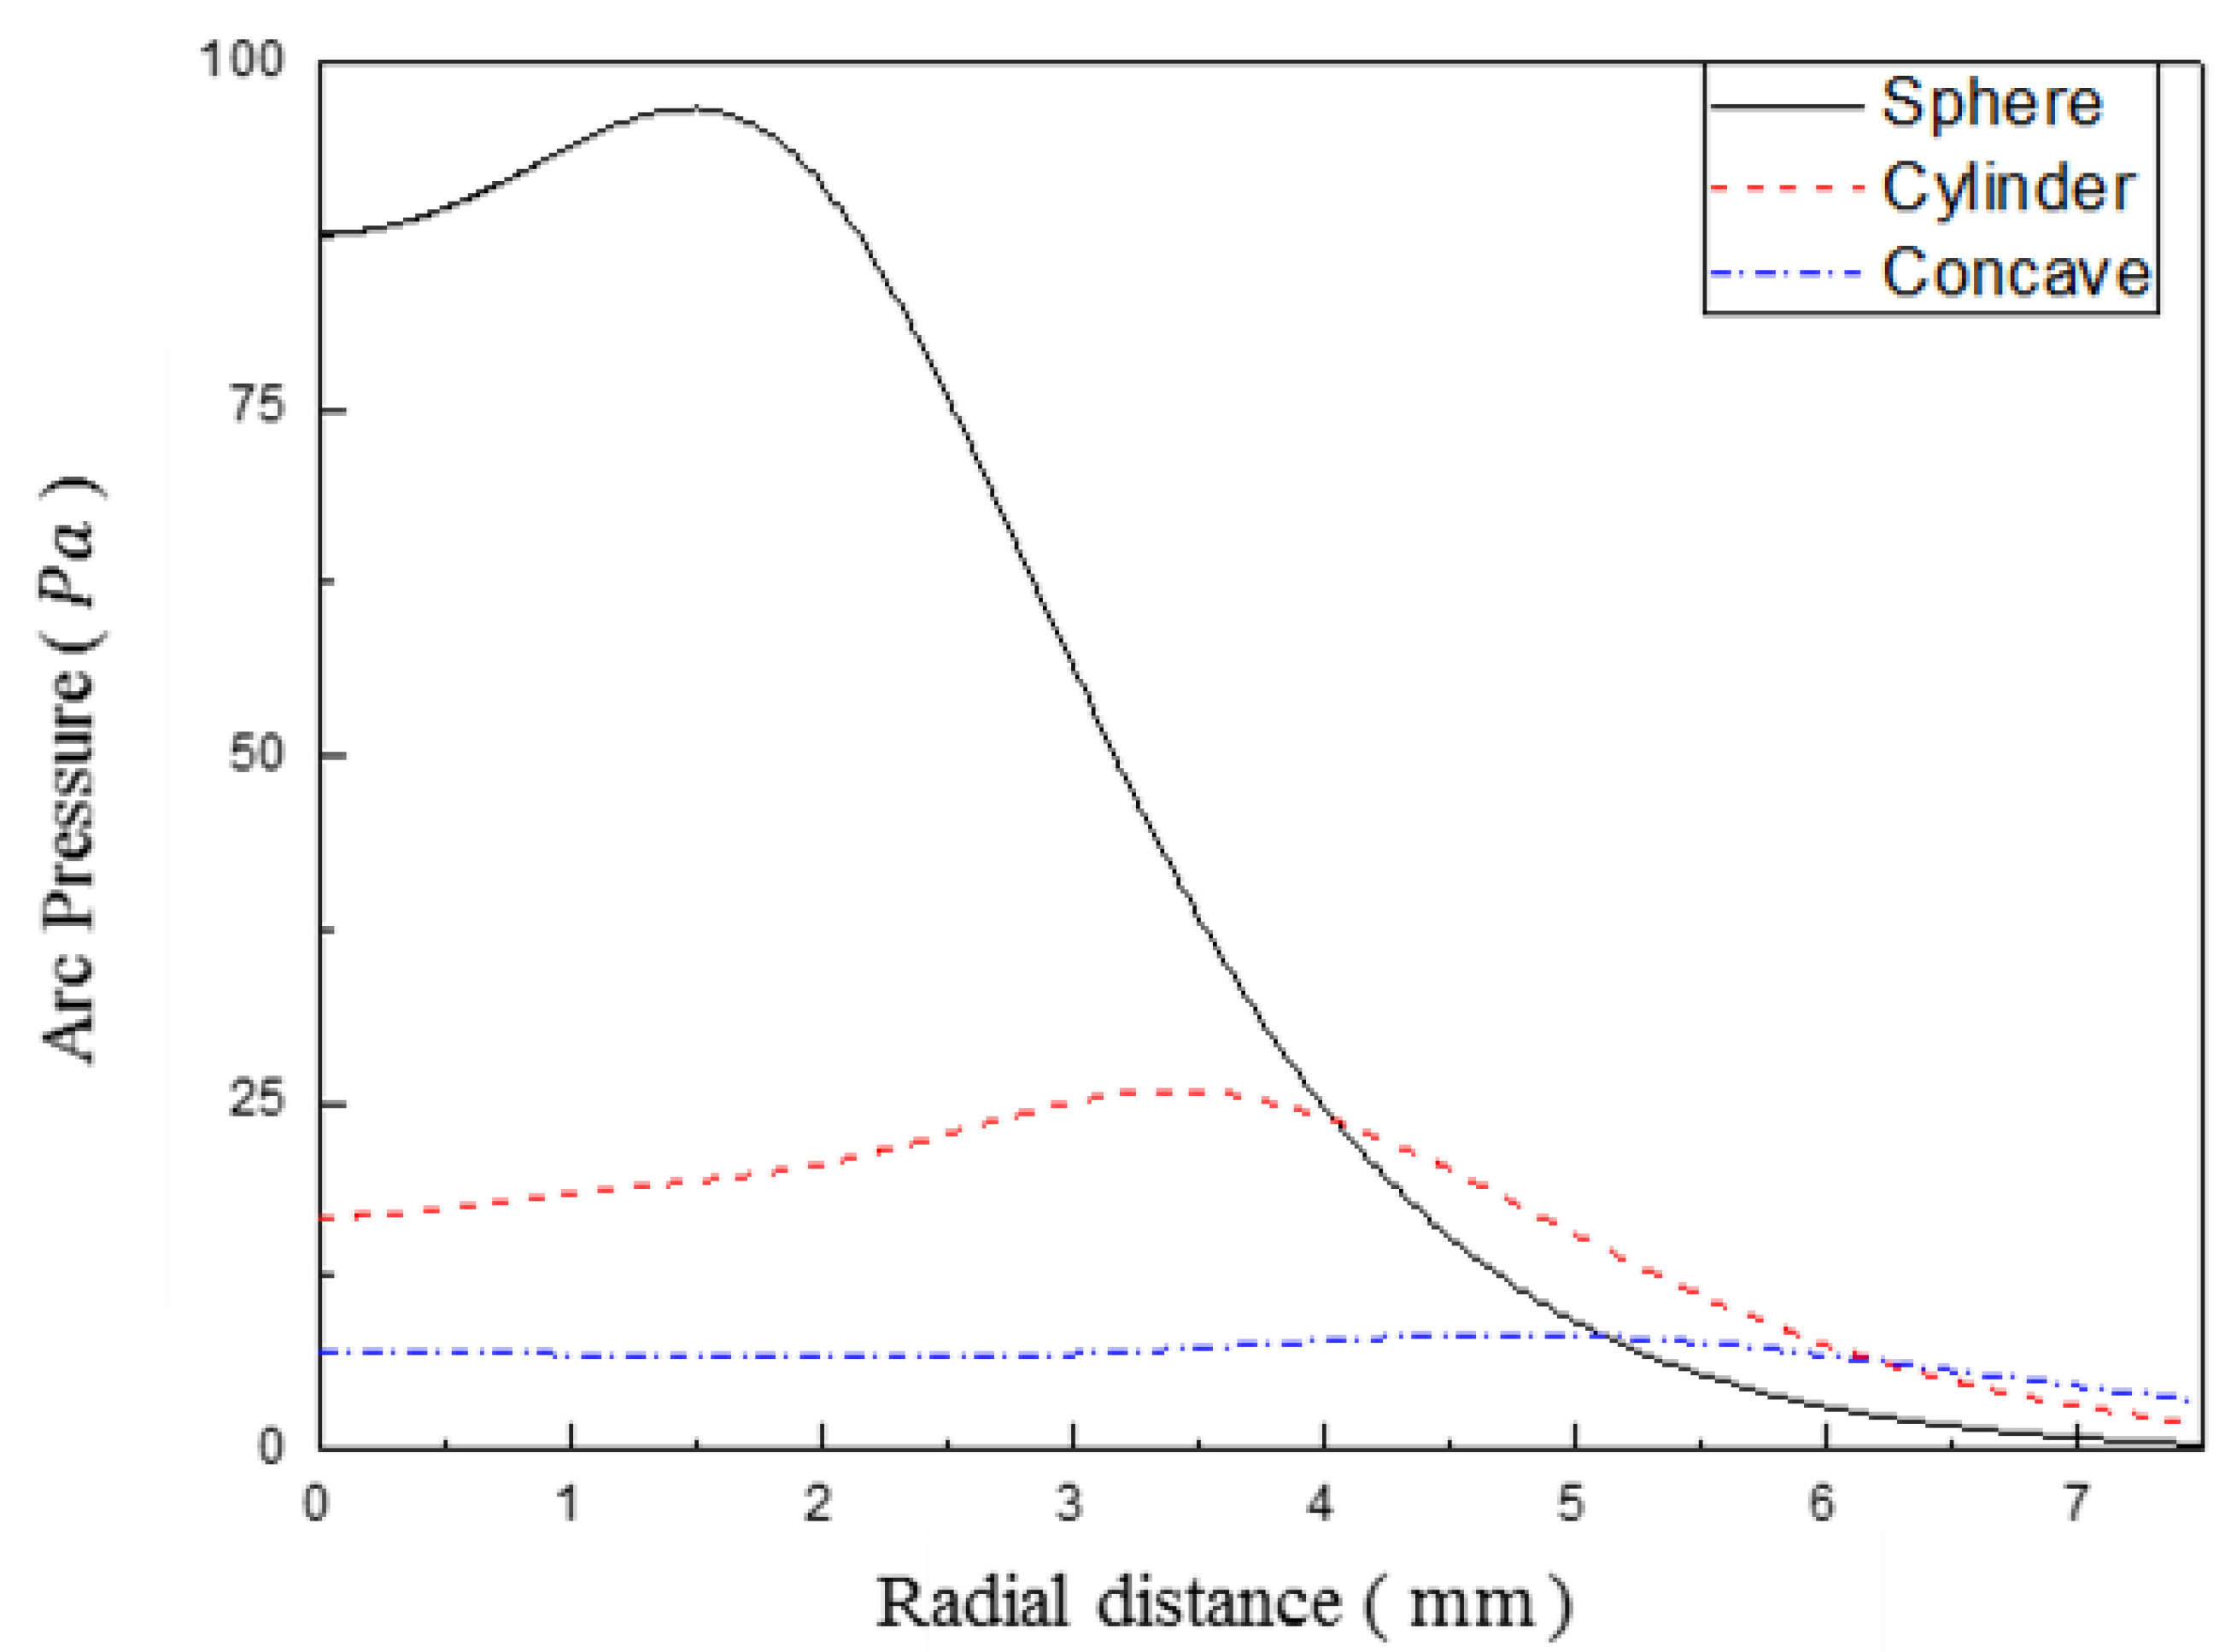
3.2. Variation of High Temperature Arc Plasma Flow via Obstruction Structure between Electrodes

An arc plasma flow analysis was performed according to the shape of the obstruction structure. To compare the results in the presence and absence of the obstruction structure, the analysis result for the electrical current of 150 A, as shown in Section 3.1, was added, with the obstruction structure shape as none type.
Figure 8 shows the temperature distribution of the arc plasma according to the shape of the obstruction structure. Although the shape of the obstruction structure did not significantly affect the maximum temperature, it was confirmed that the shape of the plasma and the temperature distribution under the obstruction structure varies depending on the shape of the obstruction structure. Especially, the temperature below the obstruction structure drops sharply. Moreover, we compared temperature distribution using contour line of 10,000 K for each type of obstacle structure. In the case of concave structure, the radius of the temperature contour line is about 7.0 mm on the anode surface as shown in Figure 8d. This radius is relatively shorter than that of other obstacle structures. In the case of an obstacle none type or a spherical obstacle, the radius of temperature contour line is about 9.3 mm as shown in Figure 8a,b, which means that the distribution of heat input to the anode surface is wider than that of concave obstacle.
Figure 9 shows the heat flux at the anode according to the shape of the obstruction structure, and it was confirmed that the heat flux at the center of the arc decreases from the sphere to the concave shape. As a result, the average heat flux at the anode is reduced, and the concave shape is much less affected by the heat flux at the anode than the none type and sphere shape. The reason why the concave shape is in the direction of the plasma fluid stream. Based on the contour line from temperature simulation results shown in Figure 6a, the contour line was developed as a bell shape. The contour line of the main heat source is more prevented from obstacles. Concave-shaped obstacles may interrupt the main heat source flow comparing with other shapes. Therefore, Heat flux may decrease on the anode.
Figure 10 shows the velocity distribution of the arc plasma according to the shape of the obstruction structure. The maximum velocity of the arc plasma was about 460 m/s for all shapes. It was found that the maximum speed was not significantly correlated with the shape of the obstruction structure and was largely influenced by the input current. It can also be seen that the plasma velocity drops sharply below the obstruction structure.
Figure 11 shows the arc pressure at the anode according to the shape of the obstruction structure. In the presence of an obstruction structure, the arc pressure is lowered due to the interference caused by the obstruction structure. This is consistent with the fact that the velocity slope is lowered by a sharp decrease in the arc velocity below the obstruction structure.
When the pressure of the arc plasma is compared with the shape of the obstruction structure, it is confirmed that the arc pressure acts on the anode uniformly in the case of the concave shape, and it is considered that the arc plasma is uniformly distributed in the radial direction. In the application of high temperature arc plasma, which is sensitive to changes in the anode, it is a good choice to select the concave shape with low heat flux and uniform arc pressure.
For example, in the case of arc welding, the use of concave-shaped filler material can generate a good weld shape. This is because the low average heat flux at the anode and the evenly distributed arc pressure reduces the flow of the free surface of the molten pool and yield an evenly distributed arc plasma.

4. Conclusions

In this study, the variation of high temperature arc plasma flow via the obstruction structure between electrodes was analyzed using Multiphysics simulation software. When the arc plasma intensity was increased from 100 A to 150 A, the temperature of the overall arc plasma has increased, and the arc pressure was increased to five times. The reliability of the analysis was verified through comparison with advanced research. As the shape changes from none type to concave shape, reduction in heat flux and arc pressure in the anode are confirmed. The concave shape can reduce the flow of the plasma from the anode and obtain an even distribution of the arc plasma in the radial direction.
When an obstruction structure such as a metal wire is disposed between the anode and the cathode, the temperature distribution of the arc plasma and the arc pressure on the base material is changed while interfering with the arc plasma flow. This phenomenon can be used to make the molten base material be influenced by the uniform arc pressure. The heat flux transferred to the base material is also changed by the obstruction structure, and it is shown that heat energy can be controlled appropriately.

Author Contributions

Conceptualization, Y.-T.C.; methodology, Y.-T.C. and G.-H.J.; software, Y.-T.C. and G.-H.J.; formal analysis, Y.-T.C. and G.-H.J. and C.-K.K.; investigation, G.-H.J. and C.-K.K. and W.-P.K. and Y.-C.J.; writing—original draft preparation, Y.-T.C. and G.-H.J. and C.-K.K. and W.-P.K. and Y.-C.J.; writing—review and editing, Y.-T.C. and G.-H.J.; visualization, G.-H.J. and C.-K.K.; supervision, Y.-T.C.; project administration, Y.-T.C. All authors have read and agreed to the published version of the manuscript.

Funding

This research was supported by Korea Institute of Energy Technology Evaluation and Planning (KETEP) grant funded by the Korea government (MOTIE) (20214000000480, Development of R&D engineers for combined cycle power plant technologies).

Institutional Review Board Statement

Not applicable.

Informed Consent Statement

Not applicable.

Data Availability Statement

Not applicable.

Acknowledgments

This work was supported by Korea Institute of Energy Technology Evaluation and Planning (KETEP) grant funded by the Korea government (MOTIE) (20214000000480, Development of R&D engineers for combined cycle power plant technologies). This result was supported by “Regional Innovation Strategy (RIS)” through the National Research Foundation of Korea (NRF) funded by the Ministry of Education (MOE).

Conflicts of Interest

The authors declare no conflict of interest.

Nomenclature

Amagnetic vector potential
A R Richardson’s constant
Bmagnetic flux density
C p fluid heat capacity at constant pressure
Eelectric field intensity
Fvolume force vector
Hmagnetic field intensity
Jcurrent density
J e externally generated current density
J ion ion current density
J elec electron current density
kfluid thermal conductivity
k B Boltzmann’s constant
ppressure
qelectronic charge
Qheat source
Q b heat flux on cathode boundary
Q j current source
Sstrain-rate tensor
Tabsolute temperature
uthe fluid velocity vector
vvelocity of the conductor
Vscalar electric potential
V i o n ionization potential of the plasma
σ electrical conductivity
Φ surface work function
Φ eff effective work function
μ dynamic viscosity
ρ density
τ viscous stress tensor

References

  1. Wu, C.S.; Ushio, M.; Tanaka, M. Modeling the anode boundary layer of high-intensity argon arcs. Comp. Mater. Sci. 1999, 15, 302–310. [Google Scholar] [CrossRef]
  2. Lee, W.H.; An, J.H.; Byeon, S.S.; Lee, J.C. Prediction on plasma behavior of free-burning arc systems by numerical analysis of three-dimensional thermal flows. In Proceedings of the KIEE Summer conference, Pyeongchang, Gangwon-do, Korea, 13–15 July 2016. [Google Scholar]
  3. Bauchire, J.M.; Langlois-Bertrand, E.; Izarra, C.D. Numerical modelling of a free-burning arc in argon: A tool for understanding the optical mirage effect in a TIG welding device. In Proceedings of the COMSOL Conference, Milan, Italy, 7–9 October 2009. [Google Scholar]
  4. Lago, F.; Gonzalez, J.; Freton, P.; Gleizes, A. A numerical modelling of an electric arc and its interaction with the anode: Part I. The two-dimensional model. J. Phys. D Appl. Phys. 2004, 37, 883–897. [Google Scholar] [CrossRef]
  5. Savas, A.; Ceyhun, V. Finite element analysis of GTAW arc under different shielding gases. Comp. Mater. Sci. 2011, 51, 53–71. [Google Scholar] [CrossRef]
  6. Murphy, A.B.; Tanaka, M.; Yamamoto, K.; Tashiro, S.; Sato, T.; Lowke, J.J. Modelling of thermal plasmas for arc welding: The role of the shielding gas properties and of metal vapour. J. Phys. D Appl. Phys. 2009, 42, 194006. [Google Scholar] [CrossRef]
  7. Tashiro, S.; Tanaka, M.; Nakata, K.; Iwao, T.; Koshiishi, F.; Suzuki, K.; Yamazaki, K. Plasma properties of helium gas tungsten arc with metal vapour. Sci. Technol. Weld. Joi. 2007, 12, 202–207. [Google Scholar] [CrossRef]
  8. Tanaka, M.; Lowke, J.J. Predictions of weld pool profiles using plasma physics. J. Phys. D Appl. Phys. 2007, 40, R1–R23. [Google Scholar] [CrossRef]
  9. Hsu, K.C.; Etemadi, K.; Pfender, E. Study of the free-burning high-intensity argon arc. J. Appl. Phys. 1983, 54, 1293–1301. [Google Scholar] [CrossRef]
  10. Haddad, G.N.; Farmer, A.J.D. Temperature determinations in afr ee-burning arc: 1. Experimental techniques and results in argon. J. Phys. D Appl. Phys. 1984, 17, 1189–1196. [Google Scholar] [CrossRef]
  11. Lee, W.H.; Kim, Y.J.; Lee, J.C. Temperature prediction in a free-burning arc and electrodes for nanostructured materials and systems. J. Nanosci. Nanotechnol. 2015, 15, 8446–8450. [Google Scholar] [CrossRef] [PubMed]
  12. Lee, J.H.; Cho, Y.T.; Na, S.J. A numerical analysis of a gas-tungsten arc welding considering the current density and temperature distribution on the electrode surface. Proceedings of Institution of Mechanical Engineers. Part B. J. Eng. Manuf. 2002, 216, 1115–1121. [Google Scholar] [CrossRef]
  13. Cho, Y.T.; Cho, W.I.; Na, S.J. Numerical analysis of hybrid plasma generated by Nd:YAG laser and gas tungsten arc. Opt. Laser. Technol. 2011, 43, 711–720. [Google Scholar] [CrossRef]
  14. Cho, Y.T.; Na, S.J. Numerical Analysis of Plasma in CO2 Laser and Arc Hybrid Welding. Int. J. Precis. Eng. Man. 2015, 16, 787–795. [Google Scholar] [CrossRef]
  15. Mokrov, O.; Simon, M.; Sharma, R.; Reisgen, U. Arc-cathode attachment in GMA welding. J. Phys. D Appl. Phys. 2019, 52, 1–9. [Google Scholar] [CrossRef]
  16. Dong, B.; Cai, X.; Ni, Z.; Lin, S.; Fan, C.; Yang, C. Numerical simulation of arc characteristics in narrow gap TIG welding. Int. J. Mech. Sci. 2019, 10503, 161–162. [Google Scholar] [CrossRef]
  17. Xiang, J.; Chen, F.F.; Park, H.; Tanaka, K.; Shigeta, M.; Tanaka, M.; Murphy, A.B. Numerical study of the metal vapour transport in tungsten inert-gas welding in argon for stainless steel. Appl. Math. Model. 2020, 79, 713–728. [Google Scholar] [CrossRef]
  18. Trelles, J.P. Nonequilibrium Phenomena in (Quasi-) thermal Plasma Flows. Plasma Chem. Plasma Process. 2019, 40, 727–748. [Google Scholar] [CrossRef]
  19. Xu, G.; Hu, J.; Tsai, H.L. Three-dimensional modeling of arc plasma and metal transfer in gas metal arc welding. Int. J. Heat Mass Tran. 2009, 52, 1709–1724. [Google Scholar] [CrossRef]
  20. Cai, X.; Dong, B.; Lin, S.; Fan, C.; Yang, C. Numerical analysis of arc physical properties in narrow gap. TIG welding. Int. J. Adv. Manuf. Technol. 2020, 106, 5509–5517. [Google Scholar] [CrossRef]
  21. Traidia, A. Multiphysics Modelling and Numerical Simulation of GTA Weld Pools. Ph.D. Thesis, Ecole Polytechnique, Paris, France, 2011. [Google Scholar]
  22. COMSOL Multiphysics Version 5.4 User’s Guide; COMSOL, Inc.: Grenoble, France, 2018.
  23. Yamamoto, K.; Tanaka, M.; Tashiro, S.; Nakata, K.; Murpy, A.B. Numerical Simulation of Metal Vapor Behavior in Argon TIG Welding. Trans. JWRI 2007, 36, 1–4. [Google Scholar]
Figure 1. Computational domain for arc plasma simulation with rod cathode and flat anode.
Metals 11 01416 g001
Figure 2. Application of mesh in arc plasma area.
Metals 11 01416 g002
Figure 3. (a) Density and thermal conductivity of argon gas; (b) Dynamic viscosity and Heat capacity at constant pressure of argon gas; (c) Electrical conductivity and Radiative emission coefficient of argon gas.
Metals 11 01416 g003
Figure 4. Shapes of the obstruction structures between electrodes: (a) Sphere shape; (b) Cylinder shape; (c) Concave shape.
Metals 11 01416 g004
Figure 5. Temperature distribution of arc plasma for the current of (a) 100 A; (b) 150 A.
Metals 11 01416 g005
Figure 6. Velocity distribution of arc plasma for the current of (a) 100 A; (b) 150 A.
Metals 11 01416 g006
Figure 7. Arc pressure change on the anode surface with the different input current.
Metals 11 01416 g007
Figure 8. Temperature distribution of arc plasma according to obstruction structure shape: (a) None type; (b) Sphere shape; (c) Cylinder shape; (d) Concave shape.
Metals 11 01416 g008
Figure 9. Heat flux on the anode according to obstruction structure shape.
Metals 11 01416 g009
Figure 10. Velocity distribution of arc plasma according to obstruction structure shape: (a) None type; (b) Sphere shape; (c) Cylinder shape; (d) Concave shape.
Metals 11 01416 g010
Figure 11. Arc pressure on the anode according to obstruction structure shape.
Metals 11 01416 g011
Table 1. Boundary and initial conditions.
BoundaryEquations [22]
BC
Equilibrium Discharge boundary heat Source (cathode)
n · ( k T ) = Q b (20)
Q b = J e l e c Φ c + J i o n V i o n (21)
J e l e c = if ( | J · n | > J R , J R , | J · n | ) (22)
J R = A R T 2 e x p ( q Φ e f f k B T ) (23)
J i o n = | J · n | J e l e c (24)
Normal current density
n · J = J n (25)
Temperature
T = T 0 (26)
CD
EF
FG
GH
Temperature
T = T 1 (27)
DE
Temperature
T = T 2 (28)
Flow inlet
u = U 0 n (29)
HI
IJ
Flow outlet
[ p I + K ] n = p 1 n (30)
p 1 p 0 (31)
AJ
Equilibrium discharge boundary heat source (anode)
n · ( k T ) = Q b (32)
Q b = | J · n | Φ a (33)
Publisher’s Note: MDPI stays neutral with regard to jurisdictional claims in published maps and institutional affiliations.

