Article

Weld-Quality Prediction Algorithm Based on Multiple Models Using Process Signals in Resistance Spot Welding

Advanced Joining & Additive Manufacturing R&D Department, Korea Institute of Industrial Technology, 156 Gaetbeol-ro, Yeonsu-Gu, Incheon 21999, Korea
*
Author to whom correspondence should be addressed.
Metals 2021, 11(9), 1459; https://doi.org/10.3390/met11091459
Submission received: 5 August 2021 / Revised: 6 September 2021 / Accepted: 13 September 2021 / Published: 15 September 2021
(This article belongs to the Special Issue Quality Assessment and Process Management of Welded Joints)

Abstract

:
An efficient nondestructive testing method of resistance spot weld quality is essential in evaluating the weld quality of all welded joints in the automotive components of a car body production line. This study proposes a quality prediction algorithm for resistance spot welding that can predict the geometrical and physical properties of a spot-welded joint and evaluate weld quality based on quality acceptance criteria. To this end, four statistical models that predict the main geometrical and physical properties of a spot-welded joint, including tensile shear strength, indentation depth, expulsion occurrence, and failure mode, were estimated based on material information, dynamic resistance, and electrode displacement signals. The significance of the estimated models was then verified through an analysis of variance. The prediction accuracies of the models were 94.3%, 93.4%, 97.5%, and 85.0% for the tensile shear strength, indentation depth, expulsion occurrence, and failure modes, respectively. A weld quality evaluation methodology that can predict the properties of a spot-welded joint and evaluate the overall quality requirements based on authorized welding standards was proposed using the four statistical models.

1. Introduction

Resistance spot welding is the main joining method used in the assembly of automobile parts. This technique has the advantage of high productivity compared to other welding processes. As the welded parts used in car bodies directly affect the stiffness and collision safety of the vehicles, it is important to improve the quality and maintain the uniformity of the weld. The tensile shear strength, indentation depth, expulsion occurrence, and failure mode are properties of a welded joint that affect the quality of welded parts [1,2,3,4]. Therefore, a quality inspection of these properties should be performed after the resistance spot welding process. The quality requirements of a welded joint are evaluated either using non-destructive testing (NDT) or destructive testing (DT). NDT is generally performed through visual inspection and ultrasonic inspection of assembly lines [5,6,7]. These NDT methods require an additional inspection process because they involve direct measurement or inspection by an operator. This leads to reduced productivity and requires a considerable amount of time. Quality inspection metrics such as the strength and failure mode of the weld can be evaluated using the DT method [8]. However, DT quality inspection of finished products is not possible because the DT method must be carried out by destroying the finished products. Therefore, technological development is required to address these problems. Currently, quality inspection is performed using an NDT method, such as the analysis of the welding signal measured during the welding process. Although the NDT method based on dynamic resistance, power, current, voltage, and image data has been developed and applied, it is not widely applied in the field because there is a limit to its accuracy and therefore its ability to meet the requirements [5]. In addition, because most of the previous research on the NDT method has focused on inspecting only one or two weld quality metrics, a method that can predict the overall weld quality metrics, including tensile shear strength, indentation depth, expulsion occurrence, and failure mode, is an improvement.
For the development of weld quality prediction technology, research on quality prediction and inspection using electrode displacement of resistance spot welding, dynamic resistance signal, acoustic emission, etc., is being actively conducted. Zhang et al. [9] predicted the tensile shear strength of a spot-welded joint of a mild steel plate with a multiple linear regression model that used parameters extracted from electrode displacement curves with a DA-5 DC transformer displacement transducer to measure the electrode displacement. Yu [10,11] conducted research on a technology that can monitor the weld process and quality of resistance spot welding of automotive steel sheets, including SGACEN, DP980, and CP1180, based on a welding power signal. Hwang et al. [12] carried out research on the prediction of the resistance spot weld quality of a DP780 steel sheet using an adaptive resonance theory artificial neural network. Zhang et al. [13] developed a method to obtain a continuous dynamic reactance signal and conducted a study to predict the tensile shear strength and nugget diameter of a spot-welded joint of an uncoated low-carbon steel sheet by using a radial basis function (RBF) neural network utilizing such a signal. Xia et al. [14] reported a method to quantitatively measure the amount of expulsion occurrence and conducted a study to predict it, using the electrode force and displacement during resistance spot welding of BUSD, BLD, St37-2G, and DP590 steel sheets. Choi et al. [15] conducted a study to predict the tensile shear strength, nugget diameter, and failure mode of a spot-welded joint of 980 MPa grade cold-rolled steel sheets by using a convolutional neural network (CNN) processing heat trace images of the surface appearance of welds. Dejans et al. [16] conducted a study to observe the nugget growth and predict the nugget size of low-carbon steel sheets by monitoring the acoustic emission during resistance spot welding. Kim et al. [17] predicted the indentation depth of a spot-welded joint of SPFC590, SPFC780Y, and SPFC980Y steel sheets based on a regression model using an electrode displacement signal. Although predictive research on each quality metric is being actively conducted, research encompassing all quality metrics, that is, geometrical and physical properties of a spot-welded joint, such as tensile shear strength, indentation depth, expulsion occurrence, and failure mode, is insufficient.
A quality prediction algorithm for the resistance spot welding process that can predict the geometrical and physical properties of a spot-welded joint and evaluate weld quality in accordance with quality acceptance criteria is proposed in this study. For this purpose, four statistical models that predict the main geometrical and physical properties of a spot-welded joint, including the four mentioned above, were estimated based on material information, dynamic resistance, and electrode displacement signals. The significance of the estimated models was verified using an analysis of variance. The prediction accuracies of the models were 94.3%, 93.4%, 97.5%, and 85.0% for the tensile shear strength, indentation depth, expulsion occurrence, and failure modes, respectively. A weld quality evaluation methodology that can predict the properties of a spot-weld joint and judge the overall quality requirements in accordance with authorized welding standards was proposed using the four statistical models.

2. Experiments

2.1. Materials

In this study, 590, 780, and 980 MPa grade uncoated steel sheets and 980 MPa grade galvanized (GI) steel sheets and galvannealed (GA) steel sheets were used. Table 1 presents the material grade, thickness, tensile strength, and yield strength of the test materials. The test coupon was prepared to a size of 100 mm × 30 mm, and the tensile shear test specimen was welded with it with an overlap of 30 mm. A Cu-Cr dome-type electrode (cap tip) with a tip diameter of 6 mm and a tip radius of 40 mm was used, and the upper and lower cap tips were conditioned by making 50 welds prior to the experiment.

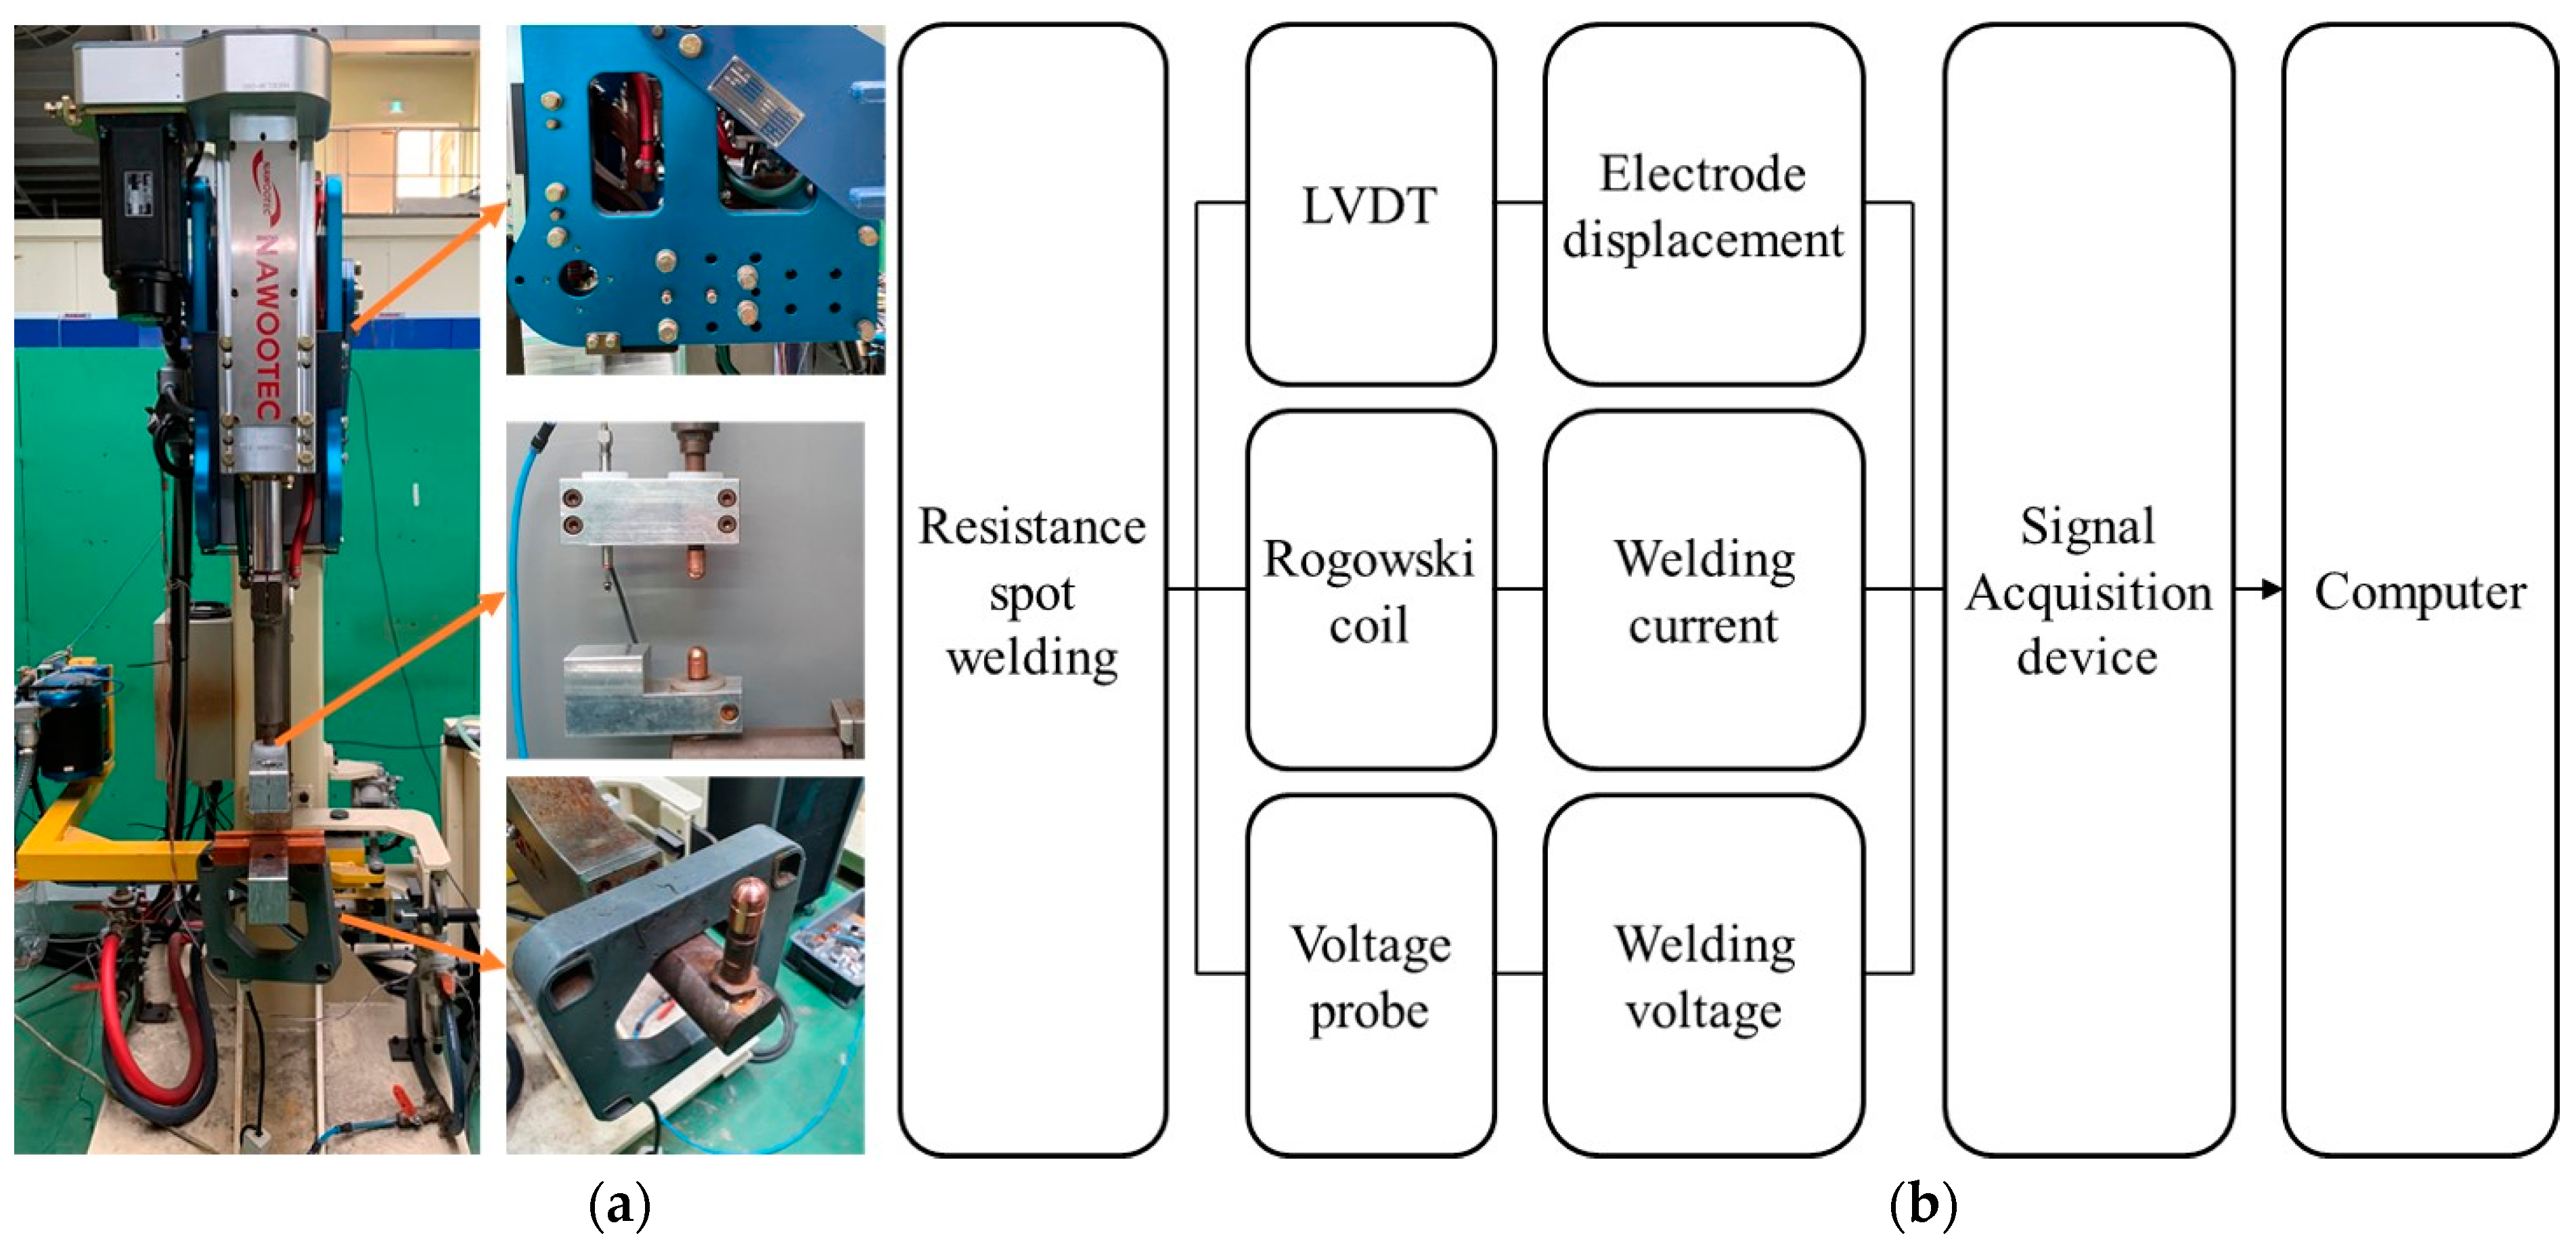
2.2. Experimental Setup

The experiments were carried out with a medium frequency direct current (MFDC) resistance spot welding machine, which has a control frequency of 1.0 kHz and a maximum current of 20.0 kA. The welding gun used in the experiments can be set up with a maximum load of 6.0 kN. The equipment used in the resistance spot welding experiment is shown in Figure 1. A Rogowski coil was used to measure the welding current, and the welding voltage was measured using the NI9229 (NATIONAL INSTRUMENTS Corp., Austin, TX, USA) voltage measurement module of National Instruments. Electrode displacement was measured using a linear variable displacement transducer (LVDT). Figure 1b shows the system through which the welding process signal (electrode displacement, current, and voltage) was received by the computer during the welding process. The LVDT used to measure the electrode displacement performs a pneumatic-type displacement measurement up to 10 mm, and the FP50L (MARPOSS GmbH, Hannover, Germany) product with an error of 2–35 μm depending on the height of the sensor was used. The welding current can be measured from 0–15,000 A, and the welding voltage can be measured from −60 to 60 V. The inverter control frequency of the MFDC inverter RSW machine used in the experiment was 1.0 kHz, and pulse width modulation (PWM) control was performed once every half cycle (0.5 ms). Since the welding signal was measured at a sampling rate of 50 kHz, current, voltage, and dynamic resistance were calculated using 25 data per 0.5 ms from raw data of current and voltage. As welding was performed in constant current control (CCC) mode, the average value algorithm was used to calculate welding current and voltage using 25 current and voltage data per 0.5 ms [18]. The dynamic resistance was calculated by dividing the average voltage by the average current every 0.5 ms, as shown in Equation (1).
R = V I
The electrode displacement was also measured at the same sampling rate as the electrical signal and calculated at the same frequency period to synchronize with the current and voltage signals. The waveforms of the measured electrode displacement and the dynamic resistance signals are shown in Figure 2.

2.3. Experimental Procedure

Experiments were conducted according to changes in the welding current and welding time, which are the main process parameters for resistance spot welding. The experimental conditions are listed in Table 2. Expulsion occurrence was investigated through visual inspection by operators or cross-sectional observation of welds. The indentation depth of the welds was measured using a micrometer as the difference between the base metal thickness and the thickness at the center of the welded joint. The tensile shear strength was measured using a universal testing machine with a maximum load of 5000 kg at a tensile test speed of 10 mm/min. After the tensile test, the failure mode of the welded joint was visually checked by the operators. Figure 3 shows the measured electrical signals, stress–strain curve obtained from a tensile test, indentation depth measurement, cross-sectional image of a spot-welded joint, and failure modes after the tensile shear test.

2.4. Regression Model

2.4.1. Polynomial Regression Model

Regression analysis is a statistical method that describes the functional relationship between a dependent variable and one or more independent variables. In linear regression analysis, a mathematical relationship between a continuous dependent variable and an independent variable is usually derived by assuming that the relationship is linear. However, if the relationship between the dependent variable and the independent variable is not linear, a large error will occur if a linear regression model is used. In addition, because effect modification, where the effect of one variable is changed by another variable, must be considered in the linear regression model, the polynomial regression model was used to estimate the predictive model of the continuous variables, that is, tensile shear strength and indentation depth. The polynomial regression model can be expressed as
y i = β 0 + β 1 x i + β 2 x 2 i + β 3 x 3 i + + β k x m i + e i ,   for   i = 1 , 2 , , n
where m   is the degree of the polynomial, which is also considered the degree of the regression model [19].

2.4.2. Logistic Regression Model

When the dependent variable is a categorical variable, linear regression analysis cannot be applied to deal with discontinuous variables, such as success/failure and good/defective. Logistic regression analysis is a generalized linear regression model used to predict functional relationships between variables by using a discrete dependent variable and one or more independent variables. In this study, a logistic regression model was used to estimate the predictive model of expulsion occurrence and failure mode, which are categorical variables. The logistic regression model can be expressed as
l o g i t ( Y ) = n a t u r a l l o g ( o d d s ) l n ( π 1 π ) = α + β X
Taking the antilog of Equation (3) on both sides, we derive an equation to predict the probability of occurrence of the outcome of interest as follows:
π = P r o b a b i l i t y ( Y = o u t c o m e   o f   i n t e r e s t   | X = x ,   a   s p e c i f i c   v a l u e   o f   X ) = e α + β x 1 + e α + β x
where π is the probability of the outcome of interest or “event”, α is the Y intercept, β is the regression coefficient, and e = 2.71828 is the base of the system of natural log. X can be categorical or continuous, but the dependent variable is always categorical [20].

3. Results and Discussion

3.1. Independent Variables for Regression Models

Figure 4 shows the feature points selected from the electrode displacement and dynamic resistance waveforms for the development of the welding quality prediction models. Three feature points A, B, and C were selected from the electrode displacement waveform, as shown in Figure 4a to express the electrode displacement characteristics based on the electrode force, thermal expansion, and cooling of the weld. To express the characteristics of the dynamic resistance waveform, the average resistance, area under the dynamic resistance waveform, and feature point D were selected, as shown in Figure 4b. Feature point A is the maximum point of the LVDT electrode displacement waveform, feature point B is the displacement point when the welding current is terminated, and feature point C is the displacement point when the holding time ends. It is observed that the electrode displacement rapidly grows to feature point A due to the expansion of the nugget in the initial stage of welding and reaches the maximum displacement value. Figure 5 shows the electrode displacement and dynamic resistance waveforms according to the welding time, and the nugget diameter and indentation depth at welding times 1 to 6 are shown with cross section images. After the beta peak of dynamic resistance, the workpiece stack-up is softened by melting. The area of the molten portion widens, and the displacement gradually decreases to feature point B, which is the welding end point [8,21]. After point B, a sharp decrease in displacement is observed until feature point C, at which the hold time ends due to the cooling and pressurization of the welded part. Point D in the dynamic resistance waveform represents the value of the dynamic resistance corresponding to point B, the end time of welding. Point D has a high correlation with the average value of the dynamic resistance and the area under the dynamic resistance waveform, which are also significant features for predicting weld quality [22,23].
Table 3 lists the 11 independent variables used to estimate the weld quality models. The independent variables include those representing both the material information and feature points, as shown in Figure 4. The presence or absence of coating, the thickness of the material, and the tensile strength of the test material, are basic data about the material and are denoted as x 1 , x 2 , and x 3 . The five independent variables, x 4 ~ x 8 , describe the feature points shown in Figure 4a. The displacement value and time corresponding to point A are denoted as x 4 and x 7 , respectively, and those corresponding to point B are denoted as x 5 and x 8 , respectively. The displacement value at point C is denoted as x 6 , and the time corresponding to point C is excluded from the independent variables because the hold time is fixed at 167 ms. The three independent variables, x 9 ~ x 11 , describe the feature points shown in Figure 4b. The average of the dynamic resistance waveform is represented by x 9 , the area by x 10 , and the dynamic resistance value at point D by x 11 .

3.2. Correlation Analysis

Table 4 presents the results of the correlation analysis between the four dependent variables (expulsion occurrence, failure mode, indentation depth, and tensile shear strength) and 11 independent variables ( x 1 ~ x 11 ). As a small value of the correlation coefficient indicates that the relationship between the two variables is not significant, independent variables with a small correlation coefficient were excluded from estimating the model. For the first case, which is the prediction model for expulsion occurrence, x 1 , x 2 and x 3 had small correlation coefficients and the other independent variables had relatively large correlation coefficients. This may be because the waveforms of both the electrode displacement and dynamic resistance signals rapidly decrease with the occurrence of expulsion [14]. Therefore, expulsion occurrence can be predicted using the independent variables that represent the electrode displacement and dynamic resistance waveforms. For the second case, which is the prediction model for the failure mode, x 2 ,   x 3 ,   x 4 ,   x 6 ,   x 7 ,   x 9 ,   x 10 , and x 11 had relatively large correlation coefficients. For the third case, which is the prediction model for the indentation depth, x 5 , x 6 , x 7 , x 9 , x 10 , and x 11 had relatively large correlation coefficients. In particular, the indentation depth showed the highest correlation with x 6 , indicating the electrode displacement at the end of pressurization by the electrode force, because x 6 indicates the amount of compression of the test materials [20]. The result of this analysis shows that the material properties of the test steel sheets do not significantly affect the indentation depth. For the last case, which is the prediction model for the tensile strength, x 2 , x 3 , x 4 , x 6 , x 7 , x 9 , x 10 , and x 11 had relatively large correlation coefficients. Because the tensile shear strength of the weld is affected by the thickness and strength of the material, a high correlation is shown in x 2 and x 3 . As x 4 and x 6 increase with the increasing welding current while x 7 decreases, they greatly affect the tensile shear strength of the weld [24].

3.3. Estimation of Prediction Models

3.3.1. Prediction Model for Expulsion Occurrence

A logistic regression model was used to estimate the prediction model for expulsion occurrence. The expulsion occurrence prediction model is given by Equation (5). E is the probability of an expulsion occurrence. For the dependent variable, the case wherein expulsion occurred was set to 1, and the case wherein expulsion did not occur was set to 0. The independent variables that were insignificant in the correlation analysis were removed, and the remaining variables ( x 4 x 11 ) were used for the prediction model. The relationship between the independent variables and the dependent variable was estimated using the backward elimination stepwise regression method. The results of the model estimation and coefficient analyses are presented in Table 5. The Hosmer–Lemeshow goodness-of-fit test of the model yielded a result of 0.167, implying that the estimated model is suitable for predicting expulsion occurrence. As a result of the coefficient analysis in Table 5, all p values were less than 0.05, indicating that the estimated model could significantly explain the expulsion occurrence.
E = e X 1 + e X ,   X = 13.54 + 0.0.618 x 5 0.0911 x 6 0.0317 x 7

3.3.2. Prediction Model for Failure Mode

The prediction model for the failure mode was also estimated using a logistic regression model. The failure mode prediction model is shown in Equation (6). F is the probability of the failure mode. As for the dependent variable, the case wherein button failure occurred was set to 1, and the case wherein interfacial failure occurred was set to 0. The independent variables that were insignificant in the correlation analysis were removed, and the remaining variables ( x 2 ,,   x 6 ,     x 7   x 9 ,   x 10 ,   x 11 ) were used for the prediction model. The prediction model was also estimated using the backward elimination stepwise regression method. The results of the model estimation and coefficient analyses are presented in Table 6. The Hosmer–Lemeshow goodness-of-fit test of the model yielded a result of 0.178, indicating the suitability of the estimated model for the failure mode prediction. As all the p values were less than 0.05, the estimated model could significantly explain the failure mode.
F = e X 1 + e X ,   X = 15.22 0.00532 x 5 27.30 x 6

3.3.3. Prediction Model for Indentation Depth

A polynomial regression model was used to estimate the prediction model for indentation depth. The indentation depth prediction model is given by Equation (7). I represents the predicted value of the indentation depth. The dependent variable (indentation depth) was set as a continuous value. The independent variables that were not significant in the correlation analysis were removed and the remaining variables ( x 5 ,   x 6 ,   x 7 ,   x 9 ,   x 10 ,   x 11 ) were used for the prediction model. The prediction model was also estimated using the backward elimination stepwise regression method. Table 7 presents the results of the analysis of variance (ANOVA). The coefficient of determination ( R 2 ) for the estimated model was 93%. The p value of the model was 0.000, indicating that the dependent variable (indentation depth) could be significantly explained by the model.
I = 245 + 5.170 x 5 + 5.833 x 6 + 0.696 x 7 + 1257.000 x 9 + 0.081 x 10 1214.000 x 11   0.008 x 5 2 0.008 x 6 2 0.017 x 5 · x 6 0.005 x 5 · x 7 5.170 x 5 · x 11 0.004 x 6 · x 7 5.486 x 6 · x 9 + 69.000 x 9 2 6.070 x 9 · x 10 + 7.180 x 10 · x 11

3.3.4. Prediction Model for Tensile Shear Strength

The prediction model for the tensile shear strength was also estimated using the backward elimination method of the polynomial regression model. The tensile shear strength prediction model is given by Equation (8). T represents the predicted value of tensile shear strength. The independent variables that were insignificant in the correlation analysis were removed and the remaining variables ( x 2 , x 3 , x 4 , x 6 , x 7 , x 8 , x 9 , x 10 , x 11 ) were used for the prediction model. Table 8 presents the ANOVA results. The coefficient of determination ( R 2 ) of the estimated model was 96.06%. The p value of the model was 0.000, indicating that the estimated model could significantly explain the dependent variable (tensile shear strength).
T = 44.39 + 242.670 x 2 0.229 x 3 0.007 x 4 0.054 x 6 0.021 x 7 14.100 x 9 + 0.007 x 10   5.660 x 11 143.910 x 2 2 0.0002 x 4 2 0.0004 x 6 2 + 69.000 x 9 2 + 0.211 x 2 · x 3 0.047 x 2 · x 6 95.400 x 2 · x 9 0.00004 x 3 · x 7 0.035 x 3 · x 11 + 0.192 x 4 · x 9 + 0.258 x 6 · x 9 + 0.089 x 6 · x 11 0.0001 x 7 · x 10 + 0.217 x 7 · x 11

3.4. Weld Quality Prediction Using Prediction Models

After performing 80 new welds, 80 input variable data were obtained. Table 9 and Table 10, Figure 6a,b show the results of applying each input data to the prediction model obtained in Section 3.3. The prediction results for the expulsion occurrence, failure mode, indentation depth and tensile shear strength were 97.5%, 85.0%, 91.9%, and 94%, respectively. In the expulsion occurrence prediction result, condition positive means that expulsion did not occur and condition negative means that expulsion occurred. In addition, in the failure mode prediction result, the condition positive is interfacial failure and the condition negative is button failure. In both graphs in Figure 5, the x-axis represents the predicted value and the y-axis represents the actual value.

3.5. Weld Quality Evaluation Algorithm

A prediction algorithm for weld quality was developed based on multiple models, namely, the four regression models for quality prediction discussed in Section 3.3. The weld quality was evaluated based on the weld quality specifications, including the welding quality standards [25,26]. Table 11 presents the weld quality criteria used in this study. Figure 7 illustrates a schematic of the weld quality prediction algorithm based on multiple models. This algorithm begins by measuring the welding signals, welding voltage, current, and electrode displacement. Next, the measured signals are processed, and the processed signals, that is, the features in Table 3, are passed on to each of the four models as the input to the model. Each quality prediction model calculates the predicted value of each quality metric, and the predicted value is sent to the quality evaluation part, as depicted in Figure 7. Finally, the quality evaluation part uses the four predicted values to determine the overall weld quality based on the quality criterion in Table 11. In addition, the quality prediction results of the individual quality metrics were managed, enabling detailed quality control as well as overall quality.

4. Conclusions

In this study, a weld quality prediction model was estimated using a polynomial regression model and logistic regression model based on the parameters of the material information and welding process signal (electrode displacement and dynamic resistance) information. The results of this study can be summarized as follows:
(1) Features were extracted from the material information, electrode displacement waveform, and dynamic resistance waveform as inputs to the weld quality prediction models for expulsion occurrence, failure mode, indentation depth, and tensile shear strength. The effects of the features on the outputs of the models were analyzed using a correlation analysis.
(2) The models were estimated through backward elimination using polynomial regression models and logistic regression models, and the prediction accuracies of the models were 94.3%, 93.4%, 97.5%, and 85.0% for the tensile shear strength, indentation depth, expulsion, and failure mode, respectively.
(3) An algorithm for predicting the overall weld quality was developed based on multiple models and weld quality standards.
The results of this study contribute to the knowledge of automation techniques of weld quality inspection. The study findings are expected to be particularly beneficial in the automobile industry because they indicate the feasibility of automatic prediction of the quality of resistance spot welding for tensile shear strength, depth indentation, expulsion occurrence, and failure modes. In the future, we intend to further improve the models by building a database for various materials, thicknesses, and coatings, and by applying machine learning algorithms such as deep neural networks and CNNs.

Author Contributions

Conceptualization, S.K. and J.Y.; methodology, S.K.; software, I.H. and D.-Y.K.; validation, J.Y.; formal analysis, S.K.; investigation, I.H.; writing—original draft preparation, S.K.; writing—review and editing, J.Y. and Y.-M.K; supervision, Y.-M.K. and M.K.; project administration and funding acquisition, J.Y., M.K. and Y.-M.K. All authors have read and agreed to the published version of the manuscript.

Funding

This study has been conducted with the support of the Korea Institute of Industrial Technology as “The dynamic parameter control based smart welding system module development for the complete joint penetration weld (kitech EH-21-0003).

Institutional Review Board Statement

Not applicable.

Informed Consent Statement

Not applicable.

Data Availability Statement

Not applicable.

Conflicts of Interest

The authors declare no conflict of interest.

References

  1. Xinmin, L.; Xiaoyun, Z.; Yansong, Z.; Guanlong, C. Weld quality inspection based on online measured indentation from servo encoder in resistance spot welding. IEEE Trans. Instrum. Meas. 2007, 56, 1501–1505. [Google Scholar] [CrossRef]
  2. Oikawa, H.; Murayama, G.; Hiwatashi, S.; Matsuyama, K. Resistance spot weldability of high strength steel sheets for automobiles and the quality assurance of joints. Weld. World 2007, 51, 7–18. [Google Scholar] [CrossRef]
  3. Zhang, H. Expulsion and its influence on weld quality. Weld. J. N. Y. 1999, 78, 373-s. [Google Scholar]
  4. Varjenja, O.N.P.O.S.; To, P.U.; Naprednega, K.V.; Jekla, F.-M.V.T. Dependence of the fracture mode on the welding variables in the resistance spot welding of ferrite-martensite DP980 advanced high-strength steel. Mater. Tehnol. 2012, 46, 665–671. [Google Scholar]
  5. Evaluation of Non-Destructive Testing Methods for Automatic Quality Checking of Spot Welds. Available online: http://www.diva-portal.org/smash/record.jsf?pid=diva2%3A642618&dswid=4158 (accessed on 15 September 2021).
  6. Blitz, J.; Simpson, G. Ultrasonic Methods of Non-Destructive Testing, 2nd ed.; Springer Science & Business Media: Berlin/Heidelberg, Germany, 1995; p. 5. [Google Scholar]
  7. Zhang, B.; Wei, Z.; Osman, A. An ultrasonic non-destructive testing method for evaluating resistance spot welding quality. In Proceedings of the International Symposium on Structural Health Monitoring and Nondestructive Testing, Saarbruecken, Germany, 4–5 October 2018. [Google Scholar]
  8. Zhang, H.; Senkara, J. Resistance Welding: Fundamentals and Applications, 2nd ed.; CRC Press: Boca Raton, FL, USA, 2012; p. 182. [Google Scholar]
  9. Zhang, P.; Zhang, H.; Chen, J.; Ma, Y. Quality monitoring of resistance spot welding based on electrode displacement characteristics analysis. Front. Mech. Eng. China 2007, 2, 330–335. [Google Scholar] [CrossRef]
  10. Yu, J. Quality estimation of resistance spot weld based on logistic regression analysis of welding power signal. Int. J. Precis. Eng. Manuf. 2015, 16, 2655–2663. [Google Scholar] [CrossRef]
  11. Yu, J. Adaptive resistance spot welding process that reduces the shunting effect for automotive high-strength steels. Metals 2018, 8, 775. [Google Scholar] [CrossRef] [Green Version]
  12. Hwang, I.; Yun, H.; Yoon, J.; Kang, M.; Kim, D.; Kim, Y.-M. Prediction of resistance spot weld quality of 780 MPa grade steel using adaptive resonance theory artificial neural networks. Metals 2018, 8, 453. [Google Scholar] [CrossRef] [Green Version]
  13. Zhang, H.; Hou, Y.; Yang, T.; Zhang, Q.; Zhao, J. Welding quality evaluation of resistance spot welding using the time-varying inductive reactance signal. Meas. Sci. Technol. 2018, 29, 055601. [Google Scholar] [CrossRef]
  14. Xia, Y.-J.; Su, Z.-W.; Li, Y.-B.; Zhou, L.; Shen, Y. Online quantitative evaluation of expulsion in resistance spot welding. J. Manuf. Process. 2019, 46, 34–43. [Google Scholar] [CrossRef]
  15. Choi, S.G.; Hwang, I.; Kim, Y.M.; Kang, B.; Kang, M. Prediction of the Weld Qualities Using Surface Appearance Image in Resistance Spot Welding. Metals 2019, 9, 831. [Google Scholar] [CrossRef] [Green Version]
  16. Dejans, A.; Kurtov, O.; Van Rymenant, P. Acoustic emission as a tool for prediction of nugget diameter in resistance spot welding. J. Manuf. Process. 2021, 62, 7–17. [Google Scholar] [CrossRef]
  17. Kim, S.; Hwang, I.; Kang, M.; Park, J.; Yu, J. Prediction of Indentation Depth of Resistance Spot Welding Using Electrode Displacement Signal. J. Weld. Join. 2021, 39, 314–322. [Google Scholar] [CrossRef]
  18. Su, Z.-W.; Xia, Y.-J.; Shen, Y.; Li, Y.-B. A novel real-time measurement method for dynamic resistance signal in medium frequency DC resistance spot welding. Meas. Sci. Technol. 2020, 31, 055011. [Google Scholar] [CrossRef]
  19. Ostertagová, E. Modelling using Polynomial Regression. Procedia Eng. 2012, 48, 500–506. [Google Scholar] [CrossRef] [Green Version]
  20. Peng, C.-Y.J.; Lee, K.L.; Ingersoll, G.M. An Introduction to Logistic Regression Analysis and Reporting. J. Educ. Res. 2010, 96, 3–14. [Google Scholar] [CrossRef]
  21. Dickinson, D.W.; Franklin, J.E.; Stanya, A. Characterization of spot welding behavior by dynamic electrical parameter monitoring. Weld. J. 1980, 59, 170–176. [Google Scholar]
  22. Wan, X.; Wang, Y.; Zhao, D.; Huang, Y.; Yin, Z. Weld quality monitoring research in small scale resistance spot welding by dynamic resistance and neural network. Measurement 2017, 99, 120–127. [Google Scholar] [CrossRef]
  23. Zhao, D.; Ivanov, M.; Wang, Y.; Du, W. Welding quality evaluation of resistance spot welding based on a hybrid approach. J. Intell. Manuf. 2021, 32, 1819–1832. [Google Scholar] [CrossRef]
  24. Xing, B.; Xiao, Y.; Qin, Q.H. Characteristics of shunting effect in resistance spot welding in mild steel based on electrode displacement. Meas. J. Int. Meas. Confed. 2018, 115, 233–242. [Google Scholar] [CrossRef] [Green Version]
  25. ISO 18595. Resistance Welding—Spot Welding of Aluminium and Aluminium Alloys—Weldability, Welding and Testing, 1st ed.; British Standards Institution (BSI): Geneva, Switzerland, 2007; pp. 11–13. [Google Scholar]
  26. AWS D8.1M. Specification for Automotive Weld Quality—Resistance Spot Welding of Steel; American Welding Society (AWS): Miami, FL, USA, 2013. [Google Scholar]
Figure 1. Experimental setup. (a) Spot welding system including servo gun. (b) Schematic diagram of the monitoring system for the resistance spot welding process.
Metals 11 01459 g001
Figure 2. Waveforms of electrode displacement and dynamic resistance during welding process.
Metals 11 01459 g002
Figure 3. (a) Measured current and voltage signals. (b) Stress–strain curve obtained from a tensile test. (c) Indentation depth measurement. (d) Cross-sectional view of a spot-welded joint. (e) Test specimen after tensile shear test.
Metals 11 01459 g003
Figure 4. Independent variables of (a) electrode displacement and (b) dynamic resistance.
Metals 11 01459 g004
Figure 5. Electrode displacement and dynamic resistance waveforms, and cross section images according to the welding time.
Metals 11 01459 g005
Figure 6. Comparison between the predicted value and the measured value: (a) indentation depth; (b) tensile shear strength.
Metals 11 01459 g006
Figure 7. Flowchart for multiple model-based weld quality prediction technology.
Metals 11 01459 g007
Table 1. Mechanical properties of materials.
Material GradeThickness (mm)Tensile Strength (MPa)Yield Strength (MPa)
SPFC5901.2600512
SPFC780Y1.2807519
SPFC980Y1.21002712
SPFC980Y1.41002712
SPFC980Y1.61002712
SPFC5901.0600512
SGFC980Y1.21000708
SGAFC980Y1.21005715
Table 2. Welding conditions.
ItemCondition
Welding machineMedium-frequency direct current welding machine
Electrode force
(kN)
2.94
Welding current
(kA)
4.0, 5.0, 6.0, 7.0, 8.0
Welding time
(ms)
250, 333, 417
Hold time
(ms)
167
Table 3. Definition of independent variables.
Independent VariableDefinitionIndependent
Variable
DefinitionIndependent
Variable
Definition
x 1 Coating x 2 Thickness x 3 Tensile strength of test materials
x 4 Displacement at A x 5 Displacement at B x 6 Displacement at C
x 7 Welding time at A x 8 Welding time at B x 9 Average of dynamic resistance
x 10 Area of dynamic resistance waveform x 11 Dynamic resistance at D--
Table 4. Result of correlation analysis.
Response
Variable (↓)
x 1 x 2 x 3 x 4 x 5 x 6 x 7 x 8 x 9 x 10 x 11
Expulsion occurrence−0.0450.0390.0190.196−0.6220.783−0.4560.009−0.549−0.385−0.524
Failure mode−0.100−0.266−0.3320.249−0.1370.285−0.3670.071−0.573−0.357−0.548
Indentation
depth
0.249−0.0480.0920.172−0.7600.922−0.4940.097−0.793−0.486−0.748
Tensile shear strength0.1480.2990.4230.463−0.1310.487−0.4040.047−0.631−0.410−0.575
Table 5. Coefficient analysis of expulsion occurrence prediction model.
TermSE Coefficientp ValueVIF
Constant3.1500.000-
x 5 0.01700.00015.14
x 6 0.01910.00015.21
x 7 0.01200.0061.06
Table 6. Coefficient analysis of failure mode prediction model.
TermSE Coefficientp ValueVIF
Constant2.0500.000-
x 5 0.0010.0001.11
x 6 3.8800.0001.11
Table 7. ANOVA of indentation depth prediction model.
Termp Value
constant0.015
x 5 0.000
x 6 0.000
x 7 0.001
x 9 0.004
x 10 0.759
x 11 0.006
x 5 2 0.000
x 6 2 0.000
x 5 · x 6 0.000
x 5 · x 7 0.001
x 5 · x 11 0.000
x 6 · x 7 0.003
x 6 · x 9 0.000
x 9 · x 10 0.006
x 10 · x 11 0.004
Table 8. ANOVA of tensile shear strength prediction model.
Termp Value
constant0.000
x 2 0.000
x 3 0.000
x 4 0.851
x 6 0.004
x 7 0.393
x 9 0.456
x 10 0.183
x 11 0.515
x 2 2 0.000
x 4 2 0.076
x 6 2 0.001
x 9 2 0.000
x 2 · x 3 0.000
x 2 · x 6 0.000
x 2 · x 9 0.000
x 3 · x 7 0.045
x 3 · x 11 0.003
x 4 · x 9 0.000
x 6 · x 9 0.000
x 6 · x 11 0.065
x 7 · x 10 0.002
x 7 · x 11 0.000
Table 9. Confusion matrix of expulsion occurrence prediction result.
Actual ClassPositiveNegative
Predicted Class
Positive180
Negative260
Table 10. Confusion matrix of failure mode prediction result.
Actual ClassPositiveNegative
Predicted Class
Positive182
Negative1050
Table 11. Weld quality criterion according to quality metric.
Quality MetricCriterion
Expulsion (ISO 18595)No expulsion
Failure mode (ISO 18595)Button failure
Indentation depth (AWS D8.1M)Indentation should be less than 30% of the thickness of each outside sheet of the welded joint
Tensile shear strength
(AWS D8.1M)
Material
grade
Thickness (mm)Tensile strength (MPa)Criterion
(kN)
SPFC5901.26005.7
SPFC780Y1.28077.4
SPFC980Y1.210028.8
SPFC980Y1.4100211.1
SPFC980Y1.6100213.5
SPFC5901.06004.3
SGFC980Y1.210008.8
SGAFC980Y1.210058.8
Publisher’s Note: MDPI stays neutral with regard to jurisdictional claims in published maps and institutional affiliations.

