Article

Influence of TiN Inclusions and Segregation on the Delayed Cracking in NM450 Wear-Resistant Steel

1
Key Laboratory of Material Physics, Ministry of Education, School of Physics and Microelectronics, Zhengzhou University, Zhengzhou 450001, China
2
Nanjing Iron & Steel Co., Ltd., Nanjing 210035, China
*
Author to whom correspondence should be addressed.
Metals 2022, 12(1), 21; https://doi.org/10.3390/met12010021
Submission received: 15 November 2021 / Revised: 15 December 2021 / Accepted: 19 December 2021 / Published: 22 December 2021
(This article belongs to the Special Issue Advanced Technology in Microalloyed Steels)

Abstract

:
High-strength, wear-resistant steel often suffers from delayed cracking after flame cutting. Delayed cracking can lead to extremely harmful sudden brittle fracture; therefore, it is necessary to study the formation of delayed cracking in high-strength steel. This work investigated the influence of TiN inclusions and segregation on the delayed cracking in NM450 wear-resistant steel by optical microscopy, scanning electron microscopy, X-ray diffraction, transmission electron microscopy and electron backscattered diffractometer methods. The results indicated that the delayed cracks originated from the segregation zones (SZs) containing multiple high-hardness segregation bands. The tensile strength of the SZ specimens was higher than that of non-segregation zone (NSZ) specimens, while the total elongation and reduction of area of the SZ specimens were relatively lower compared with the NSZ specimens. Therefore, the delayed cracking on the flame cutting surface of the NM450 steel plate was attributed to the existence of SZs that contain a high density of dislocations and considerable micro-sized TiN inclusions.

1. Introduction

With the development of heavy industry, the demand for high-strength steel has increased, and more high-strength steel has been developed [1]. Flame cutting is widely used in cutting steel plates due to its low cost, easy operation, high cutting efficiency and wide range of applicable steel plate thickness [2]. However, high-strength wear-resistant steel often suffers from delayed cracking after flame cutting due to aggregation of residual hydrogen in the steel plate. Delayed cracks, which occur without warning, can lead to sudden brittle fracture, which is extremely harmful. Therefore, it is necessary to study the cause of delayed cracking in high-strength steel. Microstructural constituents can act as hydrogen trapping sites, including grain boundaries, dislocations and inclusion/matrix interfaces, which can induce hydrogen-induced delayed cracking [3,4]. The hydrogen trapping ability of martensite, a typical structure for high-strength steel, is more significant than that of ferrite and pearlite because of the high concentration of solute carbon and the high density of dislocations [5,6]. NM450 wear-resistant steel is a low-alloy, high-strength martensitic steel widely used in the mechanical engineering field because of its low cost and excellent mechanical properties. At present, microalloying elements, such as Ti and Nb, are widely used to improve the strength, toughness and other mechanical properties of low-alloy, high-strength steel [1,7]. However, the improper addition of Ti can lead to the formation of micro-sized TiN inclusions, which easily capture hydrogen atoms and result in hydrogen-induced delayed cracking [4,8]. Wu et al. [9] and Wang et al. [10] studied the fracture mechanisms of TiN inclusions under tensile stress. Delayed cracking in the NM450 steel plate often occurs in the flame cutting surface. Therefore, in this work, delayed cracking was studied by a series of tensile tests performed on the segregation zones (SZs) and non-segregation zones (NSZs) of NM450 steel. The influence of TiN inclusions and segregation on delayed cracking was analyzed in detail.

2. Materials and Methods

The NM450 steel plate was composed of 0.20C-1.28Mn-0.52Si-0.72 (Ni + Cr + Al)-0.17(Nb +Mo + B)-0.014Ti-0.0040N, wt.%. The as-received 20 mm-thick steel plate exhibited a fully martensitic microstructure after 910 °C quenching. Delayed cracks continued to appear on the flame cutting surface of the steel plate for a few days. The microhardness was tested using a digital hardness tester (XHD-2000TMSC; Vickers, Shanghai, China) with a 0.5 kg force on the flame cutting surface along the crack direction. For the mechanical testing, cylindrical specimens were prepared from SZs and NSZs in the matrix. The specimens with a gauge length of 17.5 mm long and a 3.5 mm diameter were prepared according to the GB/T 228.1–2010 standard (China National Standard, China). Room temperature tensile testing was carried out at a speed of 10 mm per minute on a universal tensile testing machine (CMT5105; SANS, Shenzhen, China). In order to accurately prepare the tensile specimens from the SZs and NSZs, the sheet was etched with 10 mL of nitric acid and 90 mL of ethanol until the macroscopic segregation was observed in the thickness direction, and then the samples were cut by an electric spark wire cutting machine followed by further machining into tensile specimens. The flame cutting surface specimen for the optical microscopy (OM; BX51M; OLYMPUS, Tokyo, Japan) was prepared by mechanical polishing and corrosion by a saturated aqueous solution of picric acid at 80 °C. The delayed crack morphology was observed using OM and scanning electron microscopy (SEM; Quanta 250 FEG; FEI, Utah, UT, USA), with standard rough and finish polishing procedures. The size and quantity of TiN inclusions in the SZ and NSZ were analyzed by OM, the number of TiN inclusions in the SZ and the NSZ was 166 and 102, respectively, and both the statistical areas were 45 mm2. Inclusions in the tensile fracture surfaces were analyzed by SEM and an energy dispersive spectrometer (EDS; INCA-ENERGY, Oxford, UK). The microstructure and carbide morphology of the matrix were characterized by transmission electron microscopy (TEM; 2100; JEM, JEOL, Japan). The thin foils used for the TEM were prepared using a double-jet electro-polisher with 10 mL of perchloric acid and 90 mL of ethanol in a mixed solution at –20 °C under a voltage of 20 V. Crystallographic analysis and microstructural characterization of a non-segregation and a segregation band were carried out by a 20 kV field emission scanning electron microscope (FESEM; ZEISS, Oberkochen, Germany) integrated with an electron backscatter diffraction (EBSD) detector with a step of 0.3 μm. HKL Channel 5 software (Oxford, UK) was used for the data acquisition and post-processing. The dislocation density was quantitatively analyzed using X-ray diffraction (XRD; PANalytical, Almelo, Holland) with a Cu-Kα radiation source (λ = 1.5406 Å). The specimens were scanned over the angle range of 40–102°, with a step size of 0.02° and a speed of 1° min−1 after electropolishing.

3. Results and Discussion
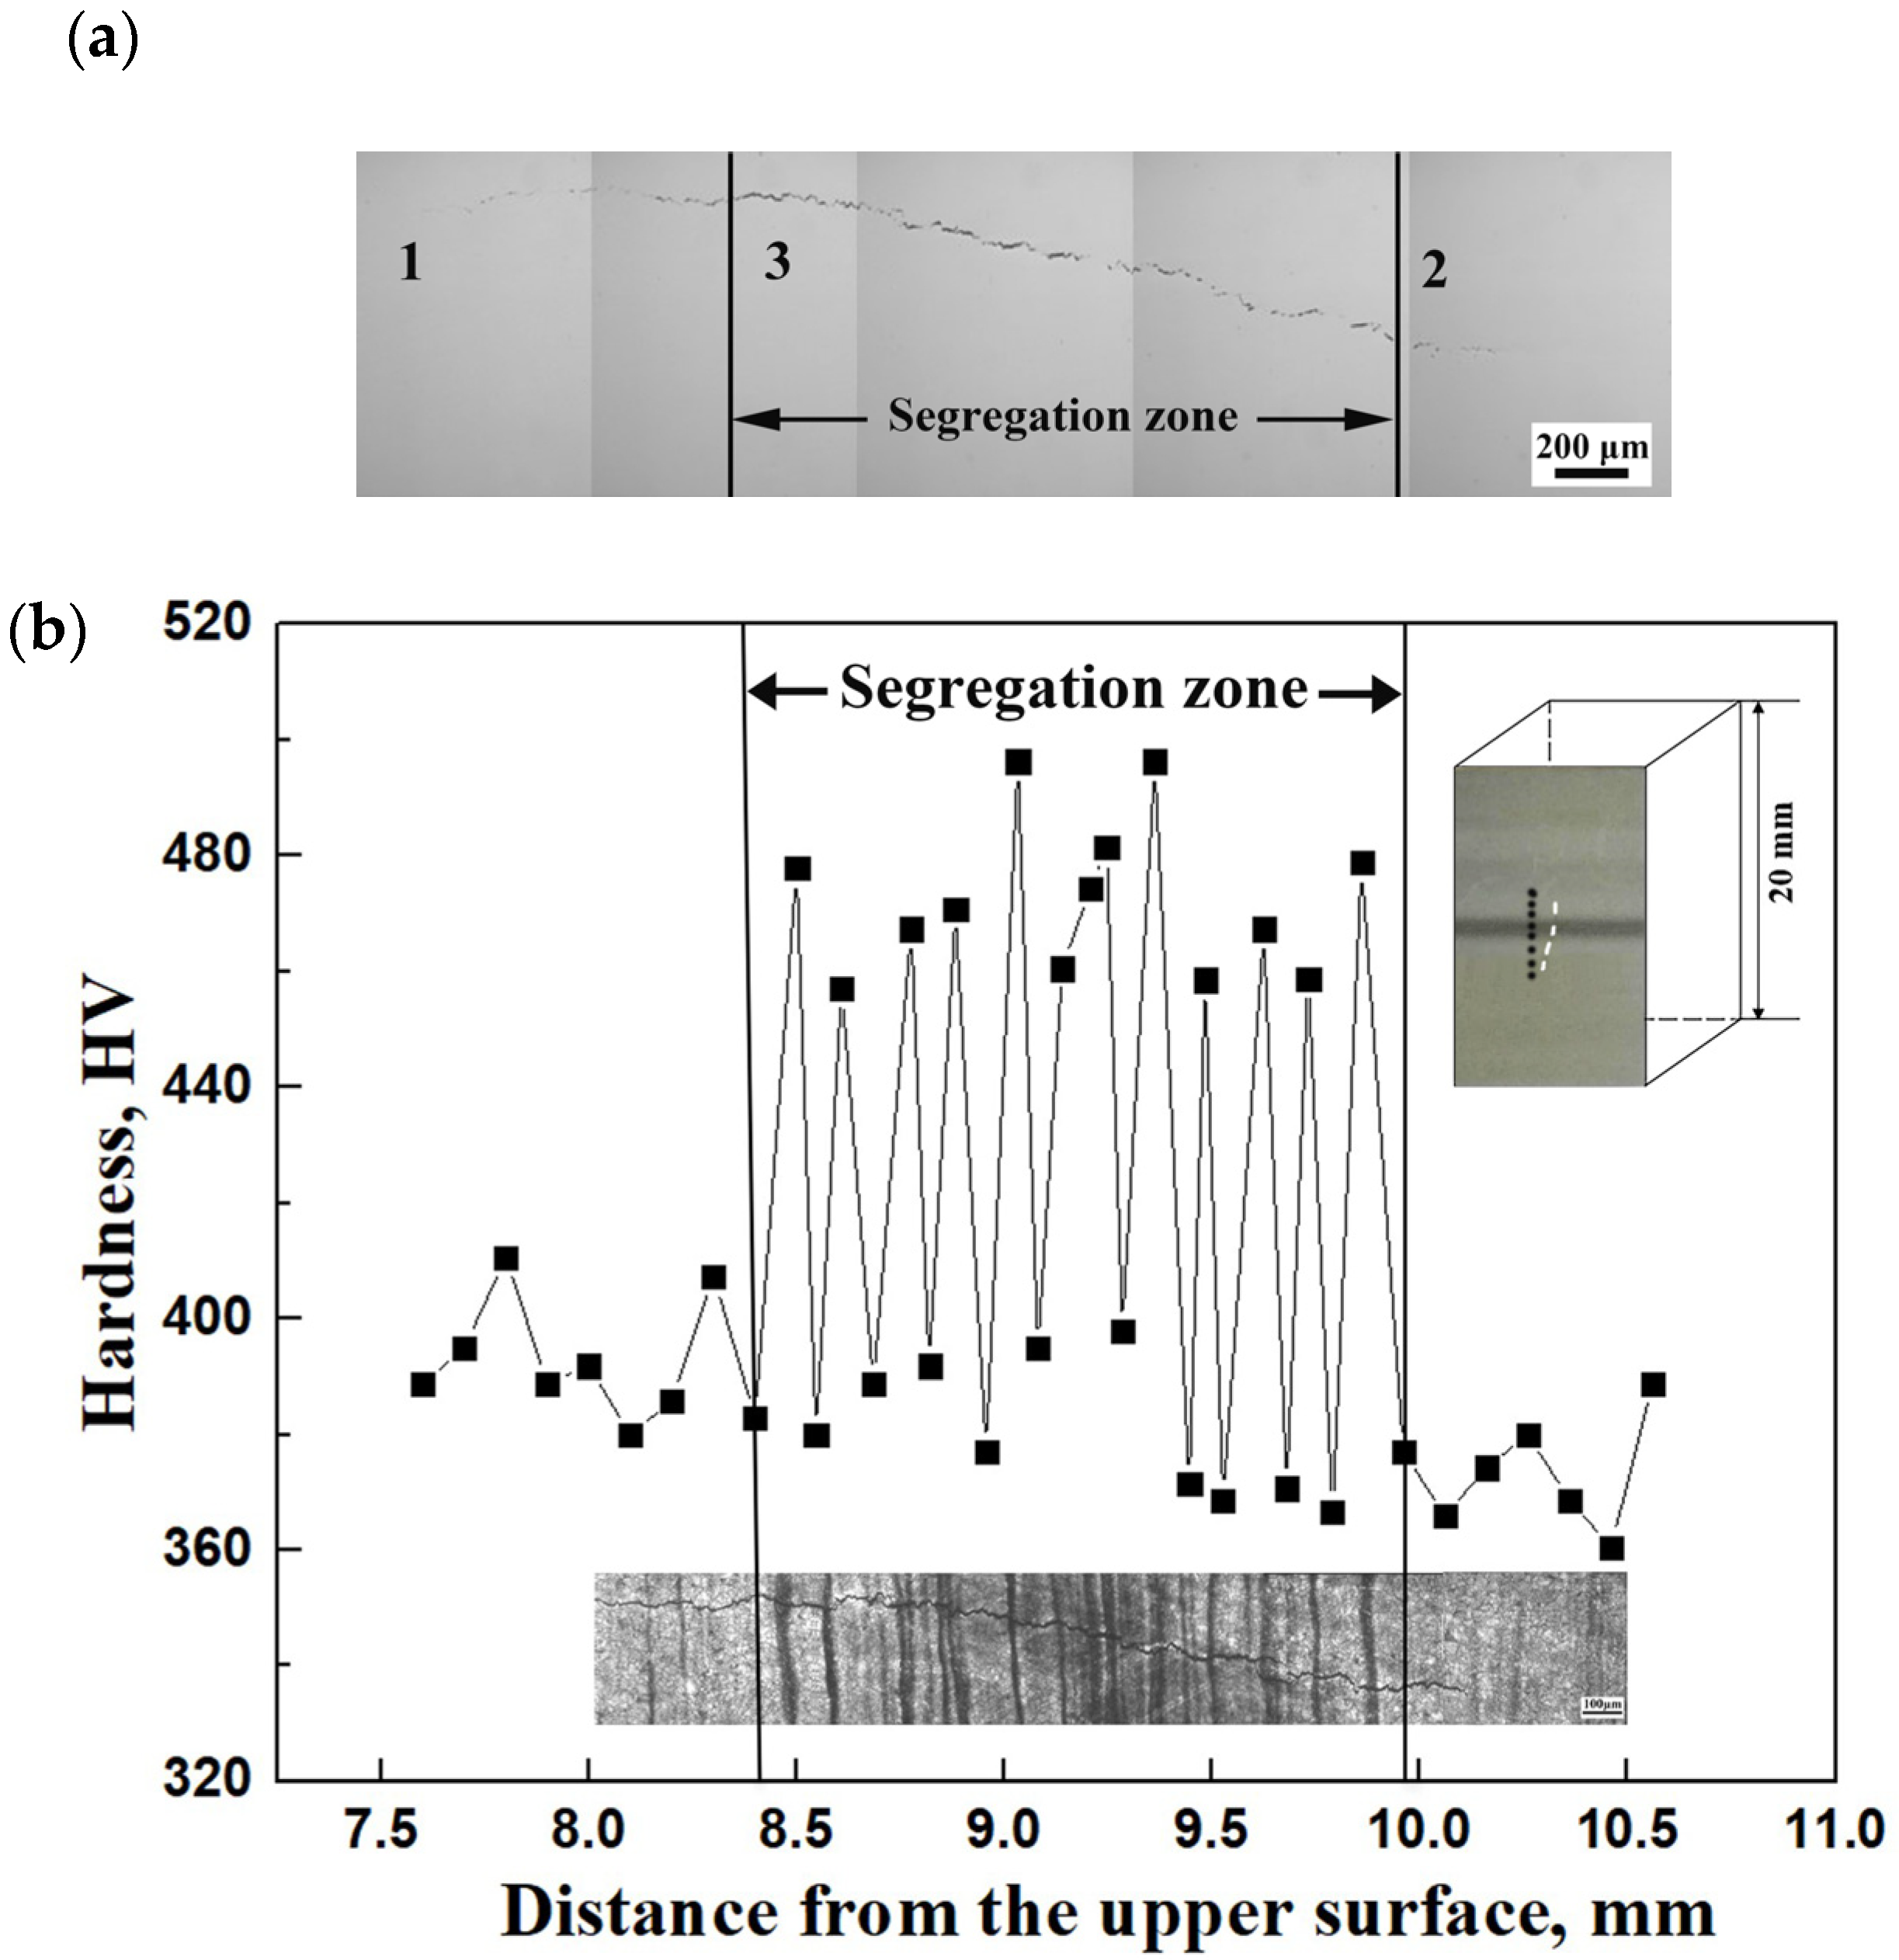
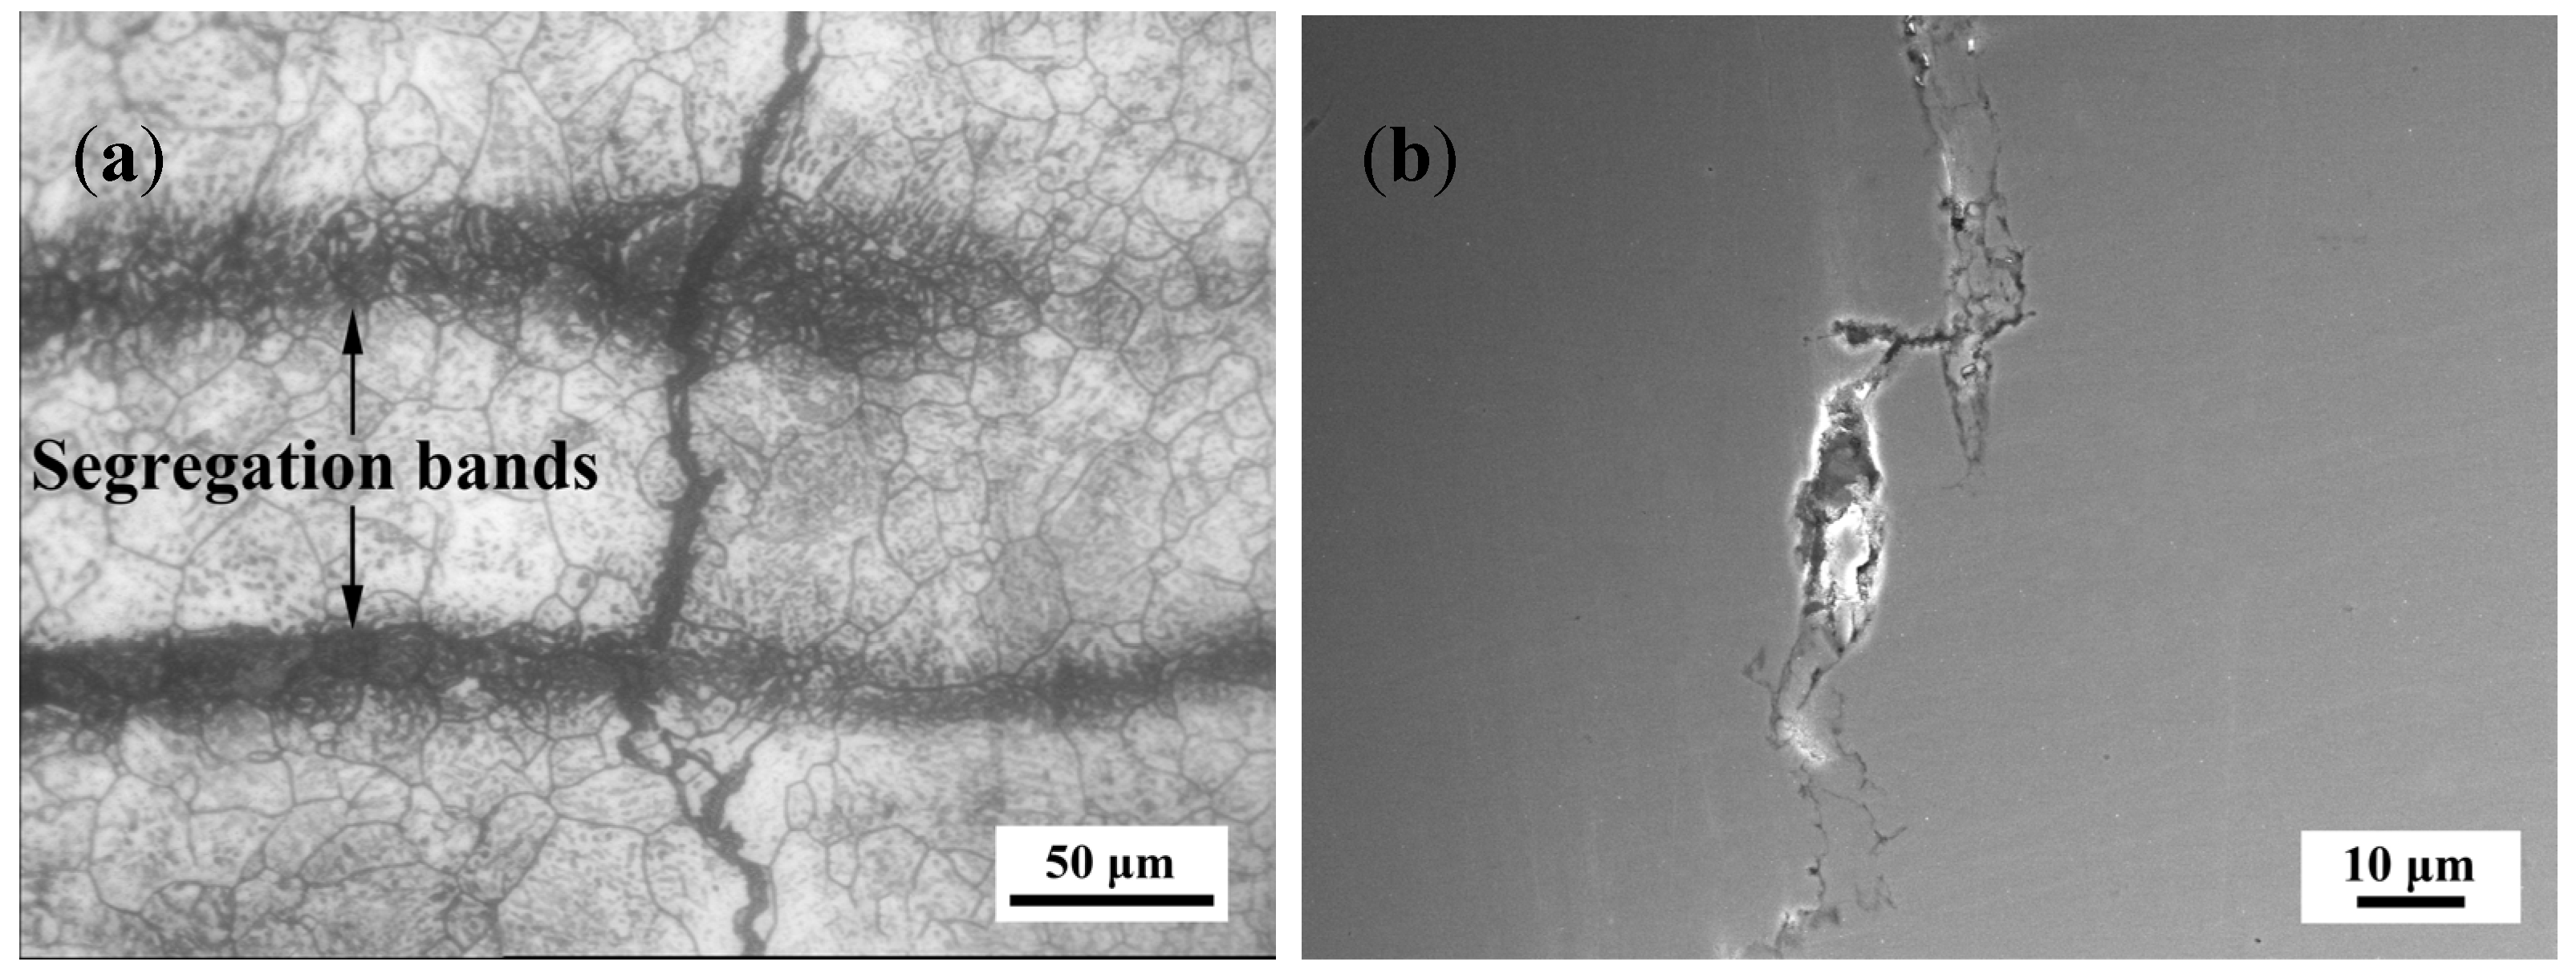
3.1. Crack Analysis

The crack morphology and hardness of an SZ on a flame cutting surface of NM450 steel are shown in Figure 1. Both ends of the crack gradually converge to a stop, indicating that the energy was exhausted in the crack propagation process. The crack at SZ3 (Figure 1a) propagated intermittently, indicating that a re-initiating process occurred under the induction of other factors, such as inclusions and hydrogen induction [11,12]. The cracks ran throughout the whole SZ and extended in both directions from the SZ. Moreover, the crack at SZ3 had a greater opening width, so we speculated that the crack may have originated in the SZ. As seen by OM, the SZ on the flame cutting surface contained multiple black segregation bands. We measured the microhardness of the SZ along the crack direction (Figure 1b). High hardness values corresponded to the black segregation bands, while low hardness points corresponded to the positions between the segregation bands, suggesting that the composition of the black segregation bands was different from the other zone. Segregation bands are caused by the selective crystallization of a steel sheet during the continuous casting process, which enriches the C, Mn, Nb, Ti and other elements in the steel [13,14].
The morphology of a crack on the flame cutting surface is shown in Figure 2. The crack propagation is relatively straight within the high-hardness segregation bands and the opening width of the crack there is larger. Contrastingly, in the low hardness zone between the segregation bands, the crack turns, bifurcates and converges. The expansion of the crack on the flame cutting surface included several stages: (i) crack propagation, (ii) crack convergence and arrest, (iii) crack re-initiation, (iv) crack re-propagation and (v) crack re-arrest. These gradual and delayed processes indicated that the cracks on the flame cutting surface did not form simultaneously [15].

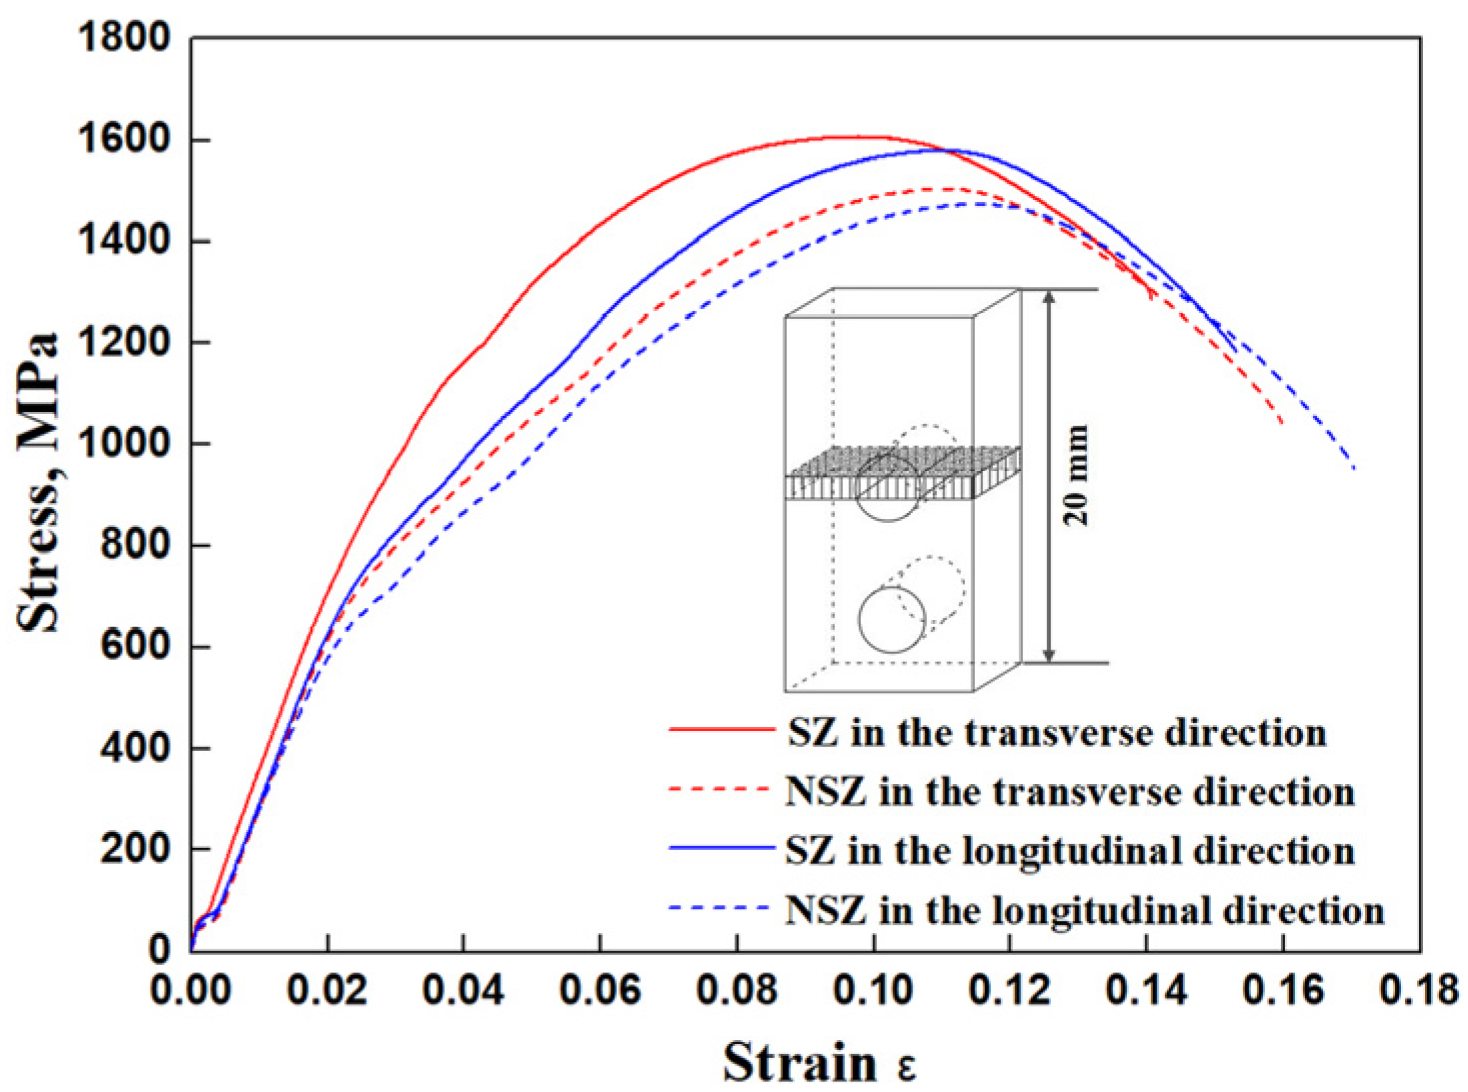
3.2. Tensile Properties
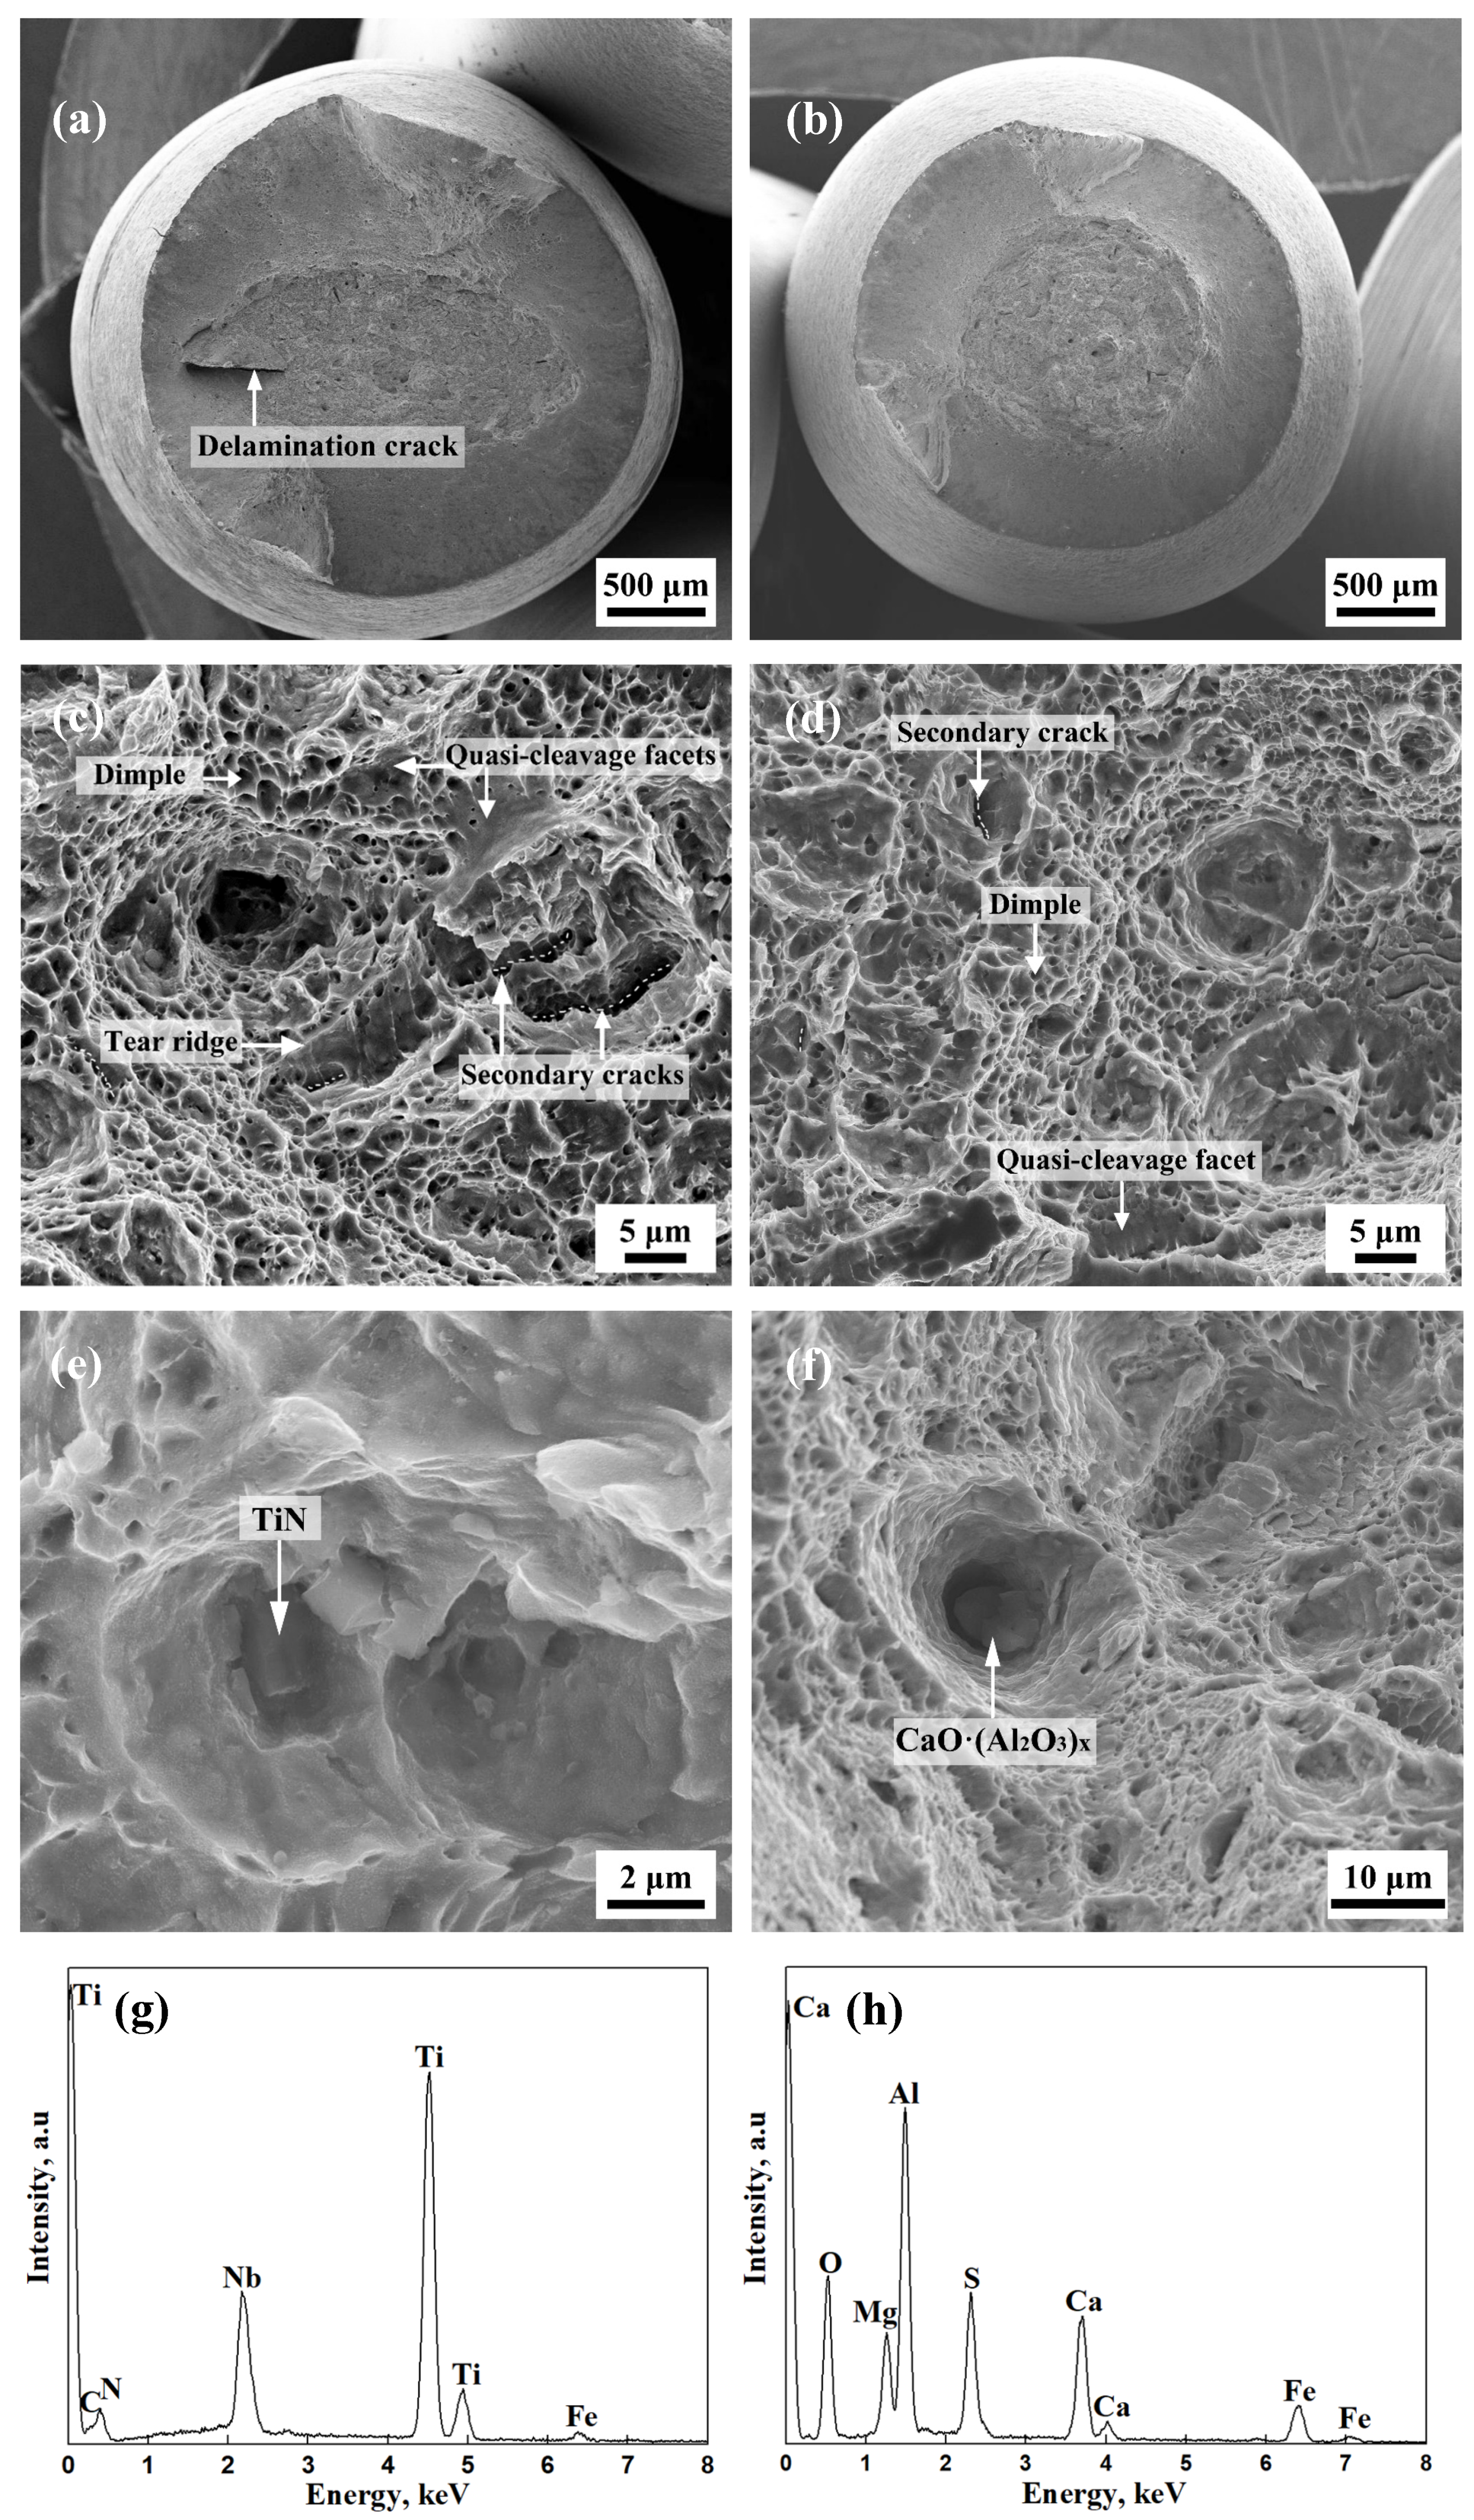
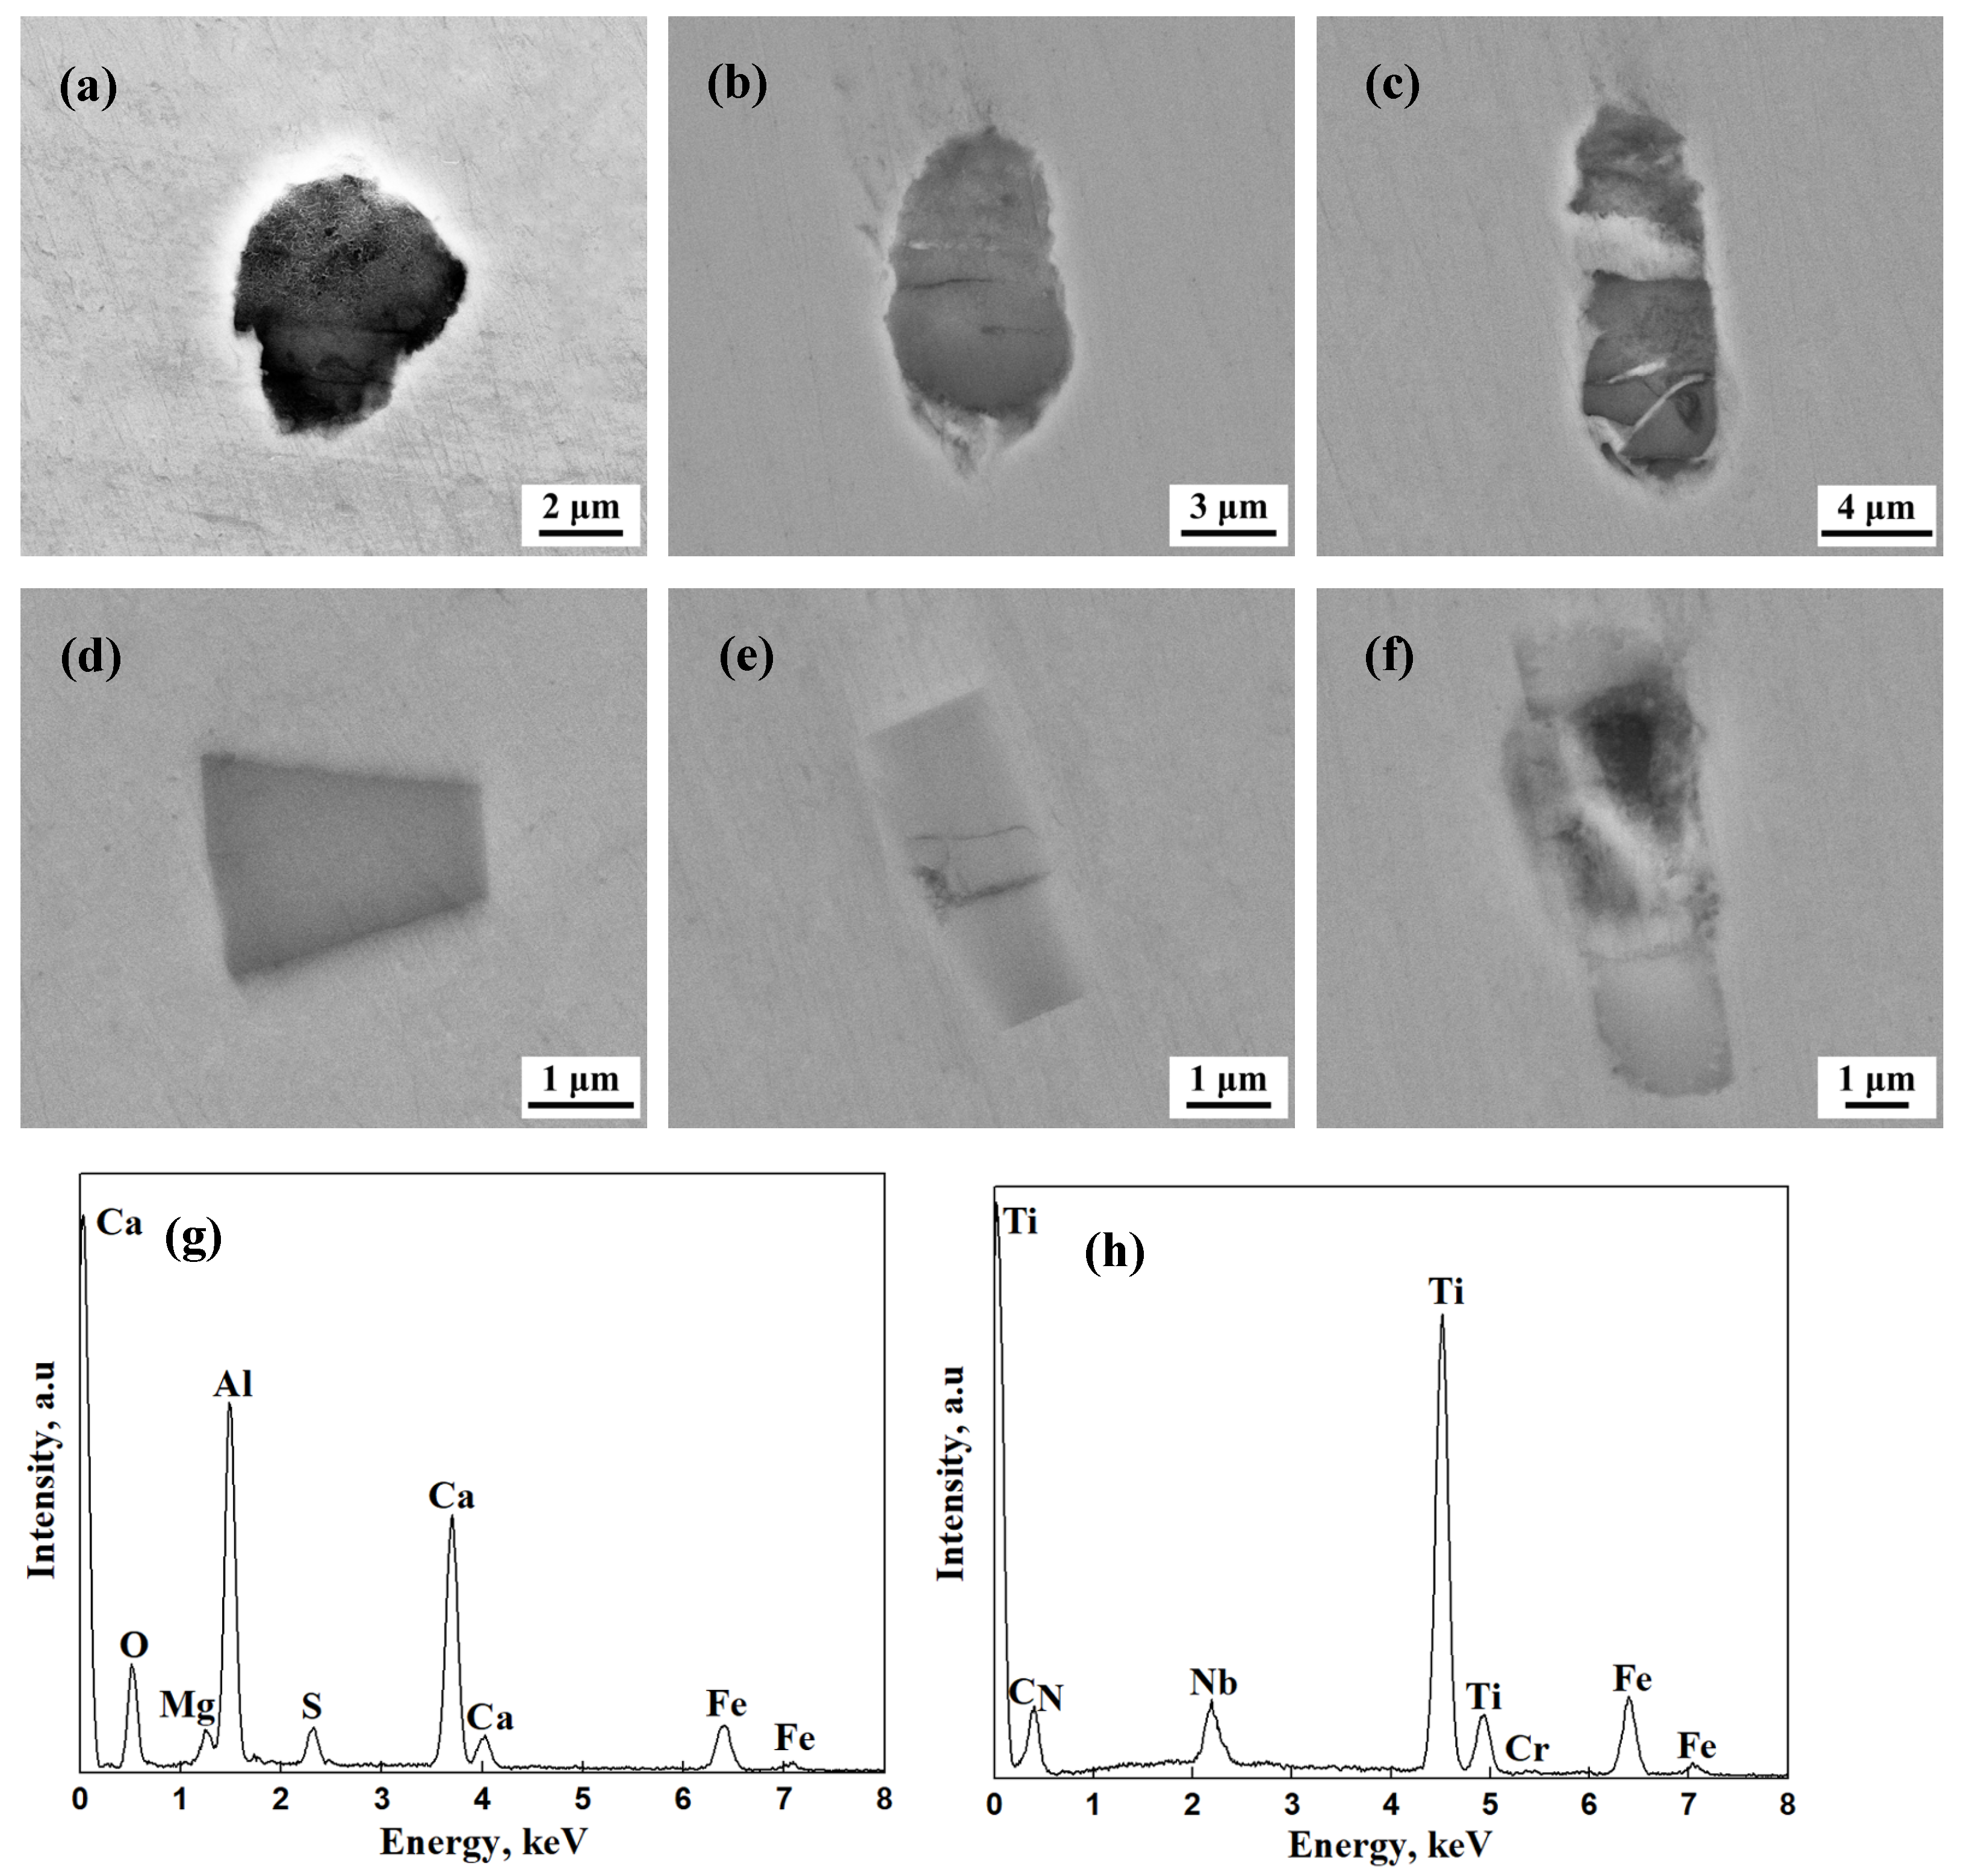
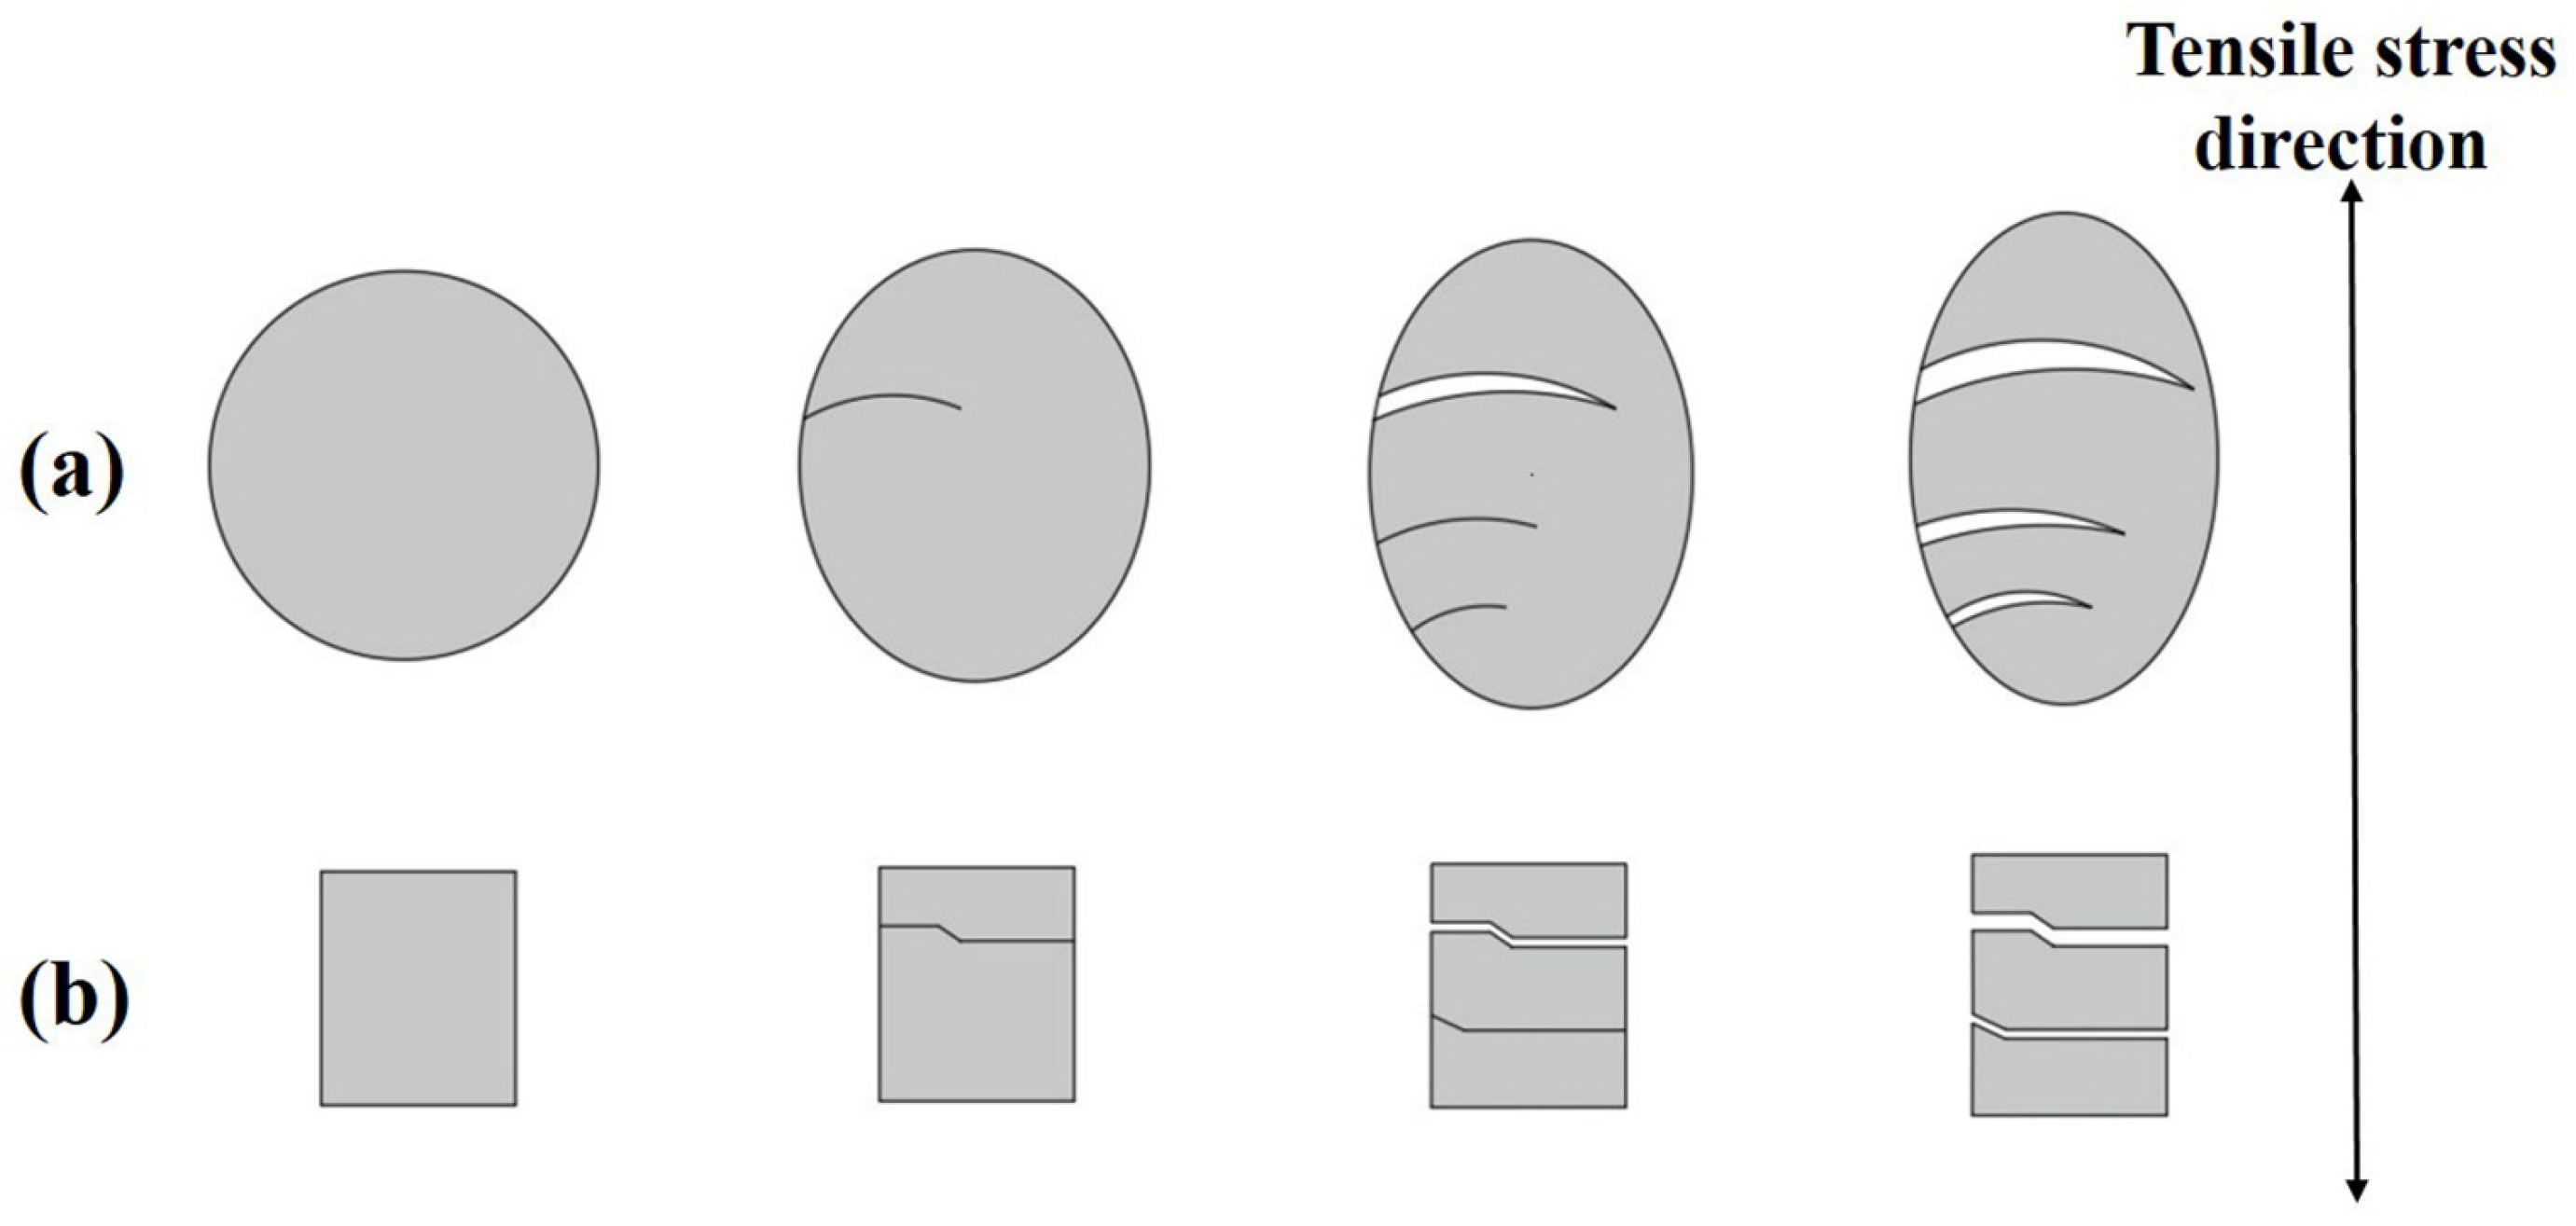
The stress–strain curves are shown in Figure 3. Table 1 shows the tensile properties of all the samples in the transverse and longitudinal directions. Interestingly, the elastic stages of all the tensile curves were similar despite the higher stress of the SZ samples compared to the NSZ samples during plastic deformation. The tensile strength of the SZ samples was higher than that of the NSZ samples, while the total fracture elongation and area reduction were the opposite. This implied that work hardening took place after yielding, and the work hardening rate of the SZ samples was relatively high compared with the NSZ samples due to their relatively higher enrichment of C and Mn elements, which resulted in the relatively higher tensile strengths of the SZ samples.

3.3. Fractography

3.3.1. Fracture Surface

SEM was used to observe the tensile specimen fractures in the longitudinal SZ and NSZ, as shown in Figure 4. The tensile fracture surfaces of the two specimens were both composed of a fiber zone and a shear lip. However, distinct differences in the shapes of the fiber zones were noted: the elliptical shape of the SZ with a long delamination crack (Figure 4a) and the circular shape of the NSZ (Figure 4b). This suggested that the SZ significantly affected the fracture process. The fracture surface was characterized by ductile dimples, tear ridges, a small amount of quasi-cleavage and secondary cracks. A higher percentage of quasi-cleavage and secondary cracks with brittle characteristics on the fracture surface of the SZ specimen was found compared to the NSZ (Figure 4c,d). The regular-shaped inclusions were identified as TiN inclusions containing small amounts of Nb by EDS (Figure 4g) analysis. Nb is a micro-alloyed element which can also bind with N, but its affinity for bonding with N is weaker than Ti [16]. The breakage of TiN inclusions under tensile stress led to brittle quasi-cleavage (Figure 4e). Elliptical CaO·(Al2O3)x inclusions—according to the EDS spectra shown in Figure 4h—were found at the bottom of a large deep dimple (Figure 4f). The impurity of S and Mg existed in the form of CaS and MgO, which partially covered the CaO·(Al2O3)x [17,18]. Due to their high hardness and poor deformability, the brittle quasi-cleavage fracture was caused by ~2 μm TiN inclusions; however, ~10 μm ellipsoidal CaO·(Al2O3)x inclusions caused ductile dimples, indicating that TiN inclusions were more harmful than CaO·(Al2O3)x inclusions. This result is consistent with that reported by Mizobe [19], which showed that the small-size TiN inclusions induce crack initiation more easily than large-size Al2O3 inclusions.

3.3.2. Transverse Section of the Tensile Fracture Surface

A fracture was cut along the central axis, and the morphology of the inclusions at different distances from the fracture surface was observed by SEM, as shown in Figure 5. The most distal CaO·(Al2O3)x inclusion still maintained a spherical shape due to very little tensile stress (Figure 5a). The CaO·(Al2O3)x inclusion slightly closer to the fracture surface, as shown in Figure 5b, was deformed in the direction of the tensile stress, resulting in several cracks. When subjected to large tensile stress, the CaO·(Al2O3)x inclusion near the fracture surface was cracked, and parts of the cracks were widened without obviously forming microcracks on the matrix/inclusion interface perpendicular to the tensile stress (Figure 5c). The majority of the microcracks did not extend throughout the entire width of the CaO·(Al2O3)x, indicating the good deformability of the CaO·(Al2O3)x. The TiN inclusion most distal from the fracture surface retained its original regular morphology due to low tensile stress (Figure 5d). Slightly closer to the fracture, microcracks with different widths appeared in the TiN inclusion (Figure 5e). Near the fracture surface, many microcracks in the TiN inclusion were further widened and eventually formed holes due to the high tensile stress. They were accompanied by the formation of microcracks in the matrix/inclusion (Figure 5f). All the microcracks in the TiN inclusion extended throughout the entire width of the TiN inclusion and were accompanied by microcracks in the matrix/TiN interface due to the brittleness and hardness of the TiN. The most well-developed fractures were in the TiN and CaO·(Al2O3)x inclusions closest to the fracture surface. The changes in the CaO·(Al2O3)x inclusions with increasing tensile stress could be divided into three steps, as shown in Figure 6a: (i) microcracks formed in the CaO·(Al2O3)x inclusions were accompanied by deformation in the tensile stress direction, (ii) multiple microcracks formed and some widened with further deformation and (iii) the microcracks continued to widen along with matrix and inclusion deformation without obvious microcracks forming in the matrix/inclusion interface. The changes in the TiN inclusions with increasing tensile stress could be divided into three steps, as shown in Figure 6b: (i) microcracks formed in the TiN inclusions, (ii) multiple microcracks formed and some widened and (iii) TiN inclusions formed a hole and were accompanied by obvious microcracks in the matrix/inclusion interface. These results demonstrated that under tensile stress, the regular-shaped TiN inclusions with high hardness and poor deformability were broken, and microcracks formed in the matrix/TiN interface, which induced brittle quasi-cleavage fracture. The circular and deformable CaO·(Al2O3)x inclusions with fewer matrix/inclusion interface microcracks caused deep ductile dimples.

3.4. Microstructure

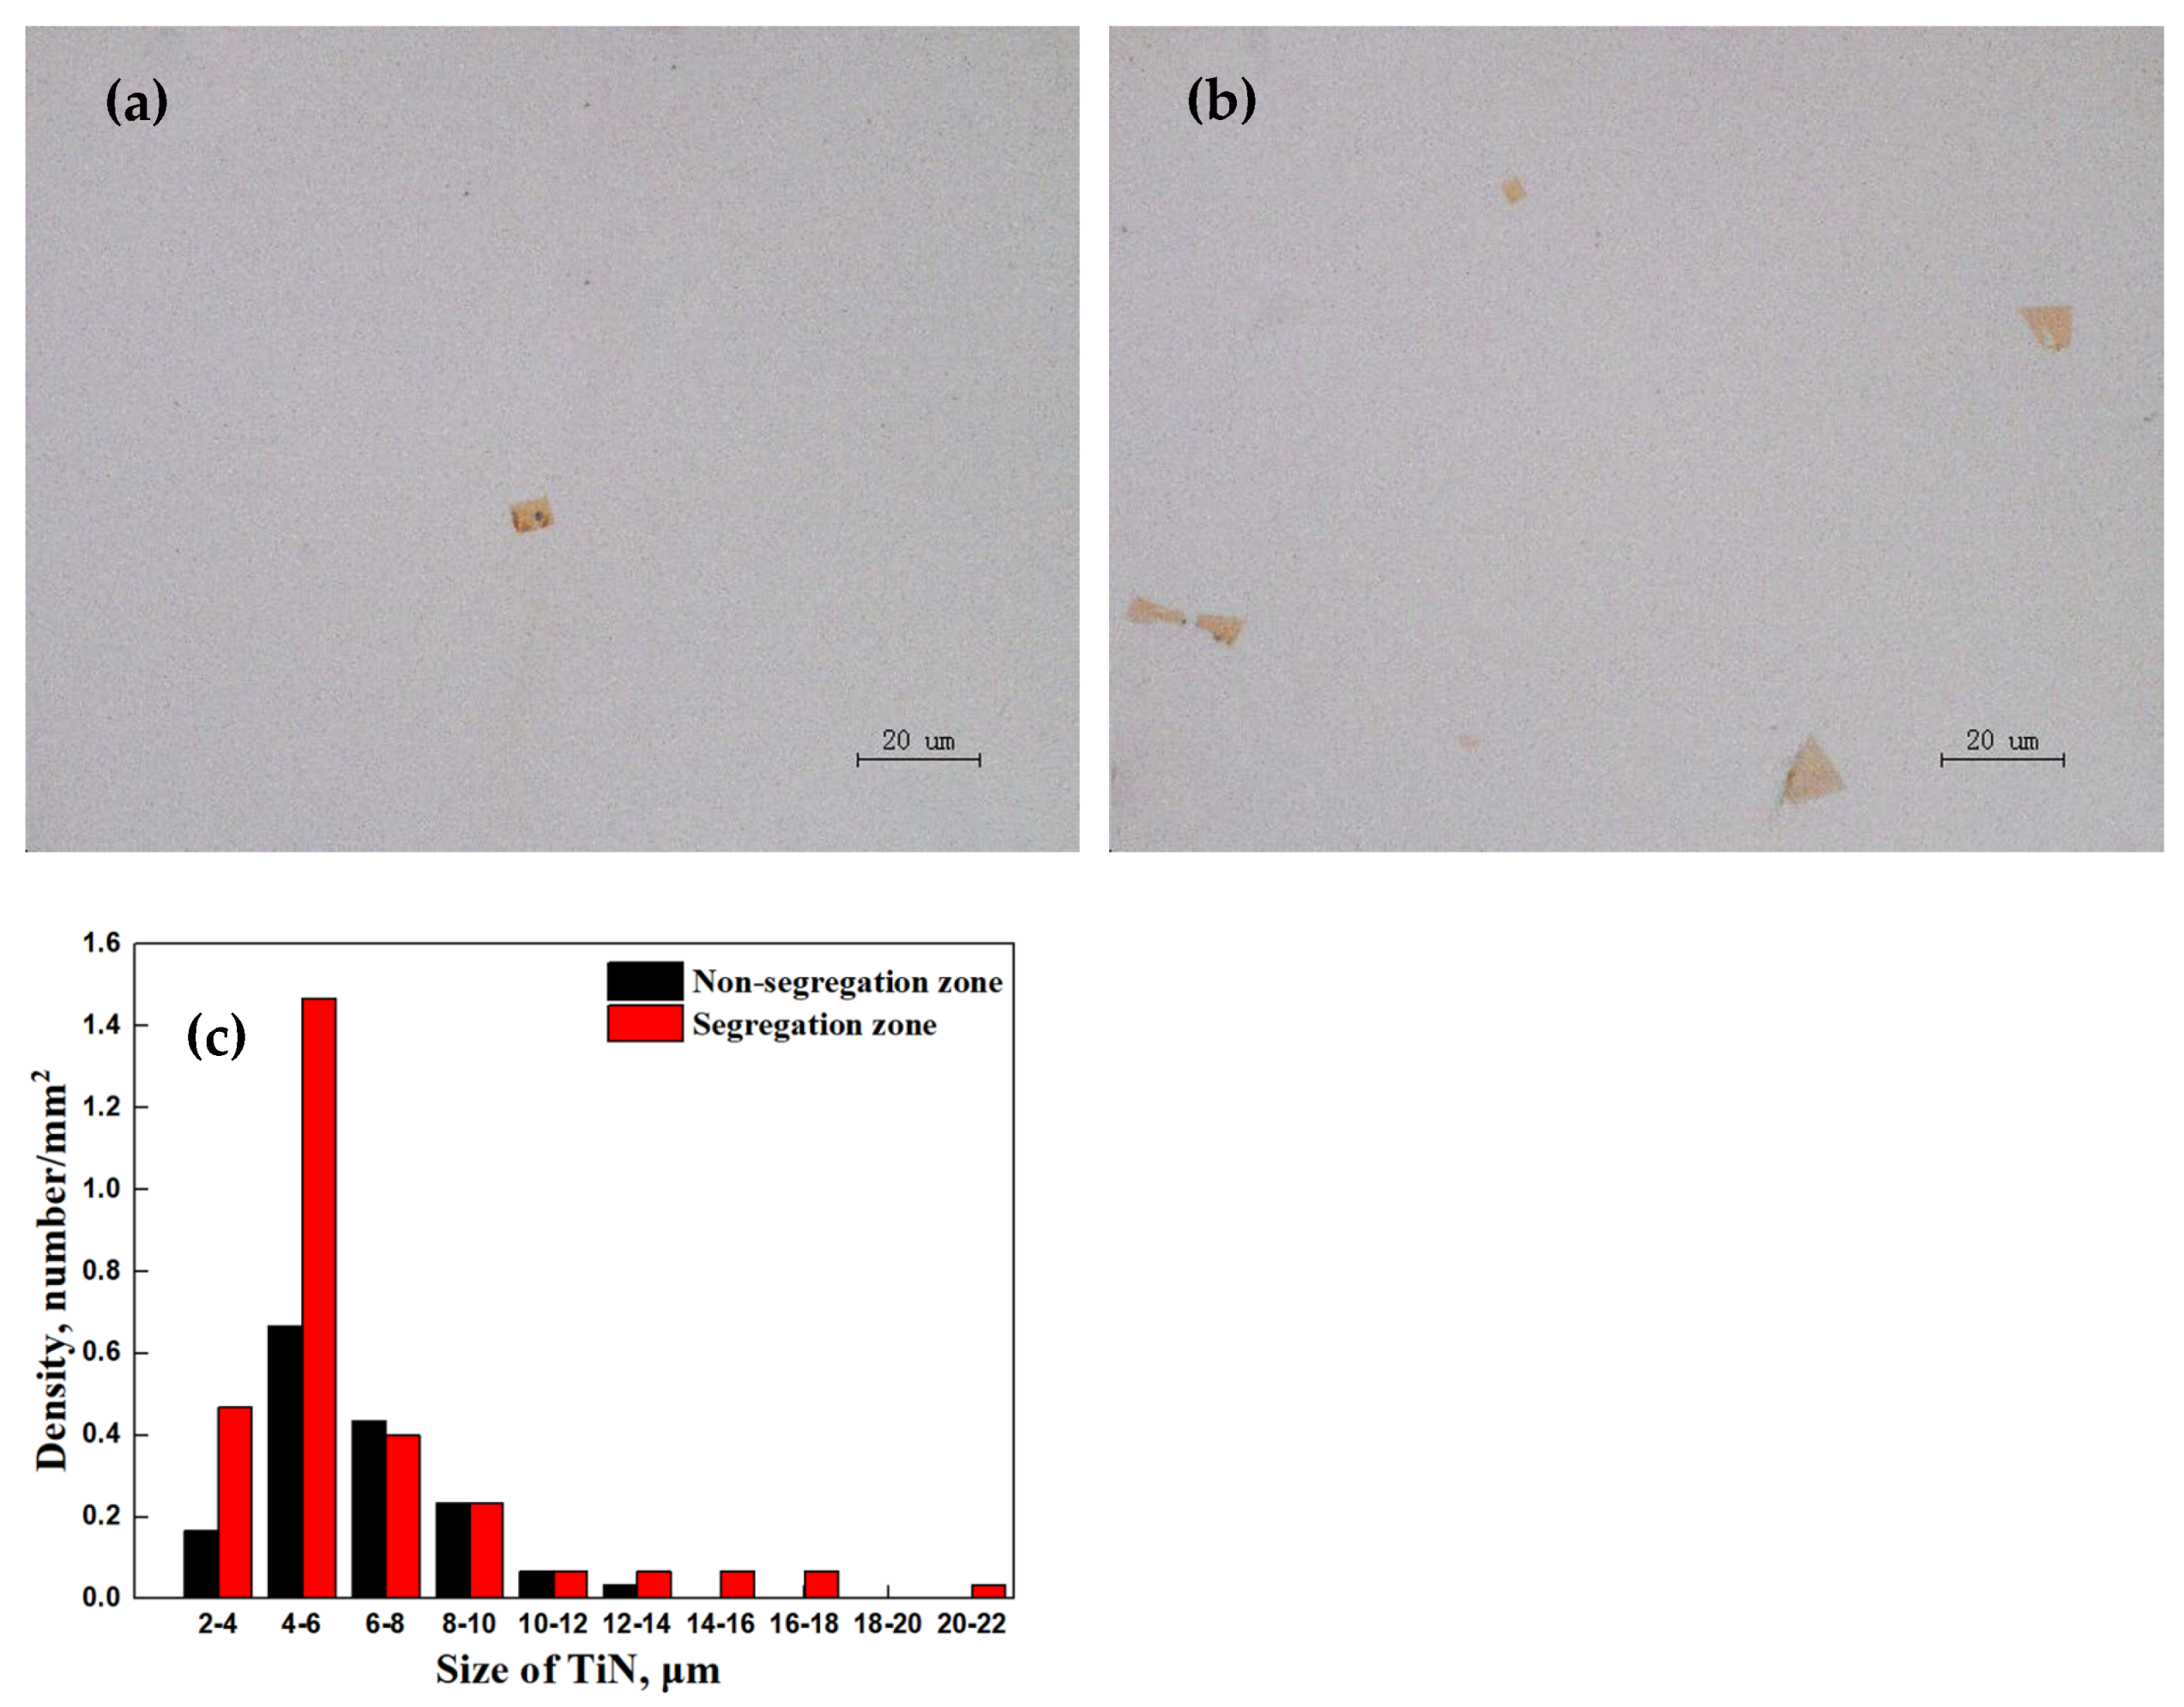
3.4.1. Distribution of TiN Inclusions

Figure 7 illustrates the size distribution of the TiN inclusions in the SZ and NSZ. There were more TiN inclusions in the SZ than the NSZ, and the average sizes of the TiN inclusions in the SZ and the NSZ were 6.36 and 6.06 μm, respectively. The maximum sizes of the TiN inclusions in the SZ and NSZ were 21 and 13.3 μm, respectively. The greater size and number of TiN inclusions were related to the greater number of quasi-cleavage fractures observed in the SZ compared to the NSZ. This was also related to the lower total fracture elongation and reduction of the area observed in the SZ compared with the NSZ. This is consistent with previous research on high-density and large brittle TiN inclusions that can easily initiate cleavage fractures [20,21].

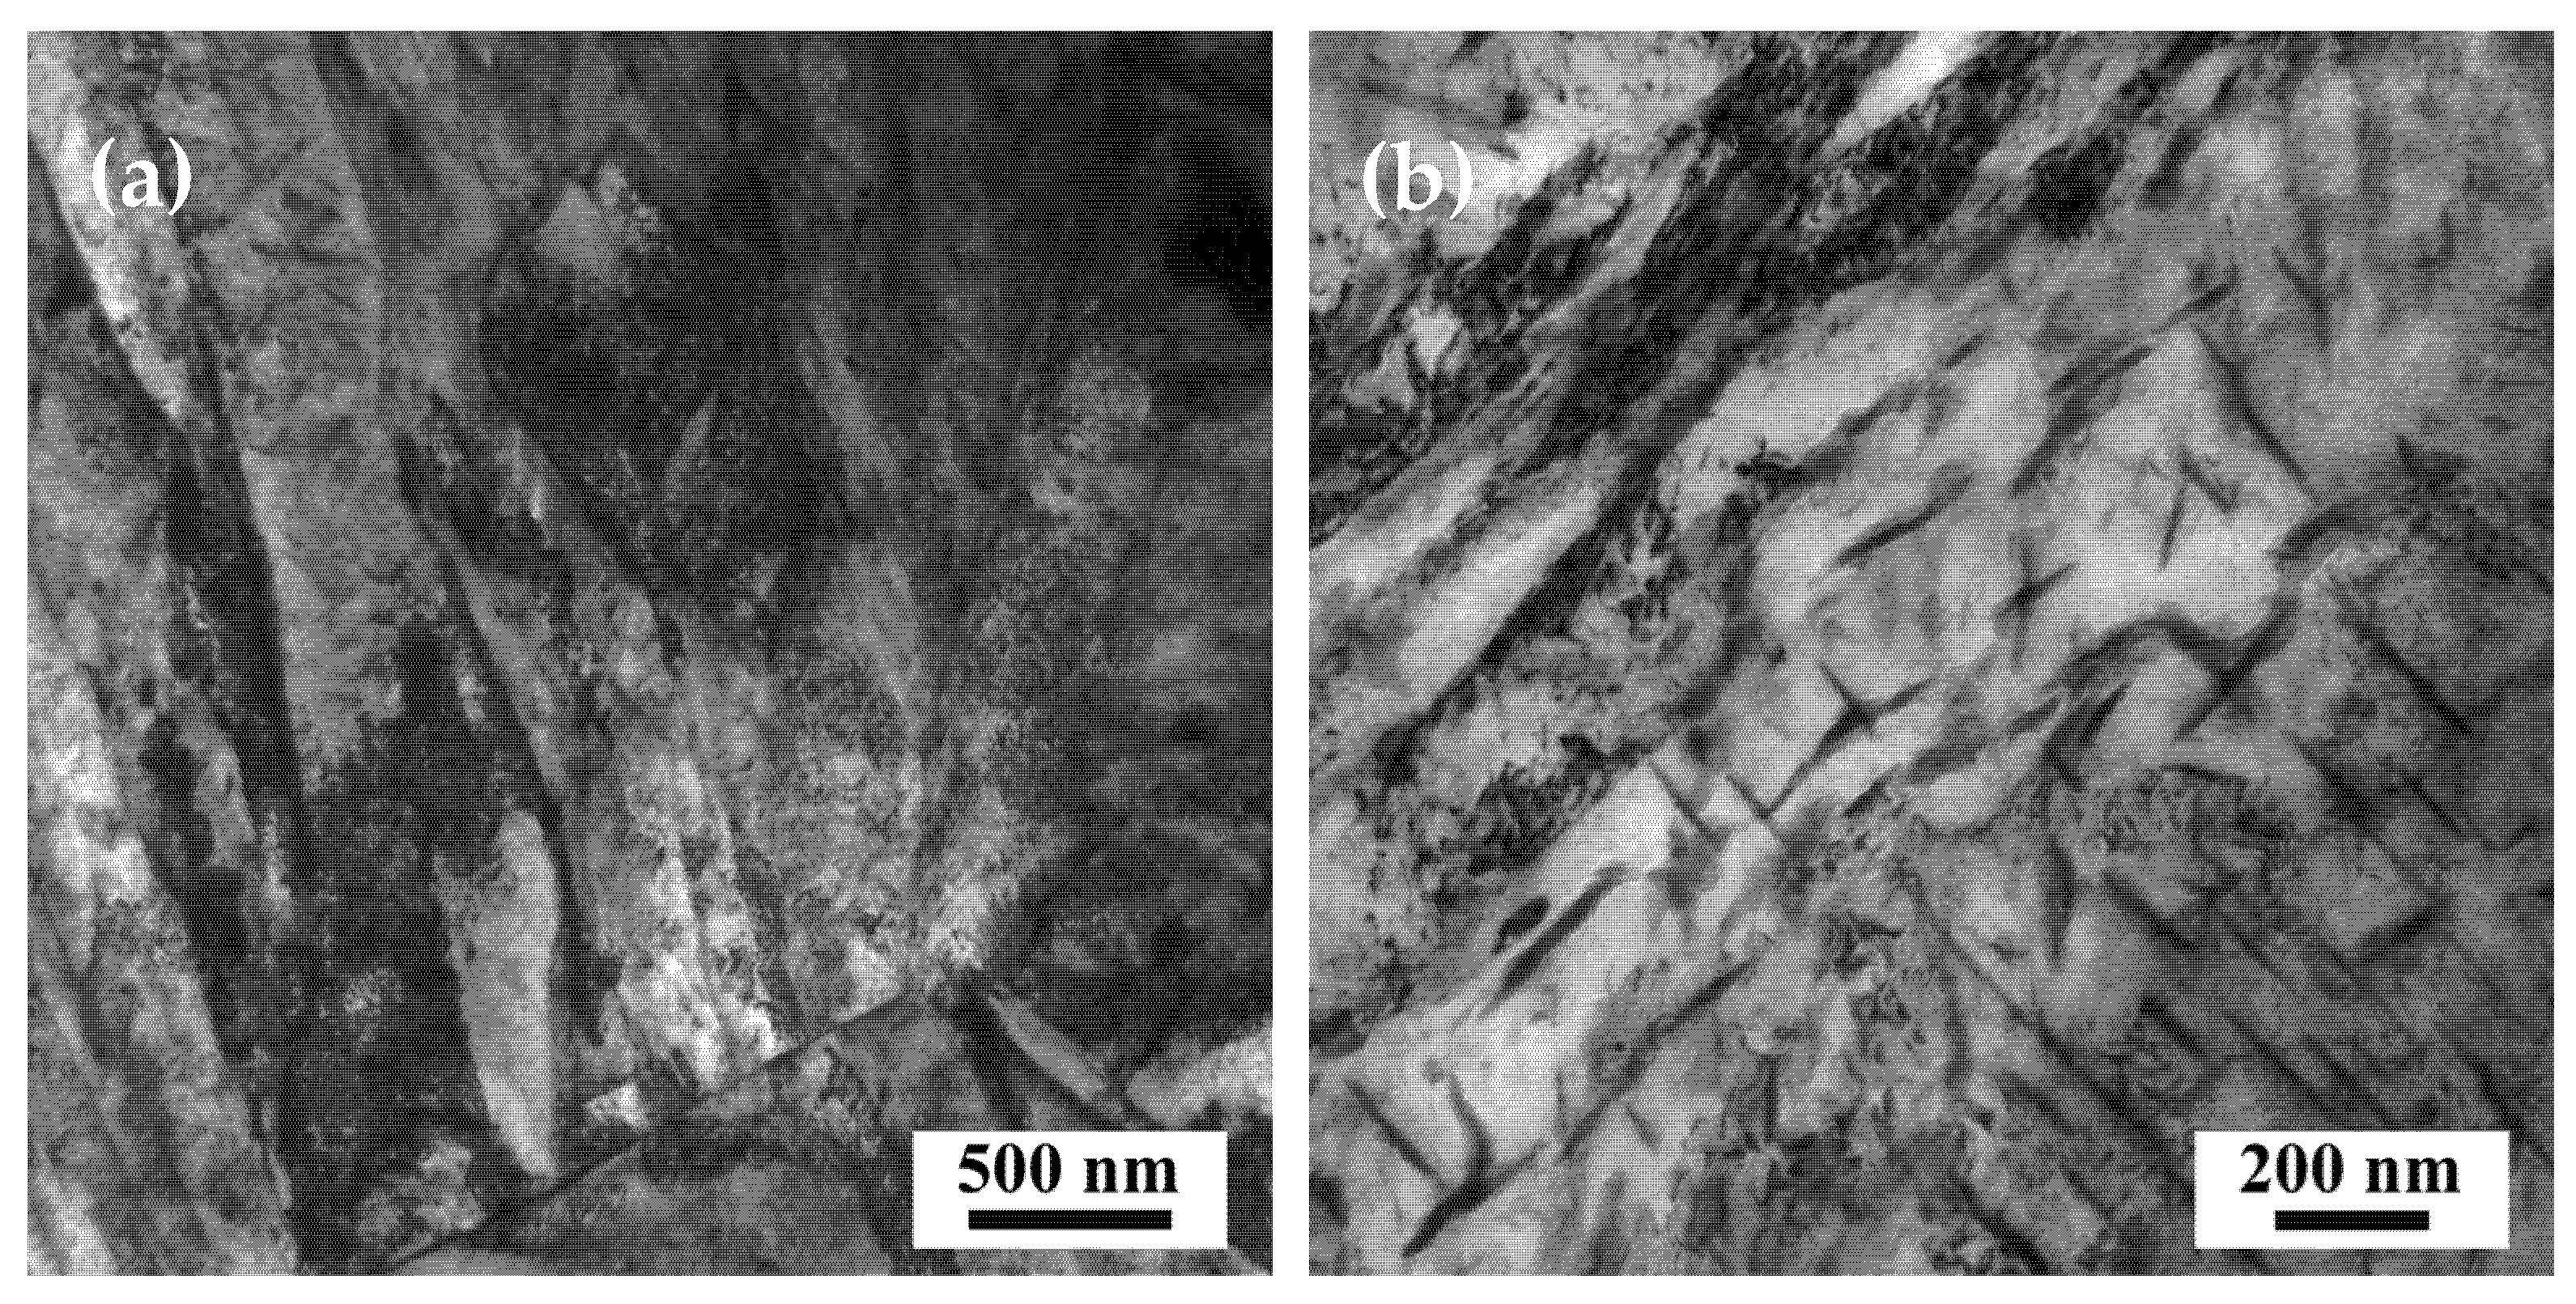
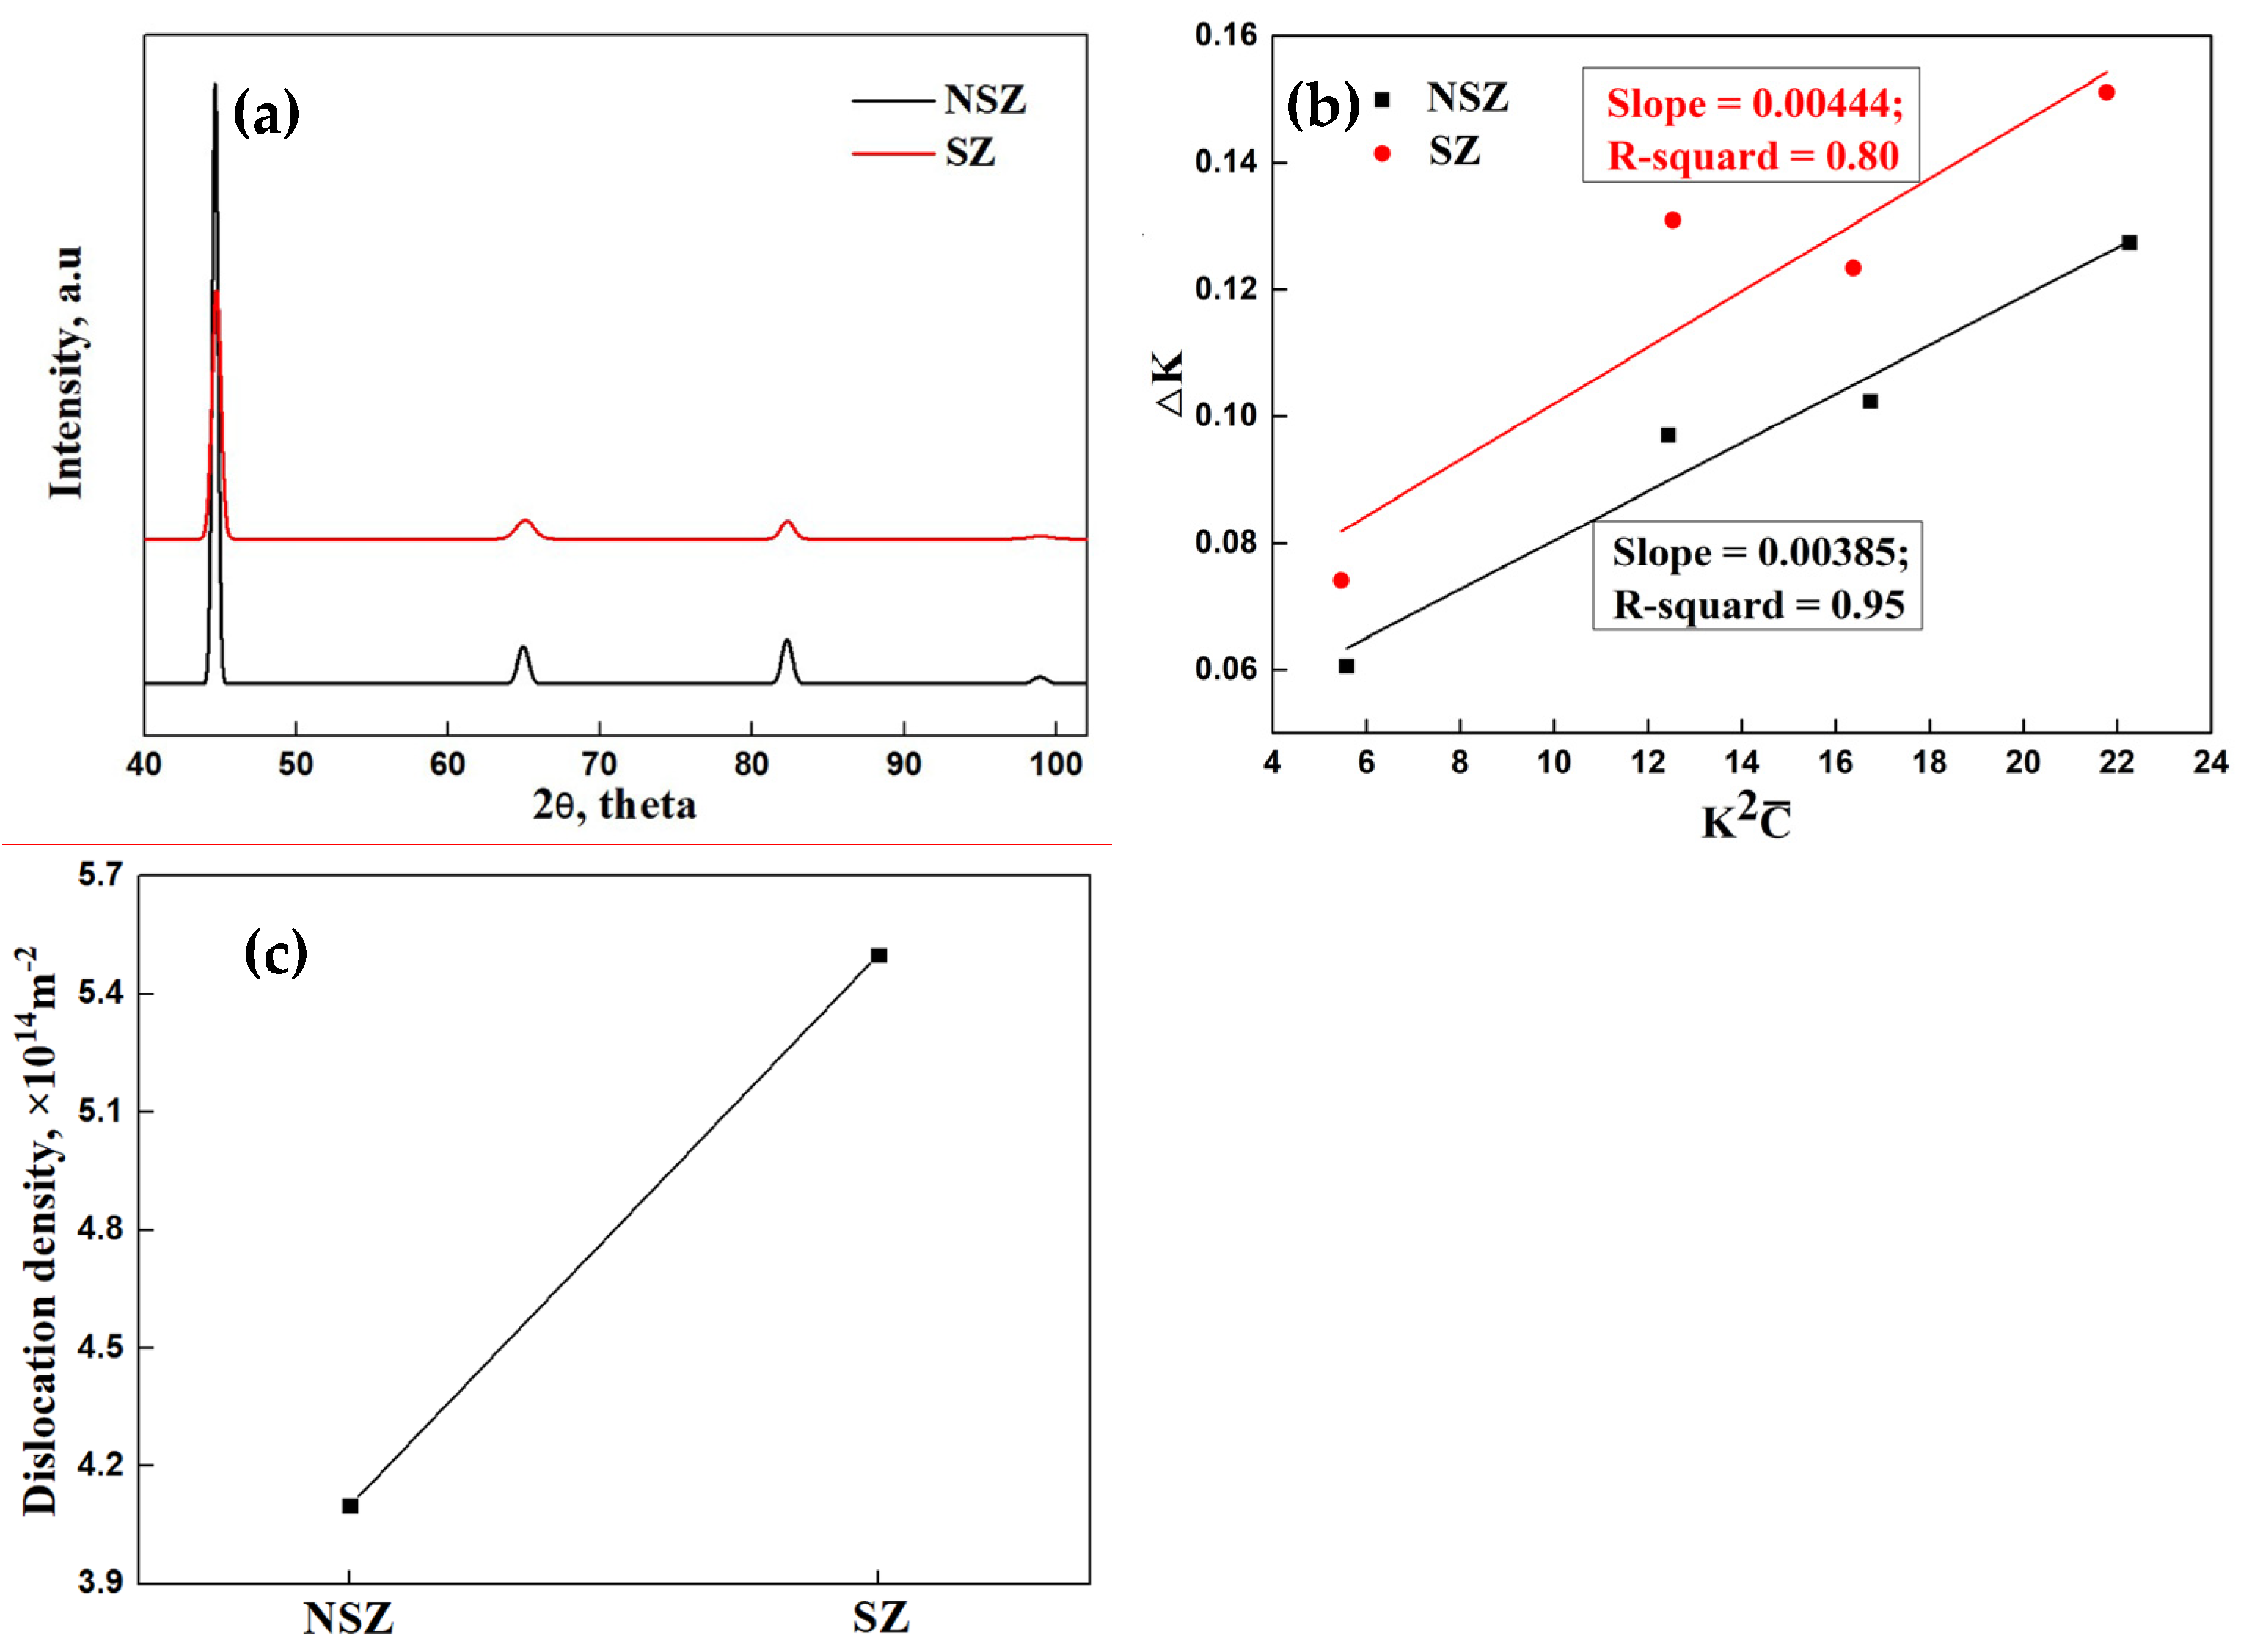
3.4.2. Dislocation Density Analysis

TEM was used to analyze the substructures of the steel plate specimen, as shown in Figure 8. The microstructure was lath martensite with many dislocation clusters (Figure 8a). Nanoscale carbide precipitates were observed in the martensite (Figure 8b), which have the effect of precipitation hardening [22].
To quantify the difference in dislocation density in the SZ and NSZ, the dislocation density, ρ(m−2), was calculated by the modified Williamson–Hall (MWH) method [23], as follows:
K = 0.9 d + 1 2 π M 2 b 2 ρ C ¯ ,
where ΔK is the full width at half maximum at a particular diffraction angle, K is the diffraction vector, and K = 2sin θ/λ, where θ is the diffraction angle, λ is the diffraction wavelength, d is the crystallite size, M is a dislocations distribution parameter, b is the Burgers vector (~0.248 nm) and C ¯ is an average contrast factor of dislocation. A typical XRD peak profile (Figure 9a) was used to calculate the dislocation density (Figure 9b,c), based on Equation (1). The result shows that dislocation density in the SZ was higher than that in the NSZ, as shown in Figure 9c, due to the enrichment of C, Mn, Ti, and Nb alloy elements. This results in higher hardness and tensile strength because of dislocation strengthening [7,23,24]. The chemical composition also affects the dislocation density of the lath martensite. With increasing C, Mn and other elements, the Ms temperature dropped, and the continuous cooling transformation (CCT) curves shifted to the right with the increasing hardenability [25]. With increasing C content, the lattice constant ratio of the C/A in martensite increased, resulting in an increase in the volume strain during martensitic transformation. A decrease in the Ms temperature resulted in a decrease of lath martensite self-tempering, and the recovery and dislocation annihilation of martensite were inhibited with the increasing hardenability [25,26].

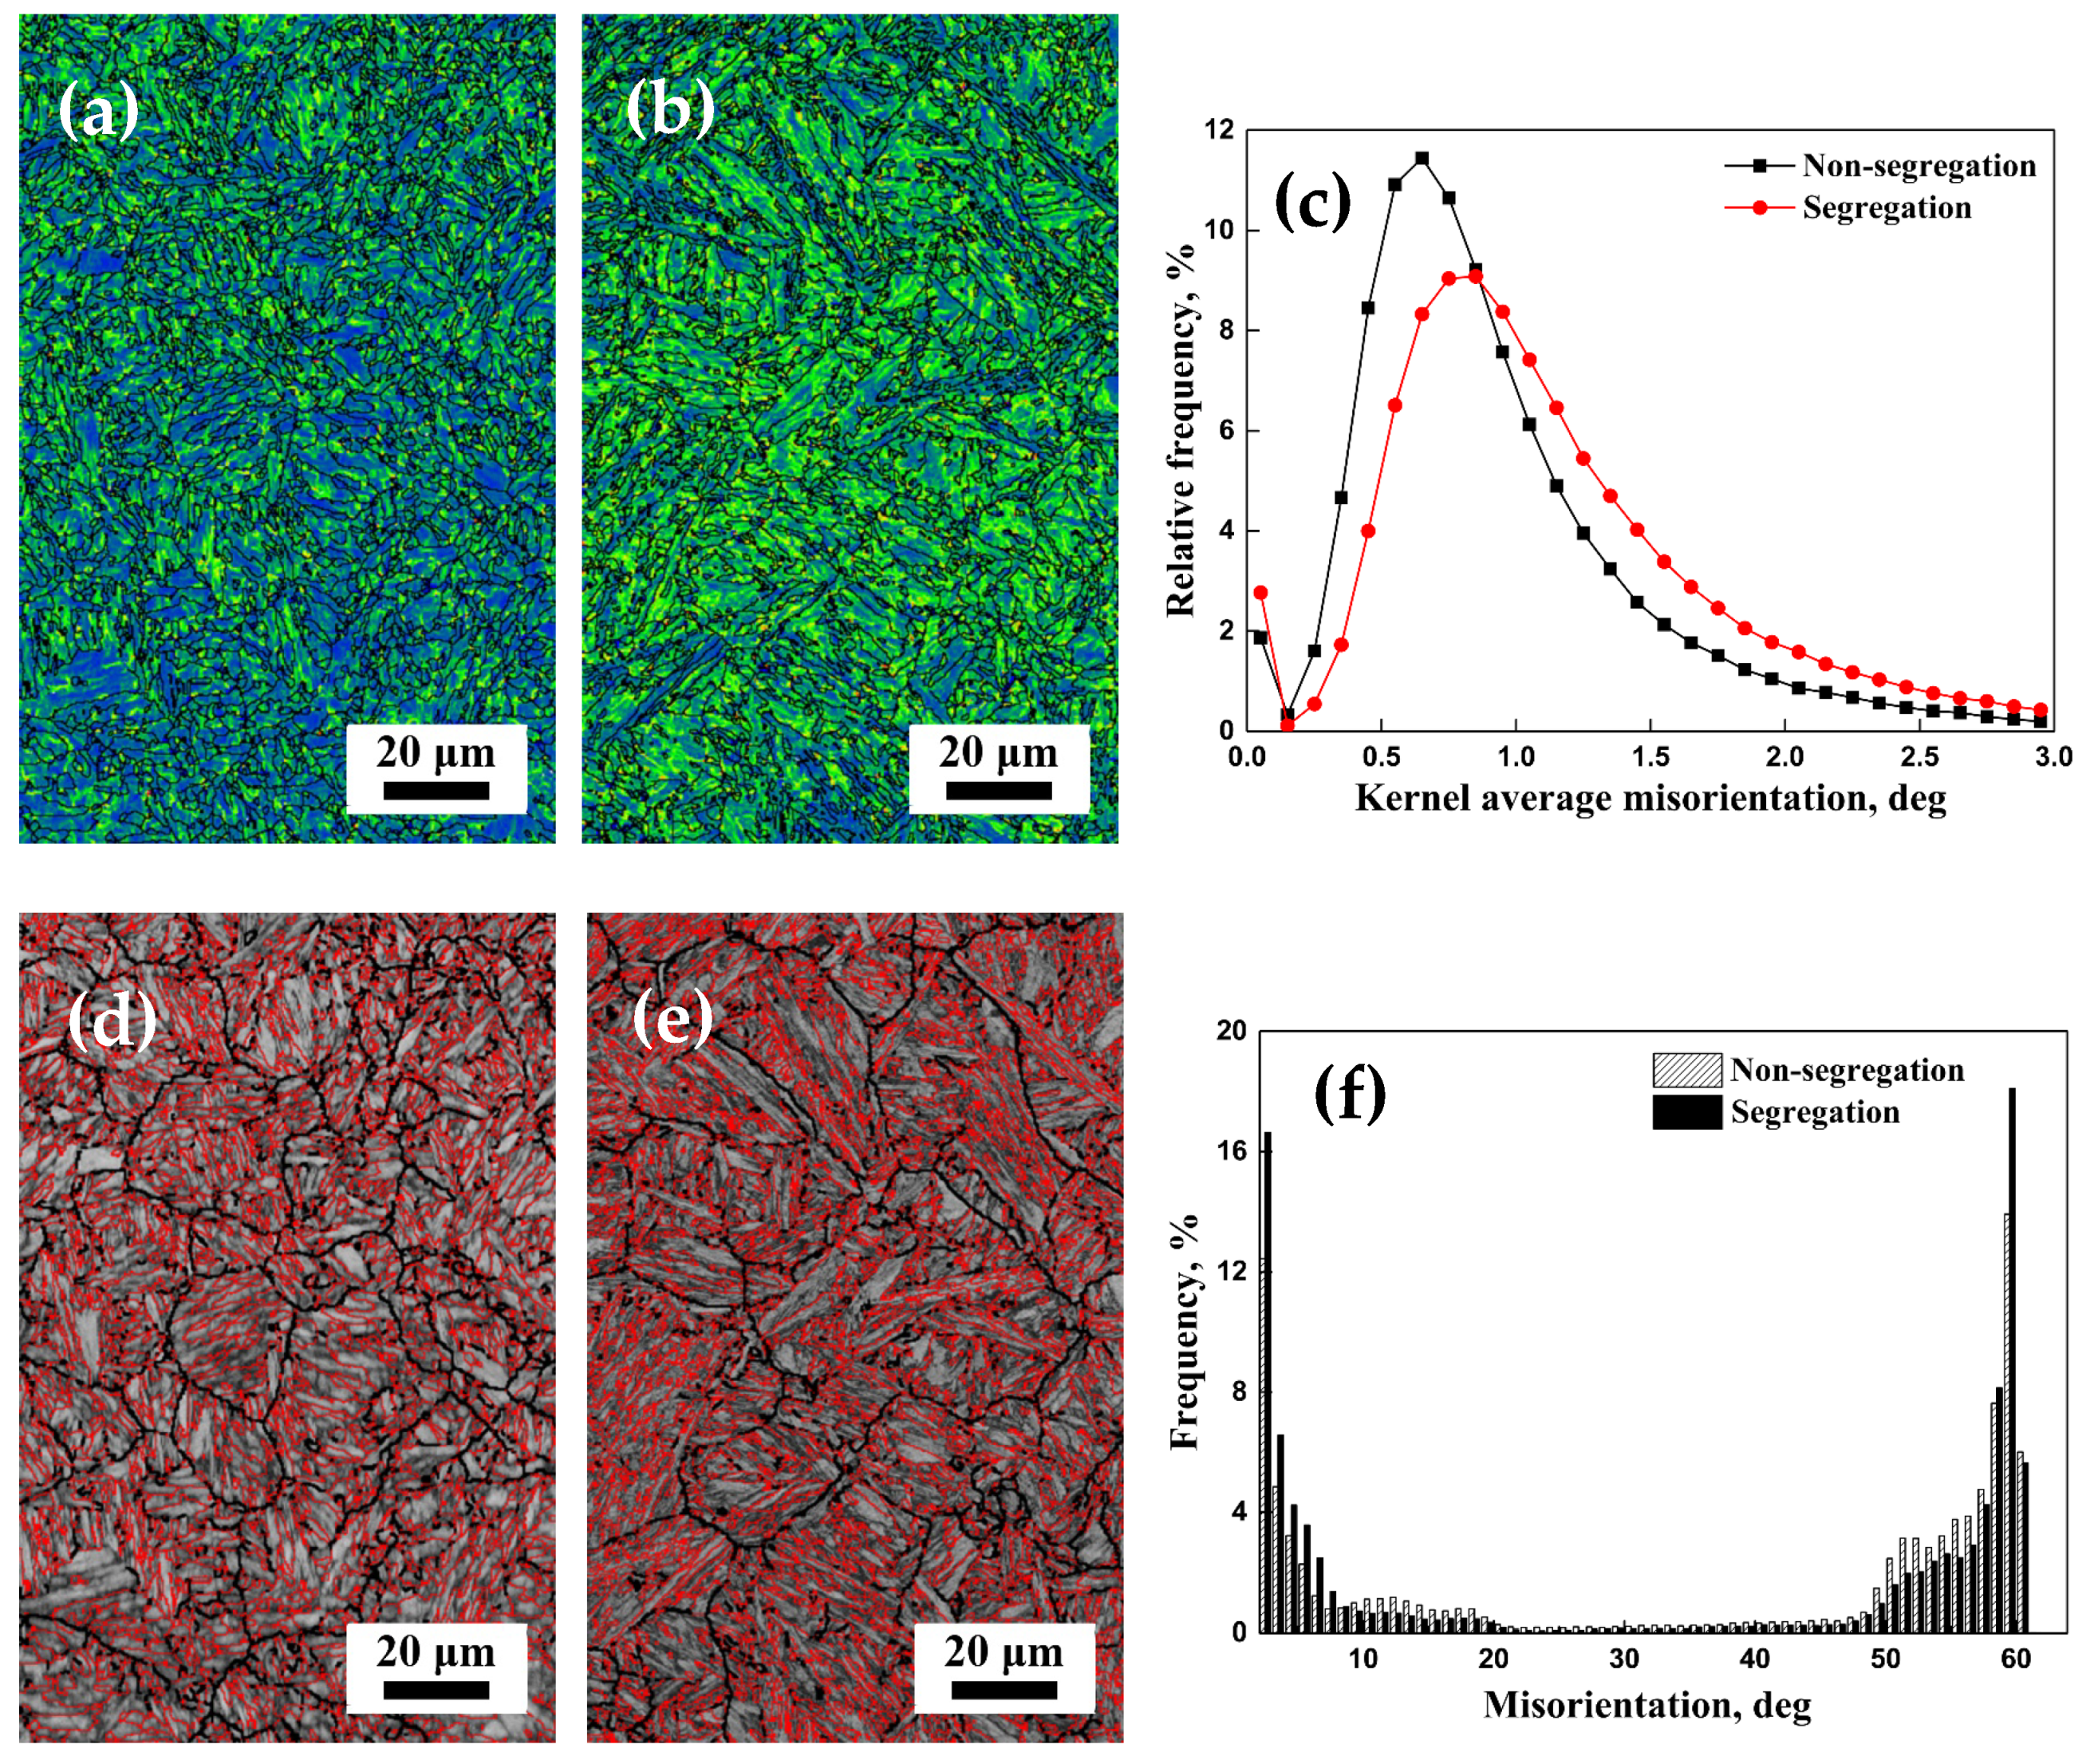
3.4.3. EBSD Analysis

Local disorientation was performed for the NSZ and the SZ segregation band by EBSD to characterize the concentration of local stress. The kernel average misorientation (KAM) map (Figure 10a–c) showed that the segregation band had more orange and red areas than the NSZ, demonstrating a greater stress concentration due to higher dislocation density, as shown in Figure 9c. Most of these orange and red areas were located between the martensite blocks and packets, which are prone to induced microcracks [27]. Figure 10d,e showed that the image quality maps in the NSZ and the SZ of the specimens, where the black line means the angle of boundary 15° ≤ θ ≤ 50° and red line means θ > 50°. Of the grain boundaries, 54.8% were greater than 50° in the NSZ, and 52.1% were greater than 50° in the segregation band (Figure 10f). Grain boundaries larger than 50° can effectively consume more energy and prevent crack propagation [28]. In the SZ, there were not only multiple segregation bands with high dislocation densities but also many micro-sized TiN inclusions, which can efficiently trap hydrogen atoms. Therefore, the SZ was more prone to crack initiation. In addition, the segregation band contained fewer large-angle grain boundaries, so the ability to prevent crack propagation was poor. This also explained why the ductility of the SZ was less than the NSZ.
The hardness and strength of the SZs were greater than those of the NSZs due to the enrichment of elements and higher dislocation density in the SZs. The number and size of the TiN inclusions in the SZs were larger than those in the NSZs, resulting in the lower plasticity of the SZs. Large TiN inclusions in the SZs tended to accumulate hydrogen atoms between the interfaces of the TiN inclusions and the matrix. This promoted hydrogen pressure when the hydrogen atoms were converted into hydrogen molecules, which promoted the delayed crack initiation and propagation [29]. More hydrogen was trapped by the higher local stress generated by the higher density of dislocations in the SZs (Figure 10b) than in the NSZs (Figure 10a) [4]. Cracks converge and stop when the crack propagation process exhausts the available energy. However, hydrogen aggregation will continue to occur at the crack tip, which causes the delayed crack re-initiation and re-propagation. Therefore, the delayed cracking on the flame cutting surface of the NM450 steel plate in this study was attributed to the existence of SZs, which contain high-density dislocations and a considerable number of micro-sized TiN inclusions.

4. Conclusions

  • Delayed cracking appeared up to a few days after the flame cutting of the NM450 steel plate. Cracks were found to originate from an SZ that contained multiple high-hardness segregation bands.
  • The tensile strength of the NM450 steel in the SZ was higher than that in the NSZ, but the total elongation and reduction of area in the SZ were relatively low. The tensile fracture surface of the specimens was characterized by ductile dimples, tear ridges, a few quasi-cleavage surfaces and secondary cracks. A higher percentage of quasi-cleavage and secondary cracks were found in the fracture surface of the SZ specimen compared to the NSZ specimen.
  • Regular-shaped TiN inclusions with high hardness and poor deformability were more harmful than circular and deformable CaO·(Al2O3)x inclusions. The latter was observed to cause a deep ductile dimple, while the former initiated a brittle quasi-cleavage fracture. The size and number of TiN inclusions in the SZ were relatively greater than those in the NSZ, which induced more quasi-cleavage fractures. This was also why the total fracture elongation and reduction of area in SZ were less than those in the NSZ. The dislocation density in the SZ was higher than that in the NSZ, increasing the hardness and strength of the SZ, which initiated the delayed cracking.

Author Contributions

Conceptualization, X.Z., L.L. and Q.Y.; methodology, X.Z. and J.L.; software and experimental validation, J.L. and D.L.; formal analysis and investigation, X.Z., J.L. and D.L.; resources, X.Z., L.L. and Q.Y.; data curation, X.Z. and J.L.; writing—original draft preparation, J.L.; writing—review and editing, X.Z.; supervision, X.Z., L.L. and Q.Y.; project administration, X.Z.; funding acquisition, X.Z. All authors have read and agreed to the published version of the manuscript.

Funding

This research was funded by Henan Provincial Science and Technology Cooperation Project China (Grant No. 182106000016) and Key R&D and Promotion Special Project of Henan Province (No. 212102210444).

Institutional Review Board Statement

Not applicable.

Informed Consent Statement

Not applicable.

Data Availability Statement

Data are contained within the article.

Acknowledgments

The authors gratefully acknowledge the financial support provided by Nanjing Iron & Steel Co., Ltd.

Conflicts of Interest

The authors declare no conflict of interest.

References

  1. Nikitin, V.N.; Nastich, S.Y.; Smirnov, L.A.; Mal’tsev, A.B.; Denisov, S.V.; Chevskaya, O.N.; Brylin, A.M.; Kurash, V.S.; Maslyuk, V.M.; Tarasov, V.M. Economically alloyed high-strength steel for use in mine equipment. Steel Trans. 2016, 46, 742–751. [Google Scholar] [CrossRef]
  2. Bae, K.Y.; Yang, Y.S.; Yi, M.S.; Park, C.W. Numerical analysis of heat flow in oxy-ethylene flame cutting of steel plate. Proc. Inst. Mech. Eng. Part. B-J. Eng. Manuf. 2018, 232, 742–751. [Google Scholar] [CrossRef]
  3. Chida, T.; Haihara, Y.; Akiyama, E.; Iwanaga, K.; Takagi, S.; Hayakawa, M.; Ohishi, H.; Hirakami, D.; Tarui, T. Comparison of constant load, SSRT and CSRT methods for hydrogen embrittlement evaluation using round bar specimens of high strength steels. ISIJ Int. 2016, 56, 1268–1275. [Google Scholar] [CrossRef] [Green Version]
  4. Hirakami, D.; Yamasaki, S.; Tarui, T.; Ushioda, K. Competitive phenomenon of hydrogen trapping and carbon segregation in dislocations introduced by drawing or martensitic transformation of 0.35 mass% and 0.8 mass% C steels. ISIJ Int. 2016, 56, 359–365. [Google Scholar] [CrossRef] [Green Version]
  5. Kim, J.S.; Lee, Y.H.; Lee, D.L.; Park, K.T.; Lee, C.S. Microstructural influences on hydrogen delayed fracture of high strength steels. Mater. Sci. Eng. A 2009, 505, 105–110. [Google Scholar] [CrossRef]
  6. Geng, W.T.; Wang, V.; Li, J.X.; Ishikawa, N.; Kimizuka, H.; Tsuzaki, K.; Ogata, S. Hydrogen trapping in carbon supersaturated α iron and its decohesion effect in martensitic steel. Scr. Mater. 2018, 149, 79–83. [Google Scholar] [CrossRef]
  7. Cai, M.H.; Chen, L.G.; Fang, K.; Huang, H.S.; Hodgson, P. The effects of a ferritic or martensitic matrix on the tensile behavior of a nano-precipitation strengthened ultra-low carbon Ti–Mo–Nb steel. Mater. Sci. Eng. A 2021, 801, 140410. [Google Scholar] [CrossRef]
  8. Tian, Q.R.; Wang, G.C.; Zhao, Y.; Li, J.; Wang, Q. Precipitation behaviors of TiN inclusion in GCr15 bearing steel billet. Metall. Mater. Trans. B 2018, 49, 1149–1164. [Google Scholar] [CrossRef]
  9. Wu, X.; Zuo, X.R.; Zhao, W.W.; Wang, Z.Y. Mechanism of TiN fracture during the tensile process of NM500 wear-resistant steel. Acta Metall. Sin. 2020, 56, 129–136. [Google Scholar]
  10. Wang, Z.Y.; Wu, X.; Liu, D.H.; Zuo, X.R. Correlation between microstructure and fracture behavior in thick HARDOX 450 wear-resistant steel with TiN inclusions. Front. Mater. 2021, 8, 691551. [Google Scholar] [CrossRef]
  11. Laureys, A.; Claeys, L.; De Seranno, T.; Depover, T.; Van den Eeckhout, E.; Petrov, R.; Verbeken, K. The role of titanium and vanadium based precipitates on hydrogen induced degradation of ferritic materials. Mater. Charact. 2018, 144, 22–34. [Google Scholar] [CrossRef] [Green Version]
  12. Depover, T.; Laureys, A.; Escobar, D.P.; Van den Eeckhout, E.; Wallaert, E.; Verbeken, K. Understanding the interaction between a steel microstructure and hydrogen. Materials 2018, 11, 698. [Google Scholar] [CrossRef] [PubMed] [Green Version]
  13. Rajiah, S.; Sambandam, M.; Shanmugam, S.P.; Vikraman, S.; Taticherla, R. Inter-columnar macro-segregation in continuously cast steel; characterization, possible reasons, and consequence. Trans. Indian Inst. Met. 2021, 74, 1557–1568. [Google Scholar] [CrossRef]
  14. Costa e Silva, A. Using computational thermodynamics to understand the evolution of solidification segregation during steel processing. J. Phase Equilib. Diffus. 2020, 41, 522–531. [Google Scholar] [CrossRef]
  15. Laureys, A.; Depover, T.; Petrov, R.; Verbeken, K. Microstructural characterization of hydrogen induced cracking in TRIP-assisted steel by EBSD. Mater. Charact. 2016, 112, 169–179. [Google Scholar] [CrossRef]
  16. Tirumalasetty, G.K.; Van Huis, M.A.; Fang, C.M.; Xu, Q.; Tichelaar, F.D.; Hanlon, D.N.; Sietsma, J.; Zandbergen, H.W. Characterization of NbC and (Nb, Ti)N nanoprecipitates in TRIP assisted multiphase steels. Acta Mater. 2011, 59, 7406–7415. [Google Scholar] [CrossRef] [Green Version]
  17. Yang, G.W.; Wang, X.H. Inclusion evolution after calcium addition in low carbon Al-killed steel with ultra low sulfur content. ISIJ Int. 2015, 55, 126–133. [Google Scholar] [CrossRef] [Green Version]
  18. Liu, C.Y.; Jia, Y.; Hao, L.X.; Han, S.W.; Huang, F.X.; Yu, H.X.; Gao, X.; Ueda, S.; Kitamura, S.Y. Effects of slag composition and impurities of alloys on the inclusion transformation during industrial ladle furnace refining. Metals 2021, 11, 763. [Google Scholar] [CrossRef]
  19. Mizobe, K.; Honda, T.; Koike, H.; Santos, E.C.; Shibukawa, T.; Kida, K. Relationship between repeatedly quenching and fisheye cracks around TiN and Al2O3 inclusions in high carbon bearing steel. Mater. Res. Innov. 2014, 18, S160–S165. [Google Scholar] [CrossRef]
  20. Zhu, Y.; Lu, Y.M.; Huang, C.W.; Liang, Y.L. The effect of TiN inclusions on the fracture mechanism of 20CrMnTi steel with lath martensite. Mater. Res. Express. 2020, 7, 036509. [Google Scholar] [CrossRef]
  21. Liu, T.; Long, M.J.; Chen, D.F.; Duan, H.M.; Gui, L.T.; Yu, S.; Cao, J.S.; Chen, H.B.; Fan, H.L. Effect of coarse TiN inclusions and microstructure on impact toughness fluctuation in Ti micro-alloyed steel. J. Iron Steel Res. Int. 2018, 25, 1043–1053. [Google Scholar] [CrossRef]
  22. Li, Z.T.; Chai, F.; Yang, C.F.; Yang, L. Co-precipitation mechanism of nanoscale particles and mechanical properties in multicomponent ultra-high strength low carbon steel. Mater. Sci. Eng. A 2019, 748, 128–136. [Google Scholar] [CrossRef]
  23. HajyAkbary, F.; Sietsma, J.; Böttger, A.J.; Santofimia, M.J. An improved X-ray diffraction analysis method to characterize dislocation density in lath martensitic structures. Mater. Sci. Eng. A 2015, 639, 208–218. [Google Scholar] [CrossRef]
  24. Huang, M.; Rivera-Díaz-del-Castillo, P.E.J.; Bouaziz, O.; Van Der Zwaag, S. Modelling strength and ductility of ultrafine grained BCC and FCC alloys using irreversible thermodynamics. Mater. Sci. Technol. 2009, 25, 833–839. [Google Scholar] [CrossRef]
  25. Wu, D.; Wang, F.M.; Cheng, J.; Li, C.R. Effect of Nb and V on the continuous cooling transformation of undercooled austenite in Cr–Mo–V steel for brake discs. Int. J. Miner. Metall. Mater. 2018, 25, 892–901. [Google Scholar] [CrossRef]
  26. Macchi, J.; Gaudez, S.; Geandier, G.; Teixeira, J.; Denis, S.; Bonnet, F.; Allain, S.Y.P. Dislocation densities in a low-carbon steel during martensite transformation determined by in situ high energy X-Ray diffraction. Mater. Sci. Eng. A 2021, 800, 140249. [Google Scholar] [CrossRef]
  27. Zhou, T.; Yu, H.; Wang, S.Y. Effect of microstructural types on toughness and microstructural optimization of ultra-heavy steel plate: EBSD analysis and microscopic fracture mechanism. Mater. Sci. Eng. A 2016, 658, 150–158. [Google Scholar] [CrossRef]
  28. Liu, Q.; Fang, L.M.; Xiong, Z.W.; Yang, J.; Tan, Y.; Liu, Y.; Zhang, Y.J.; Tan, Q.; Hao, C.C.; Cao, L.H.; et al. The response of dislocations, low angle grain boundaries and high angle grain boundaries at high strain rates. Mater. Sci. Eng. A 2021, 822, 141704. [Google Scholar] [CrossRef]
  29. Chen, Y.; Liu, J.; Huang, F.; Chen, L.; Su, Y.J.; Zhou, G.F. Influence of inclusions on hydrogen-induced delayed cracking in hot stamping steels. J. Iron steel Res. Int. 2019, 26, 1199–1208. [Google Scholar] [CrossRef]
Figure 1. (a) Optical microscopy image of the morphology of a segregation crack and (b) the microhardness curve of a segregation band in a segregation zone (SZ).
Metals 12 00021 g001
Figure 2. Crack morphology in a segregation zone (SZ) on the flame cutting surface. (a) Optical microscopy image and (b) scanning electron microscopy image.
Metals 12 00021 g002
Figure 3. Stress–strain curves of the segregation zone (SZ) and the non-segregation zone (NSZ) in different directions.
Metals 12 00021 g003
Figure 4. Fracture surfaces of the specimens after tensile testing. (a) Tensile fracture of a segregation zone (SZ), (b) tensile fracture of a non-segregation zone (NSZ), (c) fiber zone of the SZ, (d) fiber zone of the NSZ, (e) TiN inclusion on a fracture surface, (f) CaO·(Al2O3)x inclusion on a fracture surface and (g,h) the energy-dispersive spectrums of the inclusions.
Metals 12 00021 g004
Figure 5. Scanning electron microscopy images of TiN and CaO·(Al2O3)x inclusions in the longitudinal section of a tensile crack surface. (a) CaO·(Al2O3)x distal to the fracture, (b) CaO·(Al2O3)x slightly closer to the fracture, (c) CaO·(Al2O3)x proximal to the fracture surface, (d) TiN distal to the fracture, (e) TiN slightly closer to the fracture, (f) TiN near the fracture surface and (g,h) the energy-dispersive spectrums of the inclusions.
Metals 12 00021 g005
Figure 6. Schematic of the growth behavior of the microcracks when subjected to tensile stress. (a) CaO·(Al2O3)x inclusion and (b) TiN inclusion.
Metals 12 00021 g006
Figure 7. Optical microscopy images and size distribution of the TiN inclusions. (a) Non-segregation zone, (b) segregation zone and (c) size distribution of the TiN.
Metals 12 00021 g007
Figure 8. Transmission electron microscopy images of the NM450 steel plate. (a) Lath martensite and (b) nanoscale carbide precipitates.
Metals 12 00021 g008
Figure 9. (a) X-ray diffraction profiles of the non-segregation zone (NSZ) and the segregation zone (SZ), (b) the fitted lines of ΔK vs. K2 C ¯ based on the modified Williamson–Hall method and (c) the calculated dislocation density of the NSZ and SZ.
Metals 12 00021 g009
Figure 10. Kernel average misorientation (KAM) and image quality maps for the (a) non-segregation zone (NSZ) and (b) the segregation band. (c) Corresponding distribution of the KAM value. (d) NSZ, (e) segregation band and (f) misorientation distribution (black line 15° ≤ θ ≤ 50° and red line θ > 50°).
Metals 12 00021 g010
Table 1. Tensile properties of the NM450 steel specimens in different directions.
DirectionLocationTensile Strength (MPa)Elongation (%)Area Reduction (%)
TransverseSegregation Zone160613.538.4
Non-segregation Zone150316.354.5
LongitudinalSegregation Zone157914.442.9
Non-segregation Zone147417.755.6
Publisher’s Note: MDPI stays neutral with regard to jurisdictional claims in published maps and institutional affiliations.

