

A Modified Johnson–Cook Model and Microstructure Evolution of As-Extruded AA 2055 Alloy during Isothermal Compression


Abstract
:1. Introduction
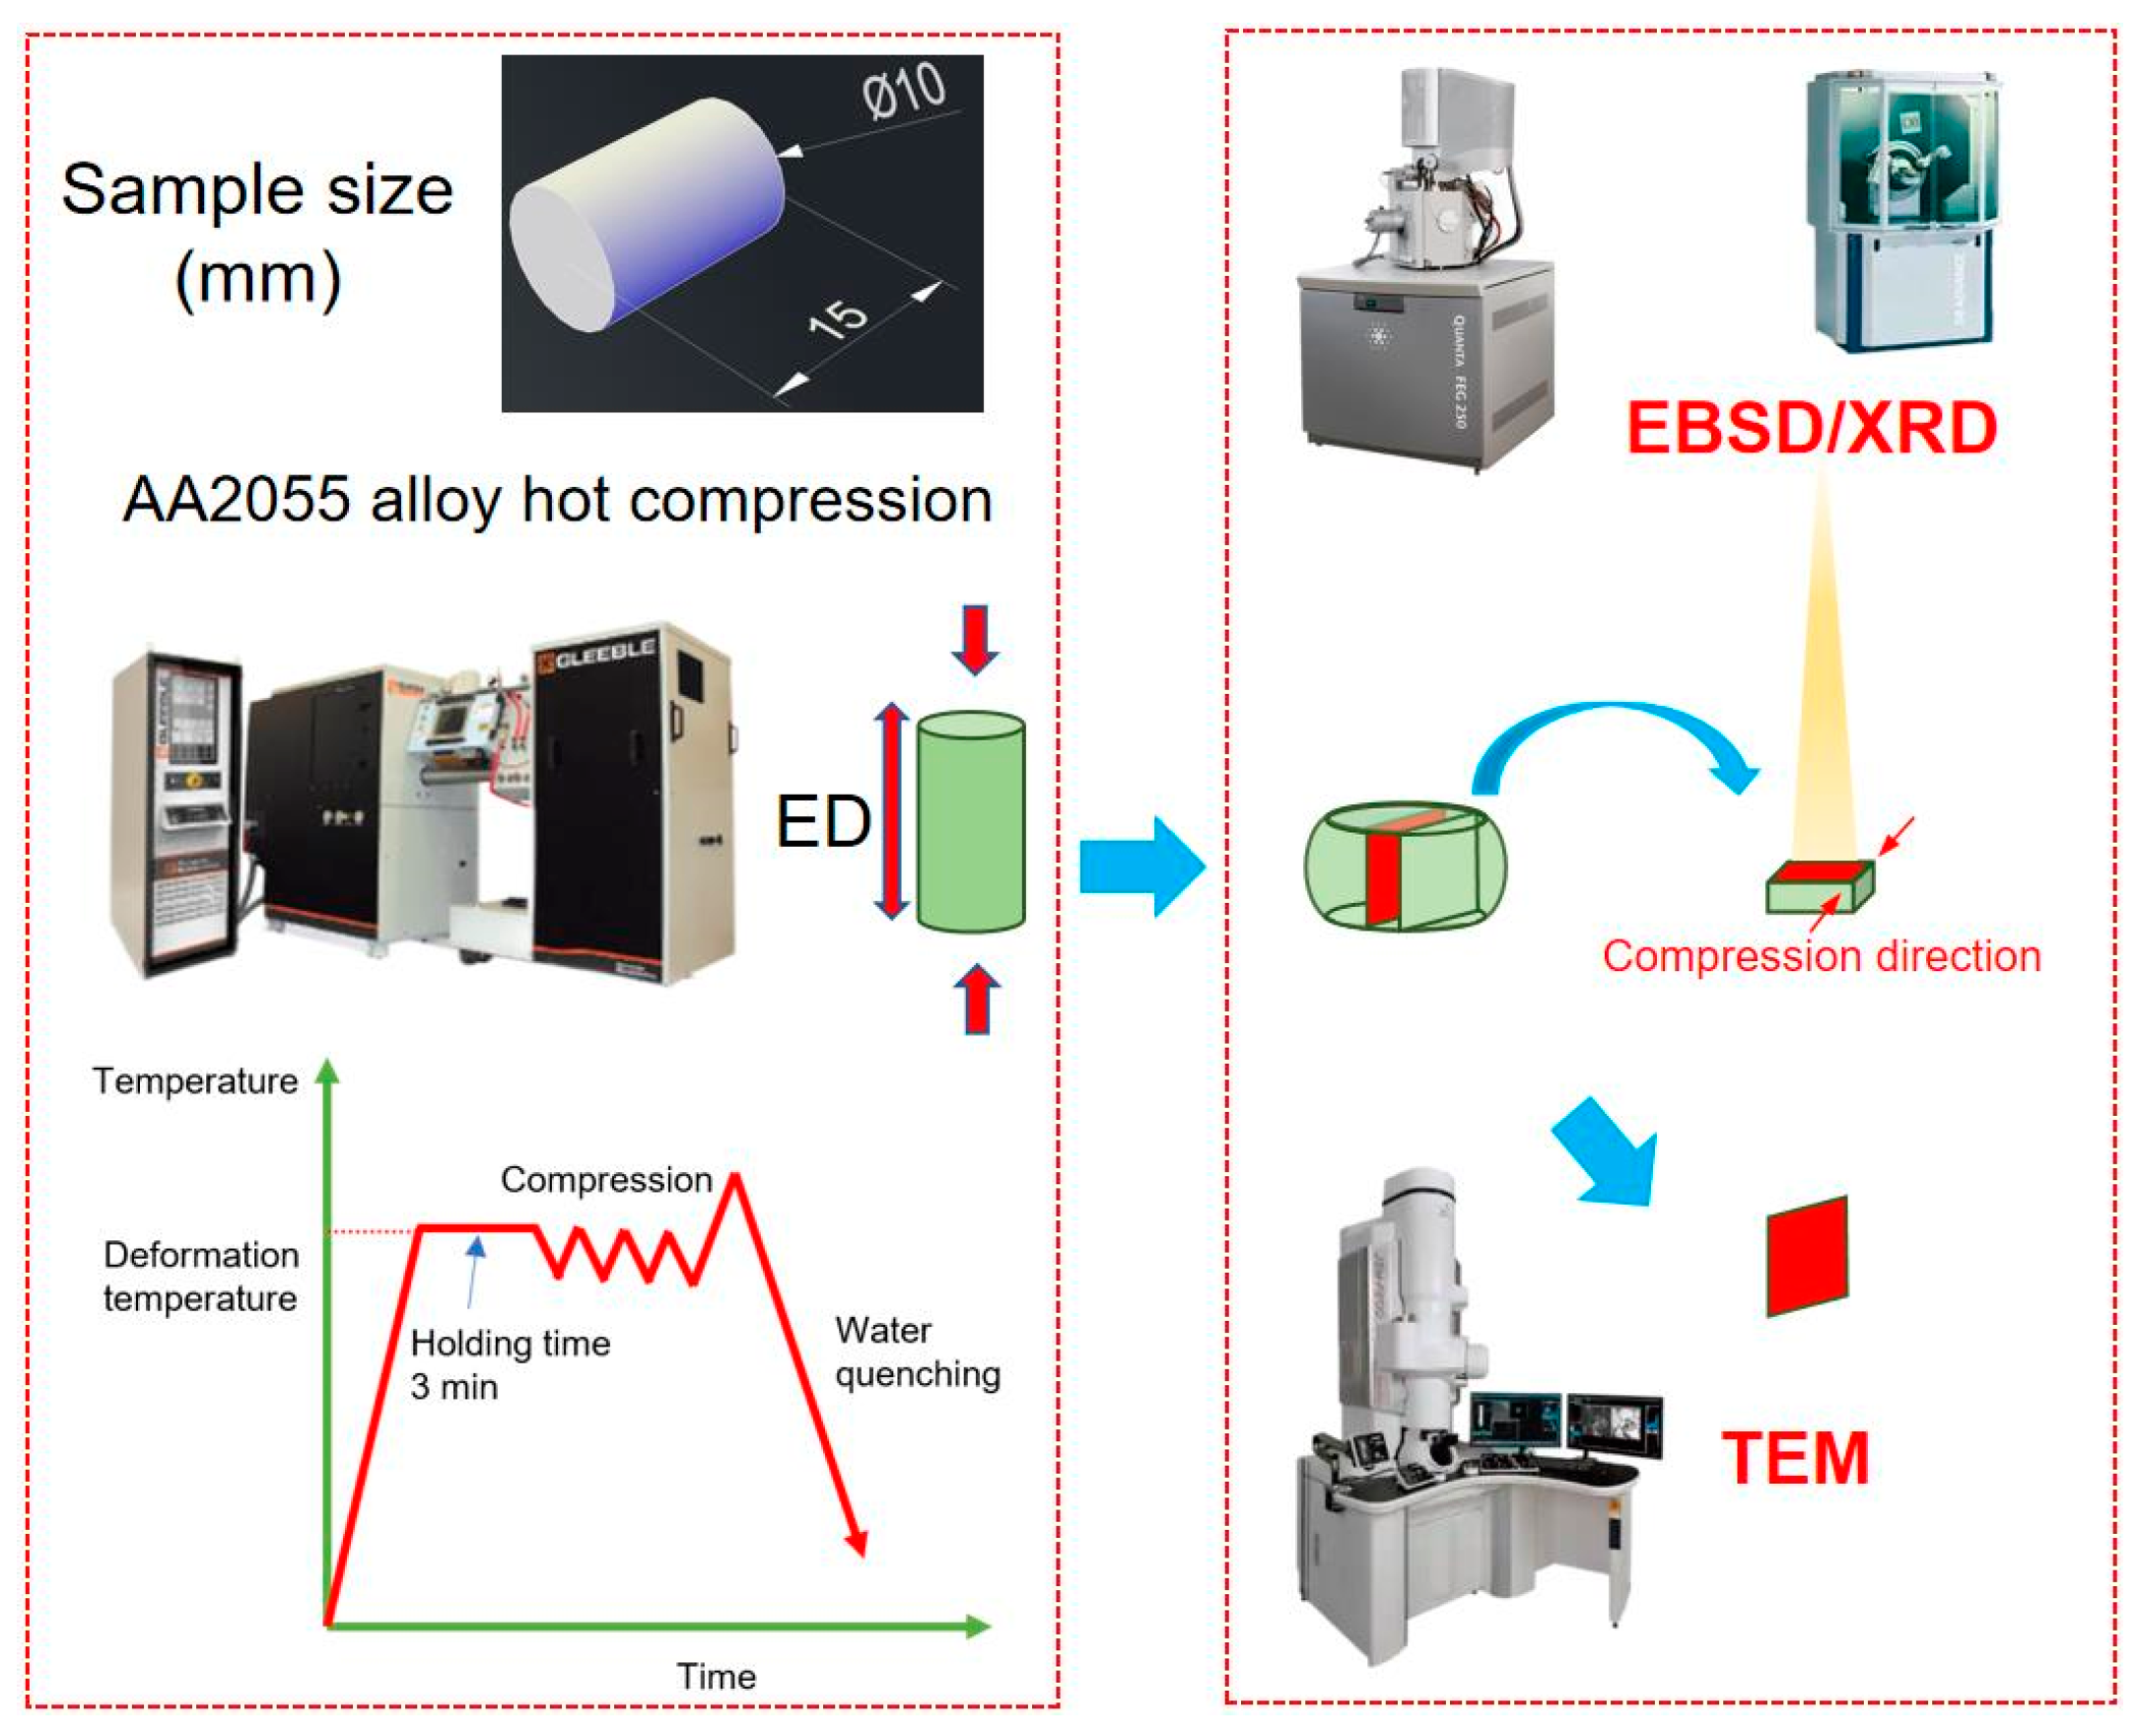
2. Materials and Methods
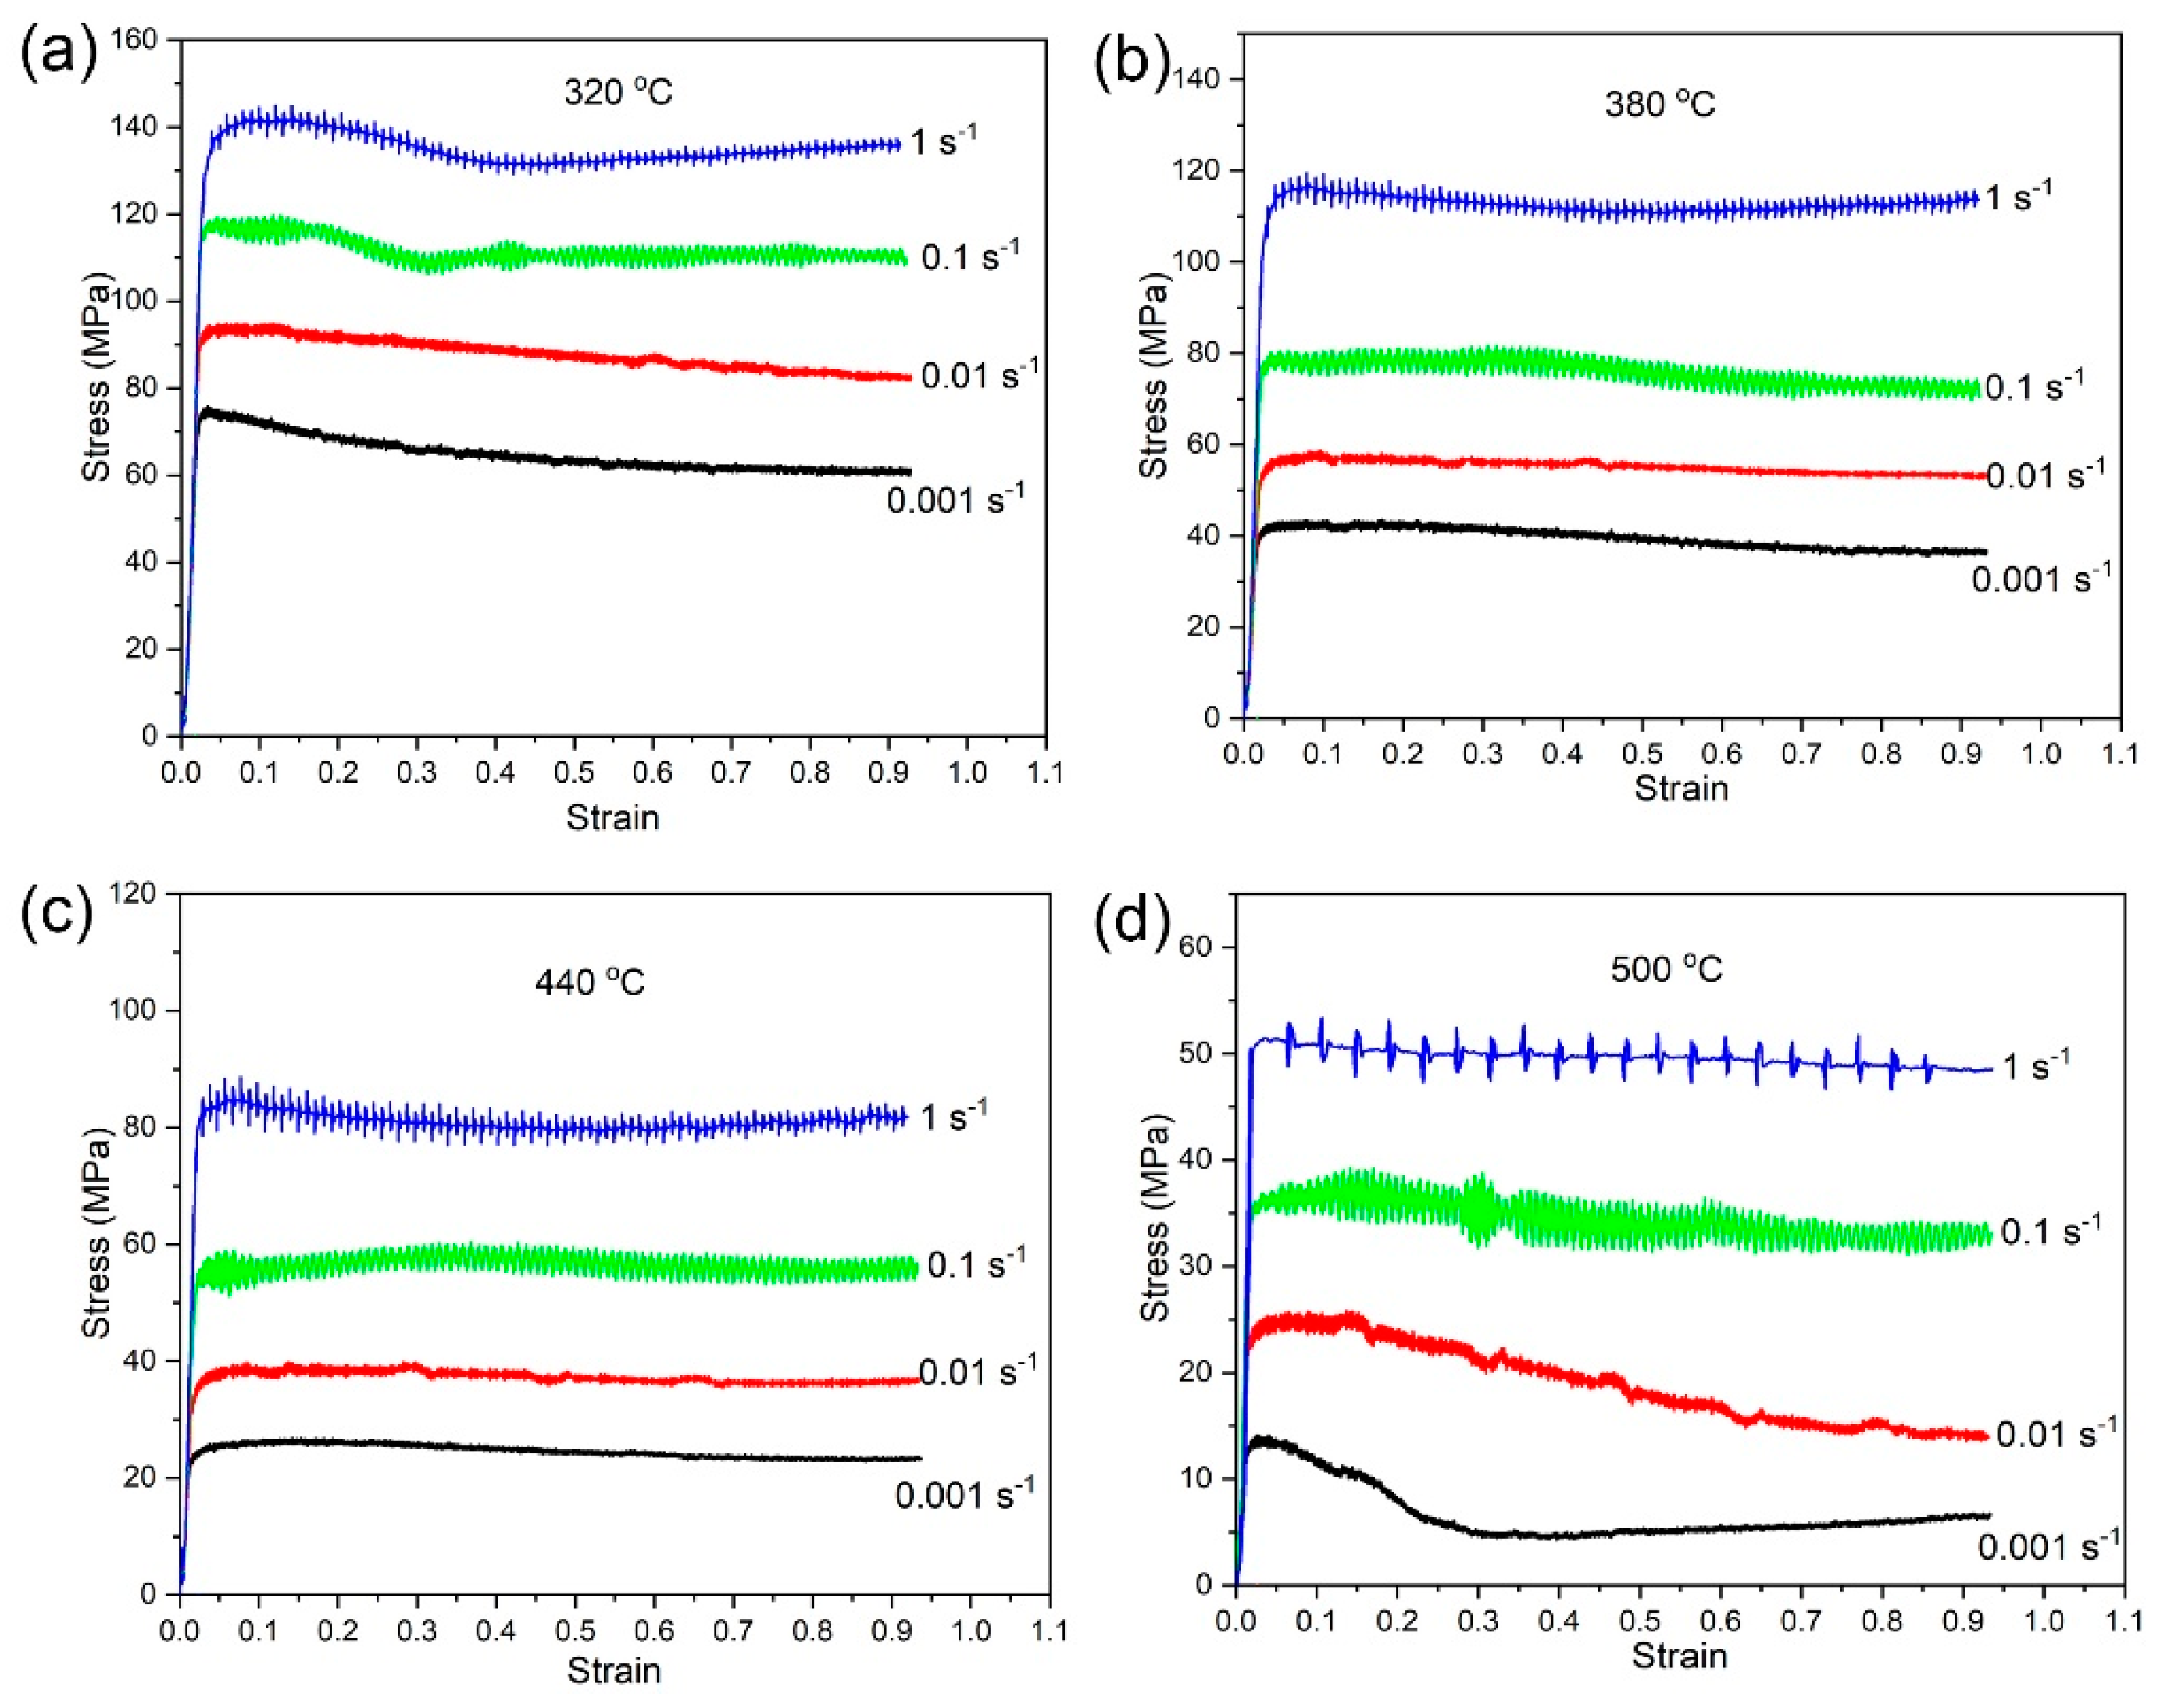
3. Results and Discussion
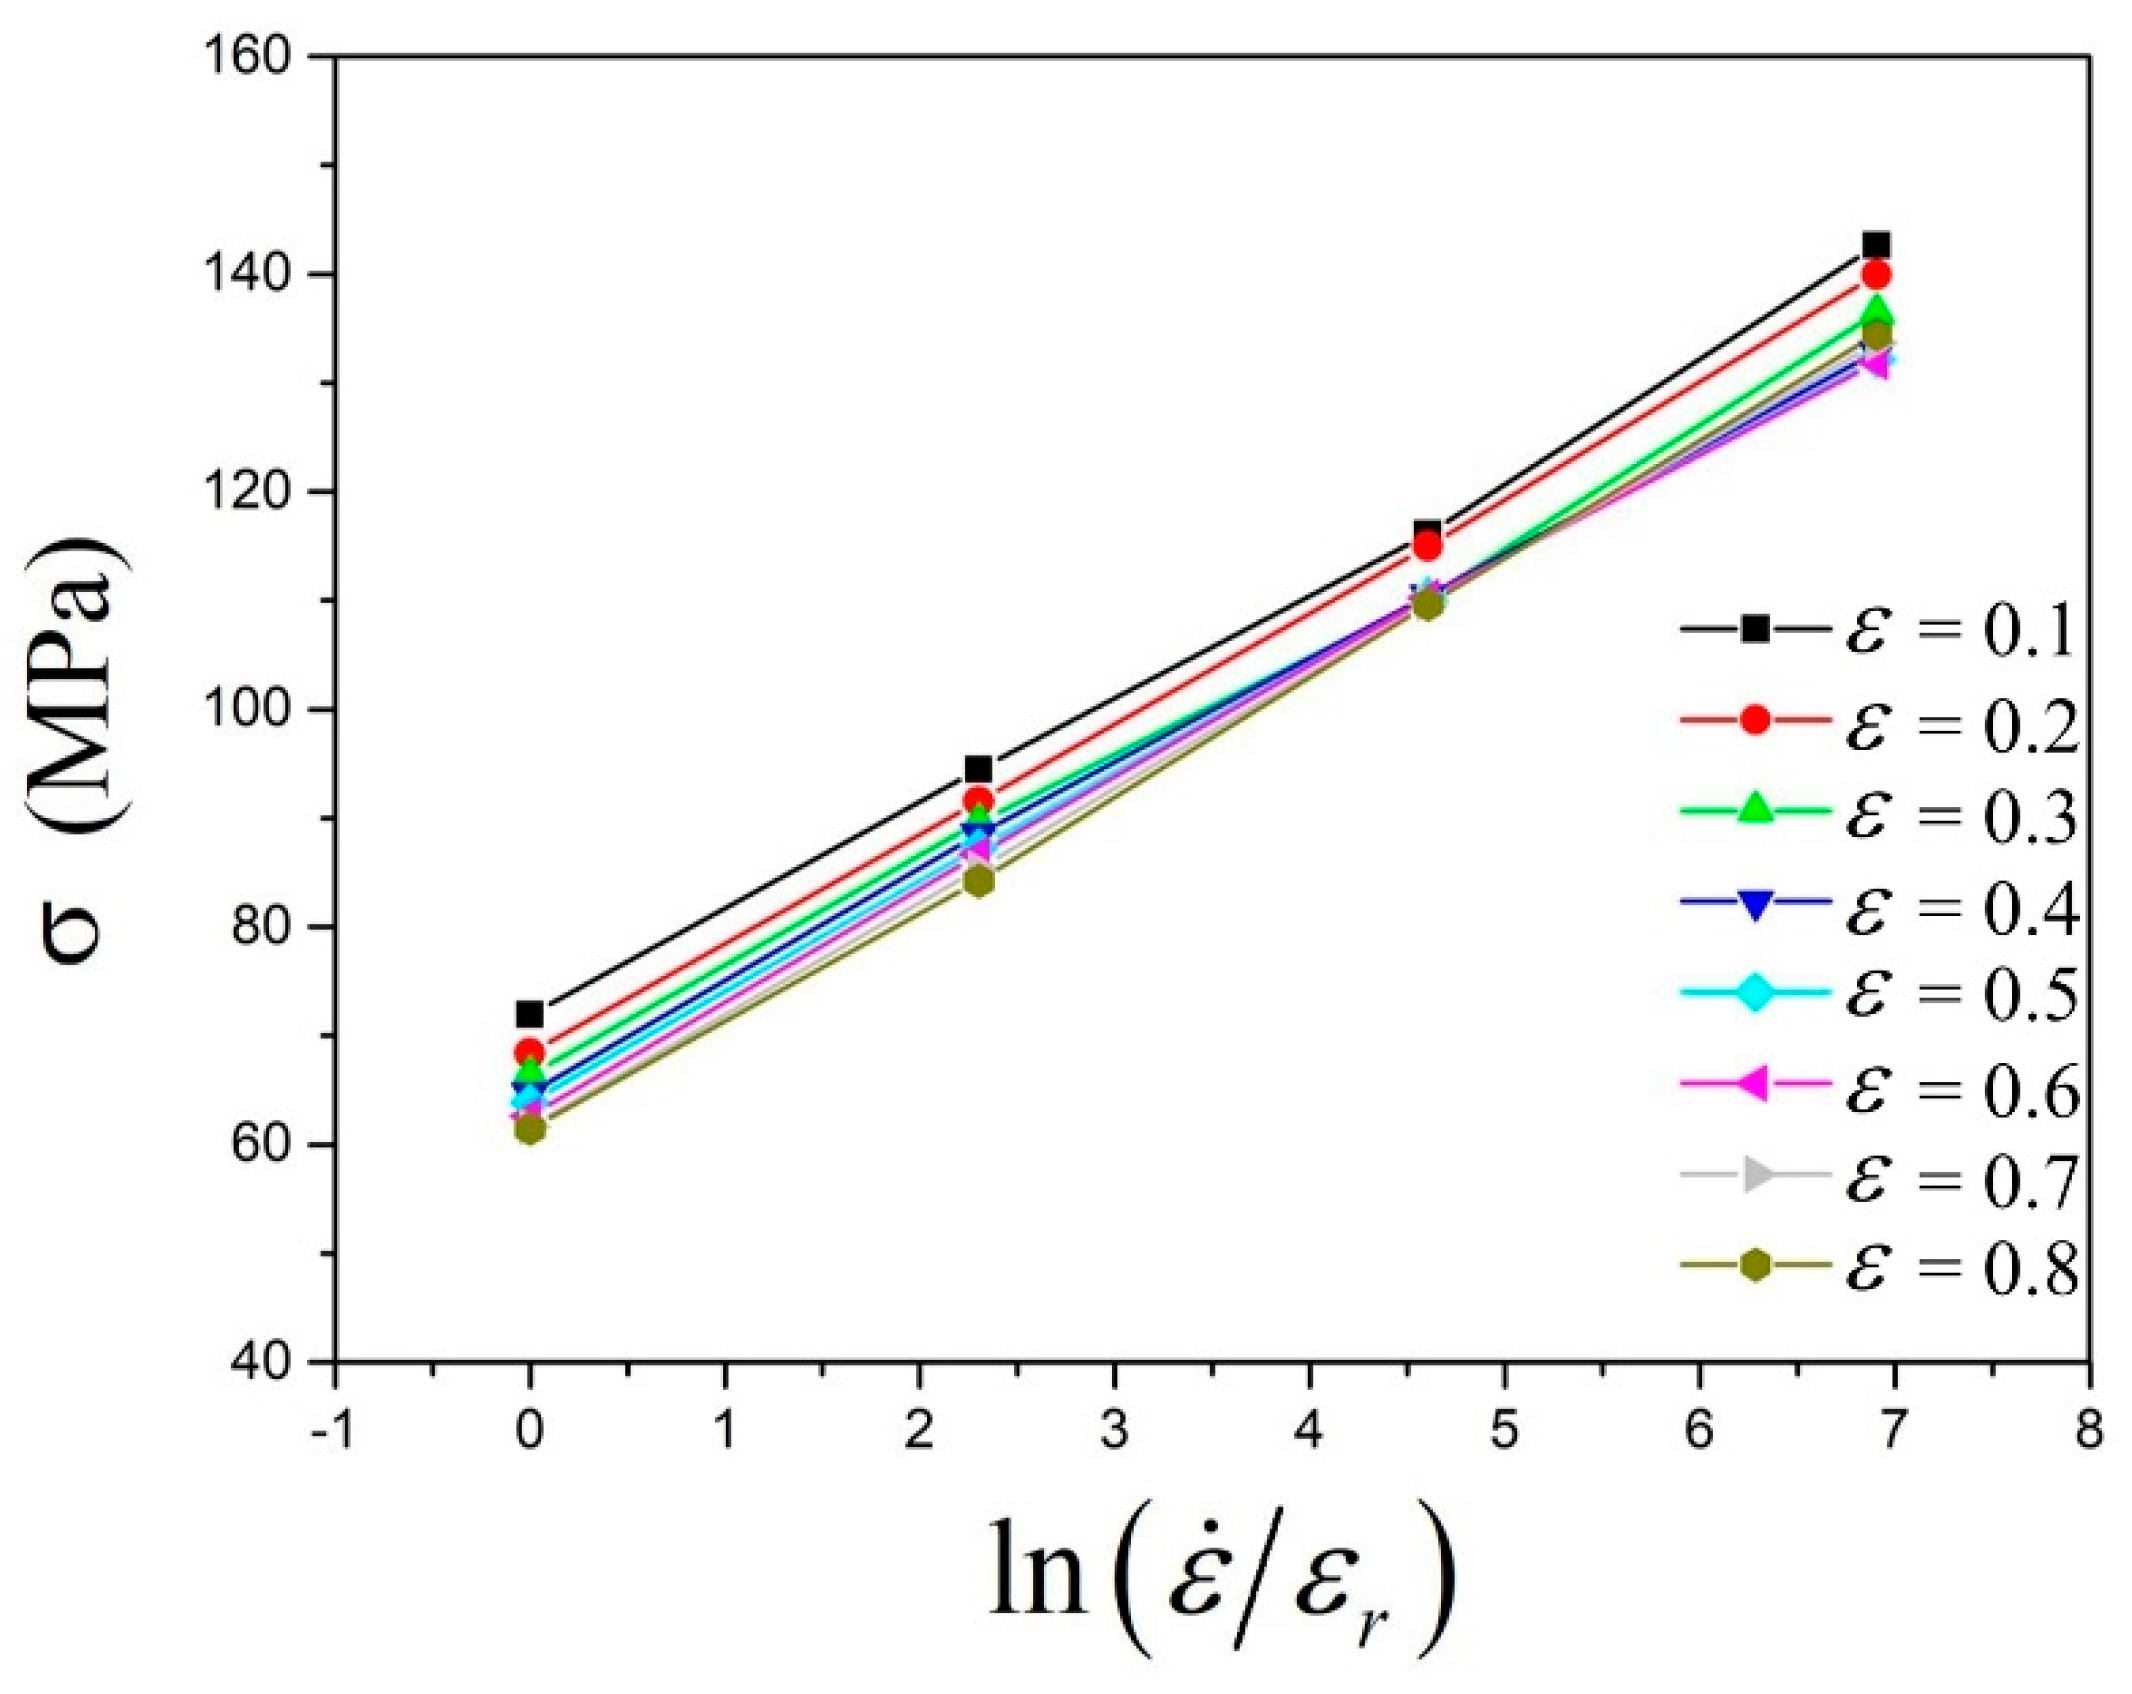
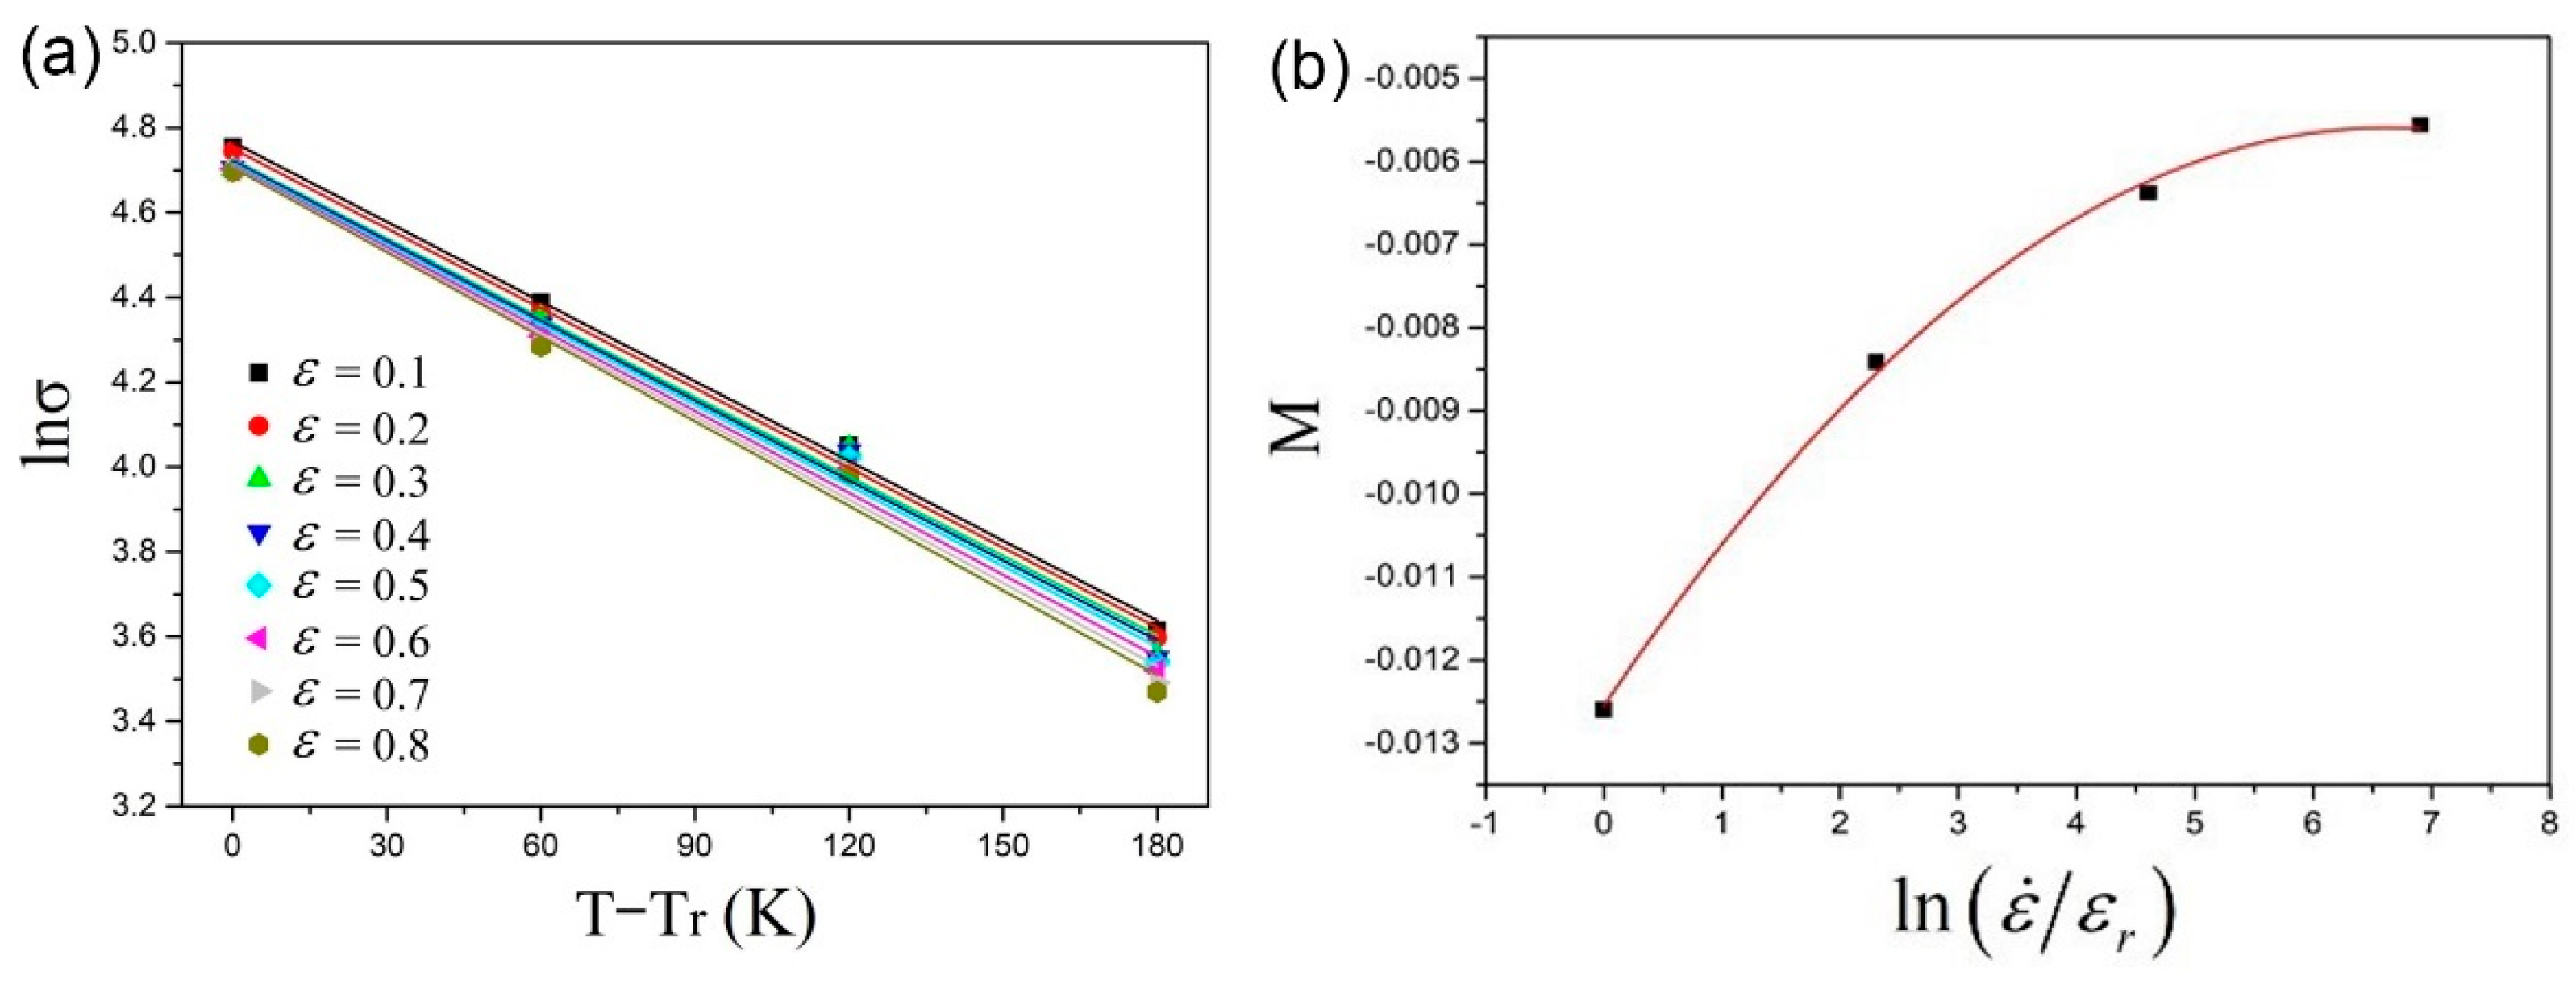
3.1. The Modified Johnson–Cook Model
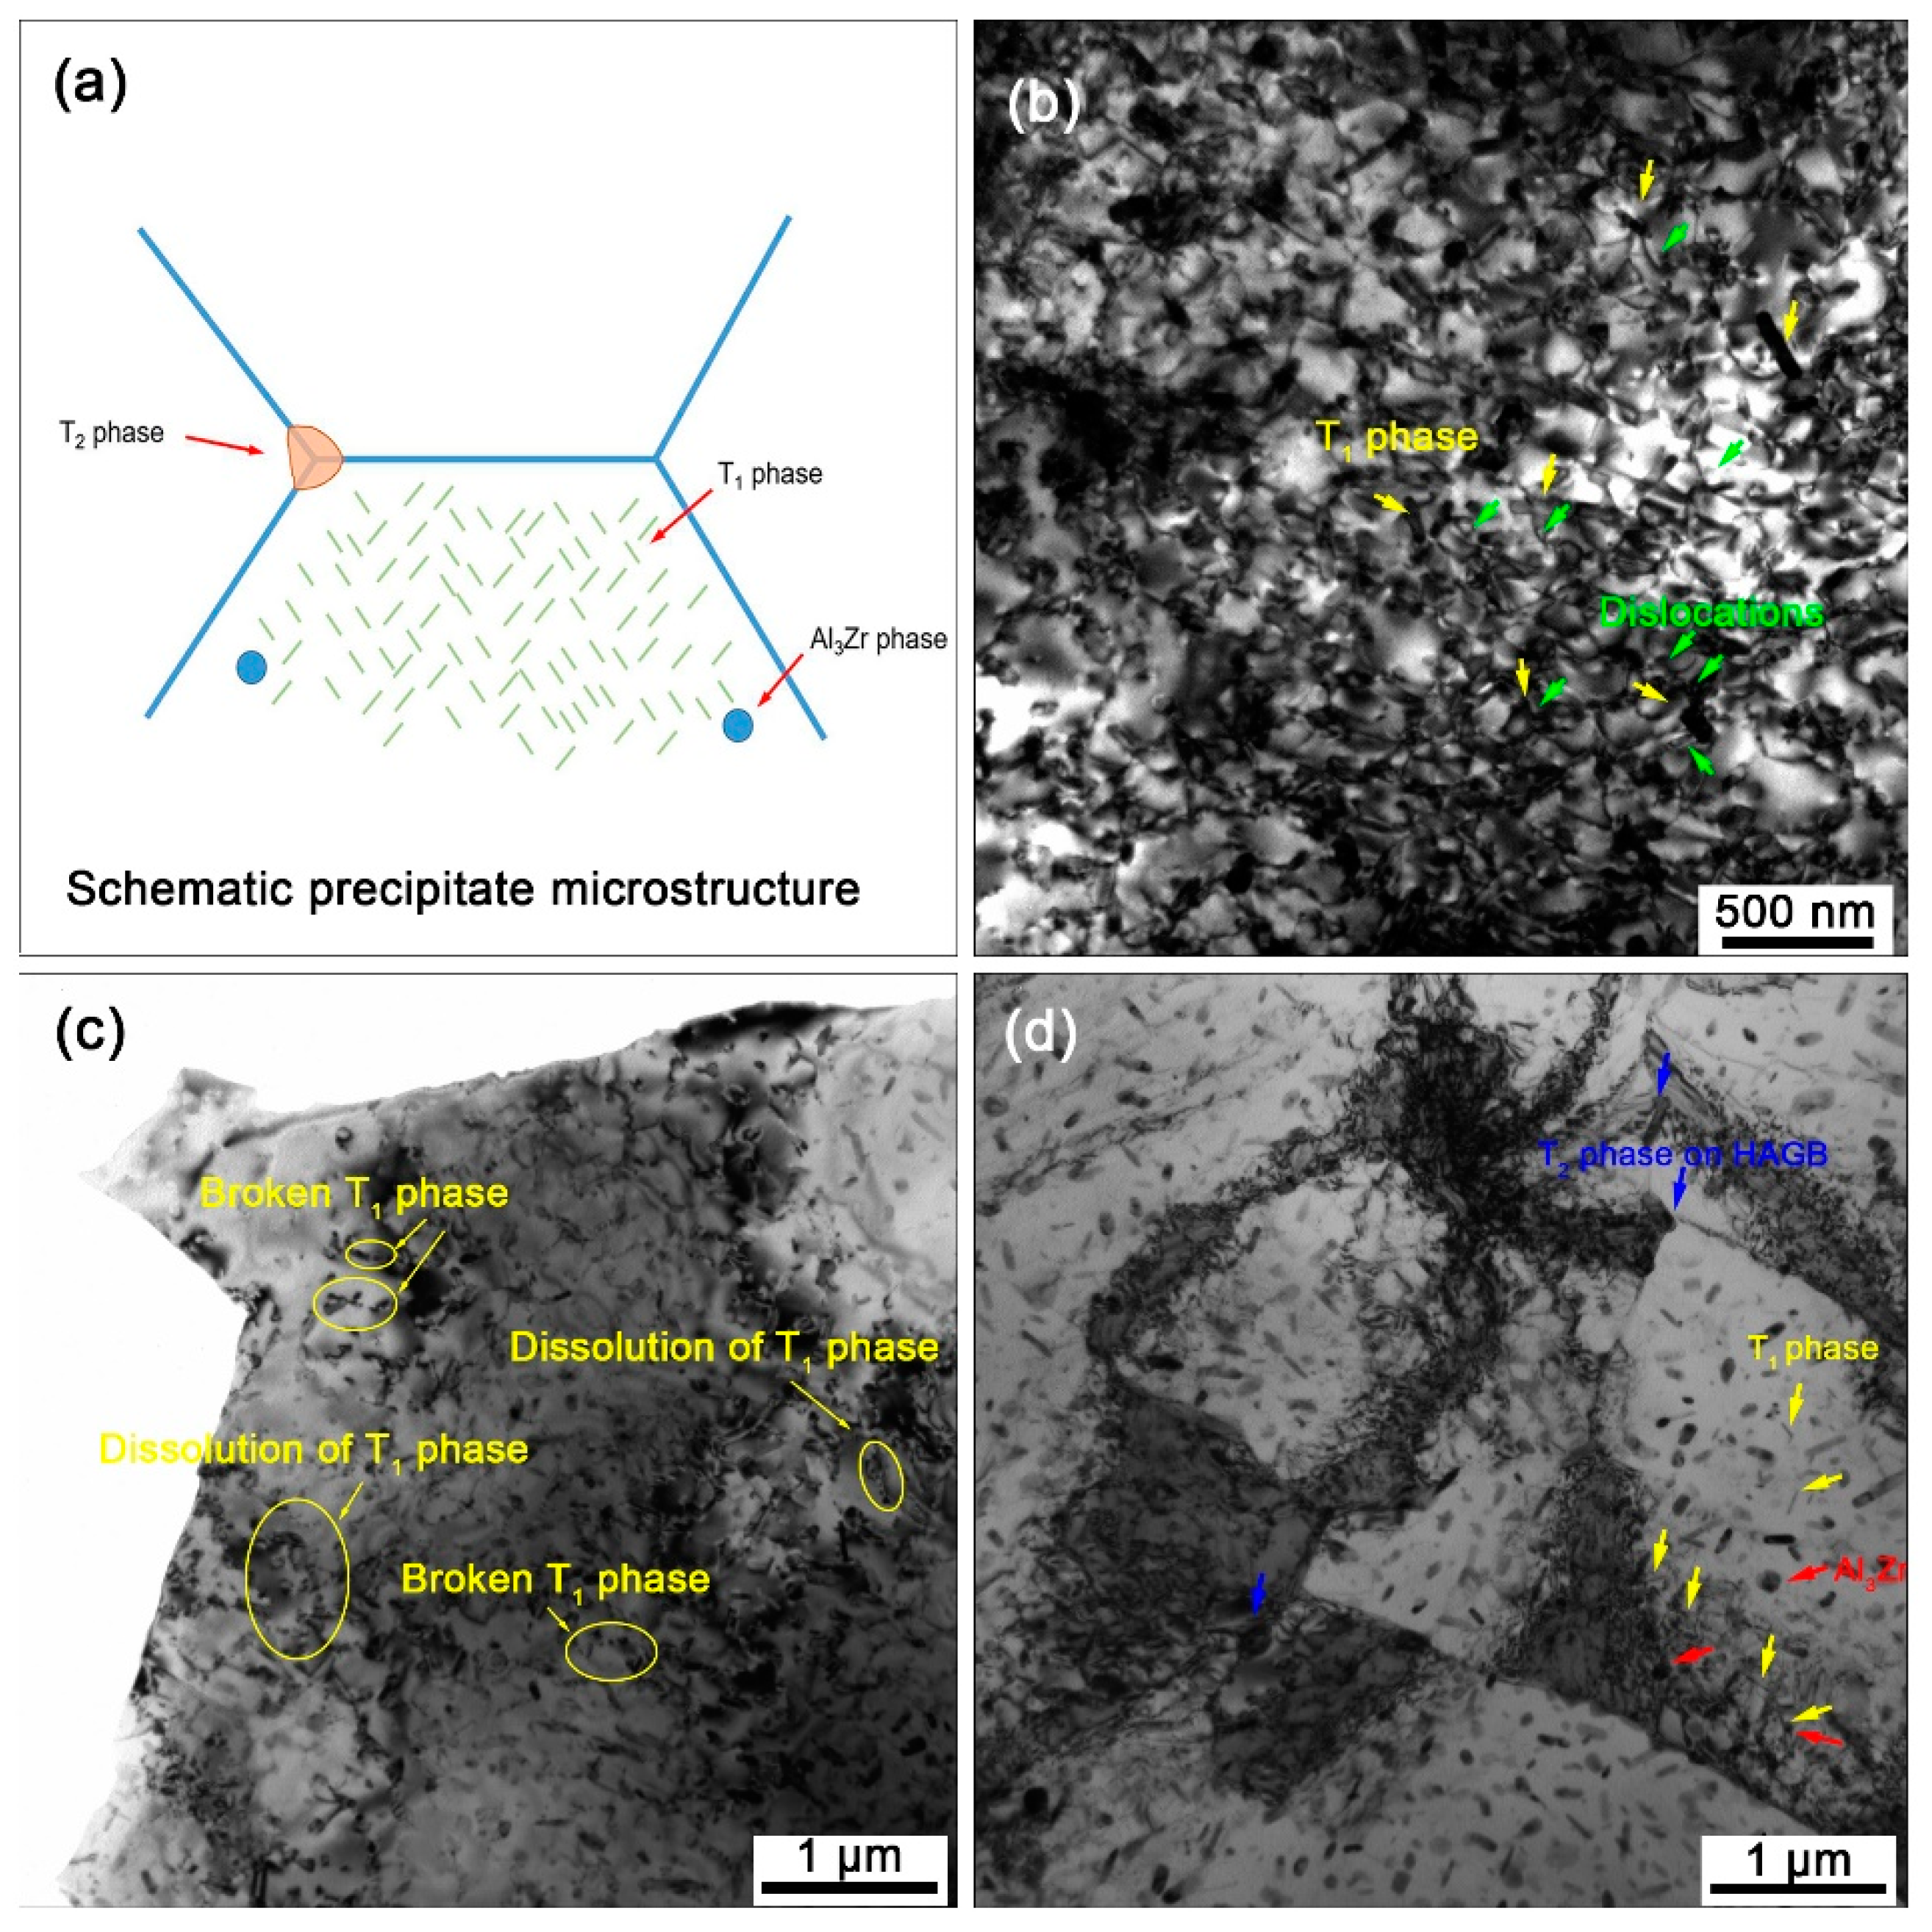
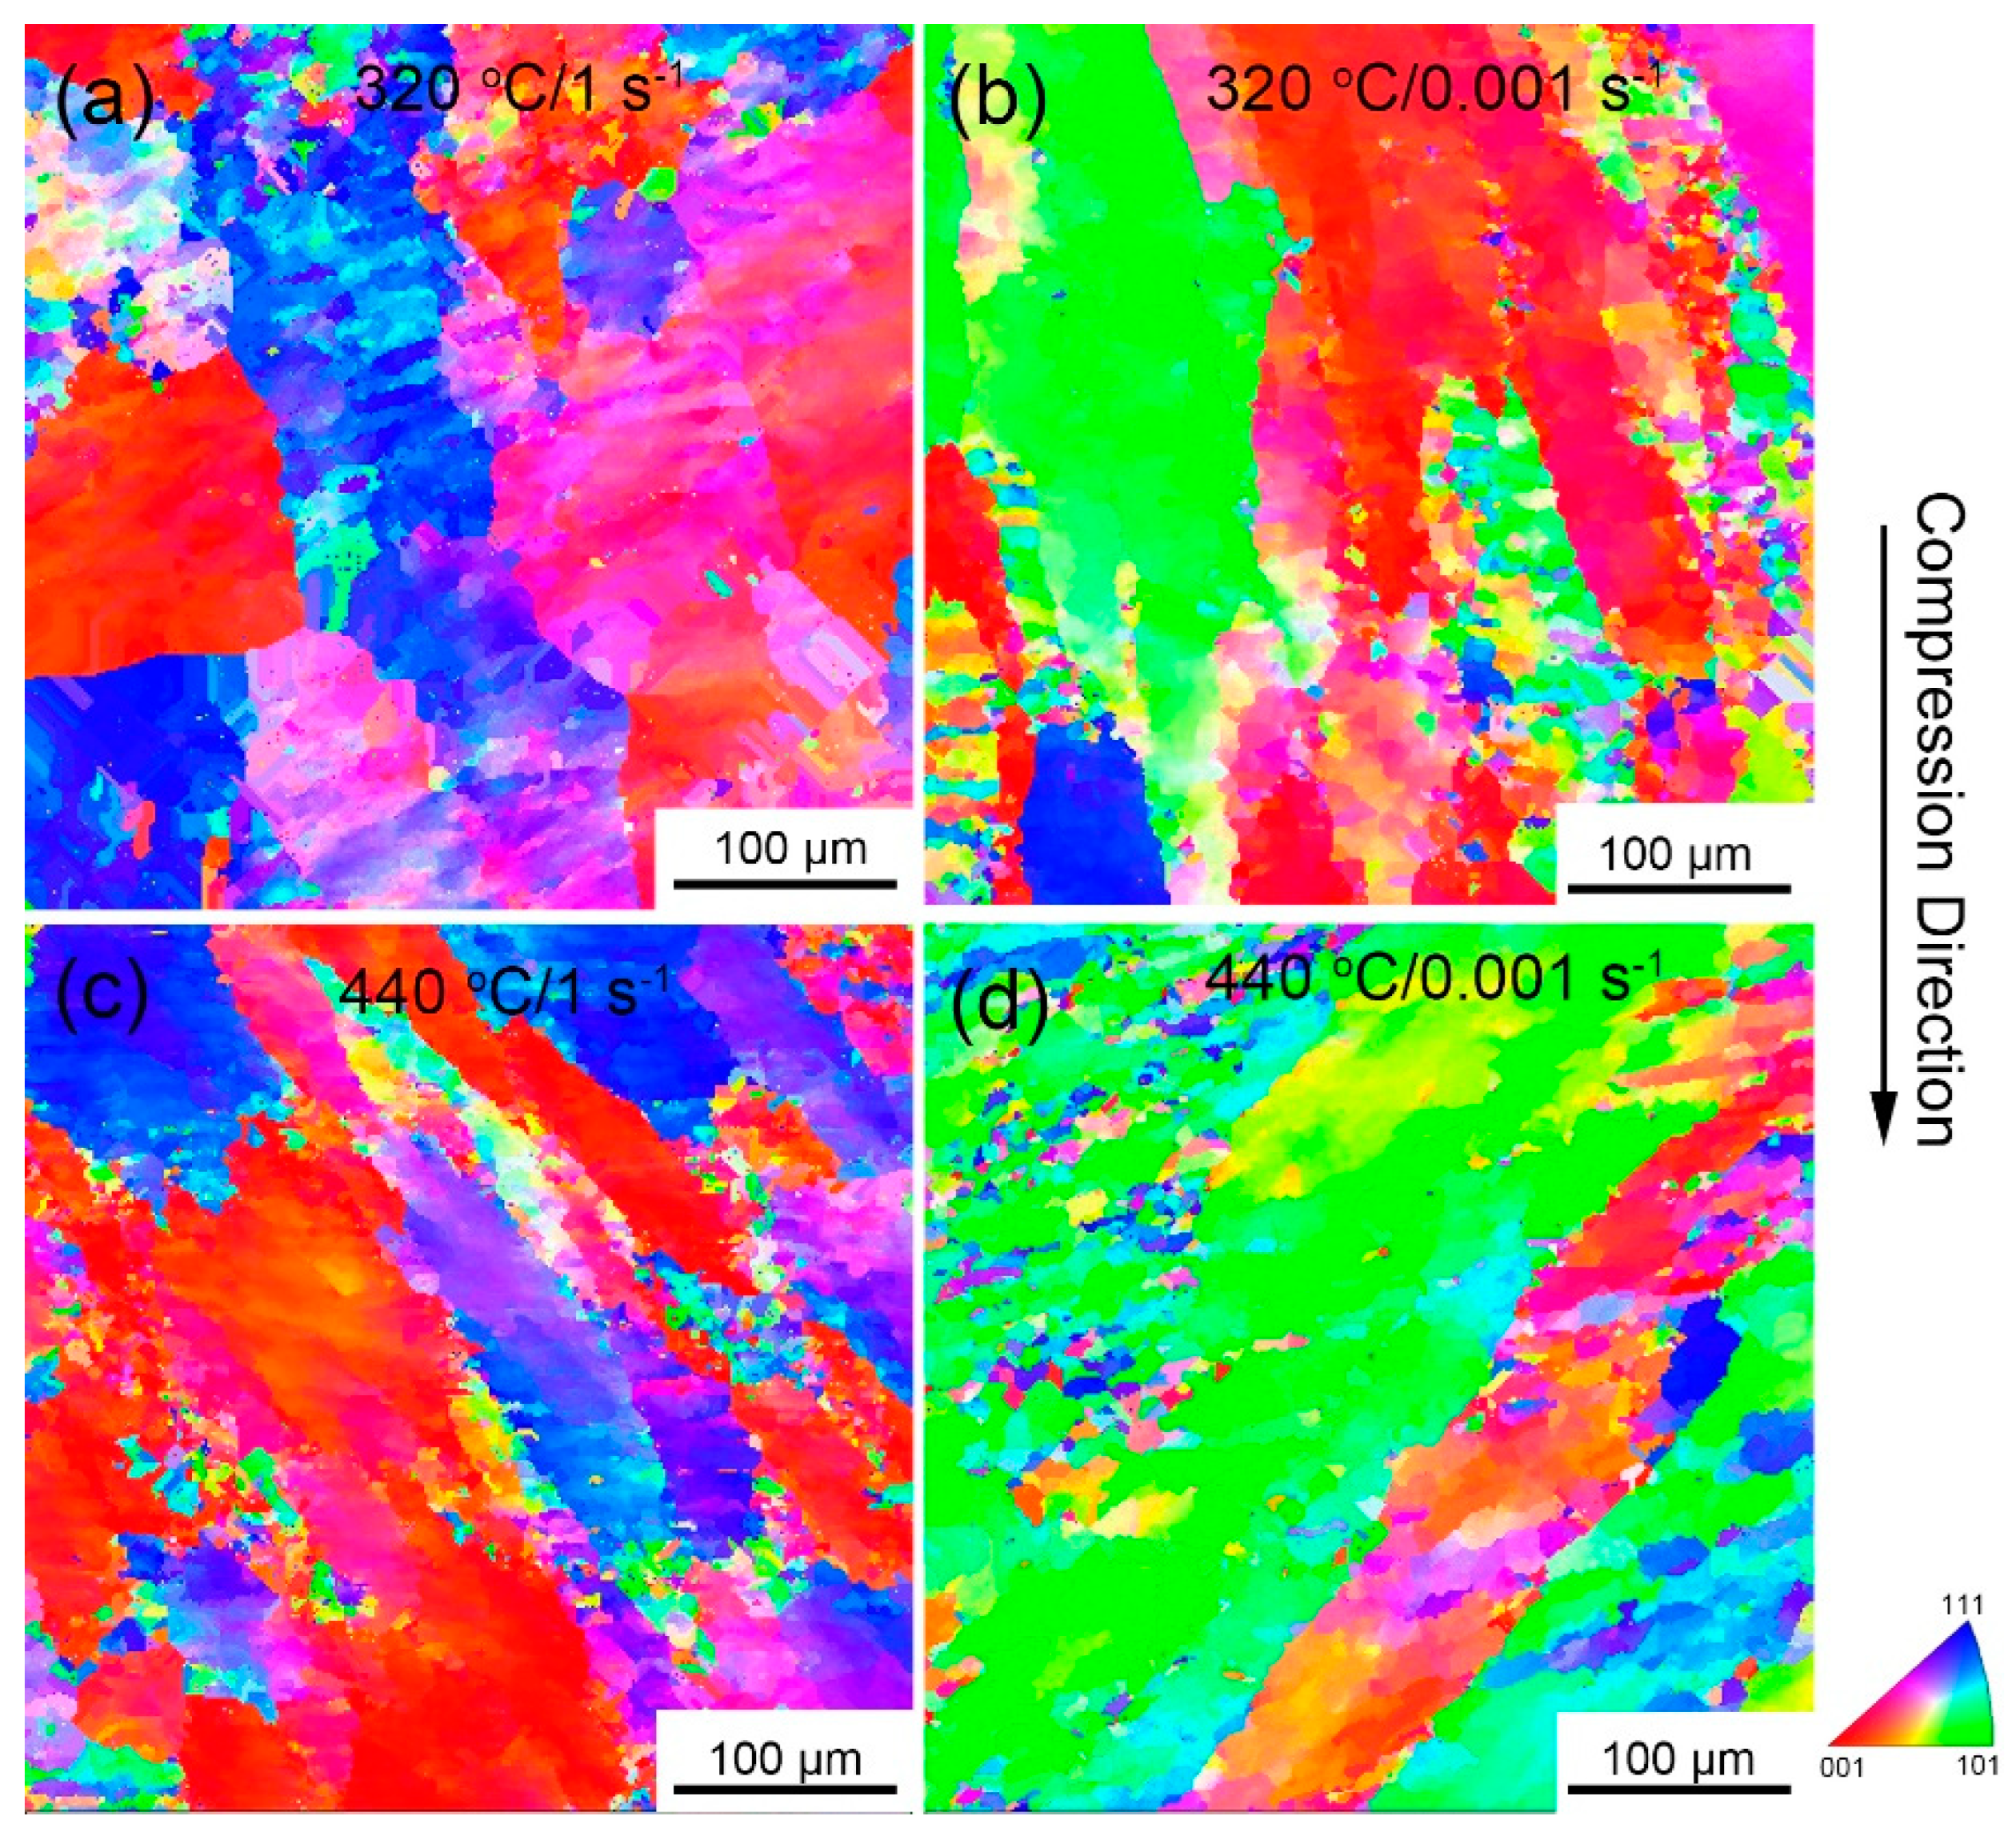
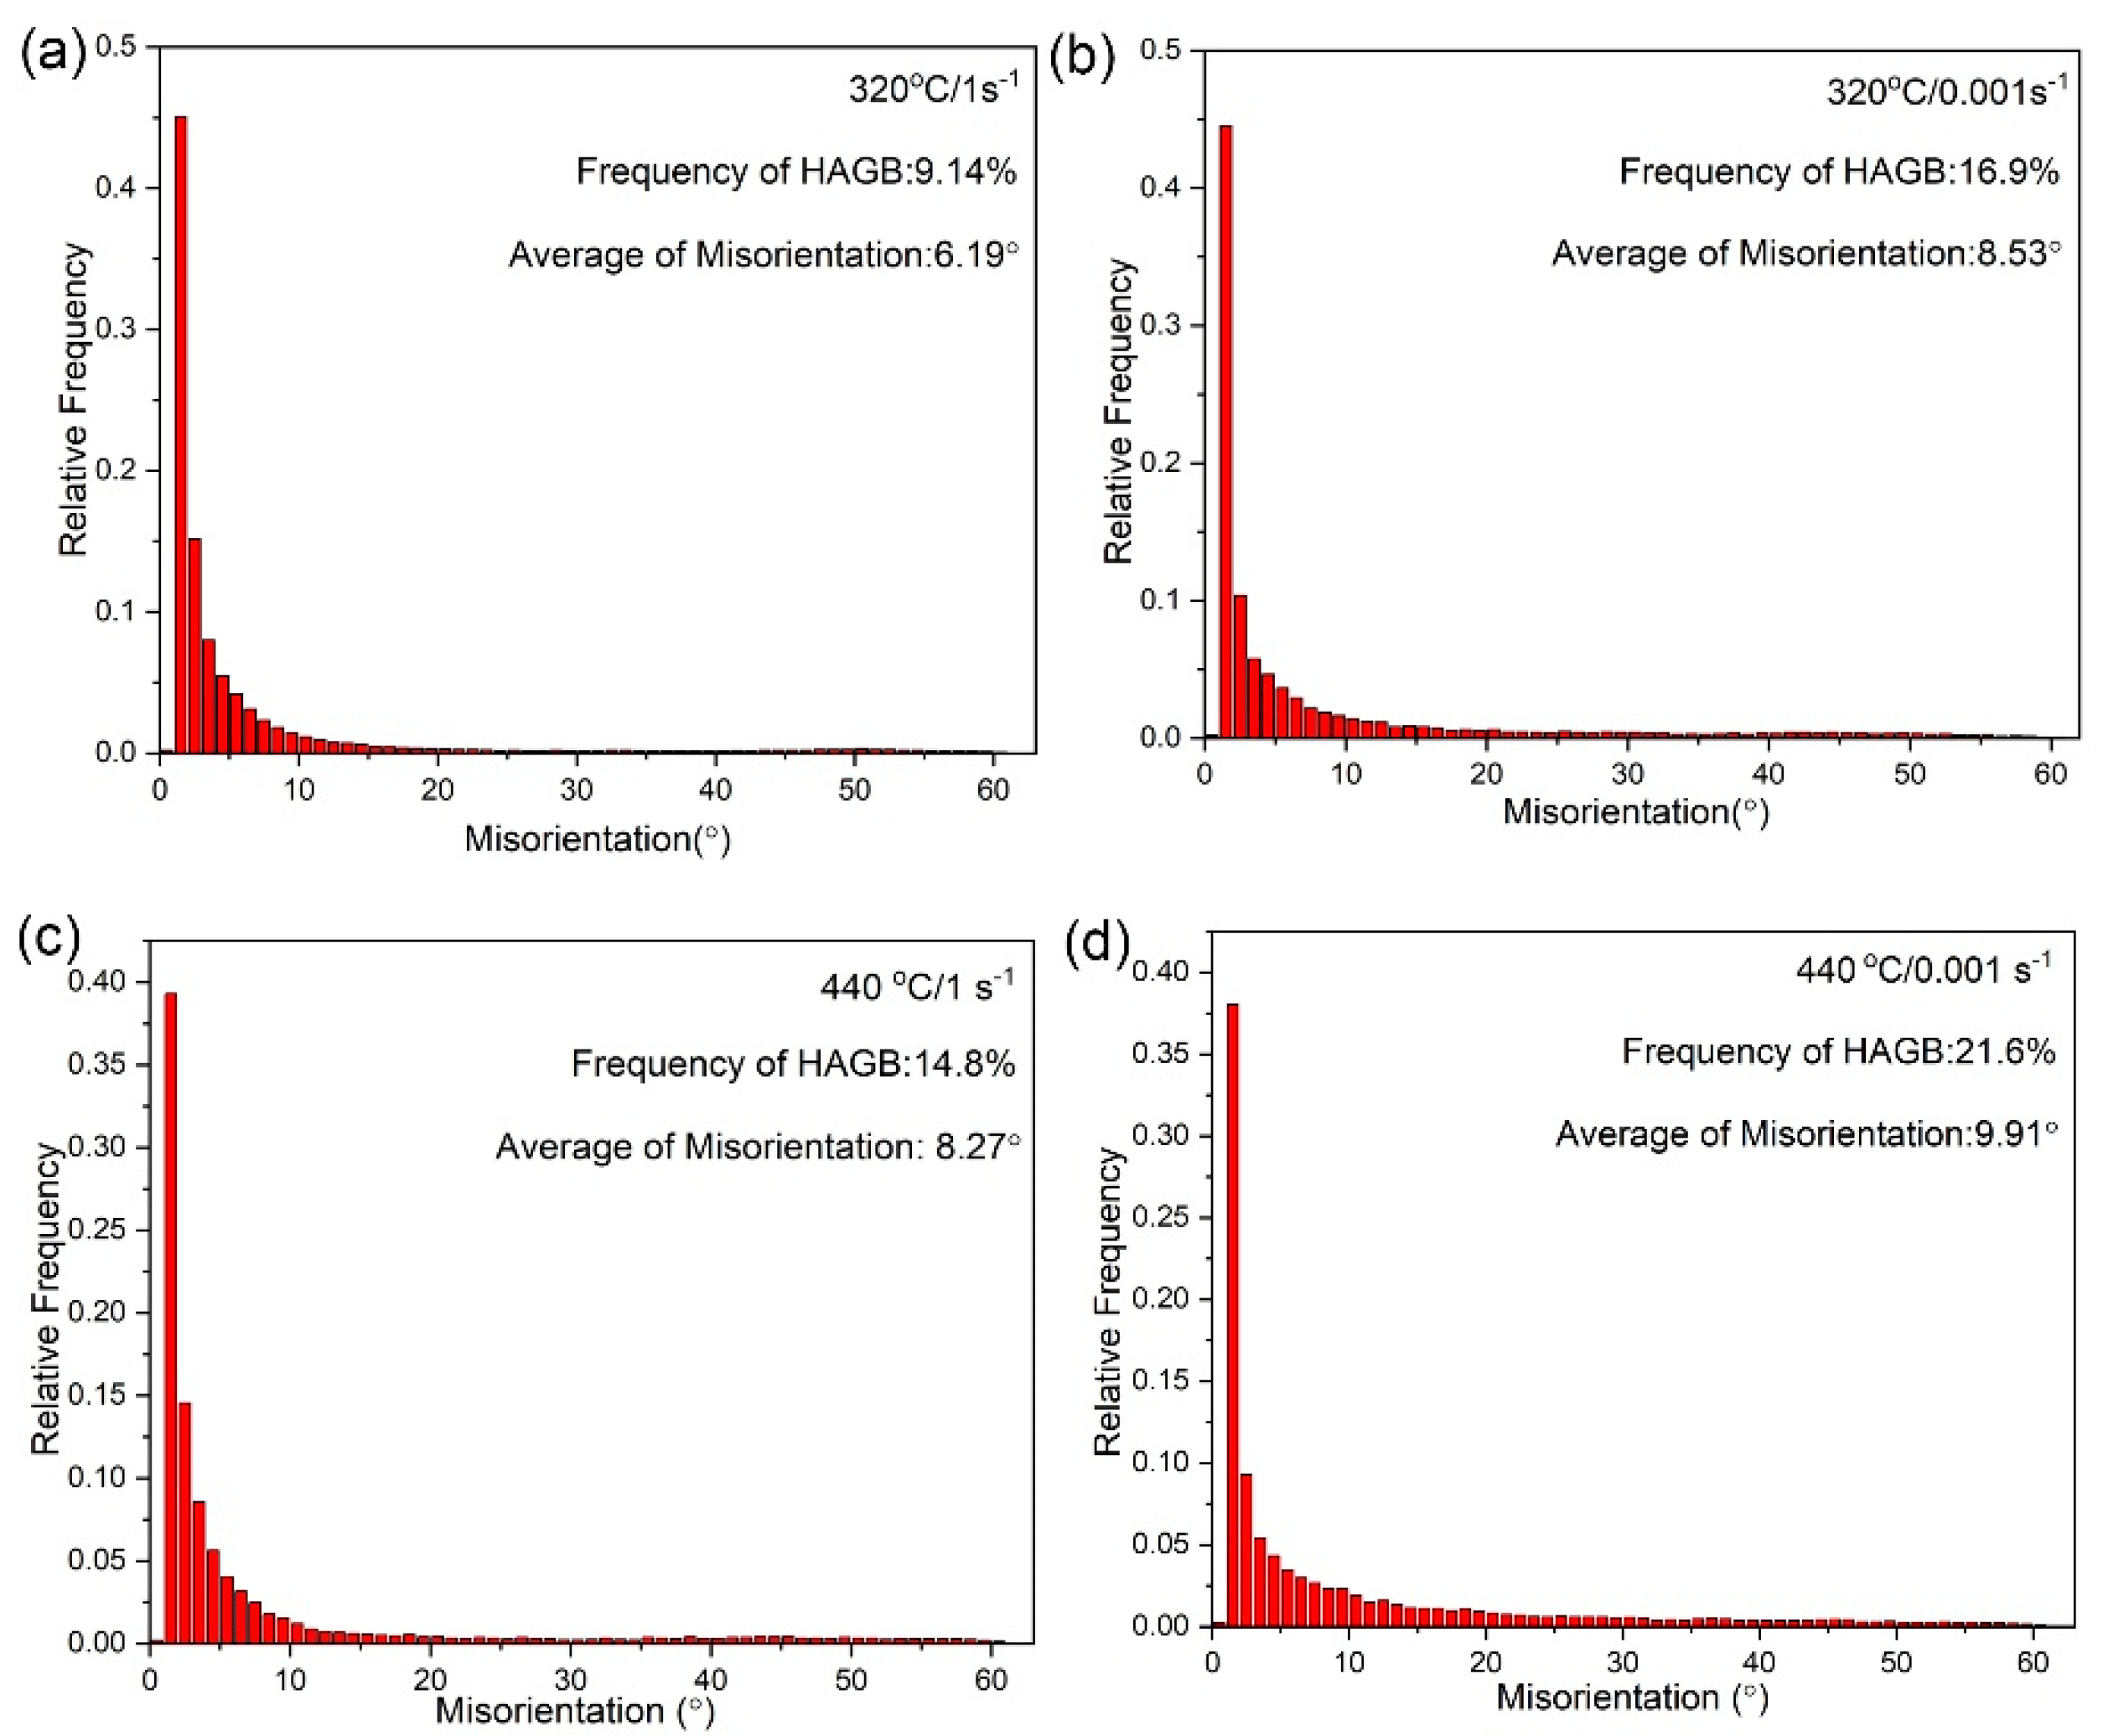
3.2. Microstructures of the Compressed Samples
4. Conclusions
- (1)
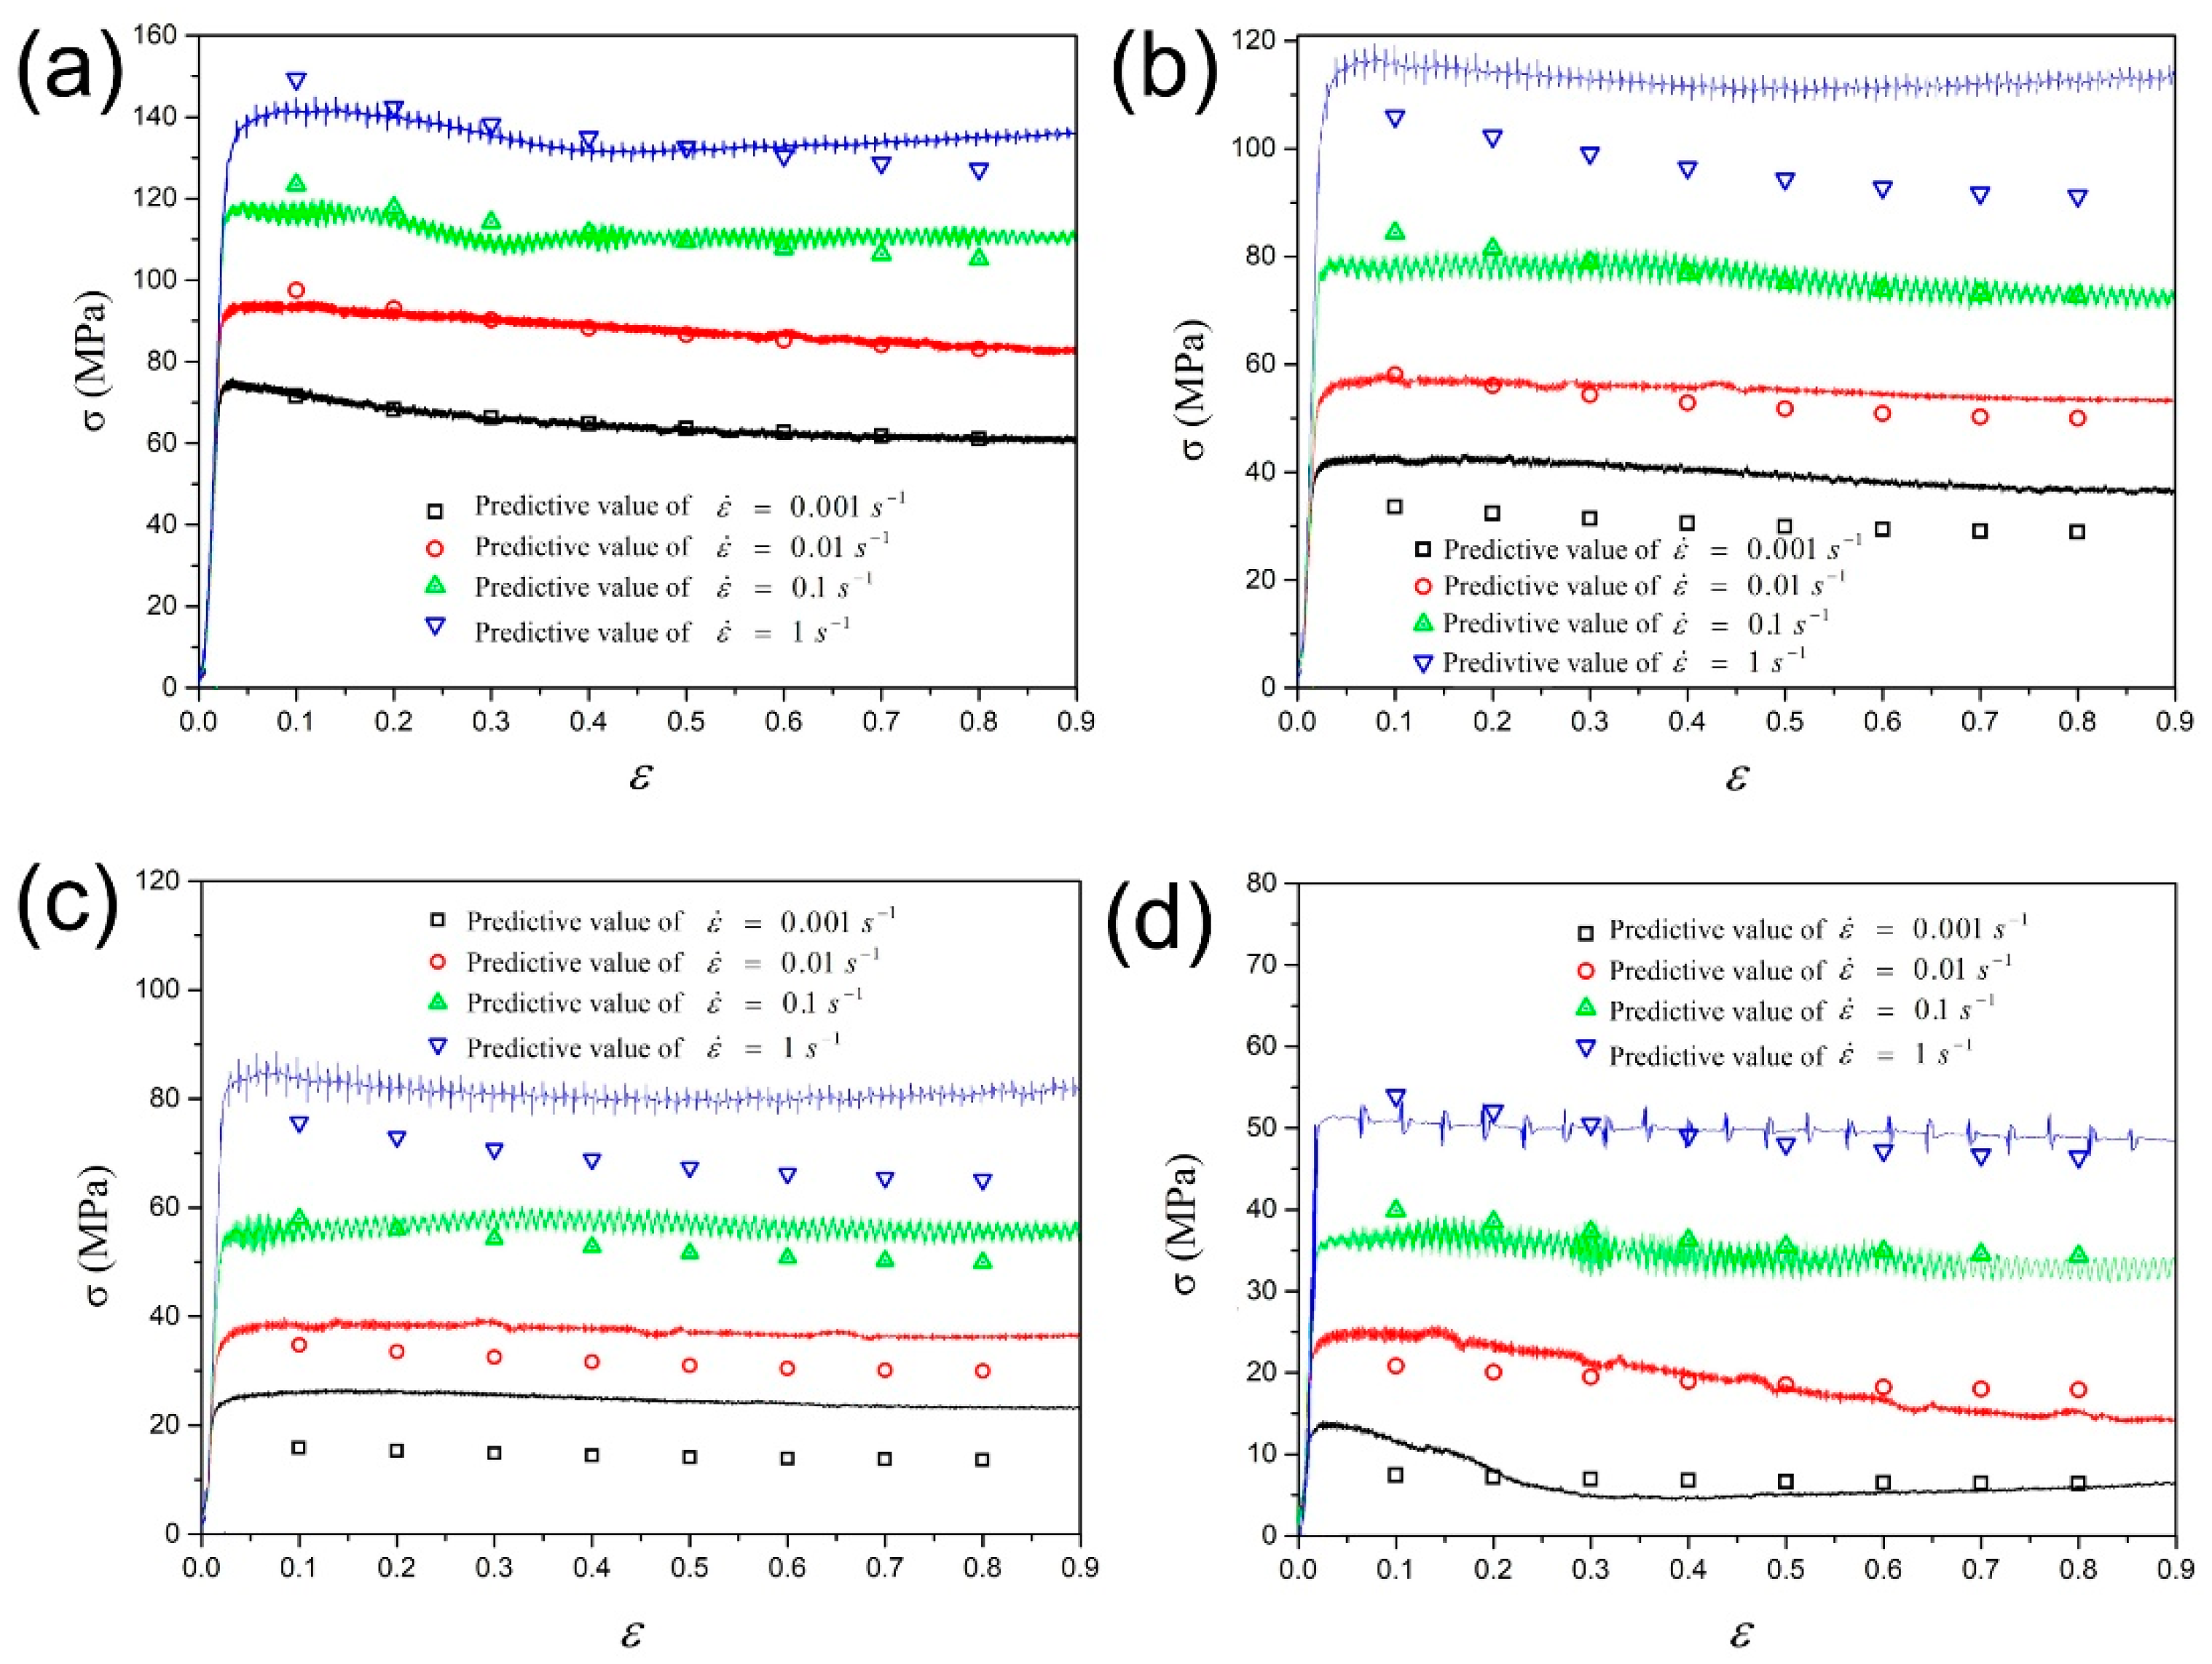
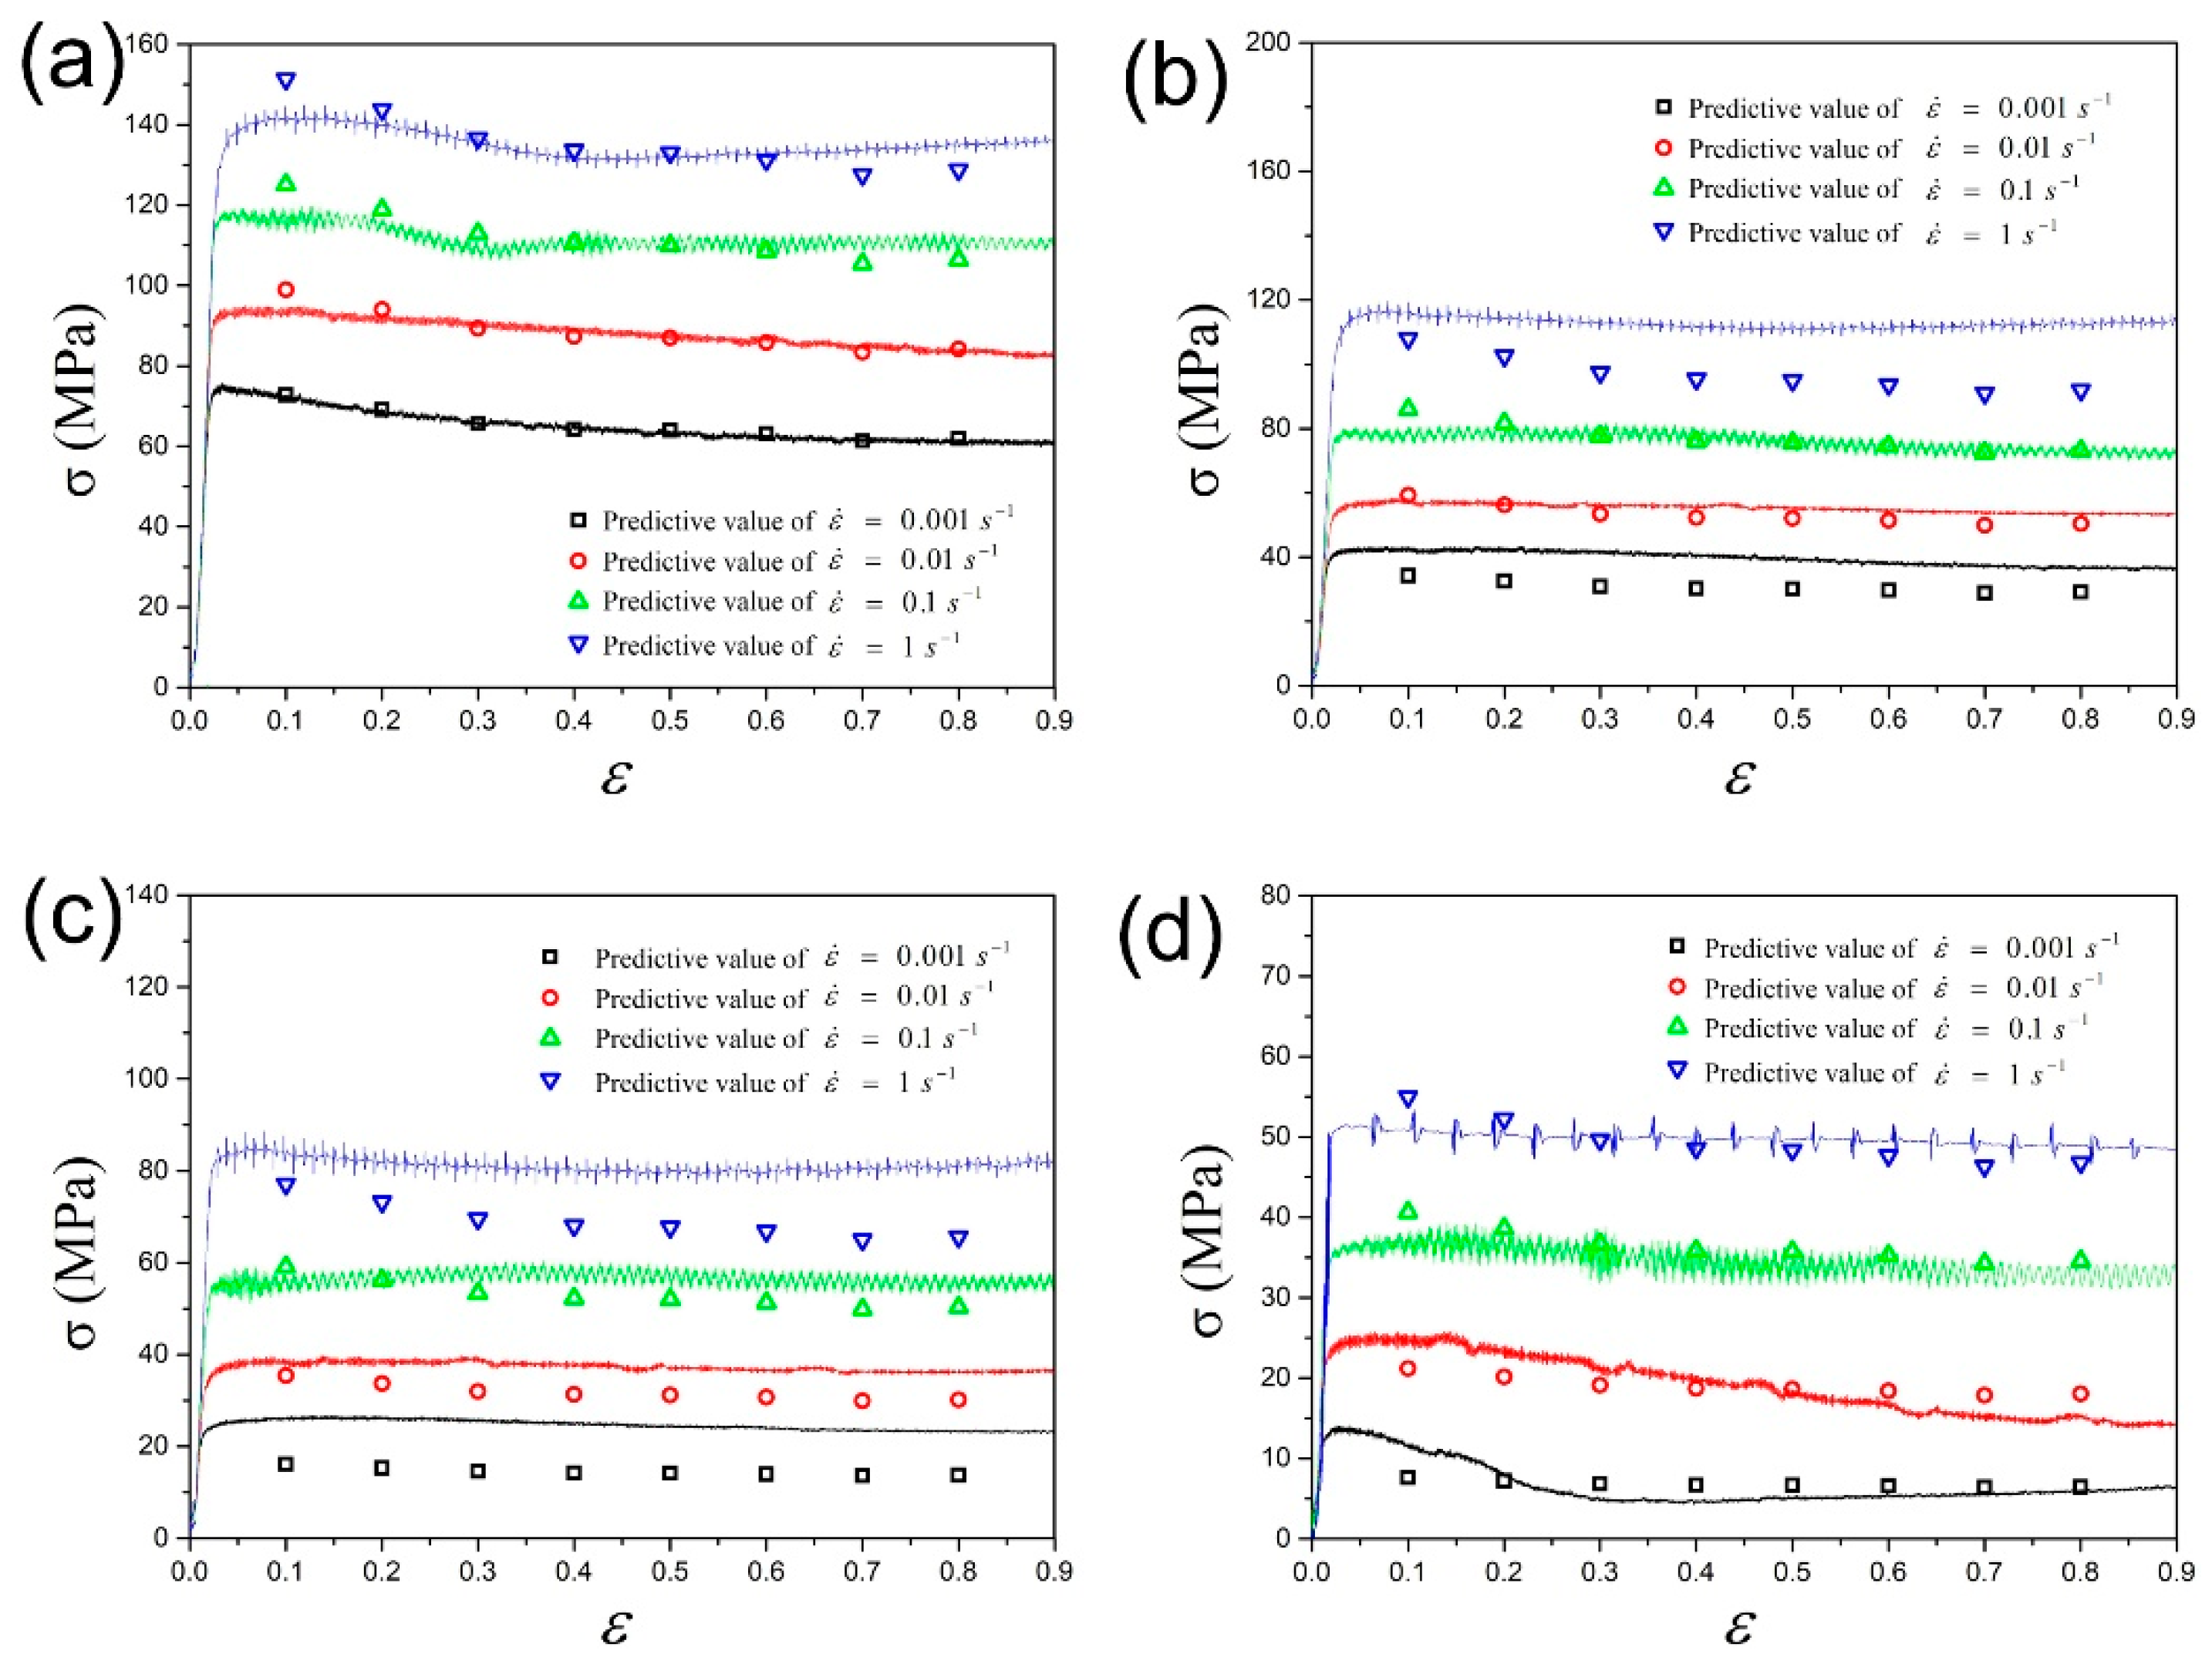
- The constitutive model fitted by a fourth-order polynomial was chosen for the optimal modified Johnson–Cook constitutive model in order to balance the prediction accuracy and model complexity.
- (2)
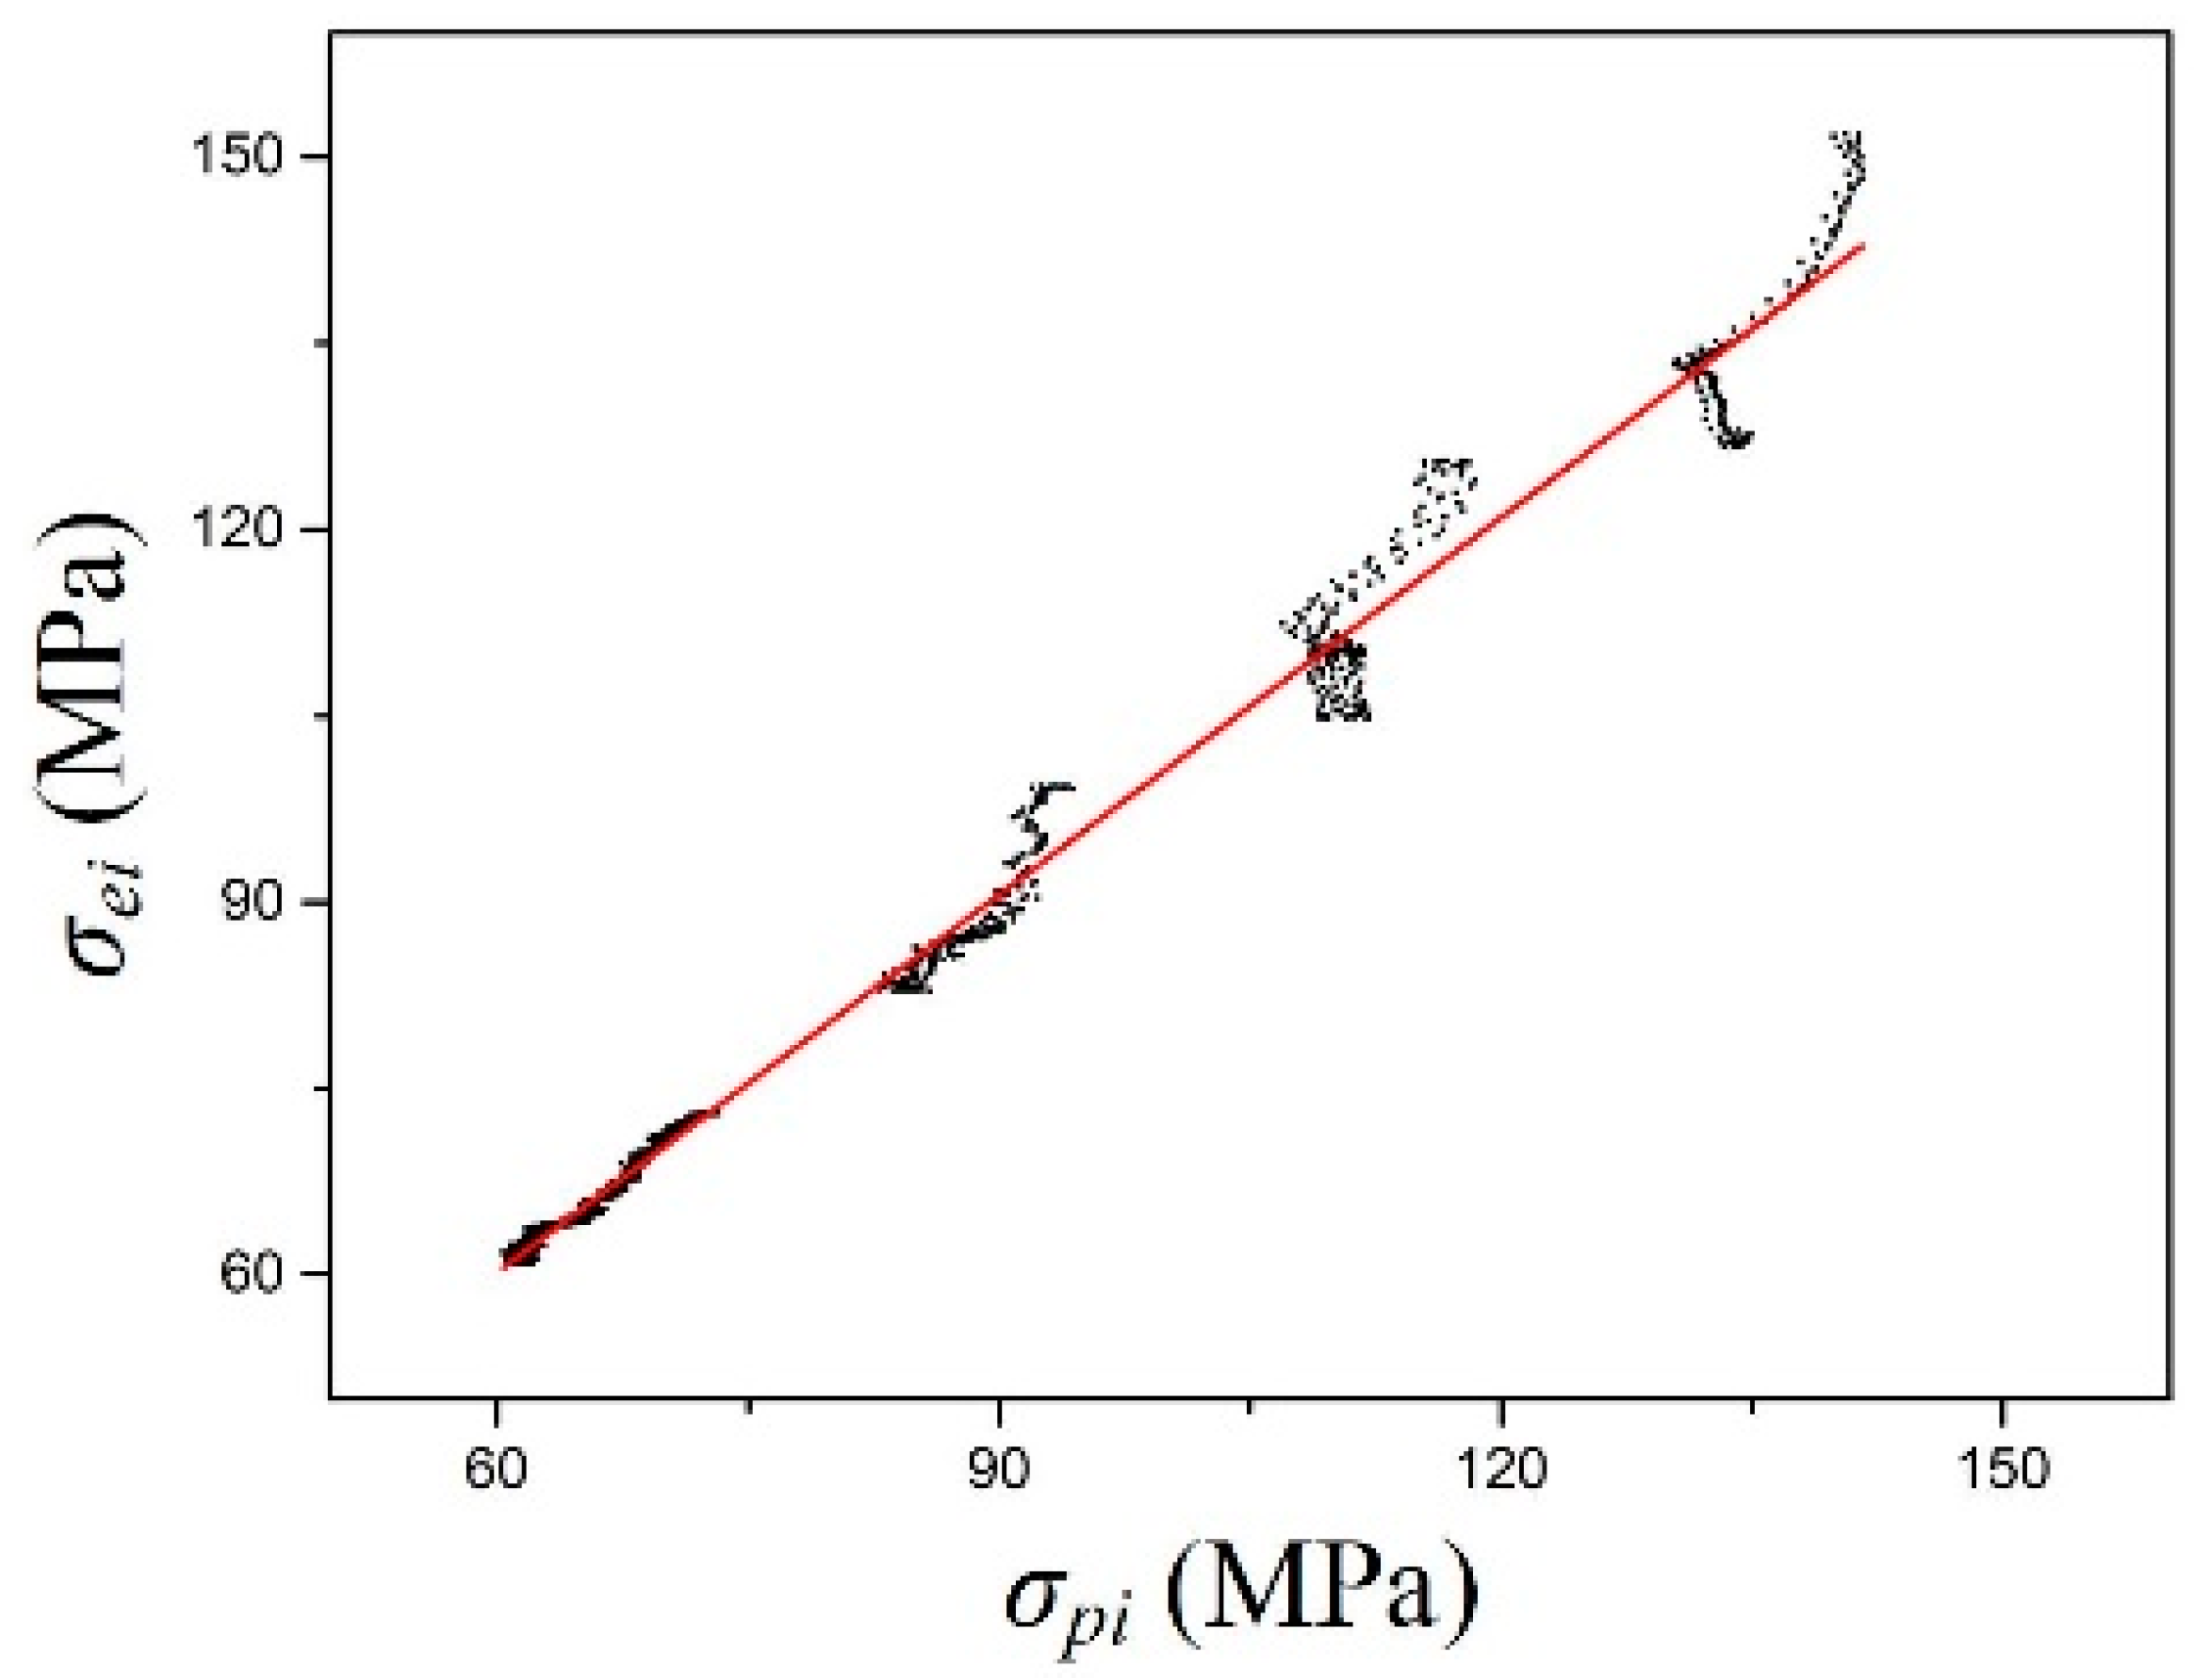
- The modified Johnson–Cook constitutive model could predict the flow stress of the as-extruded AA 2055 alloy during isothermal compression well, especially in the high-temperature zone (around 500 °C) and the low-temperature zone (around 320 °C).
- (3)
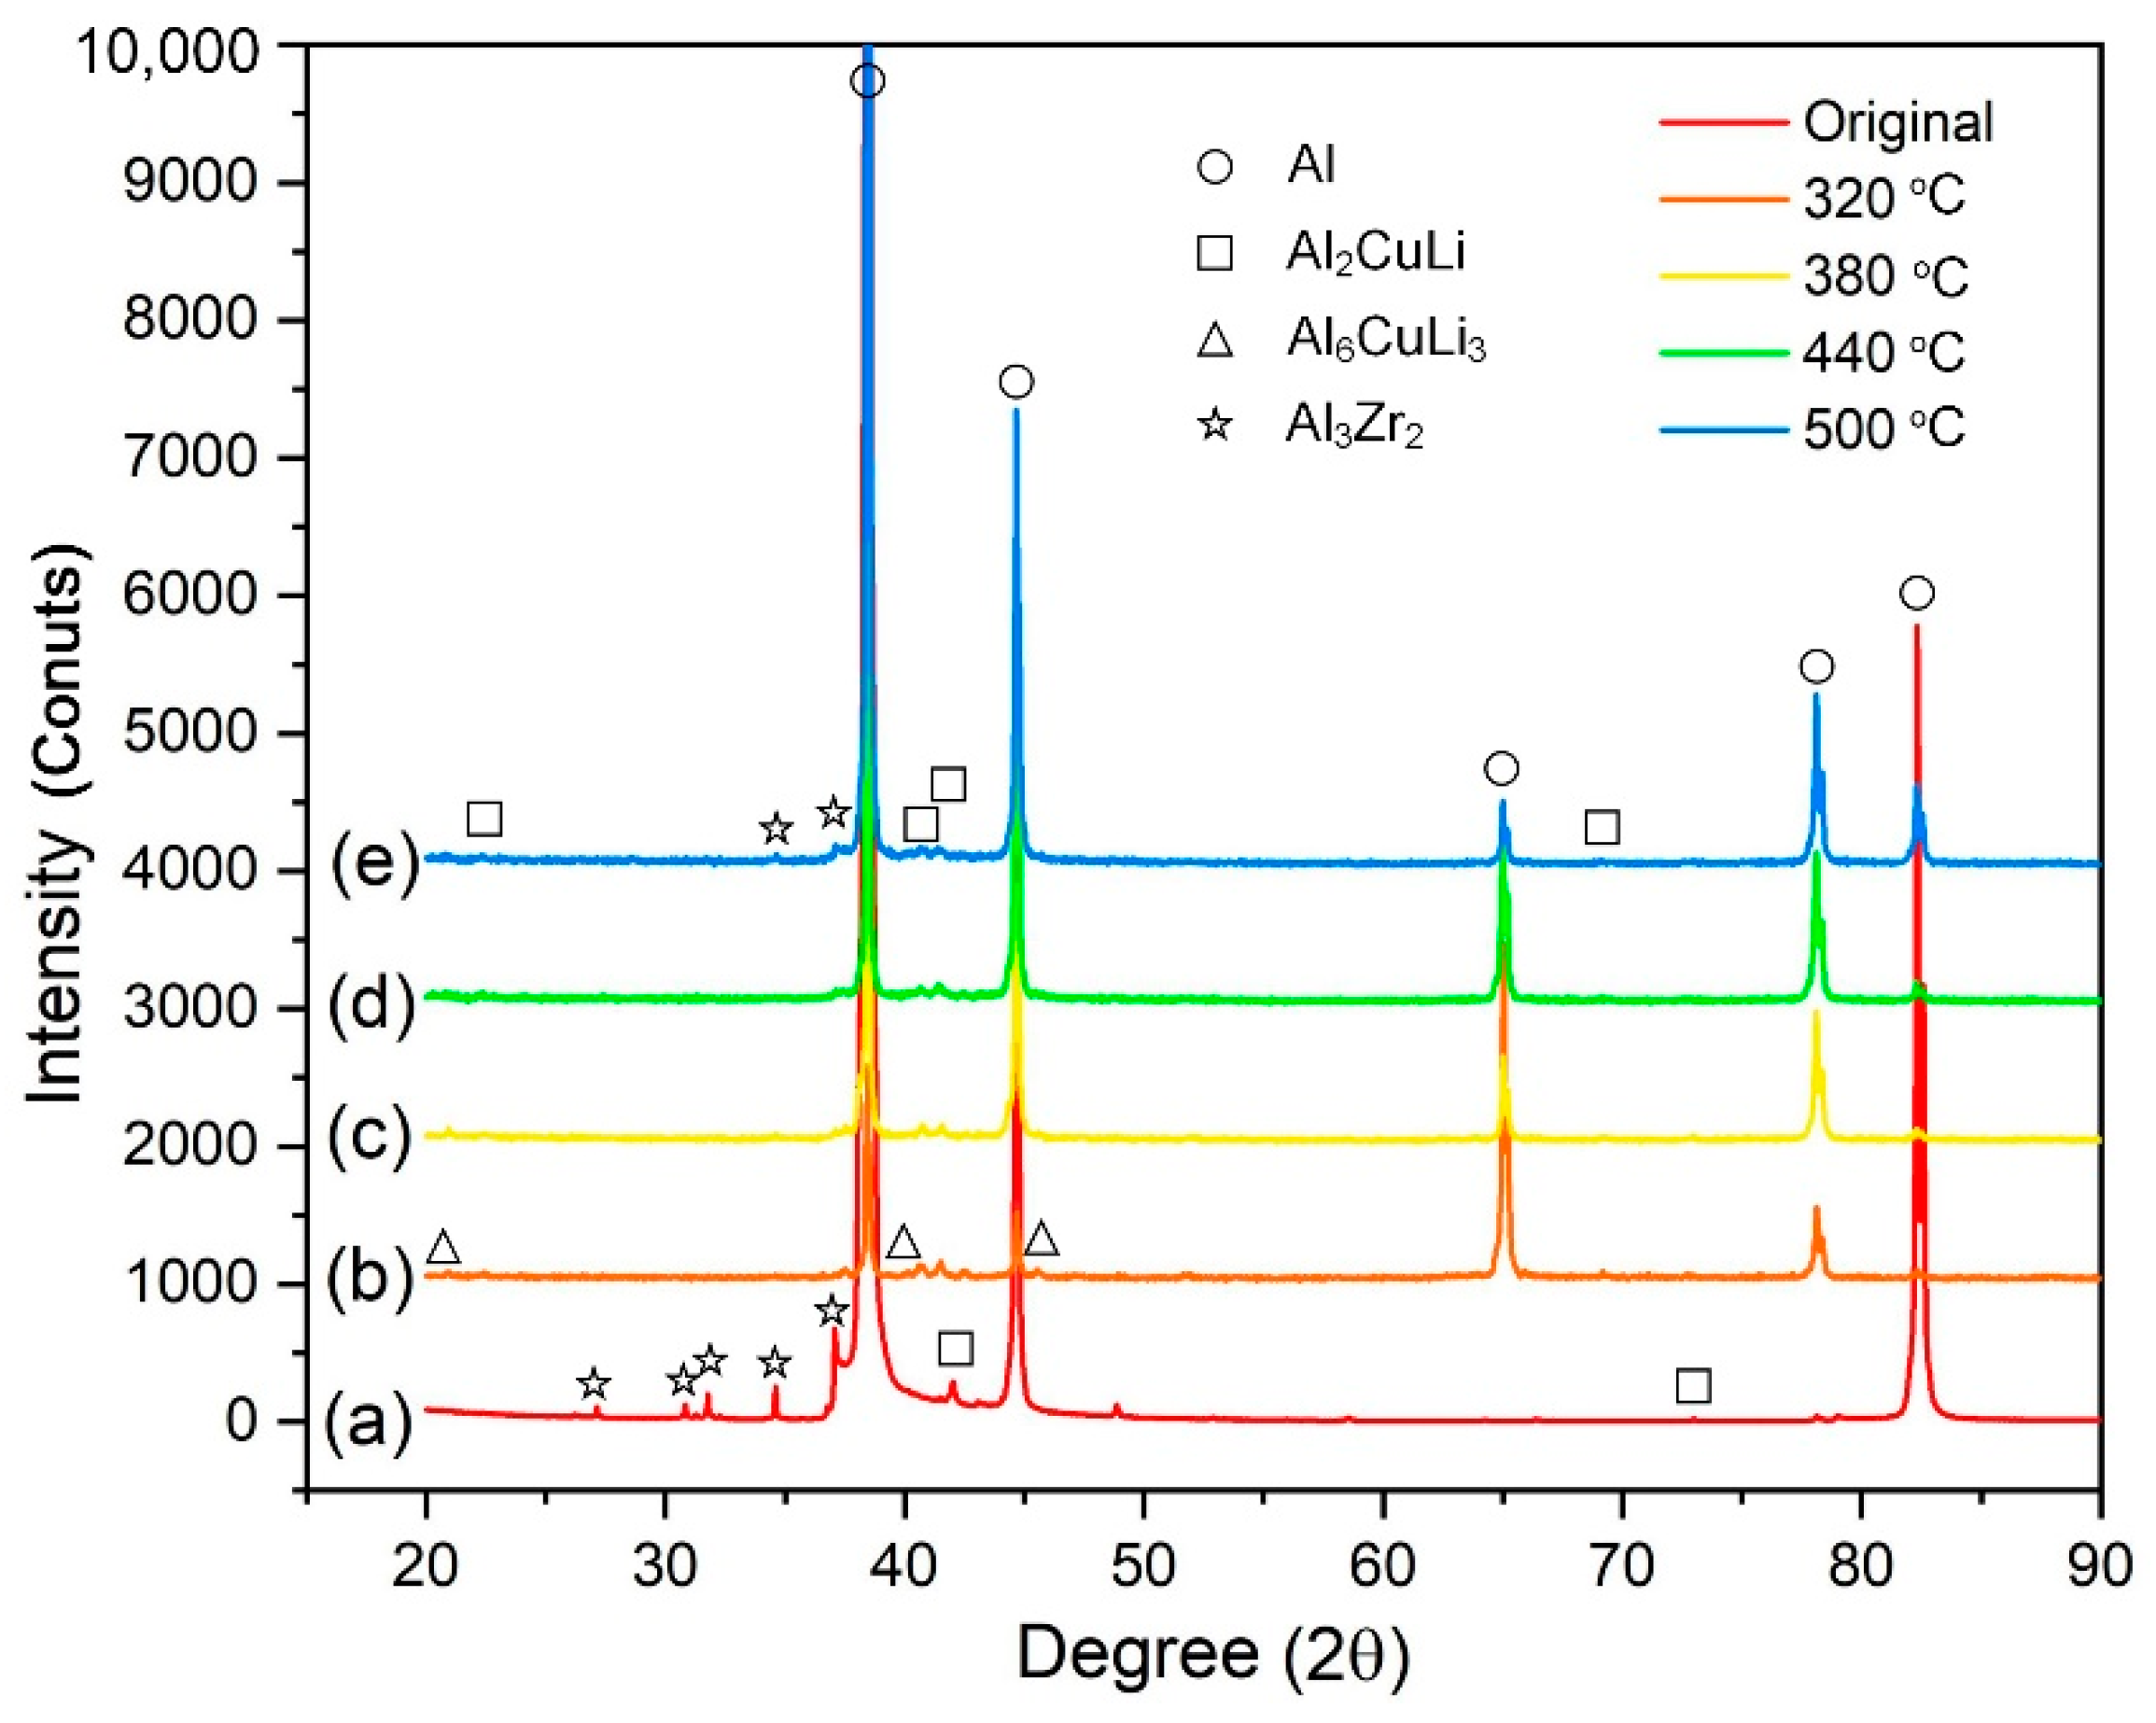
- The massive dense fine precipitates effectively pinned dislocations or subgrain boundaries to accelerate DRV but suppress DRX. An unusual dynamic precipitation of the T2 phase was observed in the compressed samples.
Author Contributions
Funding
Institutional Review Board Statement
Informed Consent Statement
Data Availability Statement
Conflicts of Interest
References
- Zhang, P.; Chen, M. Progress in characterization methods for thermoplastic deforming constitutive models of Al-Li alloys: A review. J. Mater. Sci. 2020, 55, 9828–9847. [Google Scholar] [CrossRef]
- Zhang, Y.; Ling, J.; Li, H.-G.; Luo, X.-Y.; Ba, Z.-X. Effect of pre-deformation and artificial aging on fatigue life of 2198 Al-Li alloy. Mater. Res. Express 2020, 7, 046509. [Google Scholar] [CrossRef]
- Wang, X.; Xiao, D.; Wu, M.; Liu, W. Deformation behavior and microstructure evolution of Al–5.06Mg–1.67Li–0.51Zn alloy under hot compression. J. Mater. Res. Technol. 2021, 15, 4516–4528. [Google Scholar] [CrossRef]
- Zhao, T.; Sato, Y.S.; Xiao, R.; Huang, T.; Zhang, J. Hardness distribution and aging response associated with precipitation behavior in a laser pressure welded Al-Li alloy 2198. Mater. Sci. Eng. A Struct. Mater. Prop. Microstruct. Process. 2021, 808, 140946. [Google Scholar] [CrossRef]
- Zhang, C.; Liu, M.; Meng, Z.; Zhang, Q.; Zhao, G.; Chen, L.; Zhang, H.; Wang, J. Microstructure evolution and precipitation characteristics of spray-formed and subsequently extruded 2195 Al-Li alloy plate during solution and aging process. J. Mater. Process. Technol. 2020, 283, 116718. [Google Scholar] [CrossRef]
- Sun, J.; Wu, G.; Zhang, L.; Zhang, X.; Liu, L.; Zhang, J. Microstructure characteristics of an ultra-high strength extruded Al-4.7Cu–1Li-0.5Mg-0.1Zr–1Zn alloy during heat treatment. J. Alloys Compd. 2020, 813, 152216. [Google Scholar] [CrossRef]
- Li, S.; Wei, B.; Yu, C.; Li, Y.; Xu, G.; Li, Y. Evolution of microstructure and properties during homogenization of the novel Al-Li alloy fabricated by electromagnetic oscillation twin-roll casting. J. Mater. Res. Technol. 2020, 9, 3304–3317. [Google Scholar] [CrossRef]
- Balducci, E.; Ceschini, L.; Messieri, S. High Temperature Tensile Tests of the Lightweight 2099 and 2055 Al-Cu-Li Alloy: A Comparison. JOM 2018, 70, 2716–2725. [Google Scholar] [CrossRef]
- Rioja, R.J.; Liu, J. The Evolution of Al-Li Base Products for Aerospace and Space Applications. Metall. Mater. Trans. A 2012, 43, 3325–3337. [Google Scholar] [CrossRef]
- Xiang, S.; Liu, D.-y.; Zhu, R.-h.; Li, J.-f.; Chen, Y.-l.; Zhang, X.-h. Hot deformation behavior and microstructure evolution of 1460 Al–Li alloy. Trans. Nonferrous Met. Soc. China 2015, 25, 3855–3864. [Google Scholar] [CrossRef]
- Zhu, R.; Liu, Q.; Li, J.; Xiang, S.; Chen, Y.; Zhang, X. Dynamic restoration mechanism and physically based constitutive model of 2050 Al–Li alloy during hot compression. J. Alloys Compd. 2015, 650, 75–85. [Google Scholar] [CrossRef]
- Yang, Q.; Wang, X.; Li, X.; Deng, Z.; Jia, Z.; Zhang, Z.; Huang, G.; Liu, Q. Hot deformation behavior and microstructure of AA2195 alloy under plane strain compression. Mater. Charact. 2017, 131, 500–507. [Google Scholar] [CrossRef]
- Li, S.Q.; Deng, Z.H.; Yang, Q.Y.; Lin, L.; Guo, Y.L.; Zhang, Z.Q. Hot Deformation Behavior of 2195 Al-Li Alloy Under Plane Strain Compression. Rare Met. Mater. Eng. 2018, 47, 553–559. [Google Scholar]
- Jiao, M.Y.; Ma, L.F.; Jia, W.T.; Zhu, Y.C.; Lin, J.B.; Le, Q.C. A new phenomenological model describing the compressive thermal deformation flow stress of cast-rolled AZ31B Mg alloy. Mater. Res. Express 2019, 6, 096597. [Google Scholar] [CrossRef]
- Rezaei Ashtiani, H.R.; Shayanpoor, A.A. Prediction of the Hot flow Behavior of AA1070 Aluminum Using the Phenomenological and Physically-Based Models. Phys. Met. Metallogr. 2021, 122, 1436–1445. [Google Scholar] [CrossRef]
- Li, H.-Y.; Li, Y.-H.; Wang, X.-F.; Liu, J.-J.; Wu, Y. A comparative study on modified Johnson Cook, modified Zerilli–Armstrong and Arrhenius-type constitutive models to predict the hot deformation behavior in 28CrMnMoV steel. Mater. Des. 2013, 49, 493–501. [Google Scholar] [CrossRef]
- Chen, X.; Liao, Q.; Niu, Y.; Jia, W.; Le, Q.; Cheng, C.; Yu, F.; Cui, J. A constitutive relation of AZ80 magnesium alloy during hot deformation based on Arrhenius and Johnson–Cook model. J. Mater. Res. Technol. 2019, 8, 1859–1869. [Google Scholar] [CrossRef]
- Bu, H.Y.; Li, Q.; Li, S.H.; Li, M.N. Comparison of Modified Johnson-Cook Model and Strain-Compensated Arrhenius Constitutive Model for 5CrNiMoV Steel during Compression around Austenitic Temperature. Metals 2022, 12, 1270. [Google Scholar] [CrossRef]
- Zerilli, F.J.; Armstrong, R.W. Dislocation-mechanics-based constitutive relations for material dynamics calculations. J. Appl. Phys. 1987, 61, 1816–1825. [Google Scholar] [CrossRef] [Green Version]
- Shayanpoor, A.A.; Ashtiani, H.R.R. The phenomenological and physical constitutive analysis of hot flow behavior of Al/Cu bimetal composite. Appl. Phys. A Mater. 2022, 128, 636. [Google Scholar] [CrossRef]
- Venkata Ramana, A.; Balasundar, I.; Davidson, M.J.; Balamuralikrishnan, R.; Raghu, T. Constitutive Modelling of a New High-Strength Low-Alloy Steel Using Modified Zerilli–Armstrong and Arrhenius Model. Trans. Indian Inst. Met. 2019, 72, 2869–2876. [Google Scholar] [CrossRef]
- Sani, S.A.; Ebrahimi, G.R.; Vafaeenezhad, H.; Kiani-Rashid, A.R. Modeling of hot deformation behavior and prediction of flow stress in a magnesium alloy using constitutive equation and artificial neural network (ANN) model. J. Magnes. Alloy. 2018, 6, 134–144. [Google Scholar] [CrossRef]
- Ping, L.; Kemin, X.; Yan, L.; Jianrong, T. Neural network prediction of flow stress of Ti–15–3 alloy under hot compression. J. Mater. Process. Technol. 2004, 148, 235–238. [Google Scholar] [CrossRef]
- He, J.; Chen, F.; Wang, B.; Zhu, L.B. A modified Johnson-Cook model for 10%Cr steel at elevated temperatures and a wide range of strain rates. Mater. Sci. Eng. A 2018, 715, 1–9. [Google Scholar] [CrossRef]
- Jiang, D.M.; Yuan, C.Q.; Li, X.; Yu, H. Hot deformation behavior and microstructure characteristic of 2055 Al-Li alloy during uniaxial compression. Mater. Res. Express 2020, 7, 14. [Google Scholar] [CrossRef]
- Jia, Z.H.; Couzinie, J.P.; Cherdoudi, N.; Guillot, I.; Arnberg, L.; Asholt, P.; Brusethaug, S.; Barlas, B.; Massinon, D. Precipitation behaviour of Al3Zr precipitate in Al-Cu-Zr and Al-Cu-Zr-Ti-V alloys. Trans. Nonferrous Met. Soc. China 2012, 22, 1860–1865. [Google Scholar] [CrossRef]
- Decreus, B.; Deschamps, A.; De Geuser, F.; Donnadieu, P.; Sigli, C.; Weyland, M. The influence of Cu/Li ratio on precipitation in Al-Cu-Li-x alloys. Acta Mater. 2013, 61, 2207–2218. [Google Scholar] [CrossRef]
- Deschamps, A.; Decreus, B.; De Geuser, F.; Dorin, T.; Weyland, M. The influence of precipitation on plastic deformation of Al–Cu–Li alloys. Acta Mater. 2013, 61, 4010–4021. [Google Scholar] [CrossRef]
- Huang, K.; Marthinsen, K.; Zhao, Q.; Logé, R.E. The double-edge effect of second-phase particles on the recrystallization behaviour and associated mechanical properties of metallic materials. Prog. Mater. Sci. 2018, 92, 284–359. [Google Scholar] [CrossRef]
- Ou, L.; Zheng, Z.; Nie, Y.; Jian, H. Hot deformation behavior of 2060 alloy. J. Alloys Compd. 2015, 648, 681–689. [Google Scholar] [CrossRef]
- Yu, W.; Li, H.; Du, R.; You, W.; Zhao, M.; Wang, Z.-a. Characteristic constitution model and microstructure of an Al-3.5Cu-1.5Li alloy subjected to thermal deformation. Mater. Charact. 2018, 145, 53–64. [Google Scholar] [CrossRef]
- Niu, L.Q.; Cao, M.; Liang, Z.L.; Han, B.; Zhang, Q. A modified Johnson-Cook model considering strain softening of A356 alloy. Mater. Sci. Eng. A Struct. Mater. Prop. Microstruct. Process. 2020, 789, 139612. [Google Scholar] [CrossRef]
- Chen, X.M.; Lin, Y.C.; Hu, H.W.; Luo, S.C.; Zhou, X.J.; Huang, Y. An Enhanced Johnson-Cook Model for Hot Compressed A356 Aluminum Alloy. Adv. Eng. Mater. 2021, 23, 2000704. [Google Scholar] [CrossRef]
- Chao, Z.L.; Jiang, L.T.; Chen, G.Q.; Zhang, Q.; Zhang, N.B.; Zhao, Q.Q.; Pang, B.J.; Wu, G.H. A modified Johnson-Cook model with damage degradation for B4Cp/Al composites. Compos. Struct. 2022, 282, 115029. [Google Scholar] [CrossRef]
- Wang, X.Y.; Jiang, J.T.; Li, G.A.; Wang, X.M.; Sun, J.; Zhen, L. Effects of coarse Al2CuLi phase on the hot deformation behavior of Al-Li alloy. J. Alloys Compd. 2020, 815, 152469. [Google Scholar] [CrossRef]
- Wang, S.C.; Starink, M.J. Precipitates and intermetallic phases in precipitation hardening Al–Cu–Mg–(Li) based alloys. Int. Mater. Rev. 2005, 50, 193–215. [Google Scholar] [CrossRef] [Green Version]
- Sha, G.; Wang, Y.B.; Liao, X.Z.; Duan, Z.C.; Ringer, S.P.; Langdon, T.G. Influence of equal-channel angular pressing on precipitation in an Al–Zn–Mg–Cu alloy. Acta Mater. 2009, 57, 3123–3132. [Google Scholar] [CrossRef]
- Yang, S.L.; Shen, J.; Li, X.W.; Yan, X.D.; Zhang, Y.G.; Li, Z.H.; Huang, S.H.; Xiong, B.Q. Mechanical Behavior and Microstructure Evolution of Al-Cu-Li Alloy during Multi-Pass Hot Deformation. Rare Met. Mater. Eng. 2017, 46, 2825–2830. [Google Scholar]
- Garcia-Infanta, J.M.; Swaminathan, S.; Cepeda-Jimenez, C.M.; McNelley, T.R.; Ruano, O.A.; Carreno, F. Enhanced grain refinement due to deformation-induced precipitation during ambient-temperature severe plastic deformation of an Al-7%Si alloy. J. Alloys Compd. 2009, 478, 139–143. [Google Scholar] [CrossRef]
- Tsivoulas, D.; Robson, J.D.; Sigli, C.; Prangnell, P.B. Interactions between zirconium and manganese dispersoid-forming elements on their combined addition in Al–Cu–Li alloys. Acta Mater. 2012, 60, 5245–5259. [Google Scholar] [CrossRef]
- Wang, X.Y.; Jiang, J.T.; Li, G.A.; Wang, X.M.; Shao, W.-Z.; Zhen, L. Particle-stimulated nucleation and recrystallization texture initiated by coarsened Al2CuLi phase in Al–Cu–Li alloy. J. Mater. Res. Technol. 2021, 10, 643–650. [Google Scholar] [CrossRef]


| Model | A1 | A2 | A3 | A4 | A5 | A6 | A7 | A8 | A9 | A10 |
|---|---|---|---|---|---|---|---|---|---|---|
| Polynomial of second order | 74.1956 | −30.2023 | 17.7964 | 0.156564 | −0.01255 | 0.0021 | −0.000158905 | - | - | - |
| Polynomial of third order | 73.8173 | −23.176 | −5.02855 | 19.0750 | 0.156445 | −0.01255 | 0.0021 | −0.000158905 | - | - |
| Polynomial of fourth order | 72.2395 | 17.4164 | −235.842 | 466.424 | −276.519 | 0.156543 | −0.01255 | 0.0021 | −0.000158905 | - |
| Polynomial of fifth order | 69.6888 | 103.5759 | −993.862 | 3003.928 | −3835.08 | 1764.705 | 0.1563425 | −0.01255 | 0.0021 | −0.000158846 |
| Power-exponential function | 122.498 | −62.6614 | 0.09106 | 0.156746 | −0.01255 | 0.0021 | −0.000158905 | - | - | - |
| Models | Polynomial of 2nd Order | Polynomial of 3rd Order | Polynomial of 4th Order | Polynomial of 5th Order | Power-Exponential Function |
|---|---|---|---|---|---|
| AARE (%) | 10.6722 | 9.6964 | 8.7812 | 8.7238 | 10.6481 |
| R | 0.9639 | 0.9842 | 0.9843 | 0.9847 | 0.9845 |
Publisher’s Note: MDPI stays neutral with regard to jurisdictional claims in published maps and institutional affiliations. |
© 2022 by the authors. Licensee MDPI, Basel, Switzerland. This article is an open access article distributed under the terms and conditions of the Creative Commons Attribution (CC BY) license (https://creativecommons.org/licenses/by/4.0/).
Share and Cite
Jiang, D.; Zhang, J.; Liu, T.; Li, W.; Wan, Z.; Han, T.; Che, C.; Cheng, L. A Modified Johnson–Cook Model and Microstructure Evolution of As-Extruded AA 2055 Alloy during Isothermal Compression. Metals 2022, 12, 1787. https://doi.org/10.3390/met12111787
Jiang D, Zhang J, Liu T, Li W, Wan Z, Han T, Che C, Cheng L. A Modified Johnson–Cook Model and Microstructure Evolution of As-Extruded AA 2055 Alloy during Isothermal Compression. Metals. 2022; 12(11):1787. https://doi.org/10.3390/met12111787
Chicago/Turabian StyleJiang, Dongmei, Jian Zhang, Tiejun Liu, Wei Li, Zhong Wan, Tingzhuang Han, Chaojie Che, and Liren Cheng. 2022. "A Modified Johnson–Cook Model and Microstructure Evolution of As-Extruded AA 2055 Alloy during Isothermal Compression" Metals 12, no. 11: 1787. https://doi.org/10.3390/met12111787
APA StyleJiang, D., Zhang, J., Liu, T., Li, W., Wan, Z., Han, T., Che, C., & Cheng, L. (2022). A Modified Johnson–Cook Model and Microstructure Evolution of As-Extruded AA 2055 Alloy during Isothermal Compression. Metals, 12(11), 1787. https://doi.org/10.3390/met12111787