Article

Influence of Deposition Strategies on Residual Stress in Wire + Arc Additive Manufactured Titanium Ti-6Al-4V

by
Bilal Ahmad
1,*,
Xiang Zhang
1,
Hua Guo
1,
Michael E. Fitzpatrick
1,
Leonor MacHado Santos Carvalho Neto
2 and
Stewart Williams
2
1
Faculty of Engineering, Environment and Computing, Coventry University, Priory Street, Coventry CV1 5FB, UK
2
Welding Engineering and Laser Processing Centre, Cranfield University, Milton Keynes MK43 0AL, UK
*
Author to whom correspondence should be addressed.
Metals 2022, 12(2), 253; https://doi.org/10.3390/met12020253
Submission received: 1 January 2022 / Revised: 25 January 2022 / Accepted: 25 January 2022 / Published: 28 January 2022

Abstract

:
Wire + arc additive manufacturing (WAAM) is a modern manufacturing process that has opened new possibilities for rapid builds and reductions in material wastage. This paper explores residual stress in WAAM Ti-6Al-4V walls built using three different deposition strategies: single bead, parallel path, and oscillation path. The effect of interlayer hammer peening and interlayer temperature was investigated for the single bead walls. We also examined the residual stress in compact-tension (C(T)) coupons extracted from large builds (walls) with crack orientation either parallel with or perpendicular to the build direction. This type of sample is often used for the measurement of the fatigue crack growth rate. The contour method was used for experimental determinations of residual stress. In addtion, residual stress in the C(T) coupons was estimated by finite element (FE) analysis. A good agreement was achieved between the contour method and FE analysis. The oscillation-path wall had the lowest residual stress values. For the single bead walls built with various process conditions, residual stress was significantly reduced after removing the substrate. A interlayer temperature of 110 °C resulted in much higher residual stress values in the wall (both tensile and compressive) compared to the continuous build, with much higher interlayer temperature.

1. Introduction

Ti-6Al-4V is the most commonly used titanium alloy in the aerospace, energy, and biomedical industries owing to its high fracture toughness, high strength-to-weight ratio, and excellent fatigue and corrosion resistance [1,2]. Conventional manufacturing operations (such as forging, rolling, casting, followed by machining) are commonly used to manufacture Ti-6Al-4V. However, these methods are expensive as they cause material wastage and require special tools. The typical buy-to-fly ratio of Ti-6Al-4V with conventional manufacturing is 12–25:1 [2,3]. Additive manufacturing (AM) offers an alternative to conventional manufacturing processes, resulting in material savings, high build speeds, the production of complex geometry and larger parts. However, some common drawbacks associated with AM processes are porosity, surface roughness or waviness, residual stress, and distortion [2].
Additive manufacturing can be divided into two major groups: powder bed fusion (PBF) and directed energy deposition (DED). Each group comprises numerous manufacturing technologies. Wire and arc additive manufacturing (WAAM) [4] falls under the Directed Energy Deposition classification [5]. WAAM offers cost savings compared to powder bed fusion and other DED methods [6], and has been investigated for titanium, aluminum and steel alloys, nickel bronze [4,7], tantalum [8], NiTi alloy [9], and steel-copper based alloy [10]. WAAM uses metal wire and an arc heat source to melt the wire and build a part layer-by-layer. It enables the production of large components with higher deposition speed [11], and offers greater material savings and deposition speed than powder-based AM processes [12]. Typical deposition rates of 1–10 kg/h have been reported [6]. Gas Metal Arc Welding (GMAW), Gas Tungsten Arc Welding (GTAW) and Plasma Arc Welding (PAW) are the most commonly used methods in WAAM [7,13,14]. The buy-to-fly ratio is about 3–12:1 [2,3]. WAAM has also found applications in the construction [15] and nuclear power [12] industries.
In WAAM, various factors can affect the generation of residual stress such as power source, deposition parameters and strategy, speed, layer thickness, pre-heating, the substrate material and geometry. [12,16]. The local heating and uneven cooling during the WAAM process induces large thermal gradients, resulting in residual stress and distortion [2,17], which can in turn reduce the structural strength and cause the final geometrical dimensions to be incorrect [17]. High levels of residual stress lead to solidification cracking, which is more common in materials with a high thermal expansion coefficient, such as aluminum alloys [6]. In WAAM, the heat dissipates through three forms: conduction to previous deposited layers, substrate and clamps; convection to the shielding air; and radiation to the atmosphere [12]. In as-deposited components, the peak tensile residual stress has been seen at the interface of the substrate and the deposit. The thermal gradient is at maximum when the first WAAM layers are deposited on the substrate, as a faster cooling rate occurs due to dissipation of heat through conduction into the substrate [3,18]. The conductive heat transfer, however, decreases with an increase in the deposit height [19]. The thermal profile changes because of the change in heat dissipation as a result of the evolution of the geometry during the build, and the cumulative effect of successive thermal cycles. Moreover, in-wall the heat dissipation is mainly in the form of radiation and convection [6].
Residual stress can be mitigated by reducing the local heat accumulation during WAAM [12]. To improve heat transfer in the WAAM process, different strategies have been employed. Preheating the substrate [17,20], reducing power source energy [17], and interlayer rolling [4] all help to reduce the residual stresses. A high interlayer temperature can help to reduce the residual stress as well as the dwell time. It has been suggested that the idle time may be increased as the build height increases to maintain same interlayer temperature and a constant molten pool size [19]. Interlayer rolling usually requires cooling of the build before its application, however it reduces the residual stress effectively [6]. Heat treatment, interlayer cold rolling [4,12], and ultrasonic impact treatment have been shown to reduce the residual stress [7]. Shot and hammer peening are frequently used in the welding industry. Adaptations are generally required to apply peening to WAAM components [7]. Interlayer hammer peening was shown to generate high compressive residual stress up to 1.2 mm depth below the peened surface for WAAM Ti-6Al-4V [21].
WAAM process planning consists of build orientation, path planning, process parameters, and desired geometry. For example, regarding build orientation, a deposit can be built either vertically (most commonly used) or horizontally (suffers from greater thermal gradients due to dissipation of heat to the substrate, and thus results in much higher residual stresses: also the substrate material has to be removed from the deposit all along the build). The substrate used for deposition often undergoes distortion. However distortion can be reduced by depositing the WAAM layers on both sides of the substrate, which balances the amount of residual stress on both sides [4,22]. A thick substrate reduces thermal deformations/distortions, however upon removal of the substrate there will be stress relaxation which may further result in the part distortion.
Tensile residual stress can be reduced by optimizing the substrate design through numerical simulations [18] e.g., by changing the substrate thickness, substrate area, making use of hollow substrate, depositing on both sides of the substrate, or adjustment of the clamping locations and clamping force. A change in stress distribution of WAAM Fe3Al was noticed after cutting off the substrate and after heat treatment [23]. A suitable deposition strategy may also help to manage the development of residual stress. A uni-directional path pattern is commonly used in WAAM. A number of path planning strategies exist for WAAM e.g., raster, zigzag, etc. [12].
Various numerical techniques have been used to estimate residual stress generated from the AM process in complex shape parts [20,24]. Long computational time and cost is often involved for numerical simulations of large WAAM parts. Coupled thermo-mechanical transient analysis is generally desired for accurate simulation of the arc, heat and mass transfer, and solidification [25]. In addition, residual stress has been characterized in WAAM components using experimental techniques (both non-destructive and destructive). Ultrasonic testing was used to measure residual stresses during and after additive manufacturing [14]. Neutron diffraction is frequently applied to estimate residual stress in WAAM builds [23,26,27,28]. X-ray diffraction has also been used to determine surface residual stresses, e.g., for WAAM aluminum alloy [29]. The contour method has been employed to measure residual stresses in WAAM parts [28,30]: for example, axial and hoop stress were measured in extracts from a circular WAAM steel build [31]. Tensile residual stress up to 500 MPa was reported at the interface of deposits and substrates, in the case of as-deposited WAAM Ti-6Al-4V [26]. This paper reports the residual stress measurement and analysis performed on WAAM Ti-6Al-4V, investigating deposition strategies, the use of interlayer peening, the effect of substrate removal, and the effect of coupon removal from the main build. Residual stress was first investigated in large walls built by three different deposition strategies: single bead, parallel path, and oscillation path. Residual stress was also estimated in single bead walls with interlayer hammer peening or with a particular interlayer temperature that was similar to the temperature value at interlayer peening. The application of peening techniques to WAAM builds is relatively new. The contour method was used in this study for the determination of residual stress, which is method based on stress relaxation [32]. The contour method provides 2D stress distribution for a stress component of interest that is perpendicular to the contour surface and is not affected by the material microstructure. In addition to attainment of stresses within the thickness, the near surface residual stresses in certain cases are also comparable to other techniques, such as the X-ray diffraction (XRD) and hole drilling techniques, which measure the near-surface residual stresses; e.g., XRD can analyze residual stress up to a few micrometers below the sample surface. The coarse grain size and texture in WAAM Ti64 materials generally gives low quality results in XRD. Another source of error can be the wavy surface in WAAM. The sampled area should be sufficiently flat for the XRD and hole drilling methods. The incremental hole drilling method can measure stresses up to 1.2 mm in depth.
Residual stress in small compact-tension (C(T)) coupons extracted from the walls was evaluated using the contour method and by finite element analysis. This evaluation was necessary for fatigue crack growth rate analysis. Based on the fracture mechanics approach, the crack tip stress intensity factor should take account of the contribution from residual stresses [33,34].

2. Materials and Methods

2.1. Materials and Specimens

Figure 1 shows a schematic of the three deposition strategies studied in this paper.
Single bead is generally used to build thin walls and parallel and oscillation paths for thick walls. The first batch of samples were built with a continuous deposition approach. The parallel-path wall was composed of four 50% overlapped single beads. The oscillation path walls were deposited on opposite sides of the substrate (Figure 2a). The thickness of the single bead, parallel path and oscillation path walls were approximately 10, 25 and 20 mm, respectively. Walls were removed from the substrate before residual stress measurement.
The second batch of samples consisted of single bead walls only, for investigation of the effects of interlayer tempeature, and interlayer hammer peening (ILP) with and without the substrate. The length of the walls was about 300 mm. The average interlayer temperature of these walls was 110 °C. The interlayer hammer peening was begun after the build cooled to 140 °C. The thickness of the ILP single bead walls was about 7–8 mm. All walls were removed from the substrate before residual stress measurement, except for one ILP wall that was measured with the substrate. The thickness of the substrate was 10 mm. The deposition parameters for the walls are shown in Table 1. Interlayer hammer peening was performed on each deposited layer along the length of the wall, leaving a distance of 15 mm from the wall-ends unpeened. The interlayer hammer peening parameters for the single-bead walls are shown in Table 2.
Compact-tension (C(T)) coupons of 5 mm thickness were extracted from all three build strategies (single bead, parallel path, and oscillation path), and also from the ILP single bead wall. All C(T) coupons were extracted from the mid-thickness of the walls near the wall bottom location using wire electro-discharge machining. The coupons for fatigue crack growth tests were extracted from both the top and bottom locations of a wall. However, this paper has only focused on retained residual stresses in these small coupons and for this purpose the wall bottom location was selected, where the residual stress is much higher. Two types of C(T) coupons were investigated: one for introducing a crack across the WAAM layers; and the other for cracking parallel to the WAAM layers. Figure 2a,b show the as-received walls: in Figure 2a, the oscillation path deposited on both sides of the substrate is shown; and in Figure 2b the interlayer-hammer-peened single-bead wall (measured with the substrate) is shown. Figure 2c shows a sketch depicting the contour cut location of the walls and the extraction locations for the small blocks and the C(T) coupons. Figure 2d depicts contour cut locations for small blocks and C(T) coupons, as well as cut/crack orientations.
The measured perimeter of various walls (single bead, parallel path, and oscillation path) at the mid-length is illustrated in Figure 3.
To examine cutting errors associated with wire electro-discharge machining for the contour method, the substrate material (a wrought Ti-6Al-4V) used for the deposition of WAAM walls was measured. The substrate plate was measured in as-received and stress-relieved conditions. Residual stresses were first evaluated in the walls with the contour cut position shown in Figure 2c. Afterwards, the compact-tension (C(T)) coupons were extracted from the walls (oscillation path, parallel path, single bead, and ILP single bead) to investigate the residual stress levels. The coupons were extracted after the contour cut of the wall and near the cut location, as shown in Figure 2c,d. The extraction of C(T) coupons from the walls followed a similar procedure as the single bead, parallel path and oscillation path walls. Besides the C(T) coupons, two small blocks were machined from the oscillation path wall: one for contour cuts across the WAAM layers, and another for cuts parallel to the WAAM layers. These blocks were machined from a similar location of wall as for the C(T) coupons in Figure 2c,d. The size of the blocks prior to contour cut was the same as the C(T) samples. The purpose of this measurement was to exclude the notch effect on measured residual stresses in the C(T) samples, because the notch causes redistribution of residual stress and local stress concentration. The contour measurement was expected to give the true residual stress status retained in the C(T) samples.

2.2. Methods

The contour method uses a wire electrical discharge machine (WEDM) to cut the component to be measured into two halves. The steps involved in the contour method are:
  • Cutting, for which a single flat cut is desired through the sample to relax the stress component normal to the cut surface.
  • Following cutting, the cut surfaces are measured with a coordinate measuring machine (CMM).
  • Data analysis is performed in which the measured contours are averaged and smoothed with a curve fitting routine.
  • Finally, the reverse of the measured contour is applied as displacement boundary conditions to a 3D finite-element model of one of the cut surfaces. To avoid rigid body motion, constraints are applied to the FE model, and a linear-elastic analysis is performed to obtain the original residual stress present in the sample [32].
For contour method measurements, the walls and C(T) samples were cut with a Fanuc Robocut α-C600i wire electrical discharge machine, Fanuc corporation, Yamanashi, Japan. A brass wire of 0.25 mm diameter was used. The samples were symmetrically clamped. Machine cutting parameters such as spark duration ON time, voltage, current, spark duration OFF time, wire tension, nozzle injection pressure and feed rate were optimized (based on trials) for each sample [35]. The chosen machine settings gave the best possible surface finish. For all samples, it was ensured that the cutting speed remained below 1 mm/min. CT coupons were extracted with WEDM using the CAD drawing and machine standard cutting parameters. All samples were cut at their mid-length to obtain the longitudinal stress component (the LD component as in Figure 2c). The surface displacement profiles of both cut halves of each sample were measured with a Zeiss Contura g2 coordinate measuring machine (CMM). A touch probe of 3 mm diameter was used. The distance between the measurement points for both in-plane directions of the sample cut surface and from the perimeter were set as 0.5 mm (for walls and substrate) and 0.1 mm (for the C(T) coupons), respectively. The surface displacement data of all samples were post-processed with Matlab analysis (MATLAB 2020a, MathWorks, Nattick, MA, USA) routines for data aligning, averaging, cleaning and smoothing with cubic splines [36]. A cubic spline smoothing with suitable knot spacing was used for each sample. For FE analysis, one cut half of all samples was modelled. A brick element having 8 nodes in Abaqus software was used, Abaqus 6.14-1, Dassault Systemes, Waltham, MA, USA. The distance between the adjacent FE nodes on the cut surface was set as 0.5 mm or less. The smoothed displacements were then applied to the FE model as boundary conditions, constraints were applied to avoid rigid body motion, and finally linear-elastic analysis was performed to obtain the original stresses present in sample before the cutting. The following material properties were used: modulus of elasticity E = 113.8 GPa, Poisson’s ratio v = 0.342.
A 2D finite-element analysis (FEA) of both C(T) coupon types (i.e., crack across the WAAM layers and crack parallel to the WAAM layers) was performed to obtain residual stresses along the straight cut/crack path. The FEA was based on the contour method measurement of the WAAM walls (i.e., single bead, parallel path, and oscillation path), as investigated and reported previously [37]. The stress distribution changes due to coupon extraction as well as crack growth, and can be modelled by FEM [34,37,38,39]. For FEA, a 2D model of the C(T) coupons was constructed.
From contour measurement of WAAM walls, the stresses over a 5 mm distance around the mid thickness of the walls were averaged, and this process proceeded along the walls’ height. These averaged stresses were assumed to be uniform along the length of the walls. The averaged stresses (corresponding to cut locations of the C(T) coupons) were then applied as initial stresses to an FE model of the C(T) coupons. Constraints were applied at appropriate corner nodes to avoid rigid body motion. Linear-elastic FE analysis was performed to obtain the residual stresses in the C(T) coupons. The FE analysis was executed using Ansys 16.1 software with Plane182 elements, Ansys, Canonsburg, PA, USA and the mesh size was set as 0.5 mm. Similar E and v values as used for the contour measurement were employed.

3. Results and Discussion

3.1. Calibration of Contour Cutting Parameters

To estimate errors in the wire electro-discharge machining cutting associated with the chosen cutting parameters and conditions, contour cuts were performed firstly on a reference plate that was the same as the substrate plate used for depositing the WAAM layers. The reference plate is a wrought Ti-6Al-4V, which was measured in the as-received condition and also a stress-relieved condition following heat treatment at 600 °C in a furnace for 3 h, after which it was expected to have minimal residual stress. Figure 4 shows the through-thickness averaged residual stress. Very little residual stress (±4 MPa) was present after the stress relief operation. This confirmed that the chosen set of WEDM cutting parameters and conditions had minimal cutting errors for the contour method used in this study.

3.2. Residual Stresses in Single Bead Walls with Various Build Conditions

Single bead walls of the following conditions were studied: (a) interlayer peened (ILP) with substrate plate; (b) interlayer peened (ILP) after removing the substrate plate; (c) as-deposited (unpeened) with average interlayer temperature 110 °C after removing the substrate; (d) unpeened, built by continuous deposition (with much higher interlayer temperature), after removing the substrate. The contour method results of residual stress are shown in Figure 5.
The ILP wall with substrate showed the highest tensile residual stress, approaching 600 MPa at the intersection of the wall and substrate. From the bottom towards the top of the wall, the tensile stress decreased gradually, and in the mid-height, the stress state was compressive. Low tensile stress was present in the upper part of the wall, and at the very top of the ILP wall with the substrate, the stresses were highly compressive (more than −200 MPa). Within the substrate, compressive residual stresses were seen away from the deposit, and tensile residual stress of a magnitude greater than 100 MPa was found at the bottom of the substrate.
In the single-bead build, in the first few deposited layers, stresses arose due to restraint from the clamped baseplate, similar to what occurs in welding processes. High tensile stress arises at the junction of the baseplate with the build layers, and compressive residual stress appears away from the deposited bead to balance the tensile peak stress. In the second stage of the build process, when the build height reaches a certain distance, restraint stresses do not occur, as there is no restraint from the substrate and clamps. However, large shrikage stresses appear. This two-stage development results in two regions of residual stress: (i) high tensile residual stress in the deposition (longitudinal) directon near the baseplate due to plastic strain mismatch (deposition and restraint); (ii) compressive stress in the middle of the build height and tensile stress near the top of the deposit due to elastic strain mismatch (shrinkage).
The ILP wall, after removing the baseplate, showed significant stress relaxation, particularly near the wall bottom location (i.e., the start of the deposit), as compared to the wall top location. Stresses were largely relaxed after removing the substrate, but part of tensile stress near the wall-substrate interface was retained, around 200 MPa, which was 450 MPa before the substrate removal. At the mid-point of the wall build height, the compressive residual stress was of similar magnitude for both ILP walls. It was noticed that removal of substrate reduced residual stress in the WAAM build [18]. The substrate also developed tensile residual stress at its bottom as well as the top surface away from the deposit. The single bead unpeened WAAM wall built with an averaged interlayer temperature of 110 °C resulted in much higher residual stress compared to the other unpeened and peened single bead walls. A high interlayer temperature not only decreases dwell/idle time but also the residual stress [6].
The effect of interlayer temperature on residual stress was studied by comparing the two unpeened conditons. The 110 °C interlayer temperature wall showed higher tensile residual stress, approaching 500 MPa at the wall bottom location, compared to the continuous deposited wall. The higher interlayer temperature was found to have a beneficial effect on the generation of low residual stress as it reduced any thermal mismatches [40]. High tensile residual stress was not only present at the wall bottom location but also at the wall top location. The continuous deposit wall showed the lowest residual stress along the build height. The ILP wall without substrate showed significantly less tensile residual stresses at the wall bottom and top locations compared to the unpeened single bead wall prepared with similar interlayer temperature. Interlayer hammering peening is known to generate compressive residual stresses [21].
The residual stress profiles at mid-thickness of all single bead walls along the build height are compared in Figure 5b. The stress distribution was similar to that discussed above. The unpeened wall with average 110 °C interlayer temperature had the highest tensile residual stress among the walls with the substrate plate removed. The ILP wall without substrate showed the lowest tensile residual stress, almost similar to the as-built (continuous deposit). The ILP wall with substrate also showed higher compressive residual stress (more than −200 MPa) at the wall top location than the ILP wall after substrate removal. The top layer of the ILP wall after substrate removal was not peened, contrary to the other ILP wall with the substrate, which resulted in higher compressive residual stress in the case of the ILP wall with the substrate still attached.

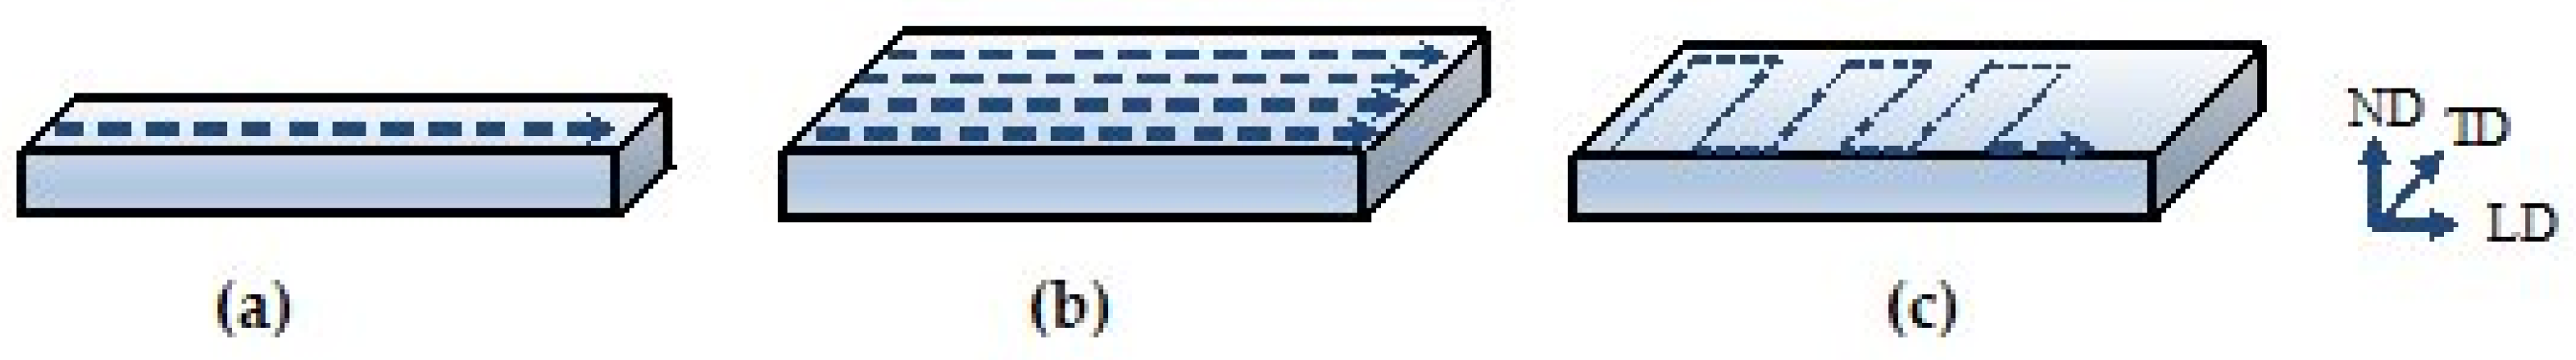
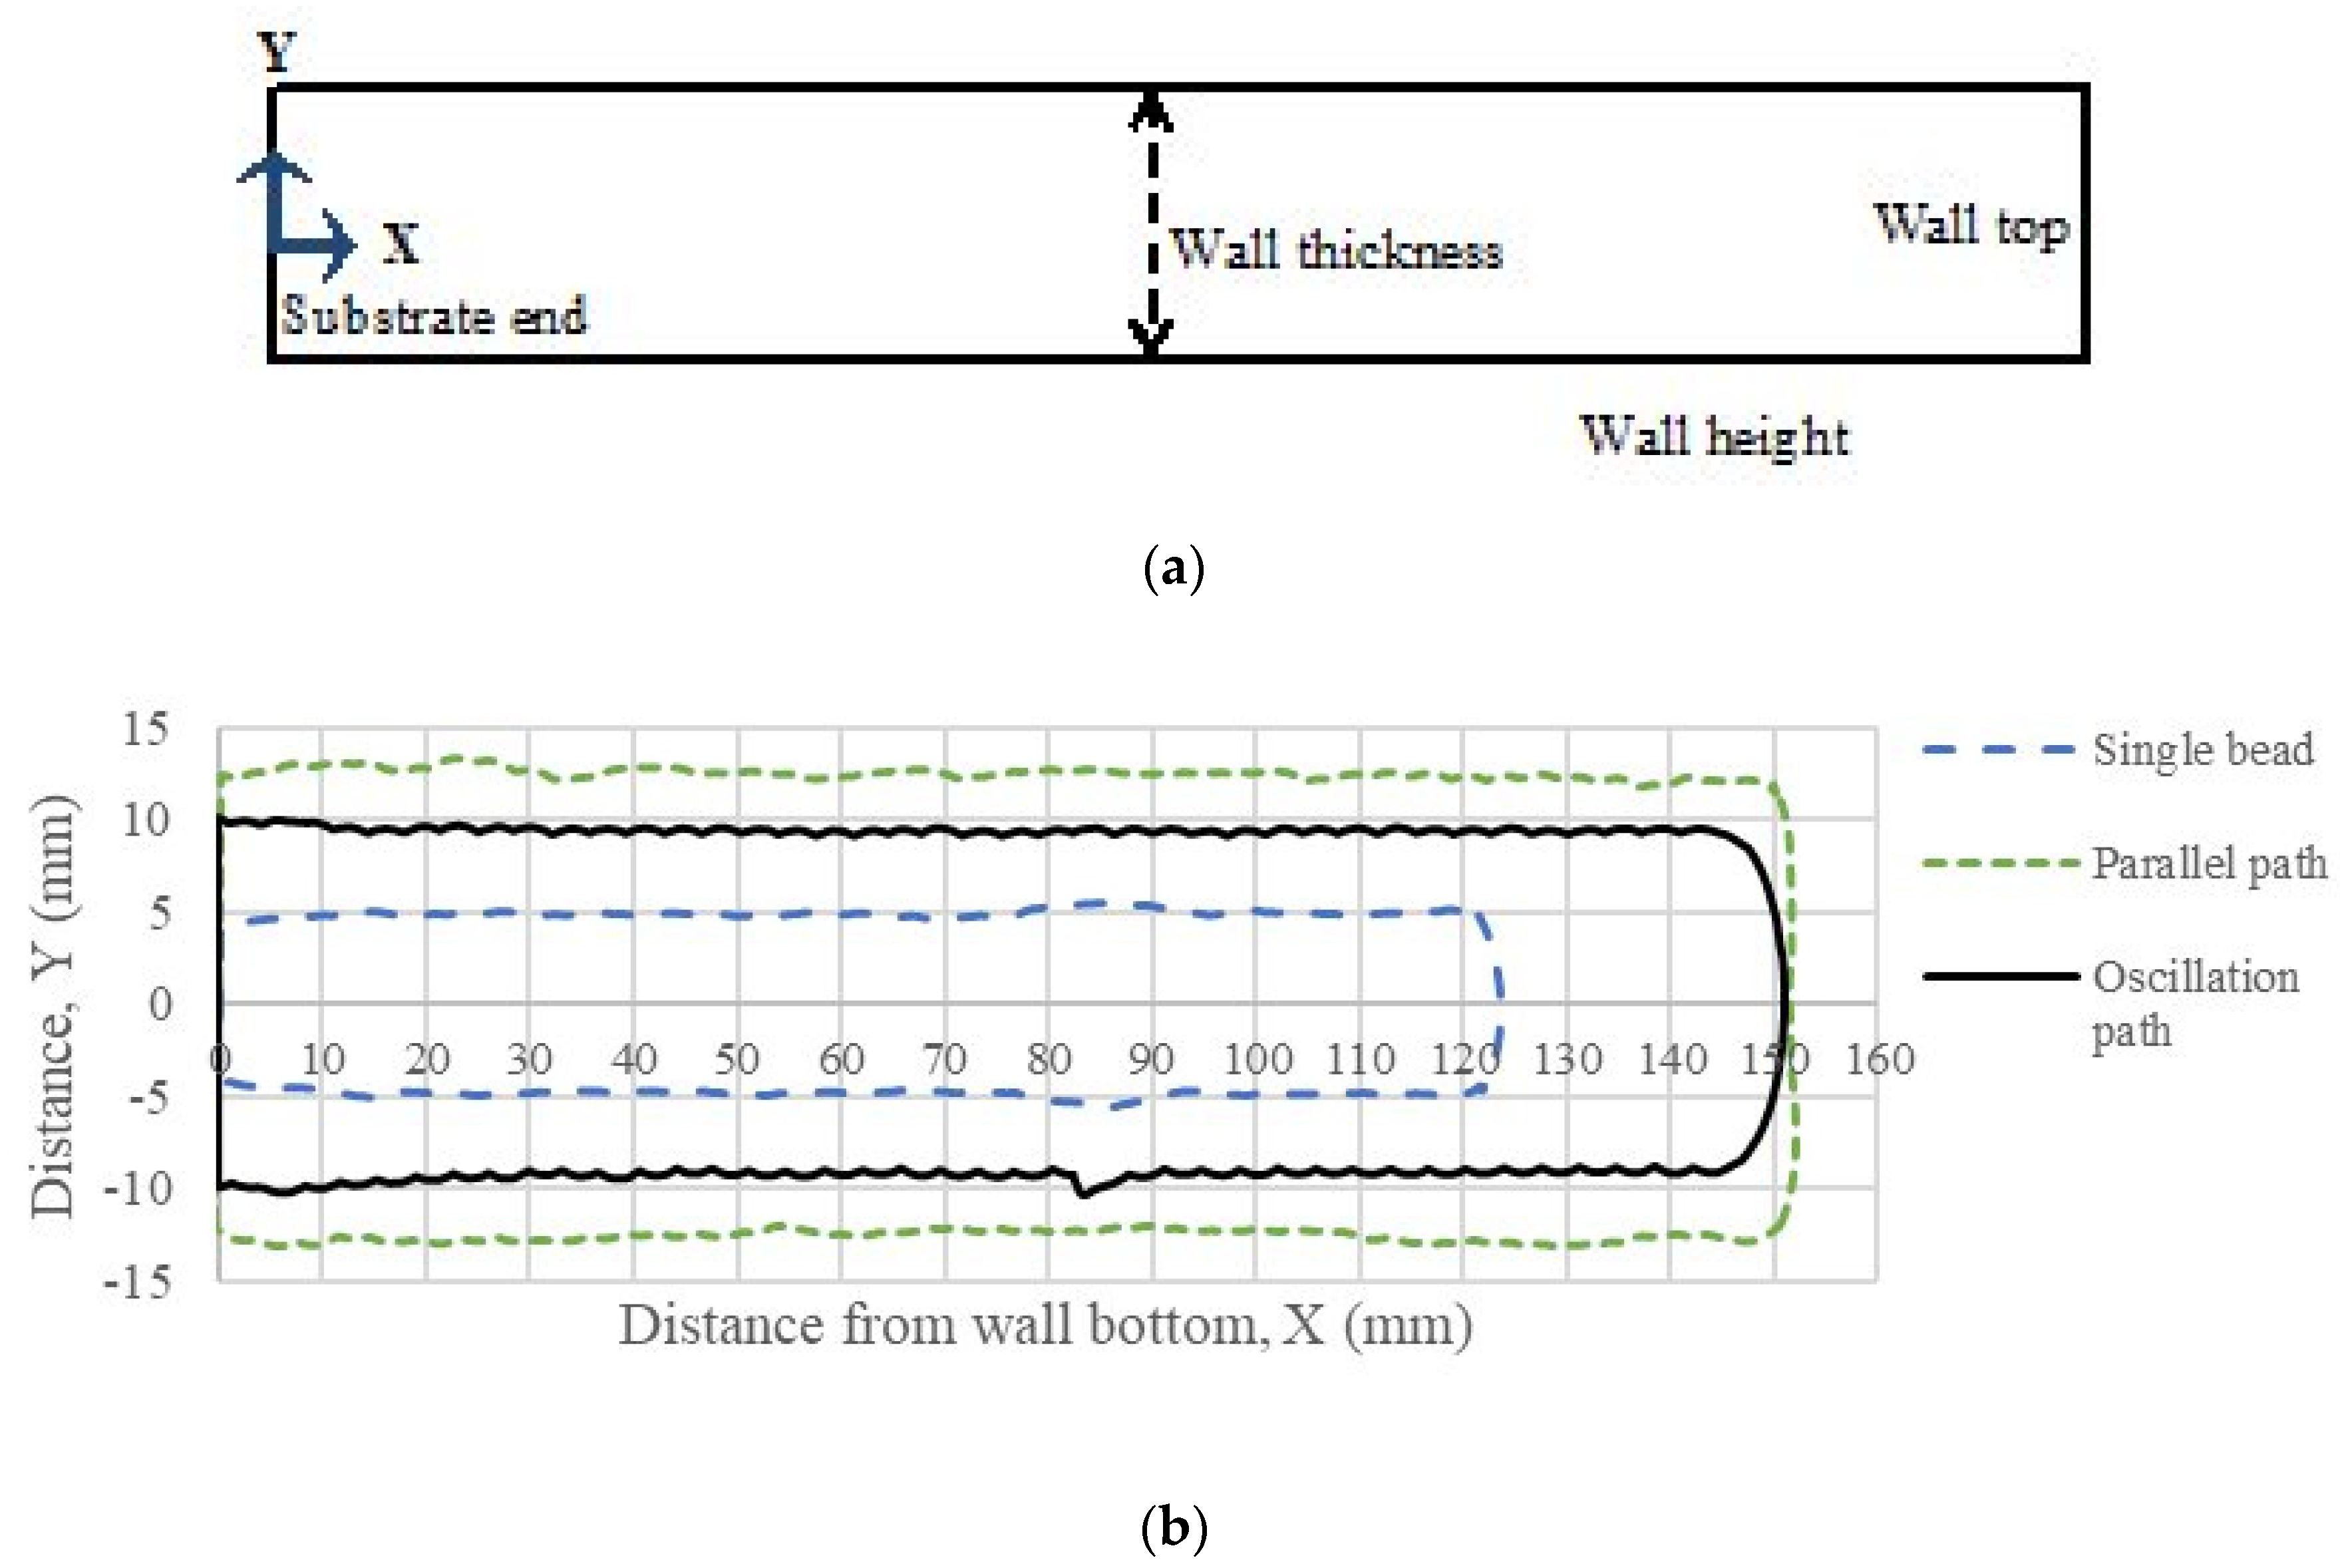
3.3. Residual Stresses in the WAAM Walls

The contour method results presented in Figure 6 show residual stress distribution along the build height for continuous deposits using single bead, parallel path, and oscillation path strategies. After removing the substrate plate, tensile stress was present at the bottom and top of the walls, with compressive stress around the mid-height. The oscillation path wall showed the lowest values of residual stress, and the parallel path wall showed the highest values, with the peak tensile stress approaching 280 MPa at the top of the wall. The single bead wall also showed high tensile stress, approaching 185 MPa at the wall bottom location (near the substrate plate).
All WAAM walls showed high tensile residual stress at the wall bottom location (i.e., the intersection of wall and substrate). The parallel path WAAM wall showed the highest residual stresses: the parallel path wall was composed of three single passes grouped together side by side (horizontally), and the single bead wall showed higher residual stress than the oscillation path wall. The parallel path build had lateral horizintal restriant due to four passes being deposited side by side, hence it showed higher tensile residual stress. The oscillation path wall was one of the two walls deposited on each side of the substrate (Figure 2a). The low residual stress in the case of the oscillation path wall may has been caused by the presence of less steep thermal gradients.

3.4. Residual Stress in Small Blocks Extracted from the Oscillation Path

After performing a contour cut of the wall, two small rectangular blocks were extracted from the bottom of the oscillation path wall (as shown in Figure 2c,d). Figure 7 shows the residual stresses obtained with the contour method that were retained in the small blocks after being extracted from the wall, with line profiles presented in Figure 7b. The block with the contour cut across the build layers indicates residual stress along the layers, and the block with contour cut parallel to build layers indicates residual stress transverse to the layers. Both blocks showed tensile stress near the sample surfaces with maximum stress values of 30 to 50 MPa, and compressive stress in the bulk material at the middle section with stress values of −10 to −25 MPa. In summary, tensile residual stress in the direction transverse to the build layers was higher (maximum 50 MPa) than the other direction. Residual stress in these small test coupons was very low for the high strength titanium alloy. The maximum compressive residual stress (−25 MPa) was in the transverse direction. The longitudinal direction (welding direction) had negligible compressive stress (−10 MPa).

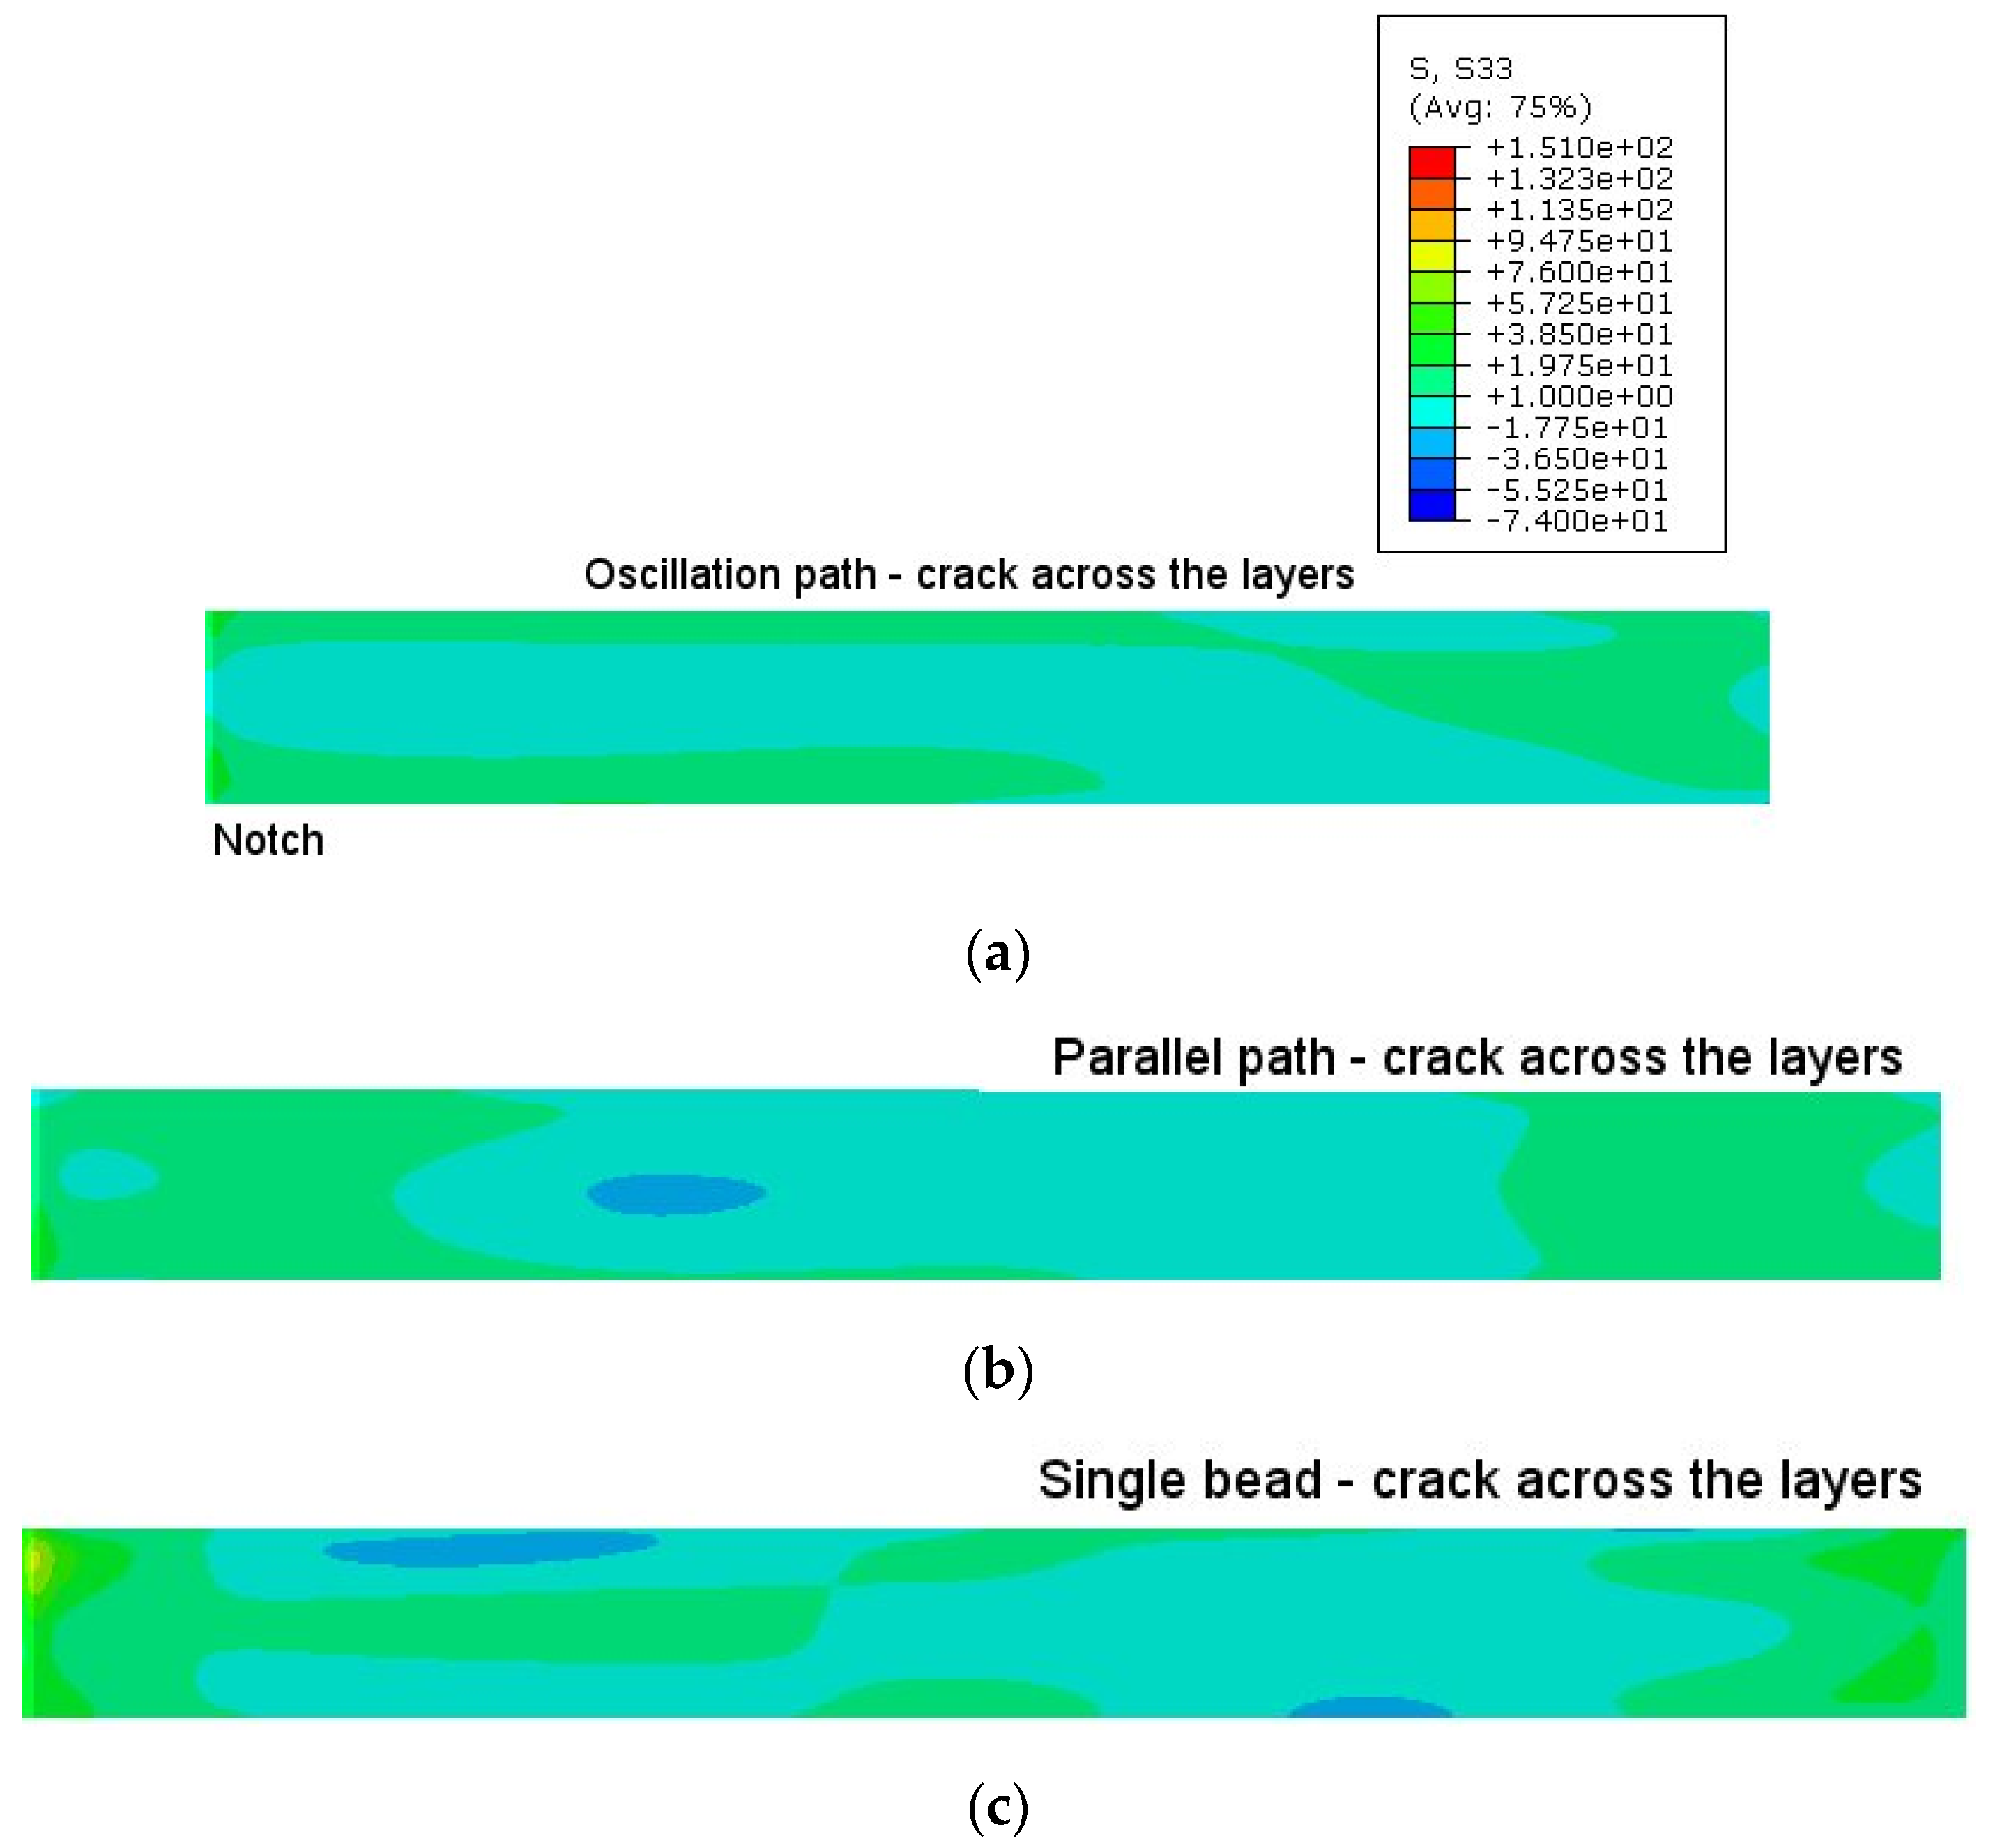
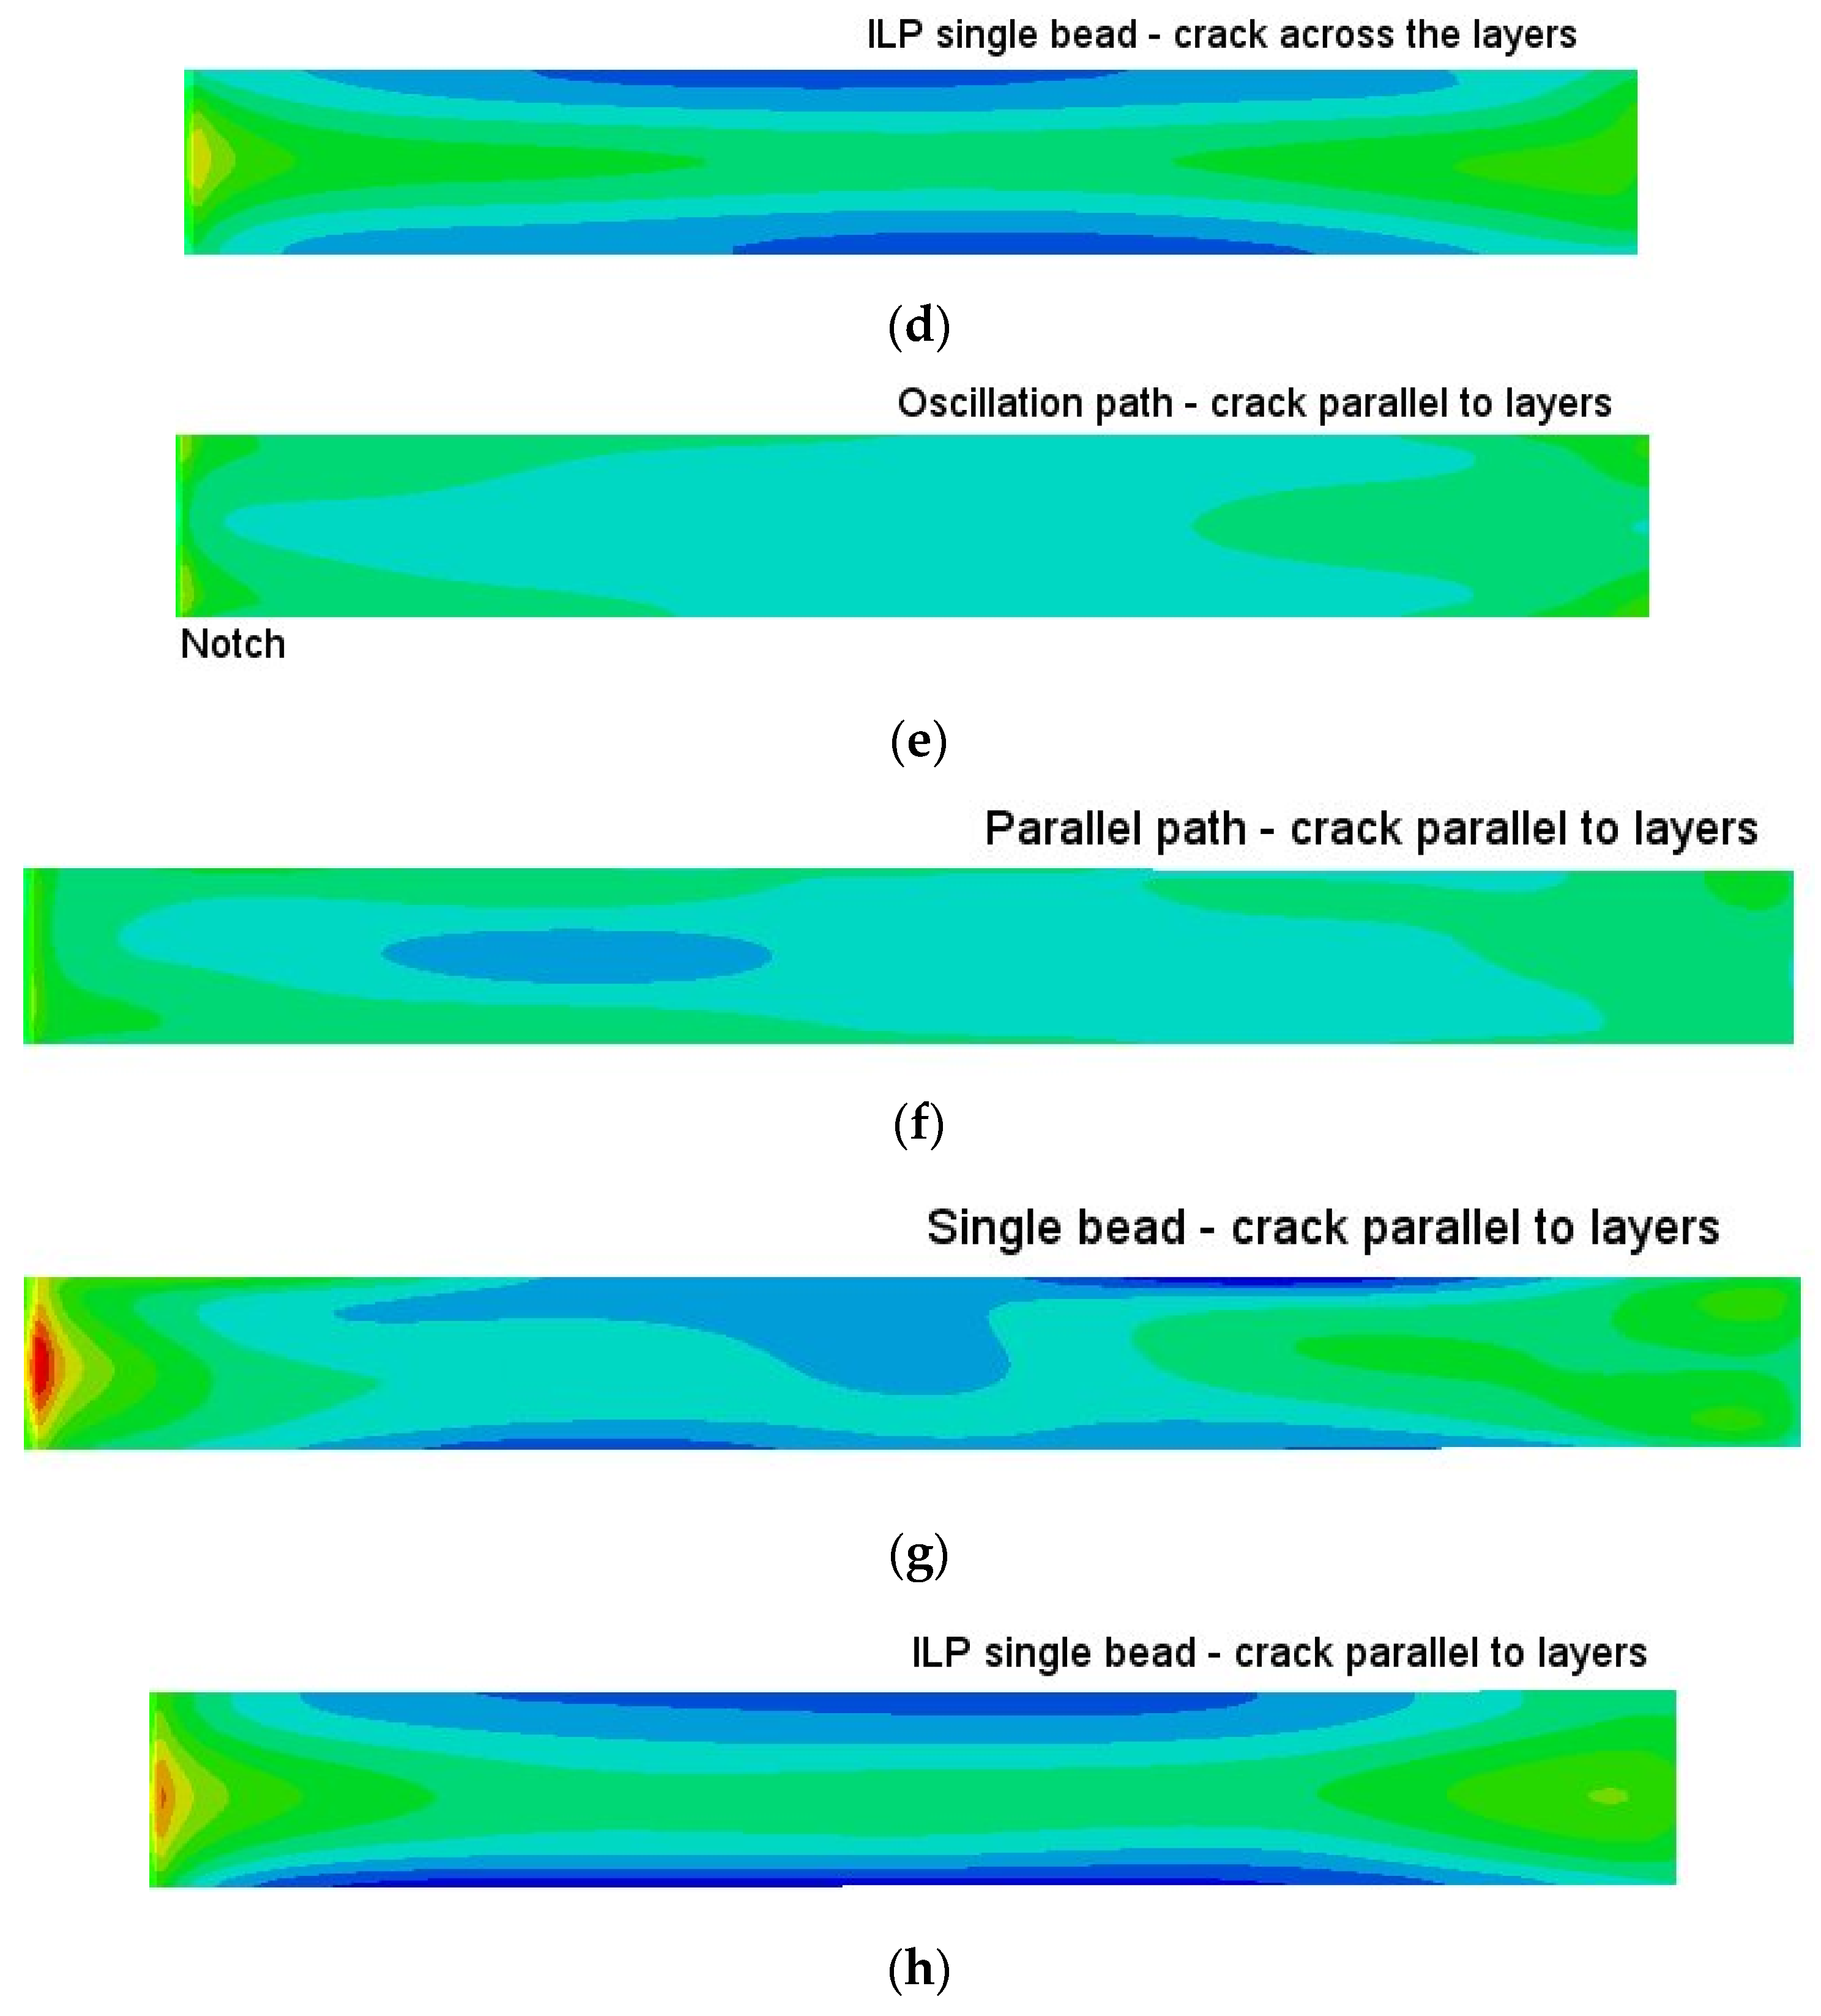
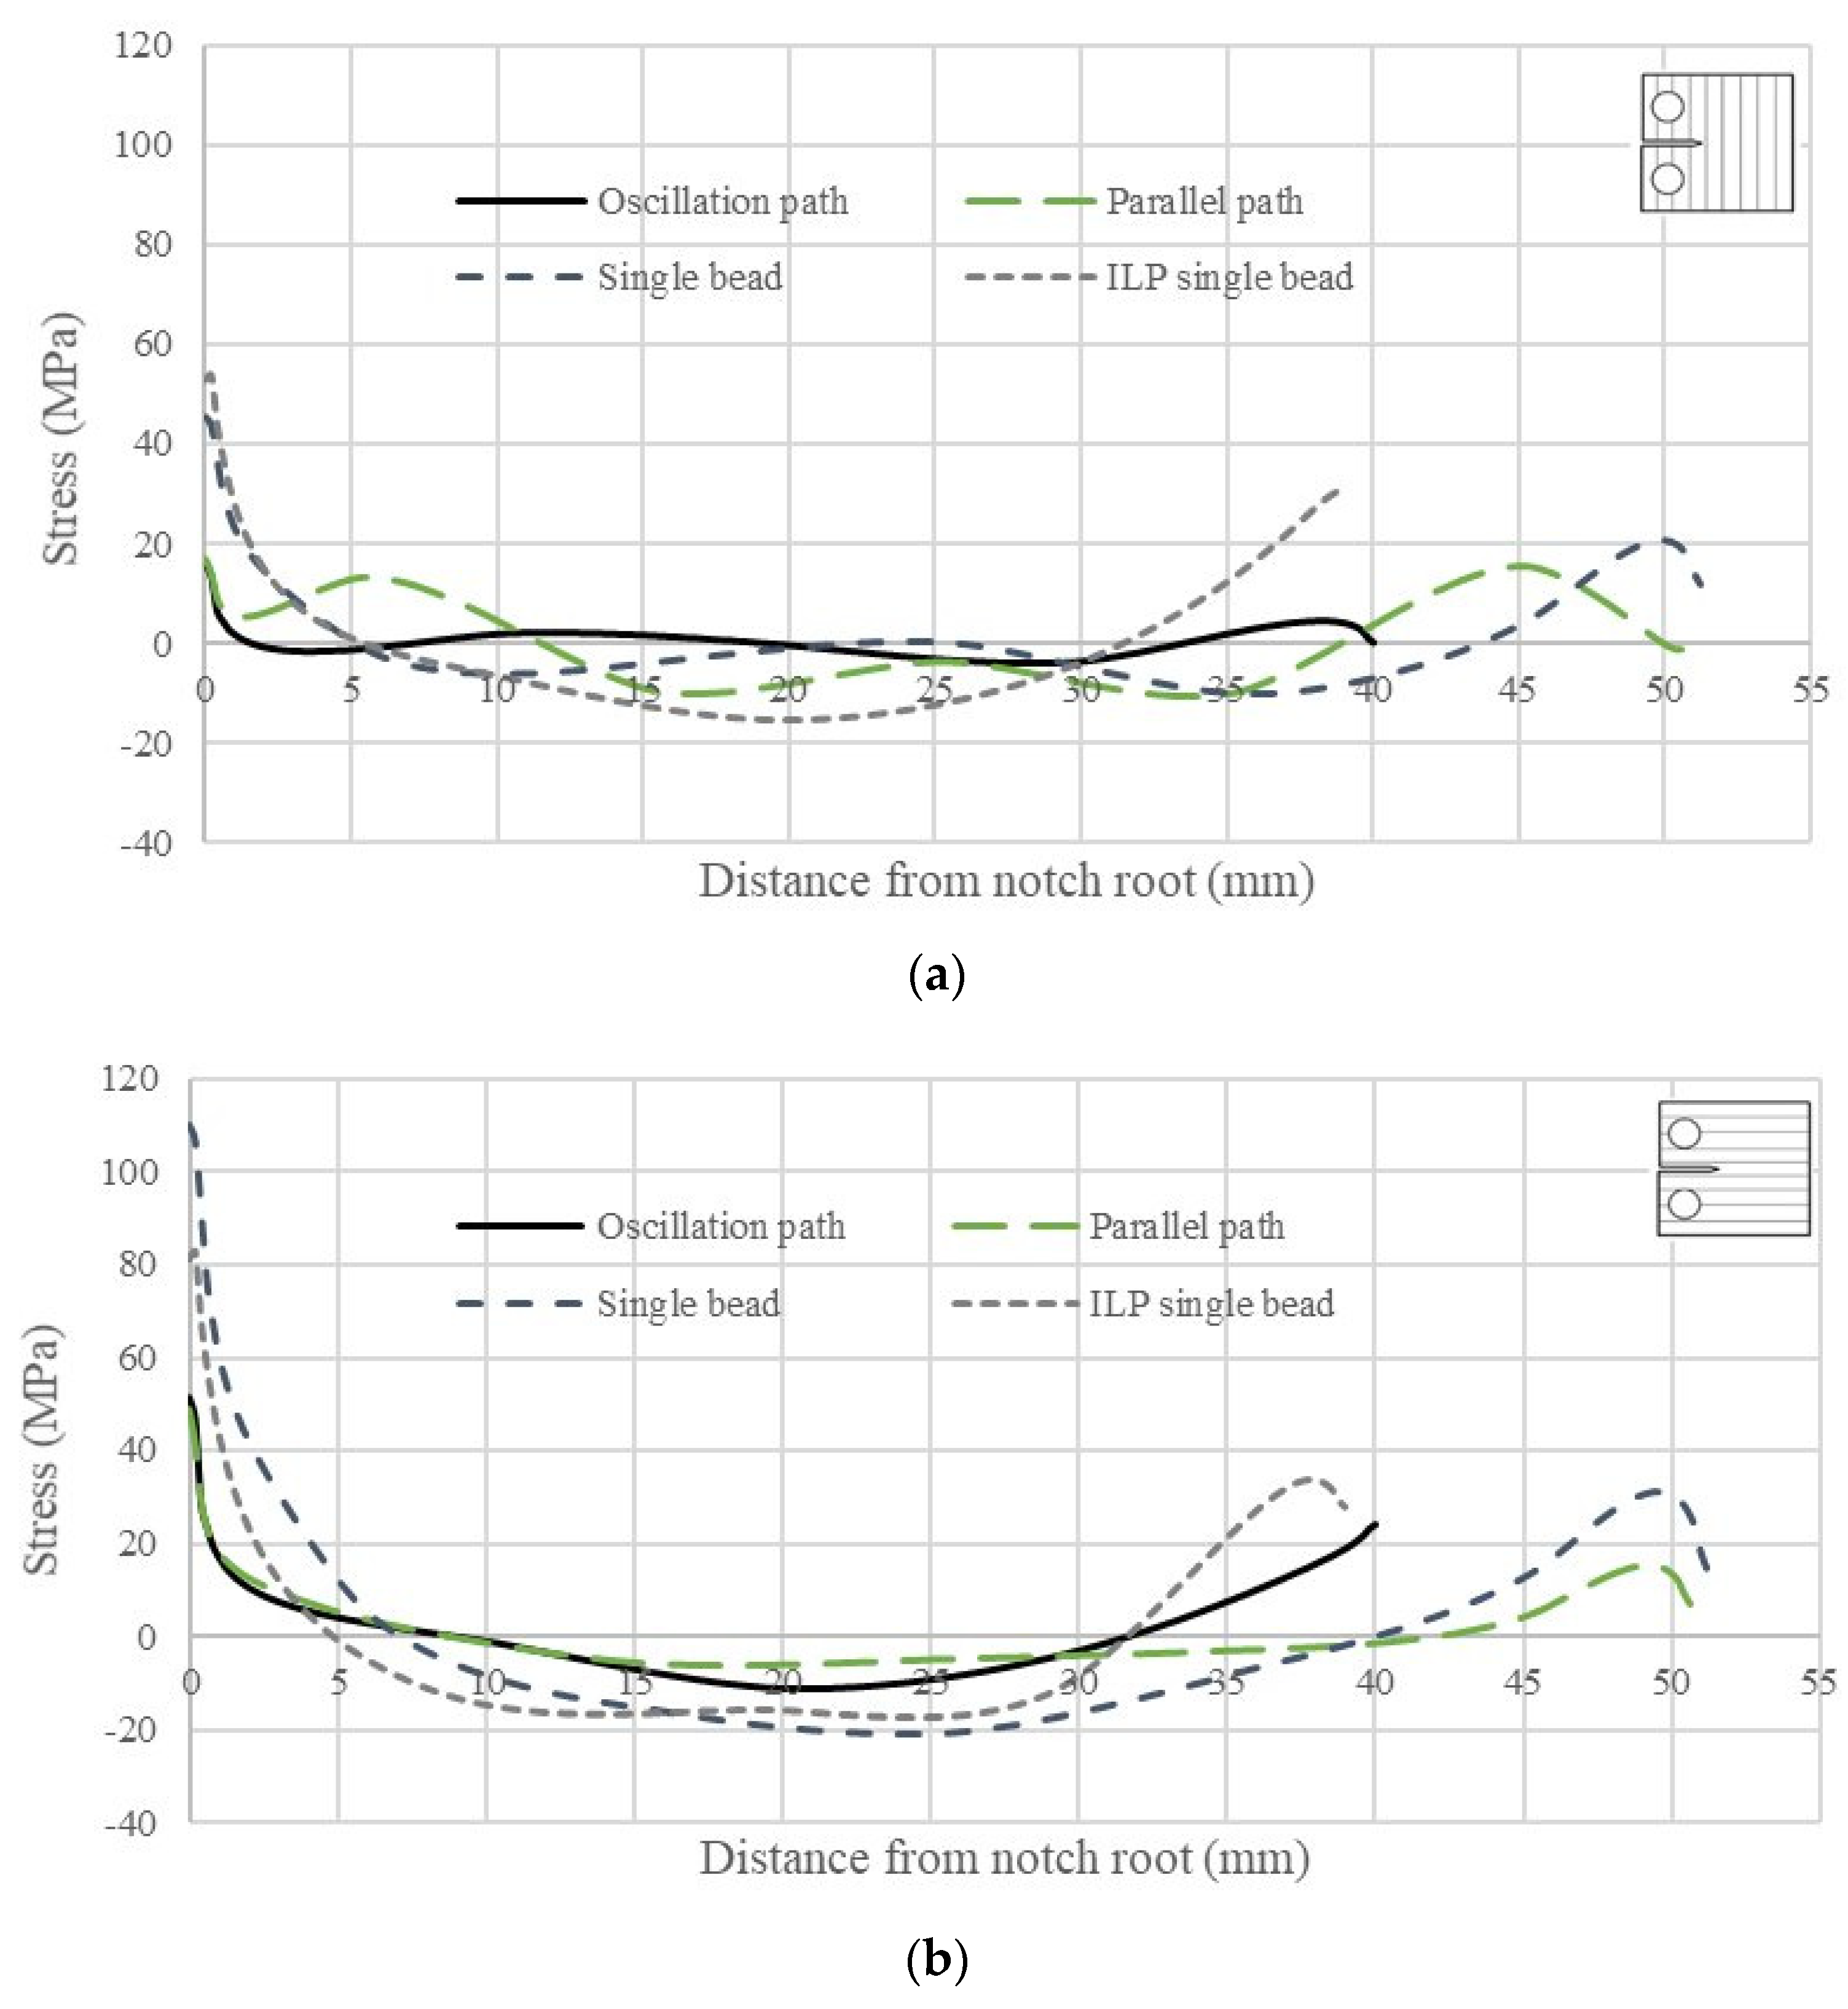
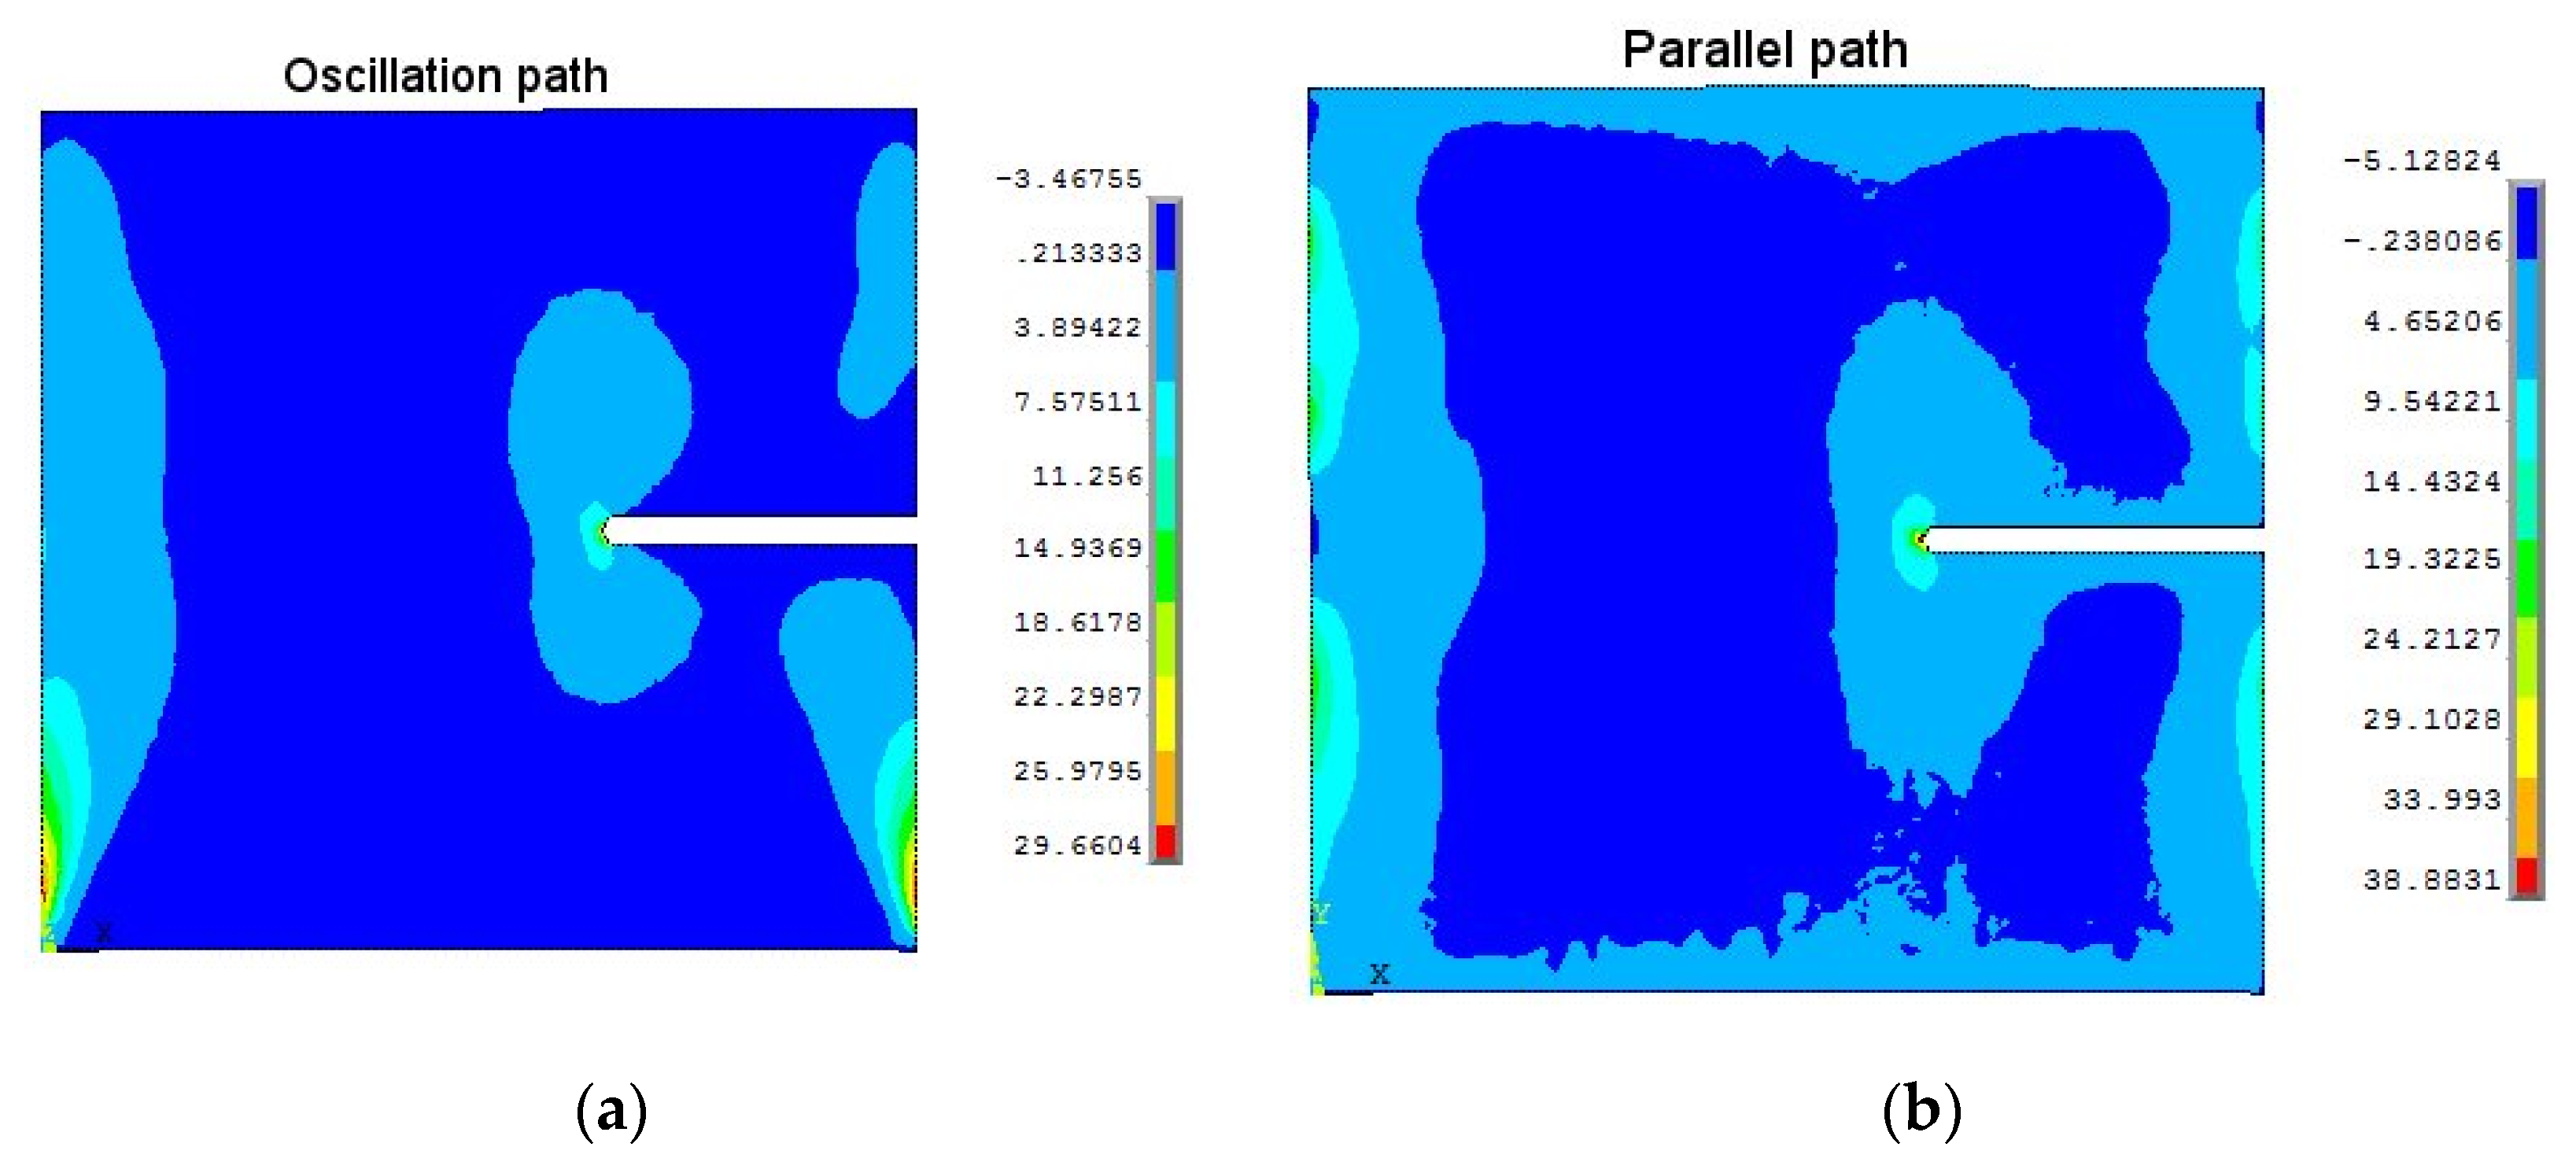
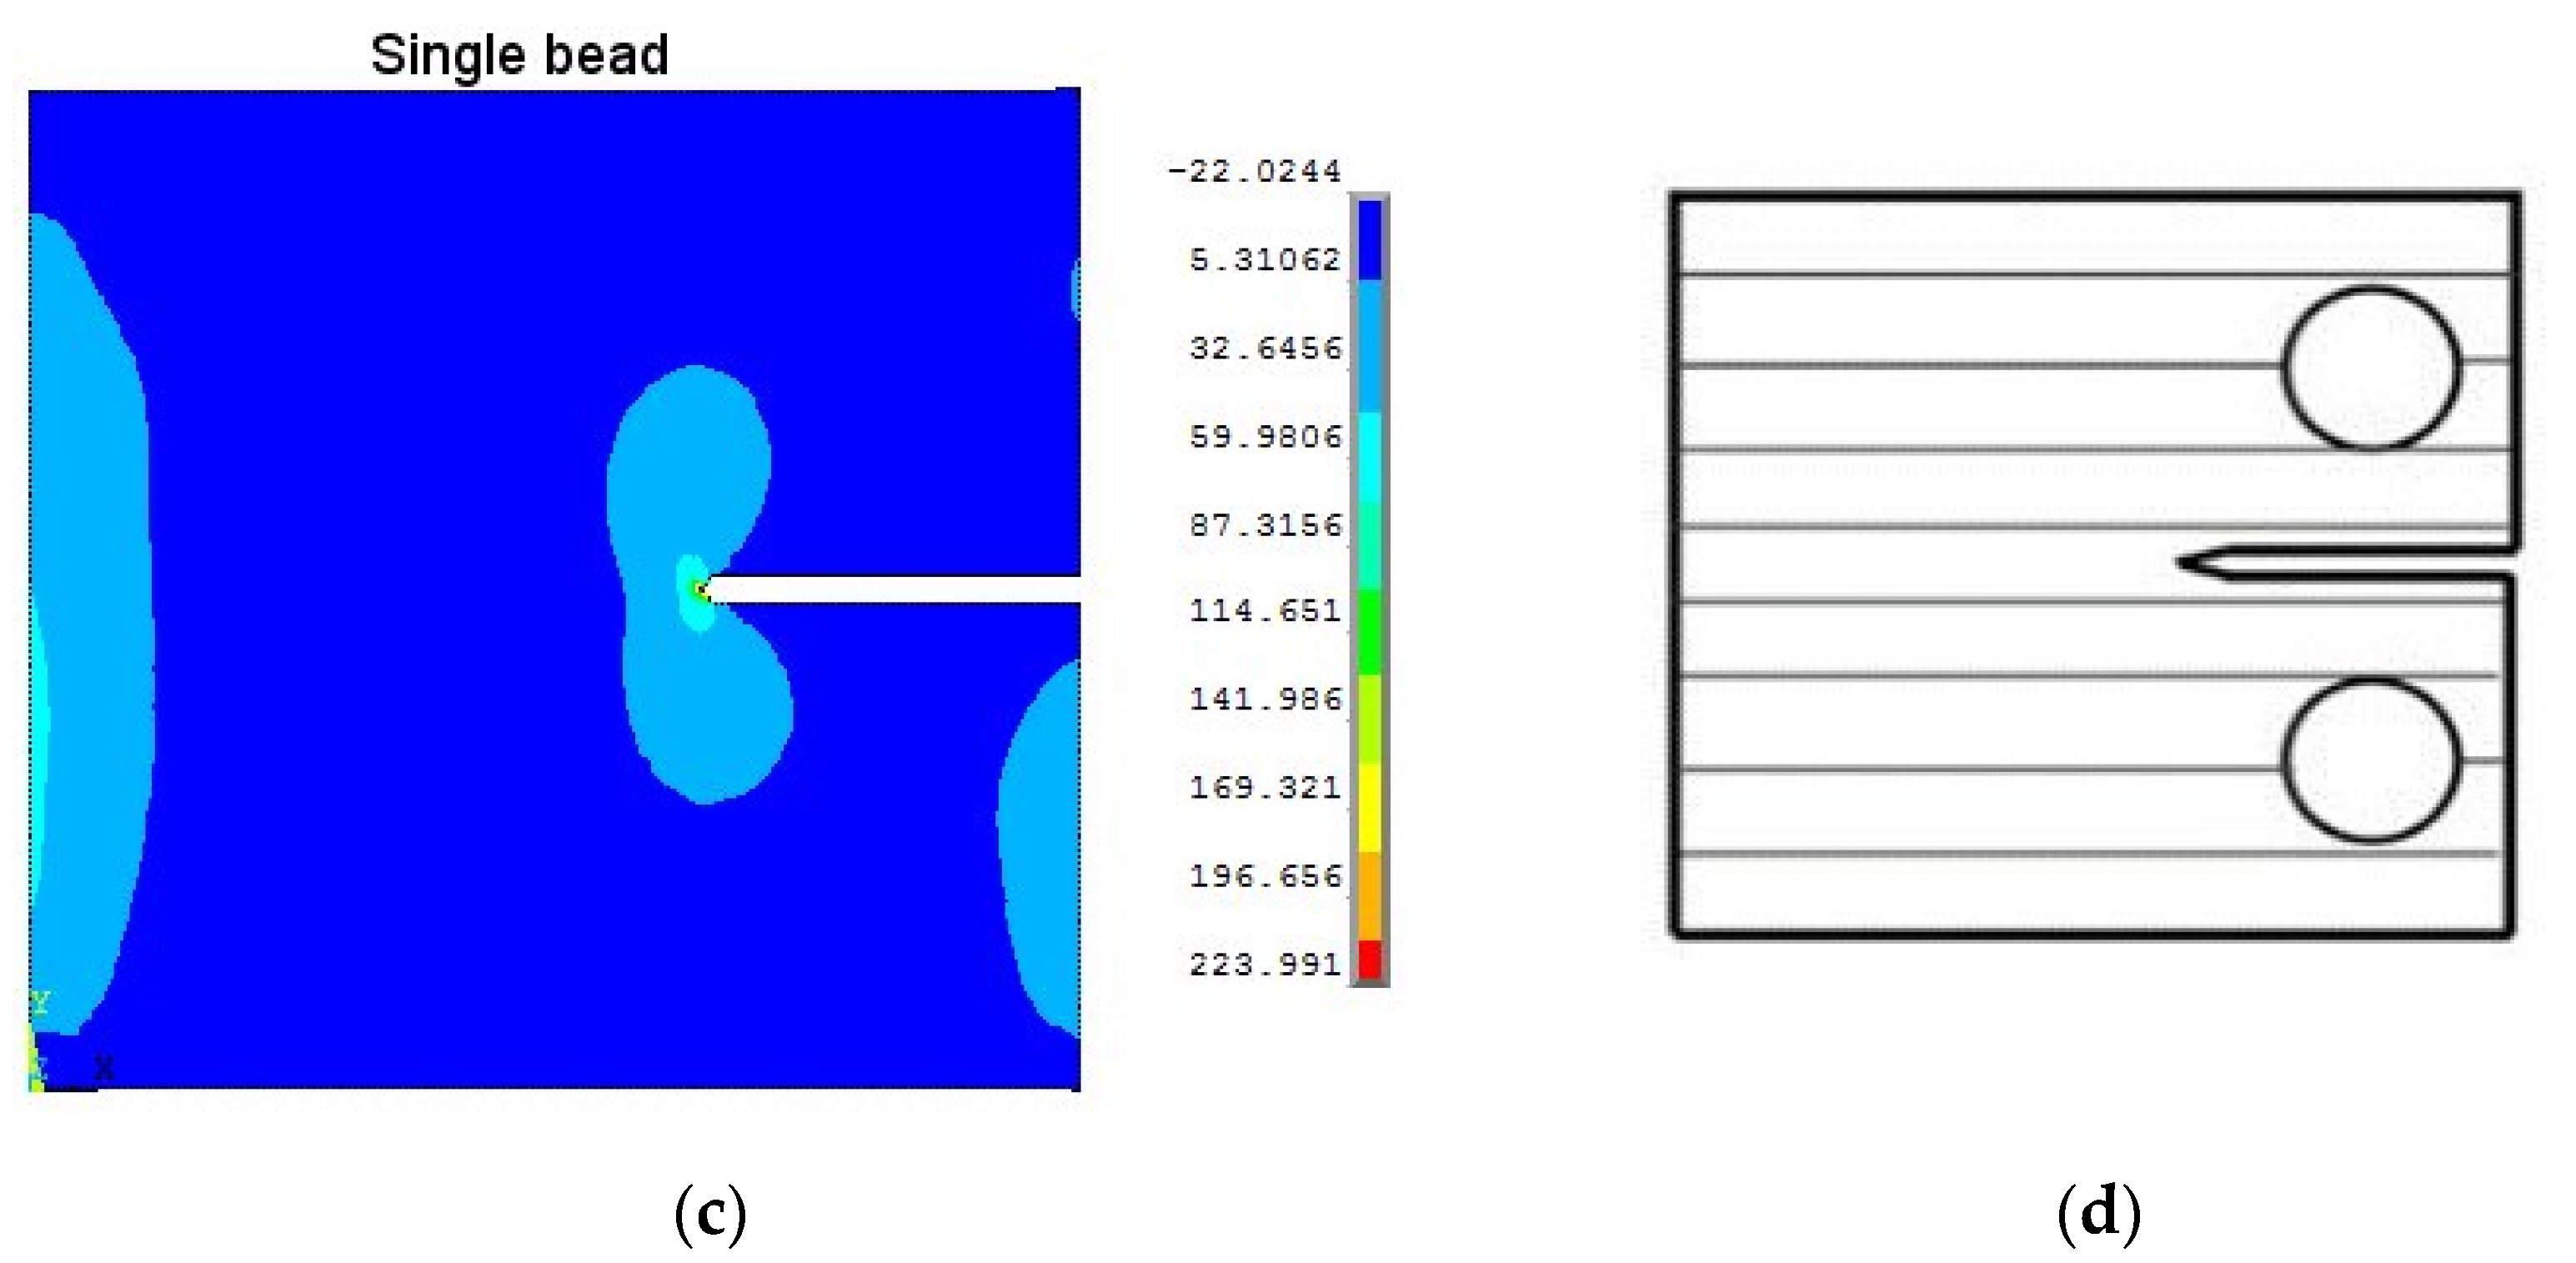
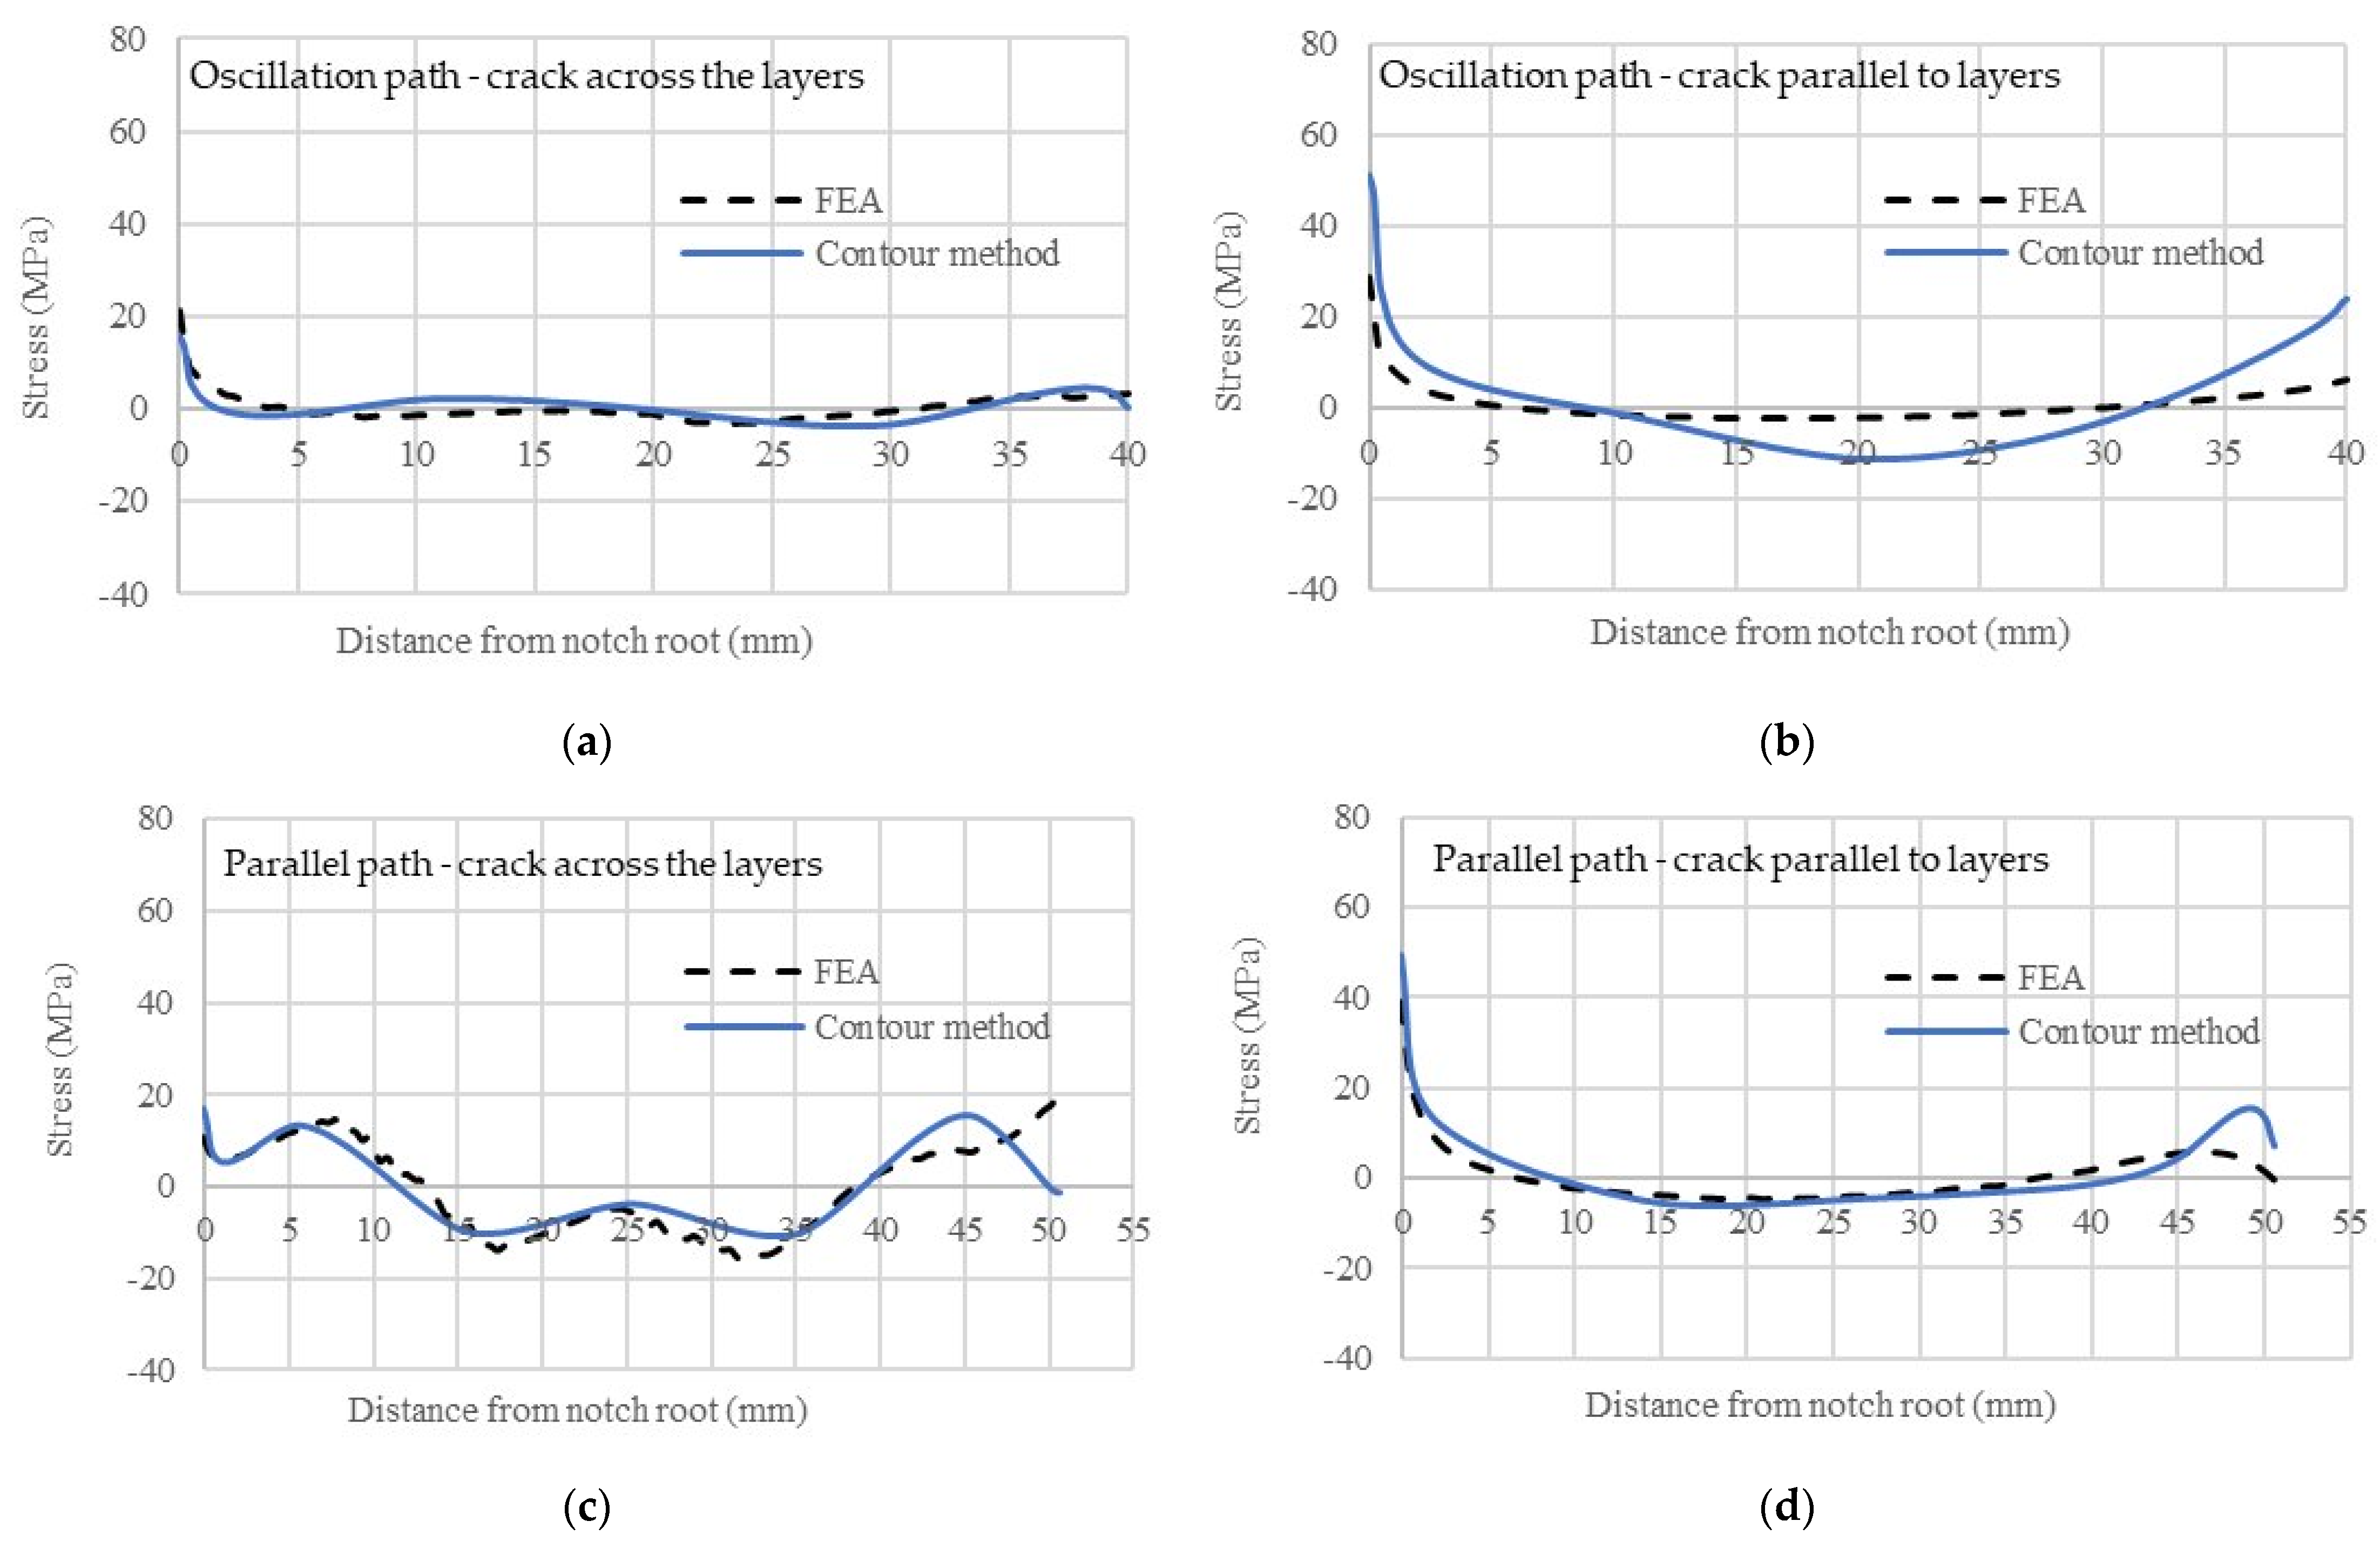
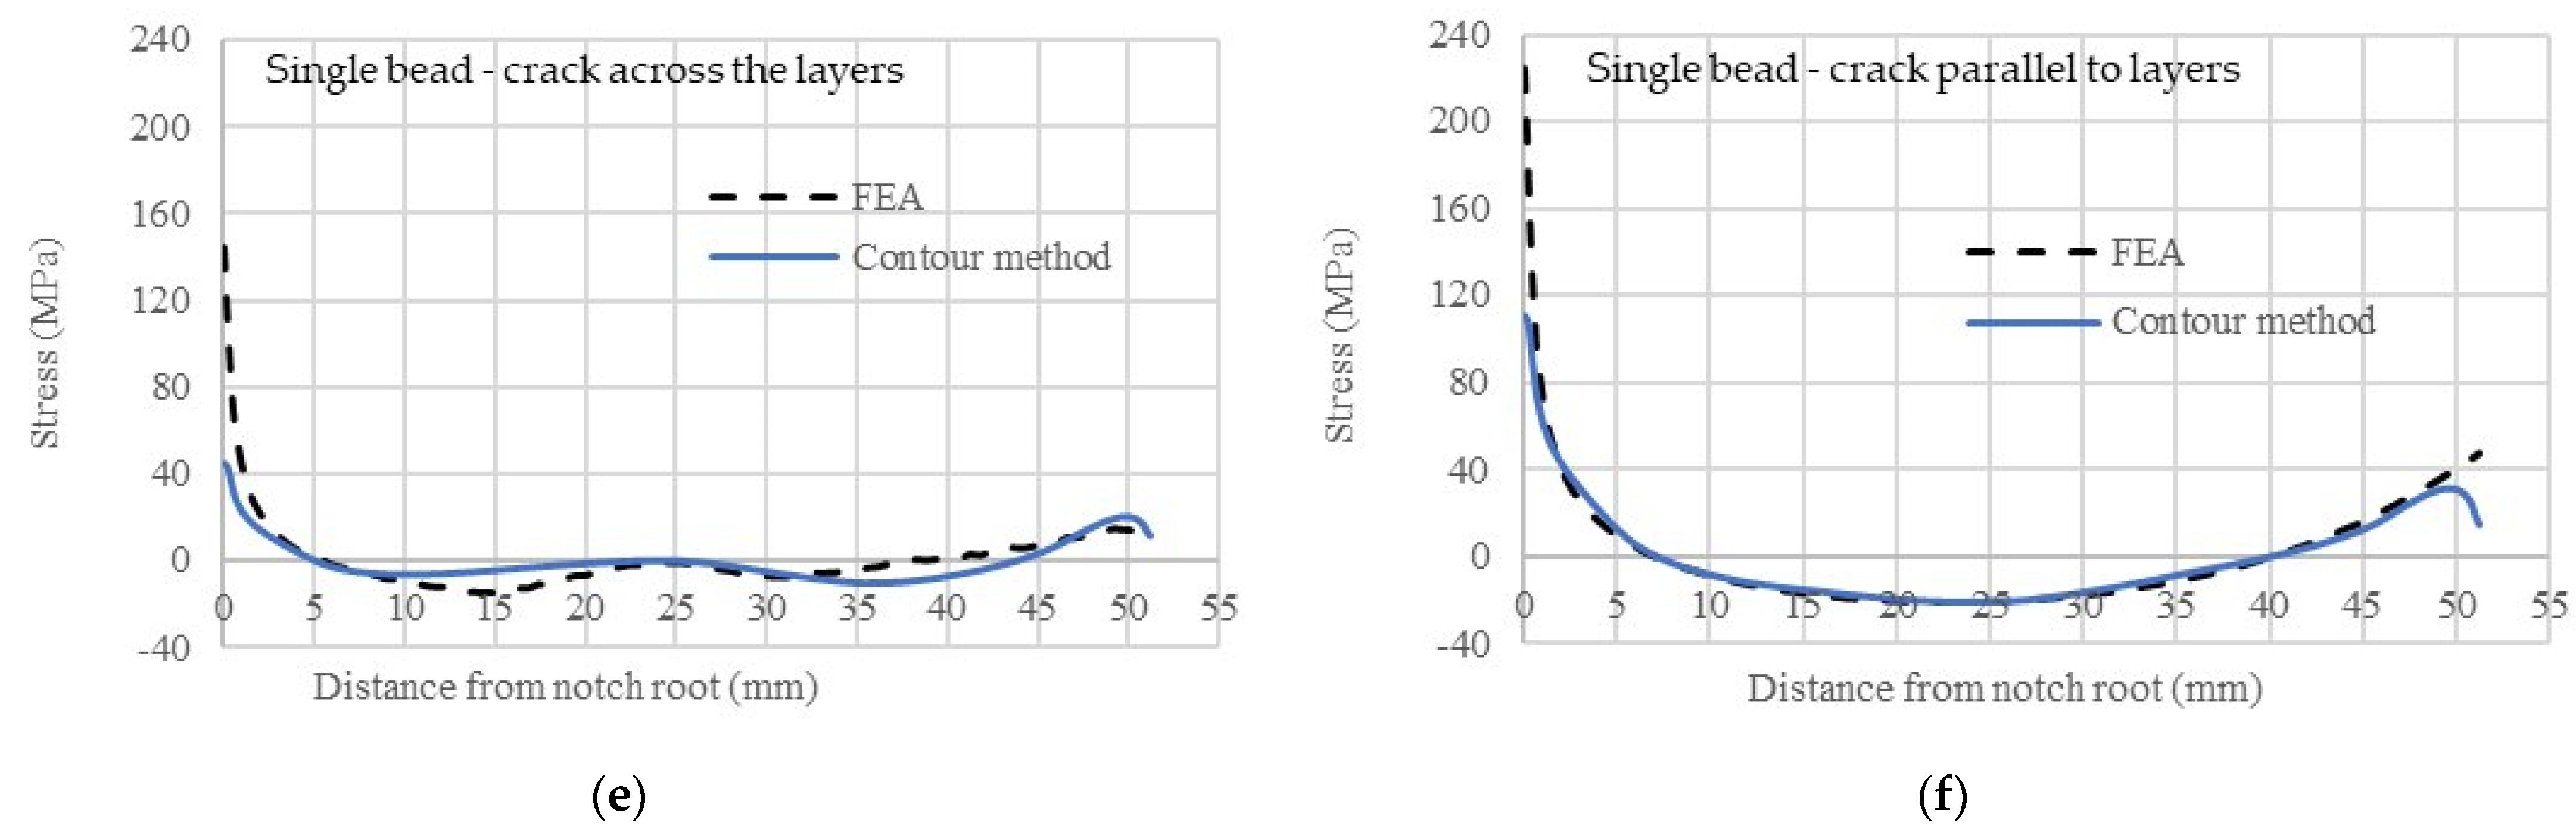
3.5. Residual Stresses in Compact-Tension Coupons (Single Bead, Parallel Path and Oscillation Path)

The compact-tension (C(T)) samples were extracted from the bottom of the walls with various build conditions (single bead continuous deposit and ILP single bead, parallel path, and oscillation path). One sample was oriented for crack growth across the WAAM layers and the other for crack growth parallel to the WAAM layers. The contour results of residual stress are shown in Figure 8.
The following observations can be made:
  • The peak tensile residual stress was at the notch root with lower tensile stress at the back face of the sample; compressive residual stress was in the middle of the coupon. The coupon with crack growth parallel to layers showed higher tensile residual stress at the notch root than the other crack orientation. Away from the notch root, the stress values were comparable to those in the small block samples that had the same dimensions, but without the notch. Therefore, the peak stress at the notch root was caused by the notch stress concentration: i.e., residual stress redistribution after the notch cutting. The difference in stress values between the two crack orientations was also consistent with the stress value difference in the small block samples.
  • C(T) coupons extracted from the oscillation path wall had the lowest tensile residual stress at the notch root.
  • The unpeened single bead coupon showed higher notch root stress (150 MPa) for the orientation with crack growth parallel to the layers.
  • The ILP single bead coupons showed a stress distribution along the coupon length very similar to that of the coupons extracted from the other walls. However, the stress sign at the mid-length and through the thickness was reversed completely compared to that of the unpeened coupons: i.e., low tensile residual stress was seen at the center location and comparatively high compressive residual stress was seen near the surface on both sides, a contrast to the small blocks presented in Section 3.4 that were produced without peening.
The through-thickness averaged residual stress profiles of all C(T) coupons (extracted from the oscillation path, parallel path, single bead, and ILP single bead walls) are compared in Figure 9. The unpeened single bead specimen showed the highest tensile residual stress at the notch root (about 110 MPa for the crack growth direction parallel to the build layers and 45 MPa for crack growth across the layers). The distance from the notch root where the tensile residual stress acts was about 5 mm for the coupon oriented for crack growth across the layers, and 7 mm for crack growth parallel to the layers. Lower tensile residual stress at the notch root was found in the case of coupons extracted from parallel pass and oscillation path walls (about 15 MPa for the crack growth direction across the layers and 45 MPa for the crack growth direction parallel to the layers). The C(T) coupon extracted from the parallel pass build wall showed different stress distribution along the crack path compared to other coupons for the same crack orientation. The ILP single bead coupons showed peak tensile residual stress at the notch root of 80 MPa for the crack growth direction parallel to the layers and 53 MPa for the crack growth direction across the layers. The tensile stress was present within the distance of 5 mm from the notch root.
Since the C(T) coupons were extracted from the wall mid-thickness, residual stress magnitude and distribution also depended on the stress state at and around the mid-thickness of the walls. The notch cutting in the coupons caused local stress concentration, resulting in peak tensile stress at the notch root [41]. The C(T) coupons with crack paths across and parallel to WAAM layers extracted from the single-bead build were tested for fatigue crack growth life previously [42].

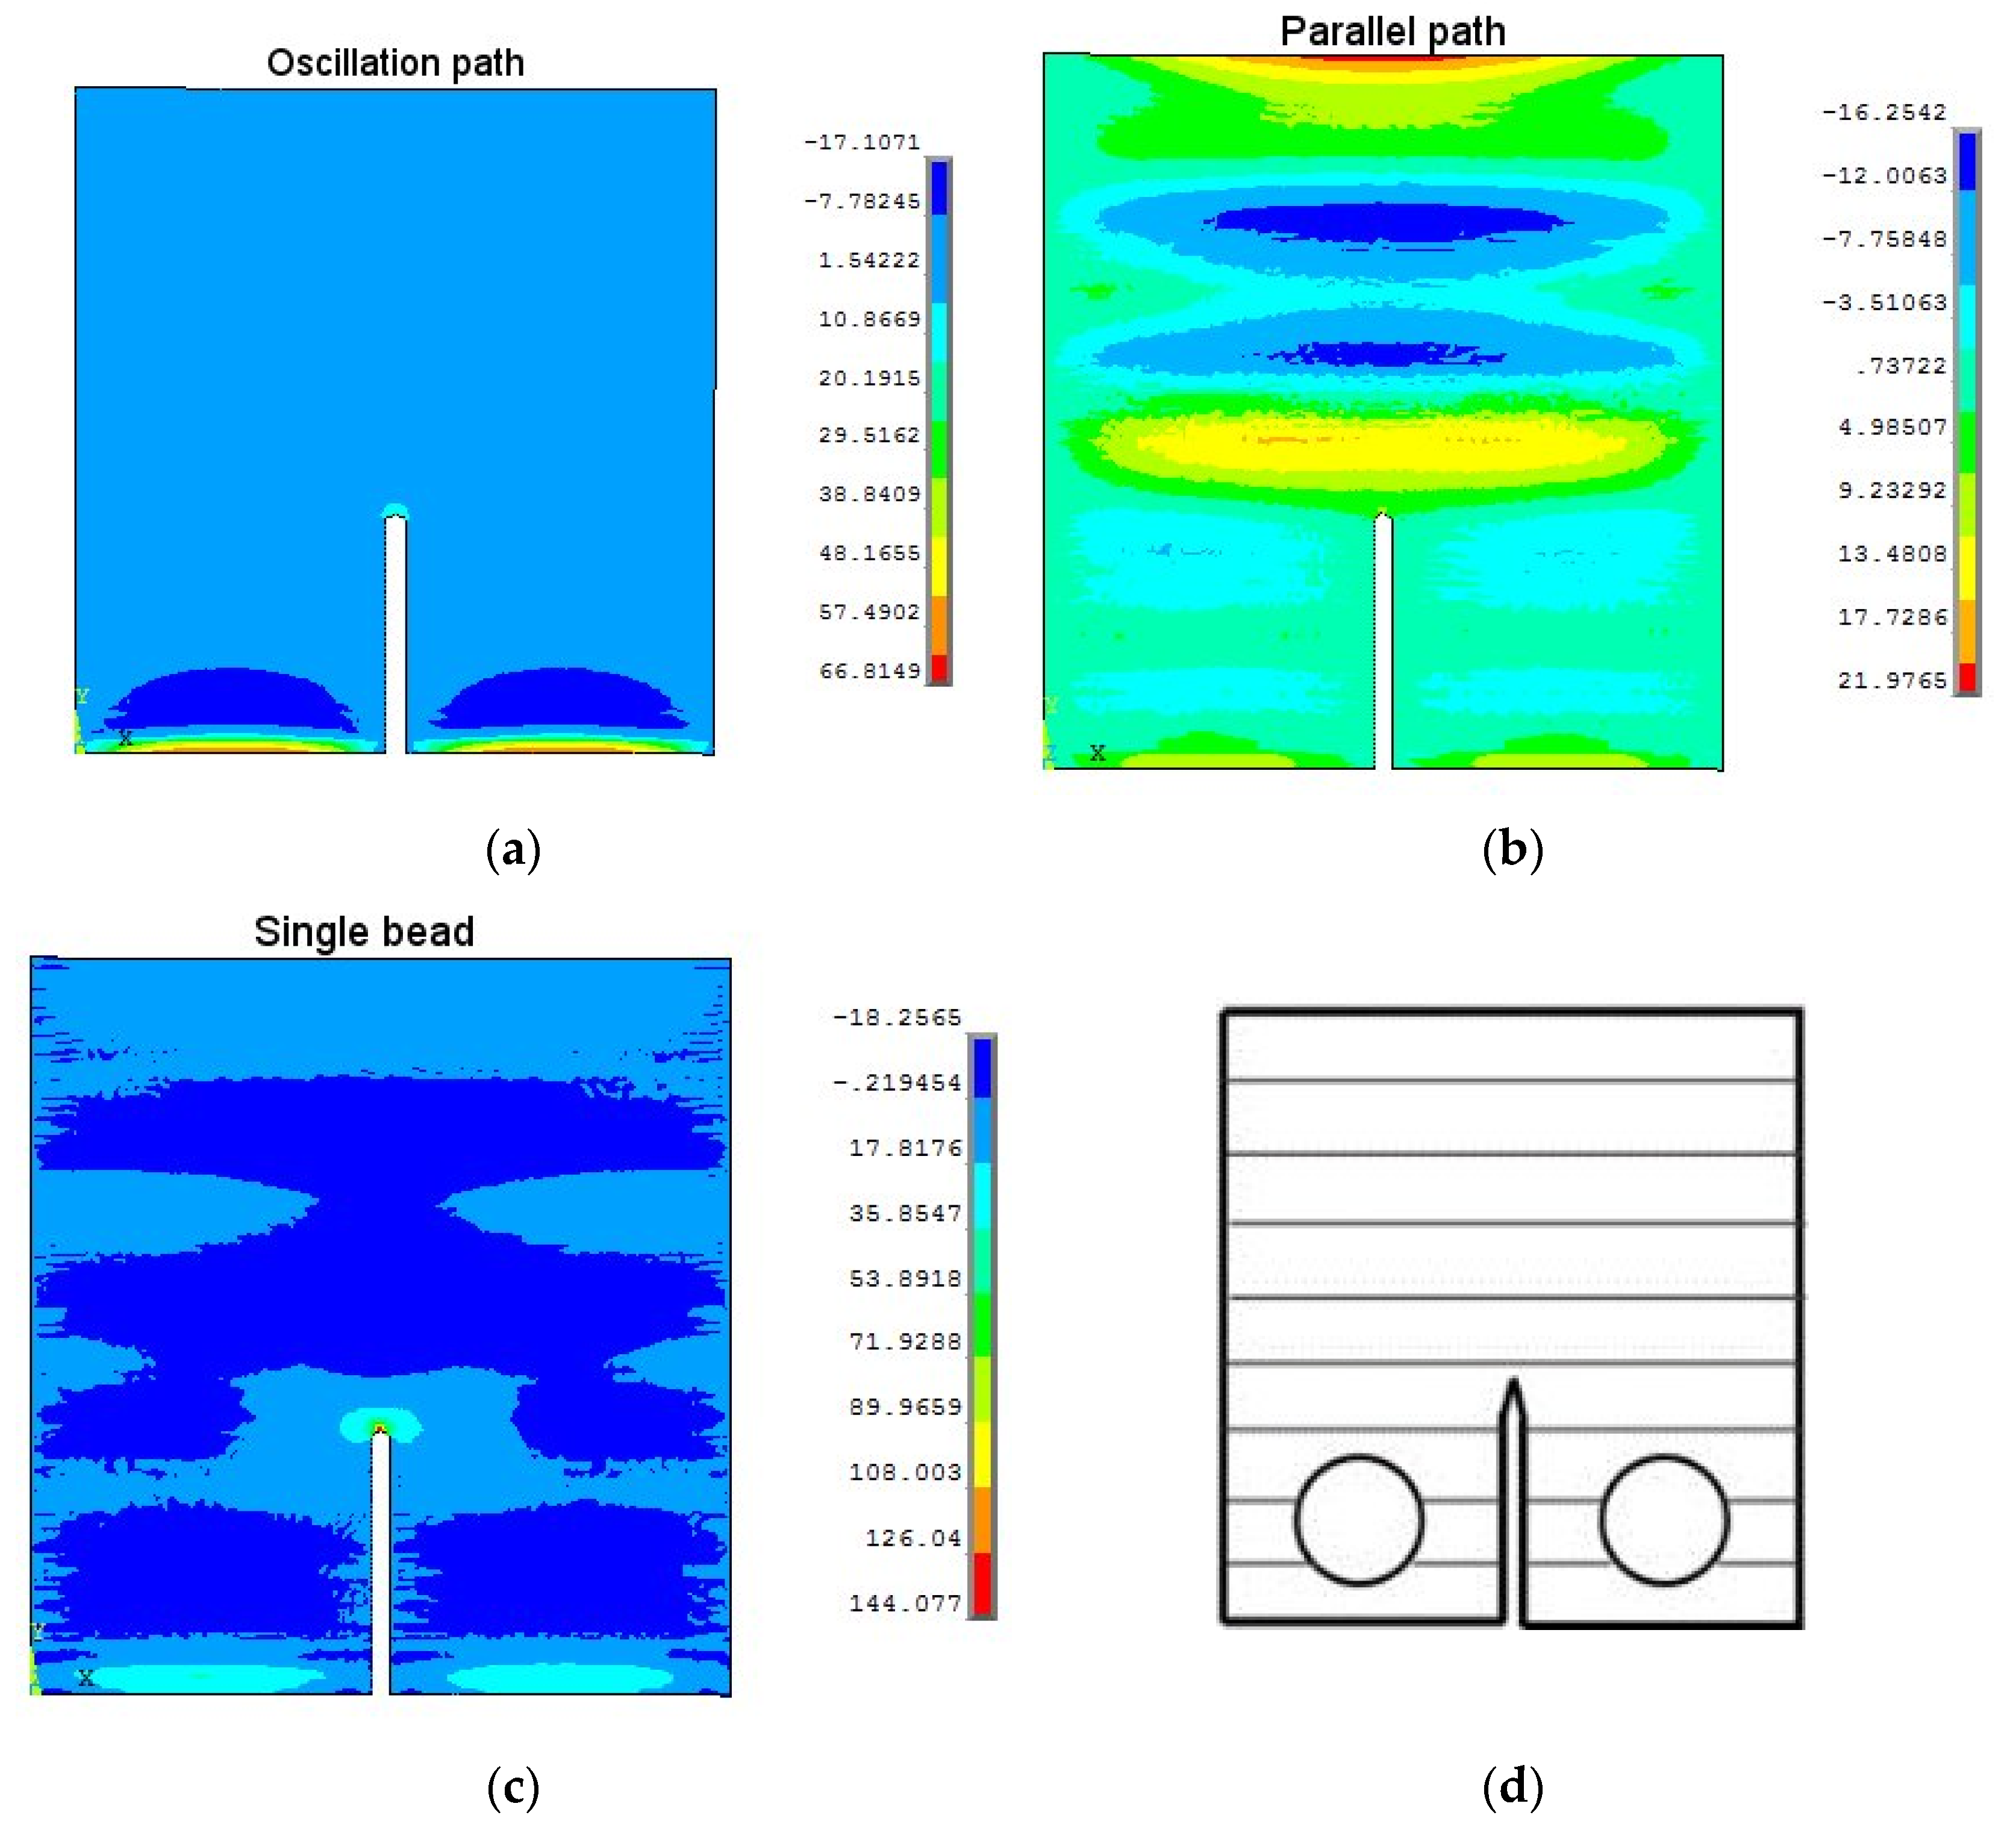
3.6. Finite Element Analysis of C(T) Coupons

Residual stress in the C(T) samples was studied by two-dimensional (2D) finite element analysis (FEA). The model was based on the measured residual stress data in the larger walls obtained from the contour method, as presented in Section 2.2, and using the technique of removing those elements in the wall model that were not part of the C(T) sample. FEA was performed for C(T) coupons extracted from the single bead, parallel path, and oscillation path walls. The numerical results of two types of C(T) coupons (crack across or parallel to the build layers) are shown in Figure 10 and Figure 11. Along the crack path, the FE model showed similar stress distribution and stress values to the results obtained from the contour method.
The residual stress line profiles obtained from FEA along the crack path for both C(T) coupon types (i.e., with the crack growth direction across the layers and with the crack growth direction parallel to the layers) are compared with the contour method results in Figure 12, where the contour method results are the through-thickness averaged stress values. A good agreement was found between the FEA and the contour method results. It should be mentioned here that the residual stress values were low in the compact-tension coupons studied here, especially for this high-strength titanium alloy.

4. Conclusions

Residual stress was estimated in WAAM Ti-6Al-4V walls deposited with three build strategies: single bead, parallel path, and oscillation path. Single bead walls were further investigated for the effects of interlayer hammer peening and changes in interlayer temperature. Compact-tension (C(T)) coupons extracted from the walls of the three different build methods were examined for the presence and effect of residual stress on two different crack growth orientations. FE analysis of residual stress in the C(T) coupons was performed based on the measurements of the large walls. The following conclusions were drawn from this study:
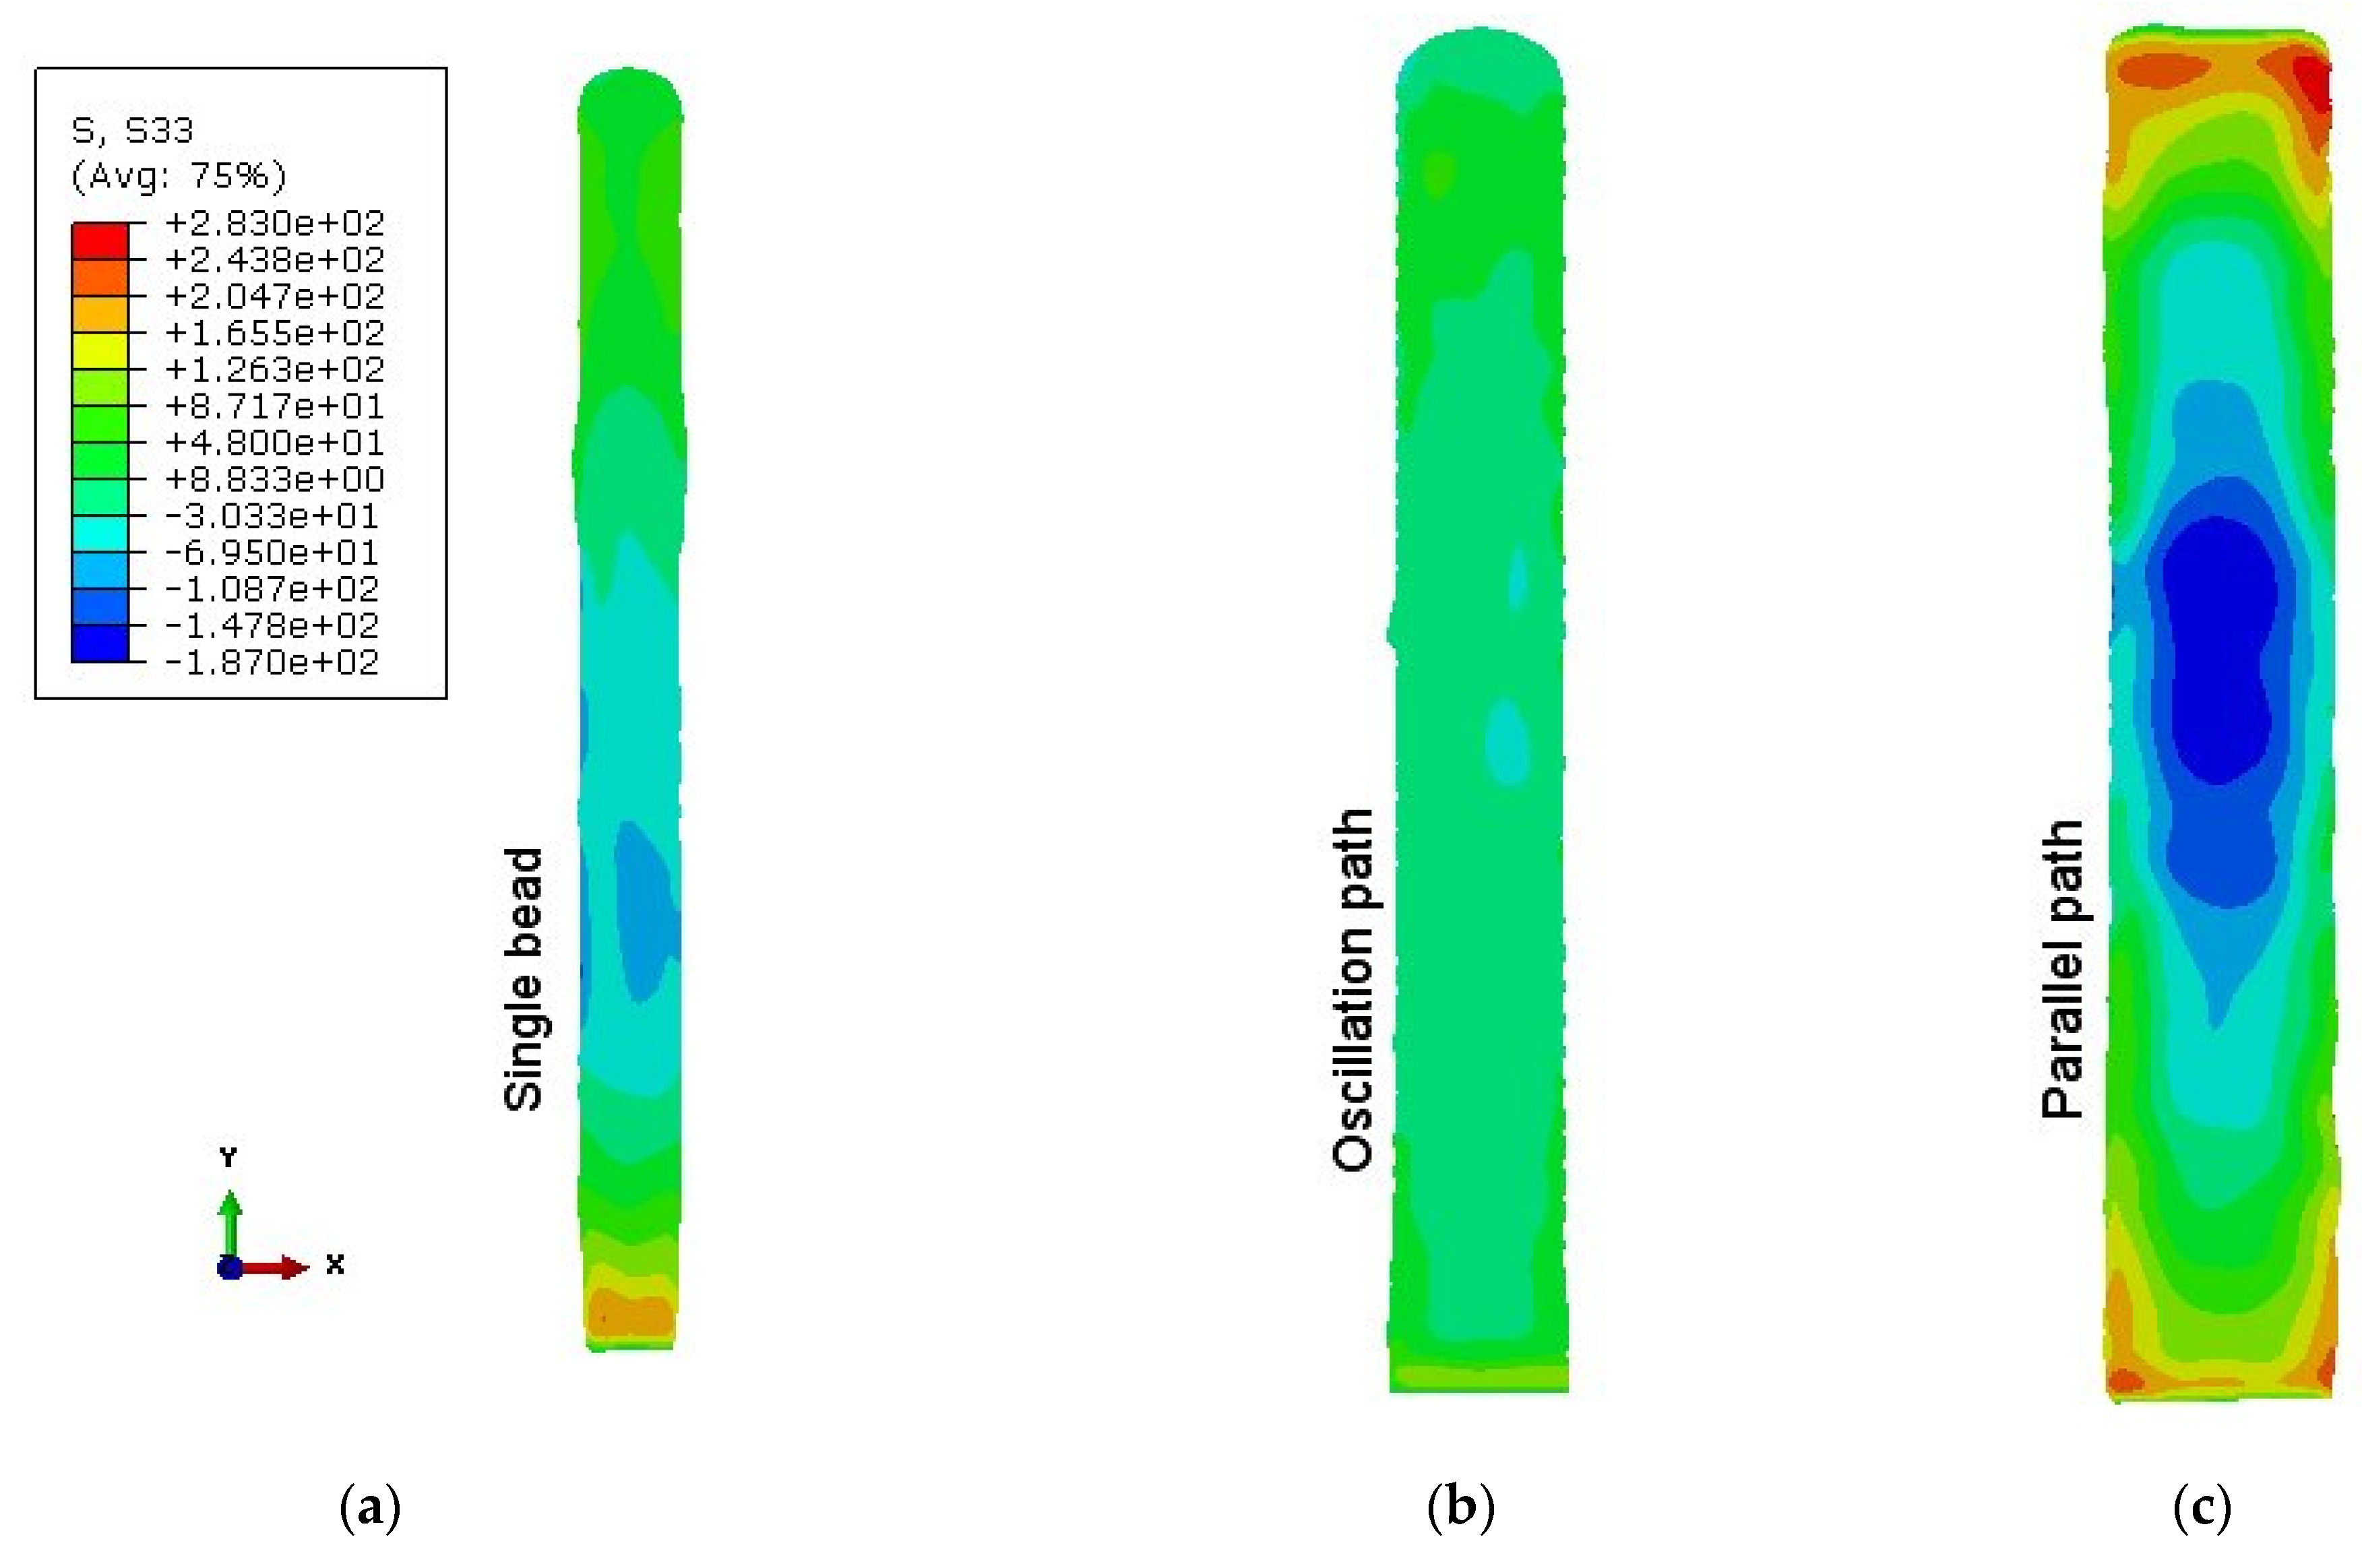
  • After removing the substrate plate, the oscillation path wall showed the lowest tensile residual stress (~100 MPa), and the parallel path wall showed the highest tensile residual stress (~200 MPa). Peak tensile residual stress was found near the wall bottom (where the substrate plate was) for the single bead and oscillation path walls, but the parallel path wall peak tensile stress was at both ends. Compressive residual stress was found in the mid-height of the wall for all cases.
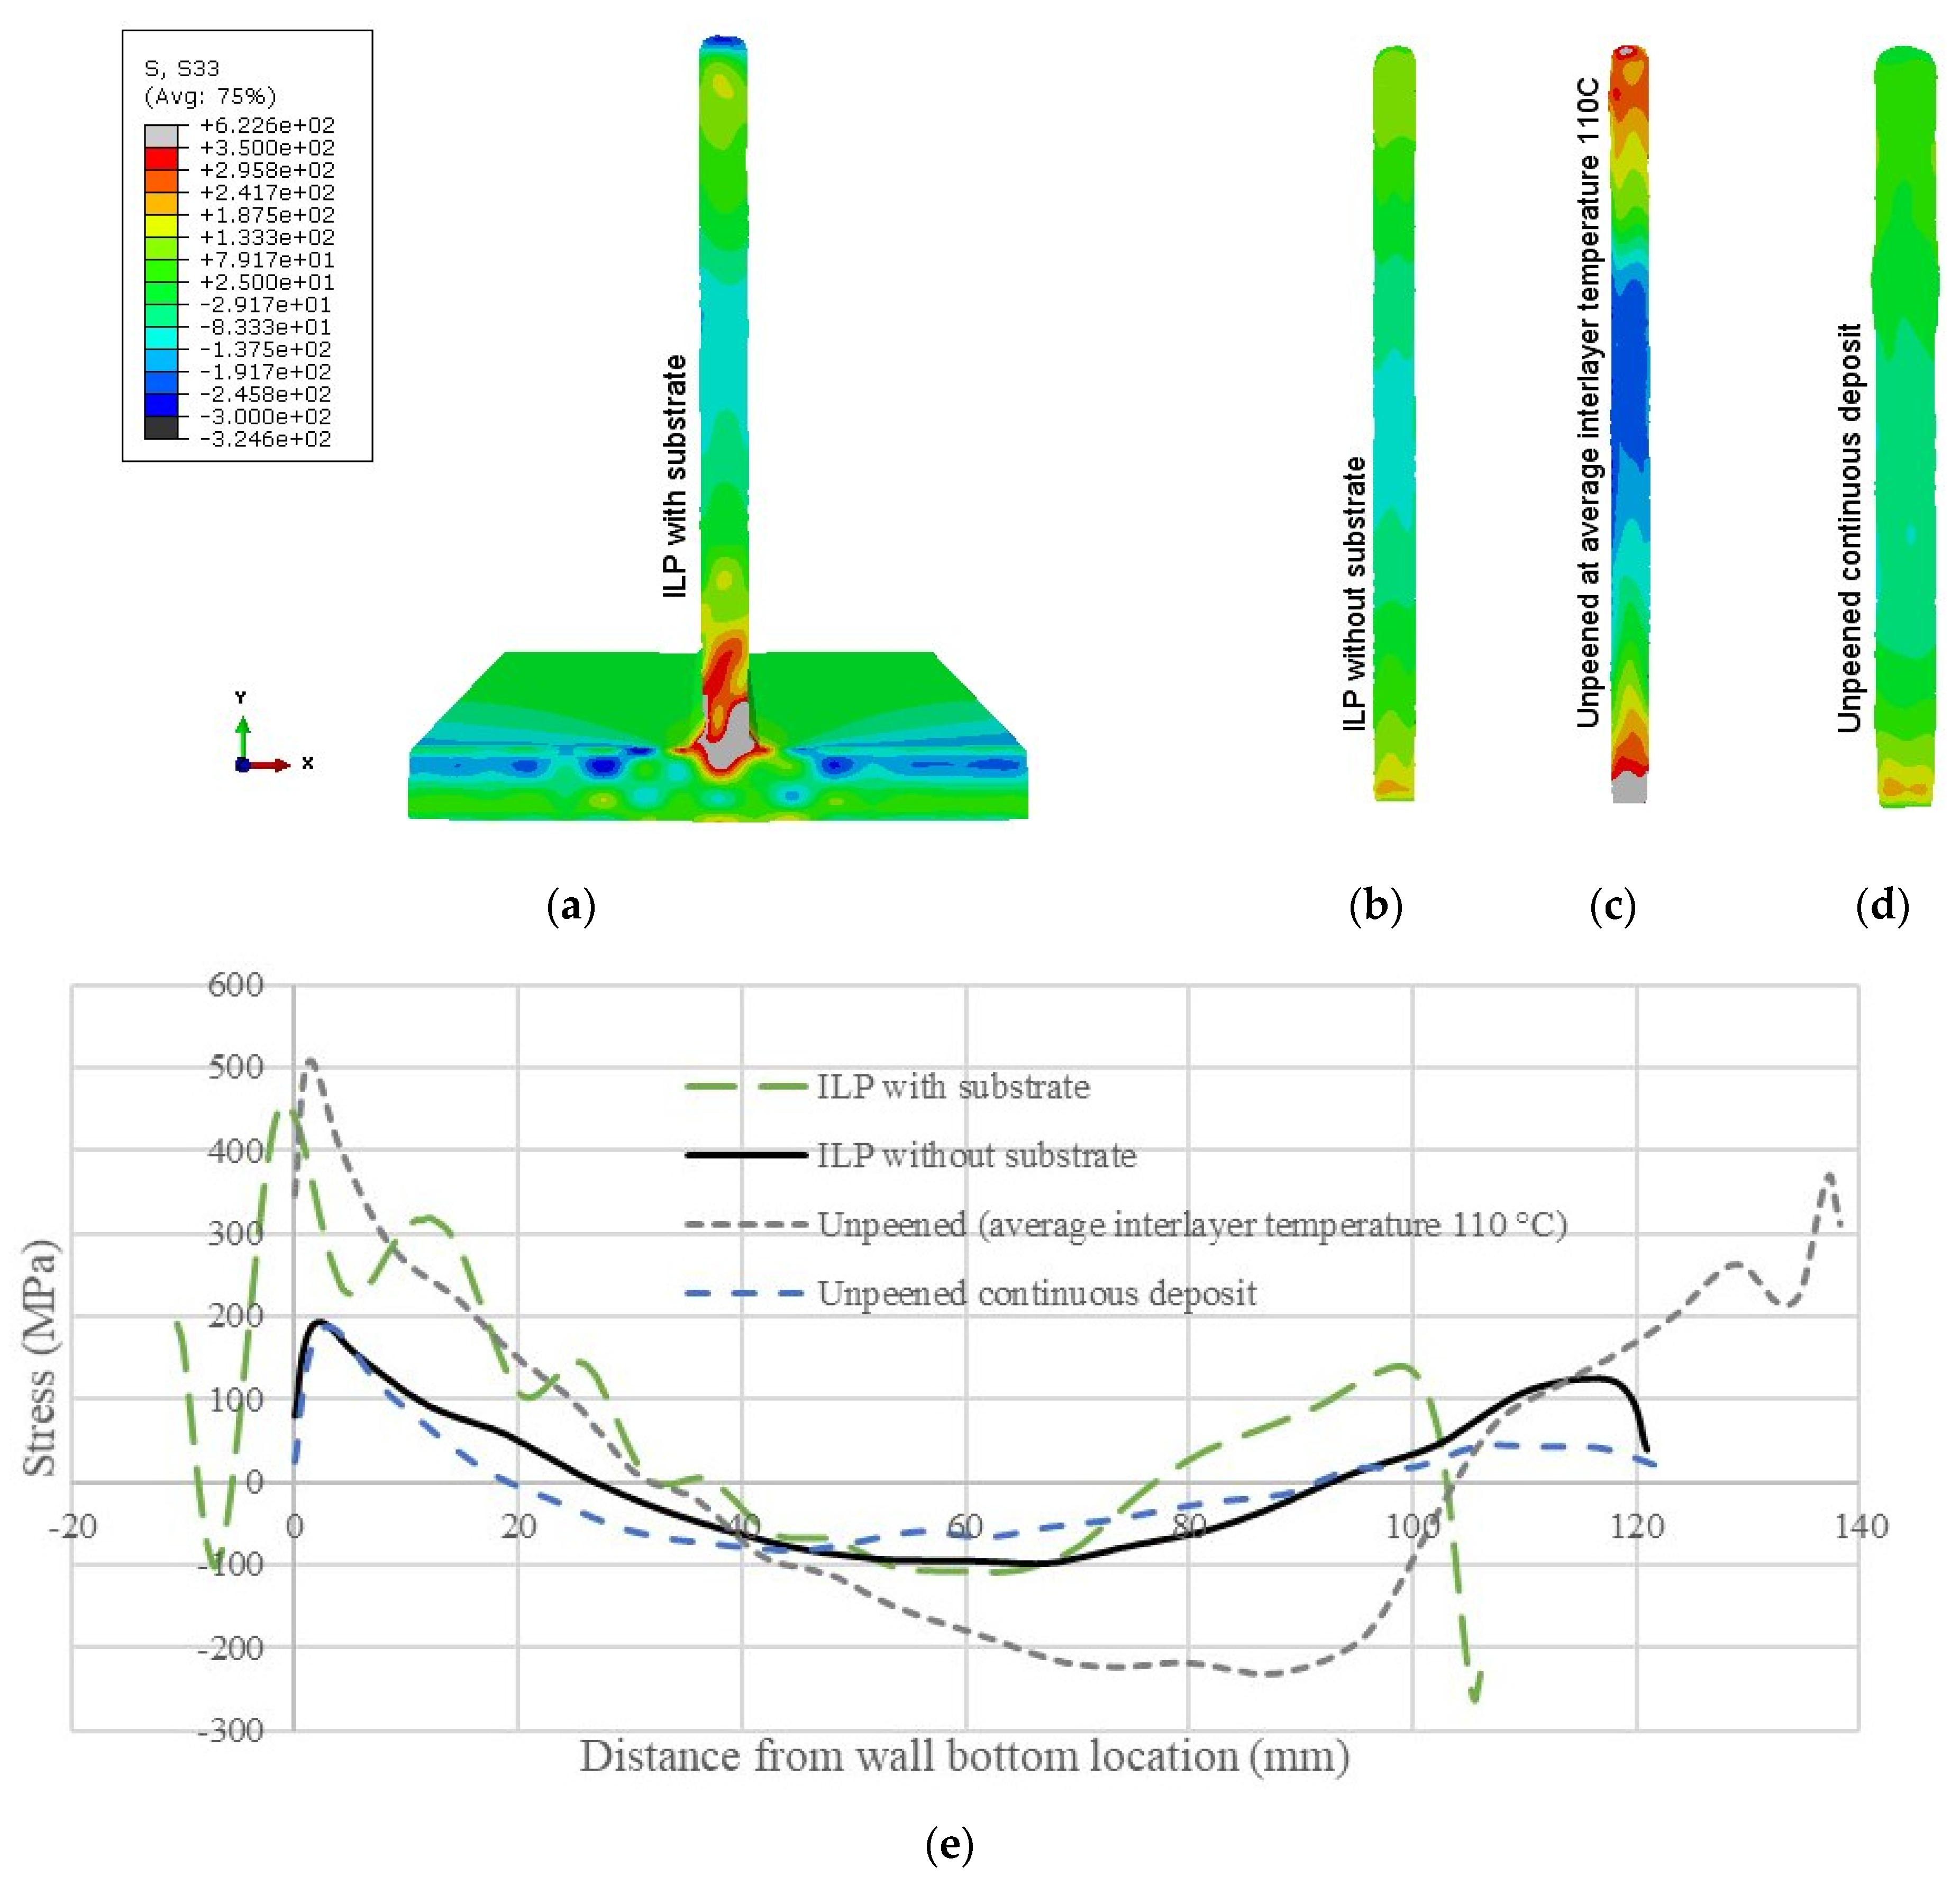
  • For the interlayer peened (ILP) single bead walls, the wall with the substrate plate showed higher tensile residual stress (~600 MPa) at the intersection of the wall and the substrate compared to when the wall was removed from the substrate. The wall with substrate also showed higher compressive residual stress (over 200 MPa) at the wall top location.
  • In the unpeened condition, the single bead wall built with average interlayer temperature 110 °C resulted in much higher tensile residual stress (~500 MPa) at the wall-substrate intersection, and more compressive residual stress (over 200 MPa) at the wall mid-height, compared to the continuous built wall. Interlayer hammer peening reduced tensile residual stress by a factor of 1.5 compared to the unpeened wall (without substrate) at the average interlayer temperature 110 °C.
  • In all compact-tension (C(T)) coupons, peak tensile residual stress was present at the notch root and compressive residual stress wsa present in the middle location. Away from the notch root, residual stress was very low.
  • The C(T) coupons built by the oscillation method showed the lowest tensile residual stress at the notch root, ~15 to 45 MPa, while the single bead samples showed the highest tensile residual stress at the notch root, ~45 to 110 MPa. Coupons with the starter crack parallel to the build layers had higher tensile residual stress than coupons with the starter crack across the layers. C(T) coupons extracted from the interlayer peened (ILP) single bead wall showed similar residual stress as C(T) coupons extracted from three different deposition strategies without ILP, because the residual stresses retained in these small coupons were very low.
  • In C(T) coupons, the measured residual stresses with the contour method agreed well with finite element analysis for both crack orientations.

Author Contributions

Conceptualization, B.A., X.Z. and M.E.F.; methodology, B.A., X.Z. and M.E.F.; formal analysis, B.A.; investigation, B.A.; resources, L.M.S.C.N. and S.W.; data curation, H.G.; writing—original draft preparation, B.A.; writing—review and editing, X.Z., M.E.F., L.M.S.C.N. and S.W.; supervision, X.Z. and M.E.F.; funding acquisition, S.W. All authors have read and agreed to the published version of the manuscript.

Funding

This research was funded by UK Engineering and Physical Sciences Research Council through the NEWAM (New Wire Additive Manufacturing) programme grant (EP/R027218/1).

Institutional Review Board Statement

Not applicable.

Informed Consent Statement

Not applicable.

Data Availability Statement

Available upon request.

Acknowledgments

M.E. Fitzpatrick is grateful for funding from the Lloyd’s Register Foundation, a charitable foundation helping to protect life and property by supporting engineering-related education, public engagement and the application of research. We would also like to thank Steve Damms at the Institute for Advanced Manufacturing and Engineering for his help with the Wire EDM.

Conflicts of Interest

The authors declare no conflict of interest.

References

  1. Cui, C.; Hu, B.; Zhao, L.; Liu, S. Titanium alloy production technology, market prospects and industry development. Mater. Des. 2011, 32, 1684–1691. [Google Scholar] [CrossRef]
  2. Liu, S.; Shin, Y.C. Additive manufacturing of Ti6Al4V alloy: A review. Mater. Des. 2019, 164, 107552. [Google Scholar] [CrossRef]
  3. Mishurova, T.; Sydow, B.; Thiede, T.; Sizova, I.; Ulbricht, A.; Bambach, M.; Bruno, G. Residual Stress and Microstructure of a Ti-6Al-4V Wire Arc Additive Manufacturing Hybrid Demonstrator. Metals 2020, 10, 701. [Google Scholar] [CrossRef]
  4. Williams, S.W.; Martina, F.; Addison, A.C.; Ding, J.; Pardal, G.; Colegrove, P. Wire + Arc Additive Manufacturing. Mater. Sci. Technol. 2016, 32, 641–647. [Google Scholar] [CrossRef] [Green Version]
  5. Li, J.; Zhou, X.; Brochu, M.; Provatas, N.; Zhao, Y.F. Solidification microstructure simulation of Ti-6Al-4V in metal additive manufacturing: A review. Addit. Manuf. 2020, 31, 100989. [Google Scholar] [CrossRef]
  6. Cunningham, C.R.; Flynn, J.M.; Shokrani, A.; Dhokia, V.; Newman, S.T. Invited review article: Strategies and processes for high quality wire arc additive manufacturing. Addit. Manuf. 2018, 22, 672–686. [Google Scholar] [CrossRef]
  7. Wu, B.; Pan, Z.; Ding, D.; Cuiuri, D.; Li, H.; Xu, J.; Norrish, J. A review of the wire arc additive manufacturing of metals: Properties, defects and quality improvement. J. Manuf. Processes 2018, 35, 127–139. [Google Scholar] [CrossRef]
  8. Marineli, G.; Martina, F.; Ganguly, S.; Williams, S. Grain refinement in an unalloyed tantalum structure by combining wire + arc additive manufacturing and vertical cold rolling. Addit. Manuf. 2020, 32, 101009. [Google Scholar] [CrossRef]
  9. Ke, W.C.; Oliveira, J.P.; Cong, B.Q.; Ao, S.S.; Qi, Z.W.; Peng, B.; Zeng, Z. Multi-layer deposition mechanism in ultra high-frequency pulsed wire arc additive manufacturing (WAAM) of NiTi shape memory alloys. Addit. Manuf. 2022, 50, 102513. [Google Scholar] [CrossRef]
  10. Rodrigues, T.A.; Bairrão, N.; Farias, F.W.C.; Shamsolhodaei, A.; Shen, J.; Zhou, N.; Maawad, E.; Schell, N.; Santos, T.G.; Oliveira, J.P. Steel-copper functionally graded material produced by twin-wire and arc additive manufacturing (T-WAAM). Mater. Des. 2022, 213, 110270. [Google Scholar] [CrossRef]
  11. Wang, F.; Williams, S.; Colegrove, P.; Antonysamy, A.A. Microstructure and mechanical properties of wire and arc additive manufactured Ti-6Al-4V. Metall. Mater. Trans. A 2013, 44, 968–977. [Google Scholar] [CrossRef]
  12. Jafari, D.; Vaneker, T.H.J.; Gibson, I. Wire and arc additive manufacturing: Opportunities and challenges to control the quality and accuracy of manufactured parts. Mater. Des. 2021, 202, 109471. [Google Scholar] [CrossRef]
  13. Karayel, E.; Bozkurt, Y. Additive manufacturing method and different welding applications. J. Mater. Res. Technol. 2020, 9, 11424–11438. [Google Scholar] [CrossRef]
  14. Dinovitzer, M.; Chen, X.; Laliberte, J.; Huang, X.; Frei, H. Effect of wire and arc additive manufacturing (WAAM) process parameters on bead geometry and microstructure. Addit. Manuf. 2019, 26, 138–146. [Google Scholar] [CrossRef]
  15. Paolinia, A.; Kollmannsberger, S.; Rank, E. Additive manufacturing in construction: A review on processes, applications, and digital planning methods. Addit. Manuf. 2019, 30, 100894. [Google Scholar] [CrossRef]
  16. Acevedo, R.; Sedlak, P.; Kolman, R.; Fredel, M. Residual stress analysis of additive manufacturing of metallic parts using ultrasonic waves: State of the art review. J. Mater. Res. Technol. 2020, 9, 9457–9477. [Google Scholar] [CrossRef]
  17. Wu, Q.; Mukherjee, T.; Dec, A.; DebRoy, T. Residual stresses in wire-arc additive manufacturing–Hierarchy of influential variables. Addit. Manuf. 2020, 35, 101355. [Google Scholar] [CrossRef]
  18. Lu, X.; Chiumenti, M.; Cervera, M.; Li, J.; Lin, X.; Ma, L.; Zhang, G.; Liang, E. Substrate design to minimize residual stresses in directed energy deposition AM processes. Mater. Des. 2021, 202, 109525. [Google Scholar] [CrossRef]
  19. Montevecchi, F.; Venturini, G.; Grossi, N.; Scippa, A.; Campatelli, G. Idle time selection for wire-arc additive manufacturing: A finite element-based Technique. Addit. Manuf. 2018, 21, 479–486. [Google Scholar] [CrossRef]
  20. Lu, X.; Lin, X.; Chiumenti, M.; Cervera, M.; Hu, Y.; Ji, X.; Ma, L.; Yang, H.; Huang, W. Residual stress and distortion of rectangular and S-shaped Ti-6Al-4V parts by Directed Energy Deposition: Modelling and experimental calibration. Addit. Manuf. 2019, 26, 166–179. [Google Scholar] [CrossRef]
  21. Honnige, J.R.; Colegrove, P.; Williams, S. Improvement of Microstructure and Mechanical Properties in Wire + Arc Additively Manufactured Ti-6Al-4V with Machine Hammer Peening. Procedia Eng. 2017, 216, 8–17. [Google Scholar] [CrossRef]
  22. Asensio Dominguez, L.; Xu, F.; Shokrani, A.; Flynn, J.M.; Dhokia, V.; Newman, S.T. Guidelines when considering pre & post processing of large metal additive manufactured parts. Procedia Manuf. 2020, 51, 684–691. [Google Scholar]
  23. Shen, C.; Reid, M.; Liss, K.-D.; Pan, Z.; Ma, Y.; Cuiuri, D.; van Duin, S.; Li, H. Neutron diffraction residual stress determinations in Fe3Al based iron aluminide components fabricated using wire-arc additive manufacturing (WAAM). Addit. Manuf. 2019, 29, 100774. [Google Scholar] [CrossRef]
  24. Ahmad, B.; van der Veen, S.O.; Fitzpatrick, M.E.; Guo, H. Residual stress evaluation in selective-laser-melting additively manufactured titanium (Ti-6Al-4V) and Inconel 718 using the contour method and numerical simulation. Addit. Manuf. 2018, 22, 571–582. [Google Scholar] [CrossRef]
  25. Huang, H.; Ma, N.; Chen, J.; Feng, Z.; Murakawa, H. Toward large-scale simulation of residual stress and distortion in wire and arc additive manufacturing. Addit. Manuf. 2020, 34, 101248. [Google Scholar] [CrossRef]
  26. Szost, B.A.; Terzi, S.; Martina, F.; Boisselier, D.; Prytuliak, A.; Pirling, T.; Hofmann, M.; Jarvis, D.J. A comparative study of additive manufacturing techniques: Residual stress and microstructural analysis of CLAD and WAAM printed Ti–6Al–4V components. Mater. Des. 2016, 89, 559–567. [Google Scholar] [CrossRef] [Green Version]
  27. Hönnige, J.; Seow, C.E.; Ganguly, S.; Xu, X.; Cabeza, S.; Coules, H.; Williams, S. Study of residual stress and microstructural evolution in as-deposited and inter-pass rolled wire plus arc additively manufactured Inconel 718 alloy after ageing treatment. Mater. Sci. Eng. A 2021, 801, 140368. [Google Scholar] [CrossRef]
  28. Martina, F.; Roy, M.J.; Szost, B.A.; Terzi, S.; Colegrove, P.A.; Williams, S.W.; Withers, P.J.; Meyer, J.; Hofmann, M. Residual stress of as-deposited and rolled wire + arc additive manufacturing Ti-6Al-4V components. Mater. Sci. Technol. 2016, 32, 1439–1448. [Google Scholar] [CrossRef] [Green Version]
  29. Kohler, M.; Fiebig, S.; Hensel, J.; Dilger, K. Wire and Arc Additive Manufacturing of Aluminum Components. Metals 2019, 9, 608. [Google Scholar] [CrossRef] [Green Version]
  30. Hönnige, J.R.; Colegrove, P.A.; Ahmad, B.; Fitzpatrick, M.E.; Ganguly, S.; Lee, T.L.; Williams, S.W. Residual stress and texture control in Ti-6Al-4V wire + arc additively manufactured intersections by stress relief and rolling. Mater. Des. 2018, 150, 193–205. [Google Scholar] [CrossRef] [Green Version]
  31. Liu, C.; Lin, C.; Wang, J.; Yan, L.; Luo, Y.; Yang, M. Residual stress distributions in thick specimens excavated from a large circular wire+arc additive manufacturing mockup. J. Manuf. Process. 2020, 56, 474–481. [Google Scholar] [CrossRef]
  32. Prime, M.B. Cross-Sectional Mapping of Residual Stresses by Measuring the Surface Contour After a Cut. Eng. Mater. Technol. 2000, 123, 162–168. [Google Scholar] [CrossRef] [Green Version]
  33. Zhang, J.; Zhang, X.; Wang, X.; Ding, J.; Traoré, Y.; Paddea, S.; Williams, S. Crack path selection at the interface of wrought and wire + arc additive manufactured Ti-6Al-4V. Mater. Des. 2016, 104, 365–375. [Google Scholar] [CrossRef] [Green Version]
  34. Zhang, X.; Martina, F.; Syed, A.K.; Wang, X.; Ding, J.; Williams, S.W. Fatigue crack growth in additive manufactured titanium: Residual stress control and life evaluation method development. In Proceedings of the 29th Symposium of International Committee on Aeronautical Fatigue, Nagoya, Japan, 5–9 June 2017. [Google Scholar]
  35. Ahmad, B.; van der Veen, S.O.; Fitzpatrick, M.E.; Guo, H. Measurement and modelling of residual stress in wire-feed additively manufactured titanium. Mater. Sci. Technol. 2018, 34, 2250–2259. [Google Scholar] [CrossRef]
  36. Johnson, G. Residual Stress Measurement Using Contour Method. Ph.D. Thesis, The University of Manchester, Manchester, UK, 2008. [Google Scholar]
  37. Wang, X. Predicting Fatigue Crack Growth Life in Additive Manufactured Titanium Alloy. Ph.D. Thesis, Coventry University, Coventry, UK, 2016. [Google Scholar]
  38. Law, M.; Kirstein, O.; Luzin, V. An Assessment of the Effect of Cutting Welded Samples on Residual Stress Measurements by Chill Modelling. J. Strain Anal. Eng. Des. 2010, 45, 567–573. [Google Scholar] [CrossRef]
  39. Liljedahl, C.D.M.; Tan, M.L.; Zanellato, O.; Ganguly, S.; Fitzpatrick, M.E.; Edwards, L. Evolution of Residual Stresses with Fatigue Loading and Subsequent Crack Growth in a Welded Aluminium Alloy Middle Tension Specimen. Eng. Fract. Mech. 2008, 75, 3881–3894. [Google Scholar] [CrossRef]
  40. Derekar, K.; Ahmad, B.; Zhang, X.; Joshi, S.; Lawrence, J.; Xu, L.; Addison, A.; Melton, G. Effects of process variants on residual stresses in wire arc additive manufacturing of aluminium alloy 5183. J. Manuf. Sci. Eng. 2022, 144, 071005. [Google Scholar] [CrossRef]
  41. Zhang, J.; Wang, X.; Paddea, S.; Zhang, X. Fatigue crack propagation behaviour in wire+arc additive manufactured Ti-6Al-4V: Effects of microstructure and residual stress. Mater. Des. 2016, 90, 551–561. [Google Scholar] [CrossRef]
  42. Zhang, X.; Martina, F.; Ding, J.; Wang, X.; Williams, S.W. Fracture toughness and fatigue crack growth rate properties in wire+arc additive manufactured Ti-6Al-4V. Fatigue Fract. Eng. Mater. Struct. 2017, 40, 790–803. [Google Scholar] [CrossRef] [Green Version]
Figure 1. Deposition strategies for WAAM Ti-6Al-4V walls: (a) single bead, (b) parallel path, (c) oscillation path (LD = longitudinal direction (torch movement direction), ND = normal direction, TD = transverse direction).
Metals 12 00253 g001
Figure 2. WAAM walls (a) oscillation path, (b) single bead with interlayer hammer peening, (c) sketch showing contour cut location on walls and extraction location of C(T) coupons, (d) sketch depicting contour cut and crack orientations for small blocks and C(T) coupons.
Metals 12 00253 g002
Figure 3. (a) Sketch and (b) measured perimeter for single bead, parallel path and oscillation path walls.
Metals 12 00253 g003
Figure 4. Residual stress profile (through-thickness averaged) of a wrought Ti-6Al-4V plate in as-received and stress-relieved conditions.
Metals 12 00253 g004
Figure 5. Residual stress results of single bead walls of different build conditions: (ad) stress maps, (e) stress profiles at mid-thickness from the bottom to top of the walls.
Metals 12 00253 g005
Figure 6. Residual stresses in the single bead (10 mm × 123 mm), parallel path (20 mm × 150 mm) and oscillation path (25 mm × 152 mm) walls: (ac) stress maps, (d) stress profiles (value at the mid-thickness).
Metals 12 00253 g006aMetals 12 00253 g006b
Figure 7. Residual stress in extracted small blocks from the oscillation path wall: (a) stress map for cut across the layers (62.5 mm × 20 mm), (b) stress map for cut parallel to layers (62.5 mm × 20 mm), (c) stress profiles.
Metals 12 00253 g007
Figure 8. Residual stress results from the compact-tension (C(T)) coupons: (ad) crack across the layers, (eh) crack parallel to layers; in various build conditions as indicated.
Metals 12 00253 g008aMetals 12 00253 g008b
Figure 9. Through-thickness averaged residual stress profiles from the compact-tension (C(T)) coupons: (a) crack across the layers, (b) crack parallel to layers.
Metals 12 00253 g009
Figure 10. FE stress maps of CT coupons with crack across the build layers: (a) oscillation path (60 mm × 62.5 mm), (b) parallel path (76 mm × 80 mm), (c) single bead (76 mm × 80 mm), (d) sketch of the crack orientation (unit: MPa).
Metals 12 00253 g010
Figure 11. FE stress maps of CT coupons with cracks parallel to the build layers: (a) oscillation path (62.5 mm × 62 mm), (b) parallel path (80 mm × 76 mm), (c) single bead (80 mm × 76 mm), (d) sketch of the crack orientation (unit: MPa).
Metals 12 00253 g011aMetals 12 00253 g011b
Figure 12. Comparison of residual stress profiles obtained from FEA and contour method for compact-tension (C(T)) specimens; build method and crack orientation are labled in the figures (af).
Metals 12 00253 g012aMetals 12 00253 g012b
Table 1. Process parameters for the WAAM walls studied in this paper.
Wire Diameter (mm)Work Piece Distance (mm)Current (A)Wire Feed Rate (m/min)Torch Travel Speed (mm/s)Plasma Gas Flow (L/min)Shielding Gas Flow (L/min)
1.281452.450.88
Table 2. Interlayer hammer peening parameters for single bead WAAM walls.
ToolImpact Energy (J)Insert Radius (mm)Step Size
(mm)
Peening Speed (mm/min)
Atlas Copco
(Model RRH06P)
6104150
Publisher’s Note: MDPI stays neutral with regard to jurisdictional claims in published maps and institutional affiliations.

