Article

Relation between the Fatigue and Fracture Ductile-Brittle Transition in S500 Welded Steel Joints

1
Institute of Ship Structural Design and Analysis, Hamburg University of Technology, 21073 Hamburg, Germany
2
German Aerospace Centre (DLR), Institute of Maritime Energy Systems, 21502 Geesthacht, Germany
3
Department of Maritime and Transport Technology, Delft University of Technology, 2628 Delft, The Netherlands
*
Author to whom correspondence should be addressed.
Metals 2022, 12(3), 385; https://doi.org/10.3390/met12030385
Submission received: 19 January 2022 / Revised: 9 February 2022 / Accepted: 15 February 2022 / Published: 23 February 2022
(This article belongs to the Special Issue Low-Temperature Behavior of Metals)

Abstract

:
The formation and propagation of cracks occur through irreversible dislocation movements at notches, material defects, and grain boundaries. Since this process is partly thermally controlled, the resistance to dislocation movements at low temperatures increases. This slows both fatigue initiation and fatigue crack propagation. From recent experimental data, it can be seen that fatigue crack growth is accelerated below the fatigue transition temperature (FTT) that correlates with the ductile-brittle transition temperature (DBTT) found by well-known fracture mechanics tests, i.e., Charpy impact, fracture toughness, and CTOD. Hence, this study investigates the relation between FTT and DBTT in S500 high-strength steel base material and welded joints at low temperatures using fatigue crack growth, fracture toughness tests as well as scanning electron microscopy. From the tests, an almost constant decrease in fatigue crack propagation rate is determined with decreasing test temperature even below the DBTT. At −100 °C, the fatigue crack propagation rate is about half of the rate observed at room temperature for both base material and weld metal.

1. Introduction

Low temperatures cause challenging conditions for the structural integrity of steel structures in Arctic regions [1]. In order to ensure the safety of these structures against brittle failure, the structural design has to account for the static and dynamic structural responses that are often more severe than for other engineering structures [2,3,4,5,6]. In particular, the combination of high ice-related loads and low temperatures is difficult to account for in design [7,8,9,10,11,12,13,14,15,16,17,18]. This problem is amplified by the lack of comprehensive guidance for low-temperature fatigue strength assessment of steel structures. A major knowledge gap in this regard is the relation between the fatigue and fracture ductile-brittle transition in welded steel joints.
With decreasing temperature, ferritic structural steels may undergo a ductile-to-brittle transition (DBT) behavior, which is characteristic of steels with a body-centered cubic (bcc) crystal structure. At temperatures below the ductile-to-brittle transition temperatures (DBTT), the mechanism of stable crack extension behavior changes from plastic blunting and tearing to cleavage-controlled brittle fracture. Temperatures below the fatigue transition temperatures (FTT) may result in the fatigue behavior showing an acceleration of crack propagation rates; however, the relation between static and fatigue transition temperature is currently purely empirical, see [19,20,21,22]. Thus, a better understanding of the effect of temperature on fatigue damage mechanisms (fatigue crack initiation and propagation) is required to avoid detrimental fatigue performance at low temperatures and to use the beneficial effect of improved fatigue strength above the FTT, see Braun and Ehlers [23].
Alvaro et al. [24] provide a first extensive literature review on the effect of low temperature on the different aspects of the fatigue life of steels and their weldments; however, the discussion is mainly limited to fatigue crack initiation and propagation in base materials, due to the absence of literature on welded joints.
In two recent studies [19,25], Alvaro et al. extended their findings to thermally weld simulated materials (Gleeble machine tests); however, we are unaware of any comprehensive assessment of the relation between the fatigue and fracture ductile-brittle transition in actual welded steel joints. Hence, the current study aims at describing the relation of FTT and DBTT by means of (i) fatigue crack growth (FCG) rate tests, and (ii) Charpy impact and fracture toughness tests of a high-strength S500 structural steel and welded joints. To this goal, FCG rate tests were performed using single test specimens under constant crack tip loading conditions by successively reducing the test temperature. The underlying idea is that this allows minimizing specimen and setup-related uncertainties (due to welding-related deformations, defects, and microstructure). In particular, the microstructure is known to highly affect fatigue and fracture transition behavior, see [26,27,28,29,30,31]. For reference, FCG curves were determined for both the base material and the welded joints. Finally, the results are assessed by fracture surface investigations using scanning electron microscopy.
Knowledge about the actual material behavior under static fracture and cyclic fatigue behavior of welded joints at sub-zero temperatures is of major importance to ensure the structural integrity of engineering structures operating in Arctic regions but also for other applications such as aerospace or general cryogenic environments. Hence, this study seeks to help to gain knowledge on the relation between fatigue and fracture transition behavior for actual welded joints.

2. Methods and Setup

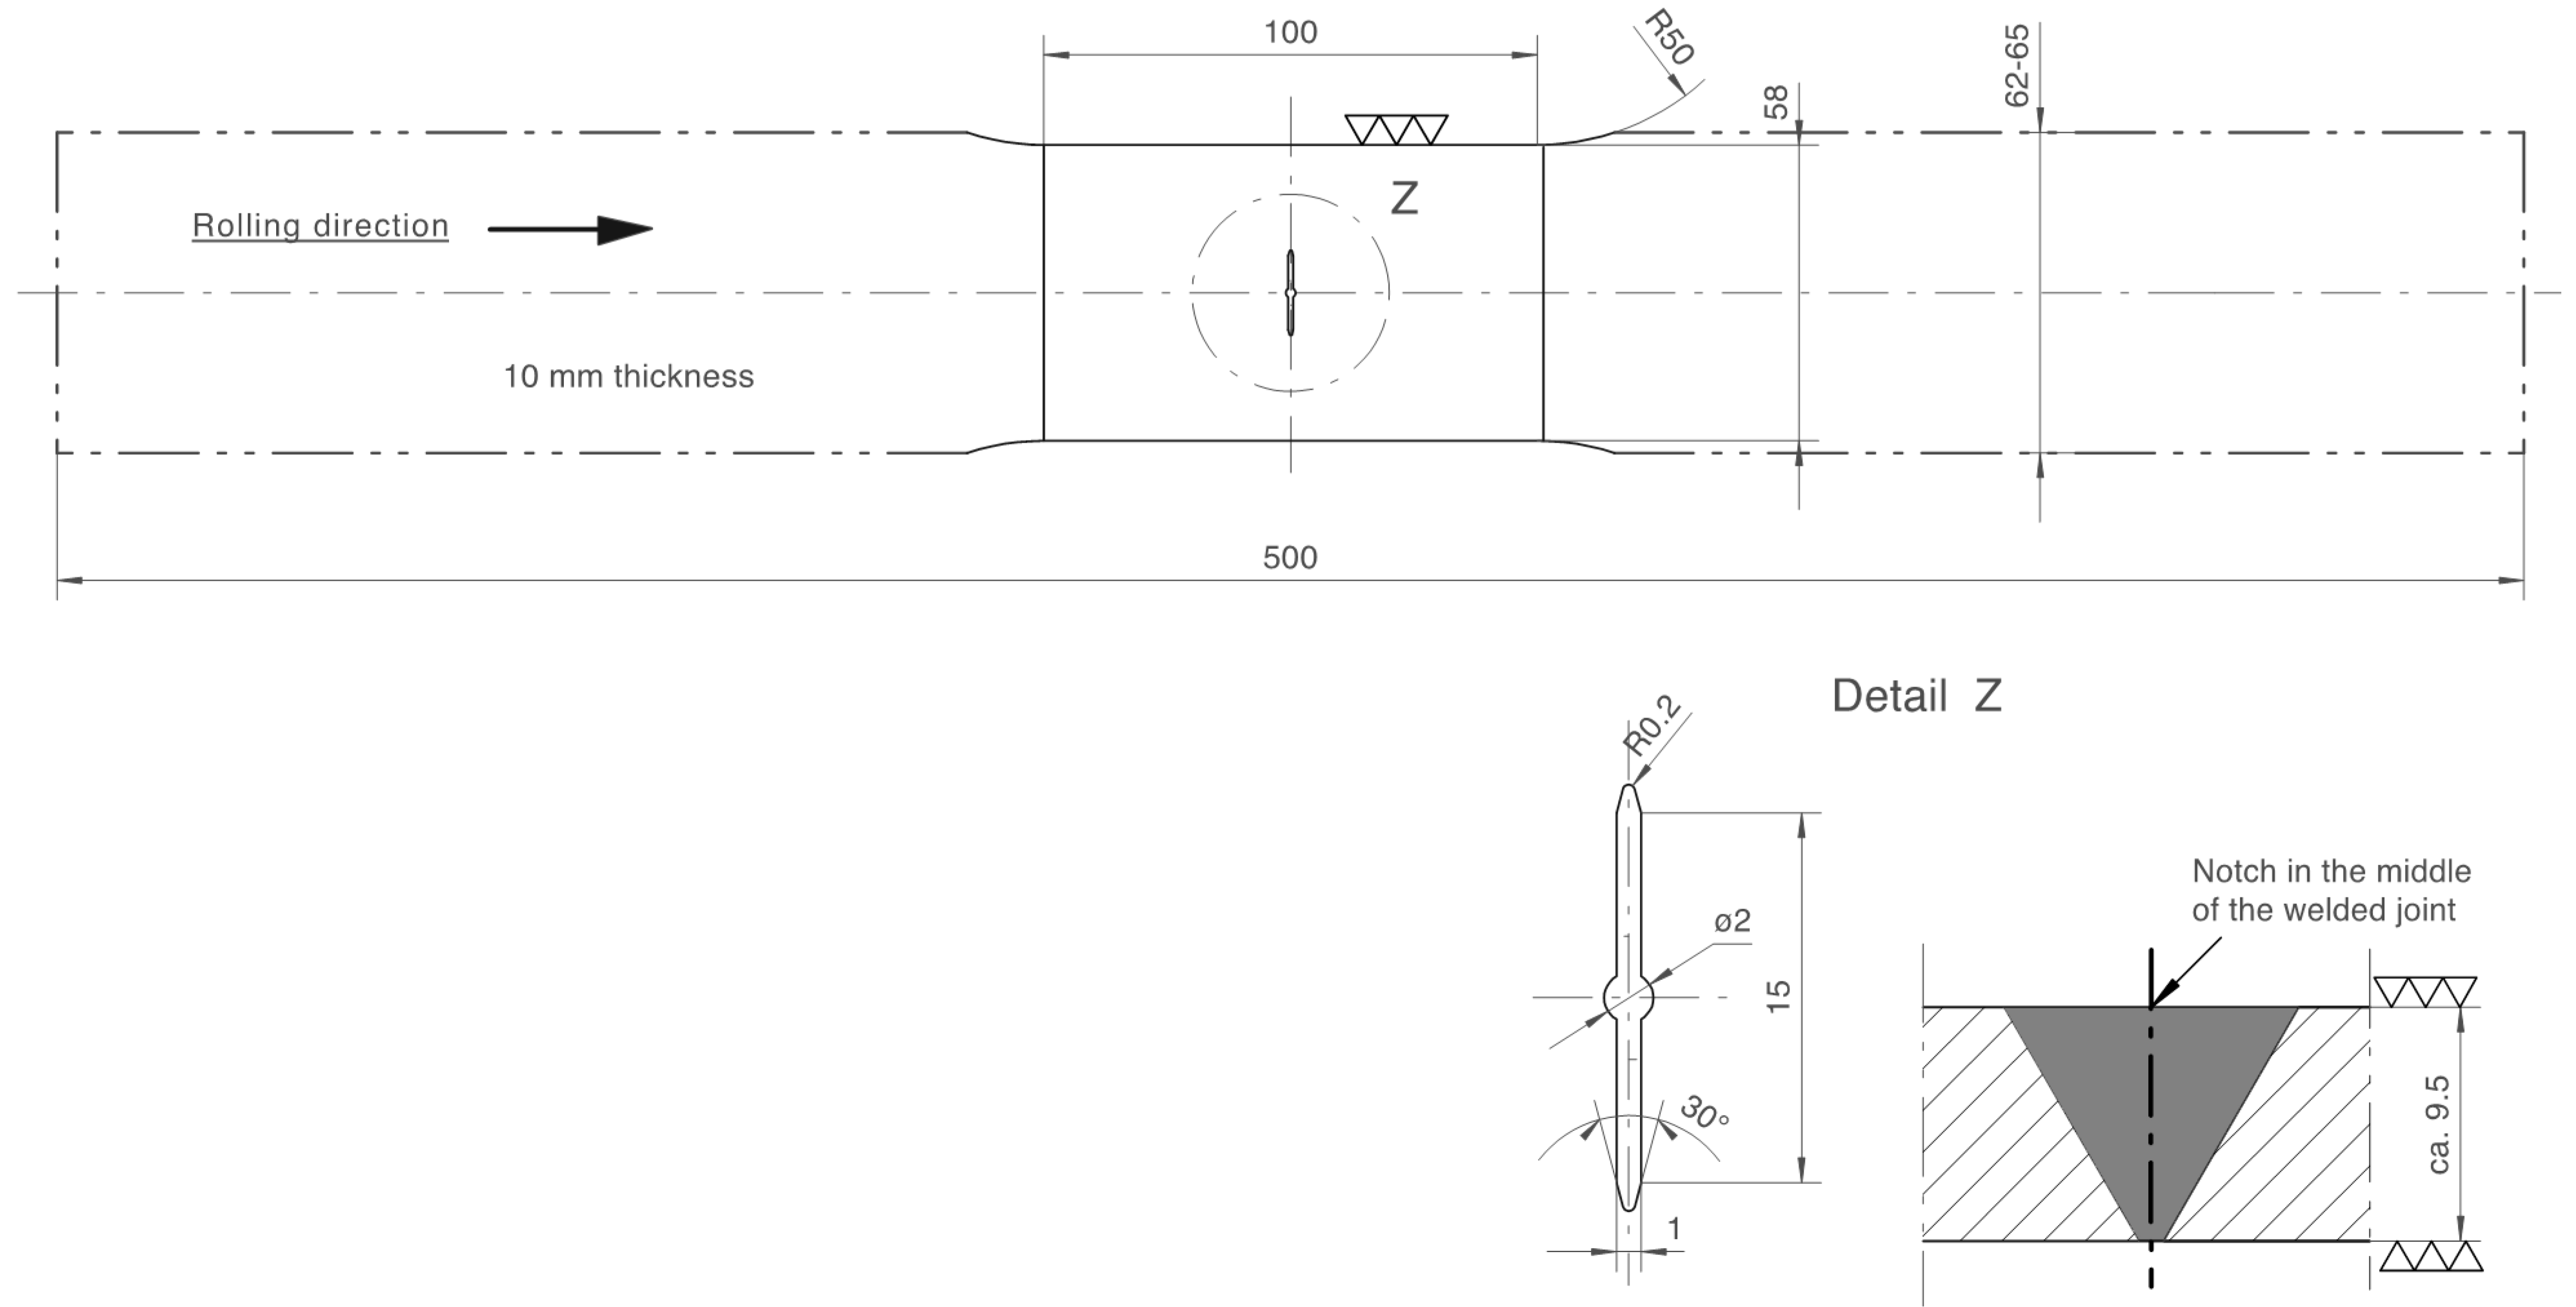
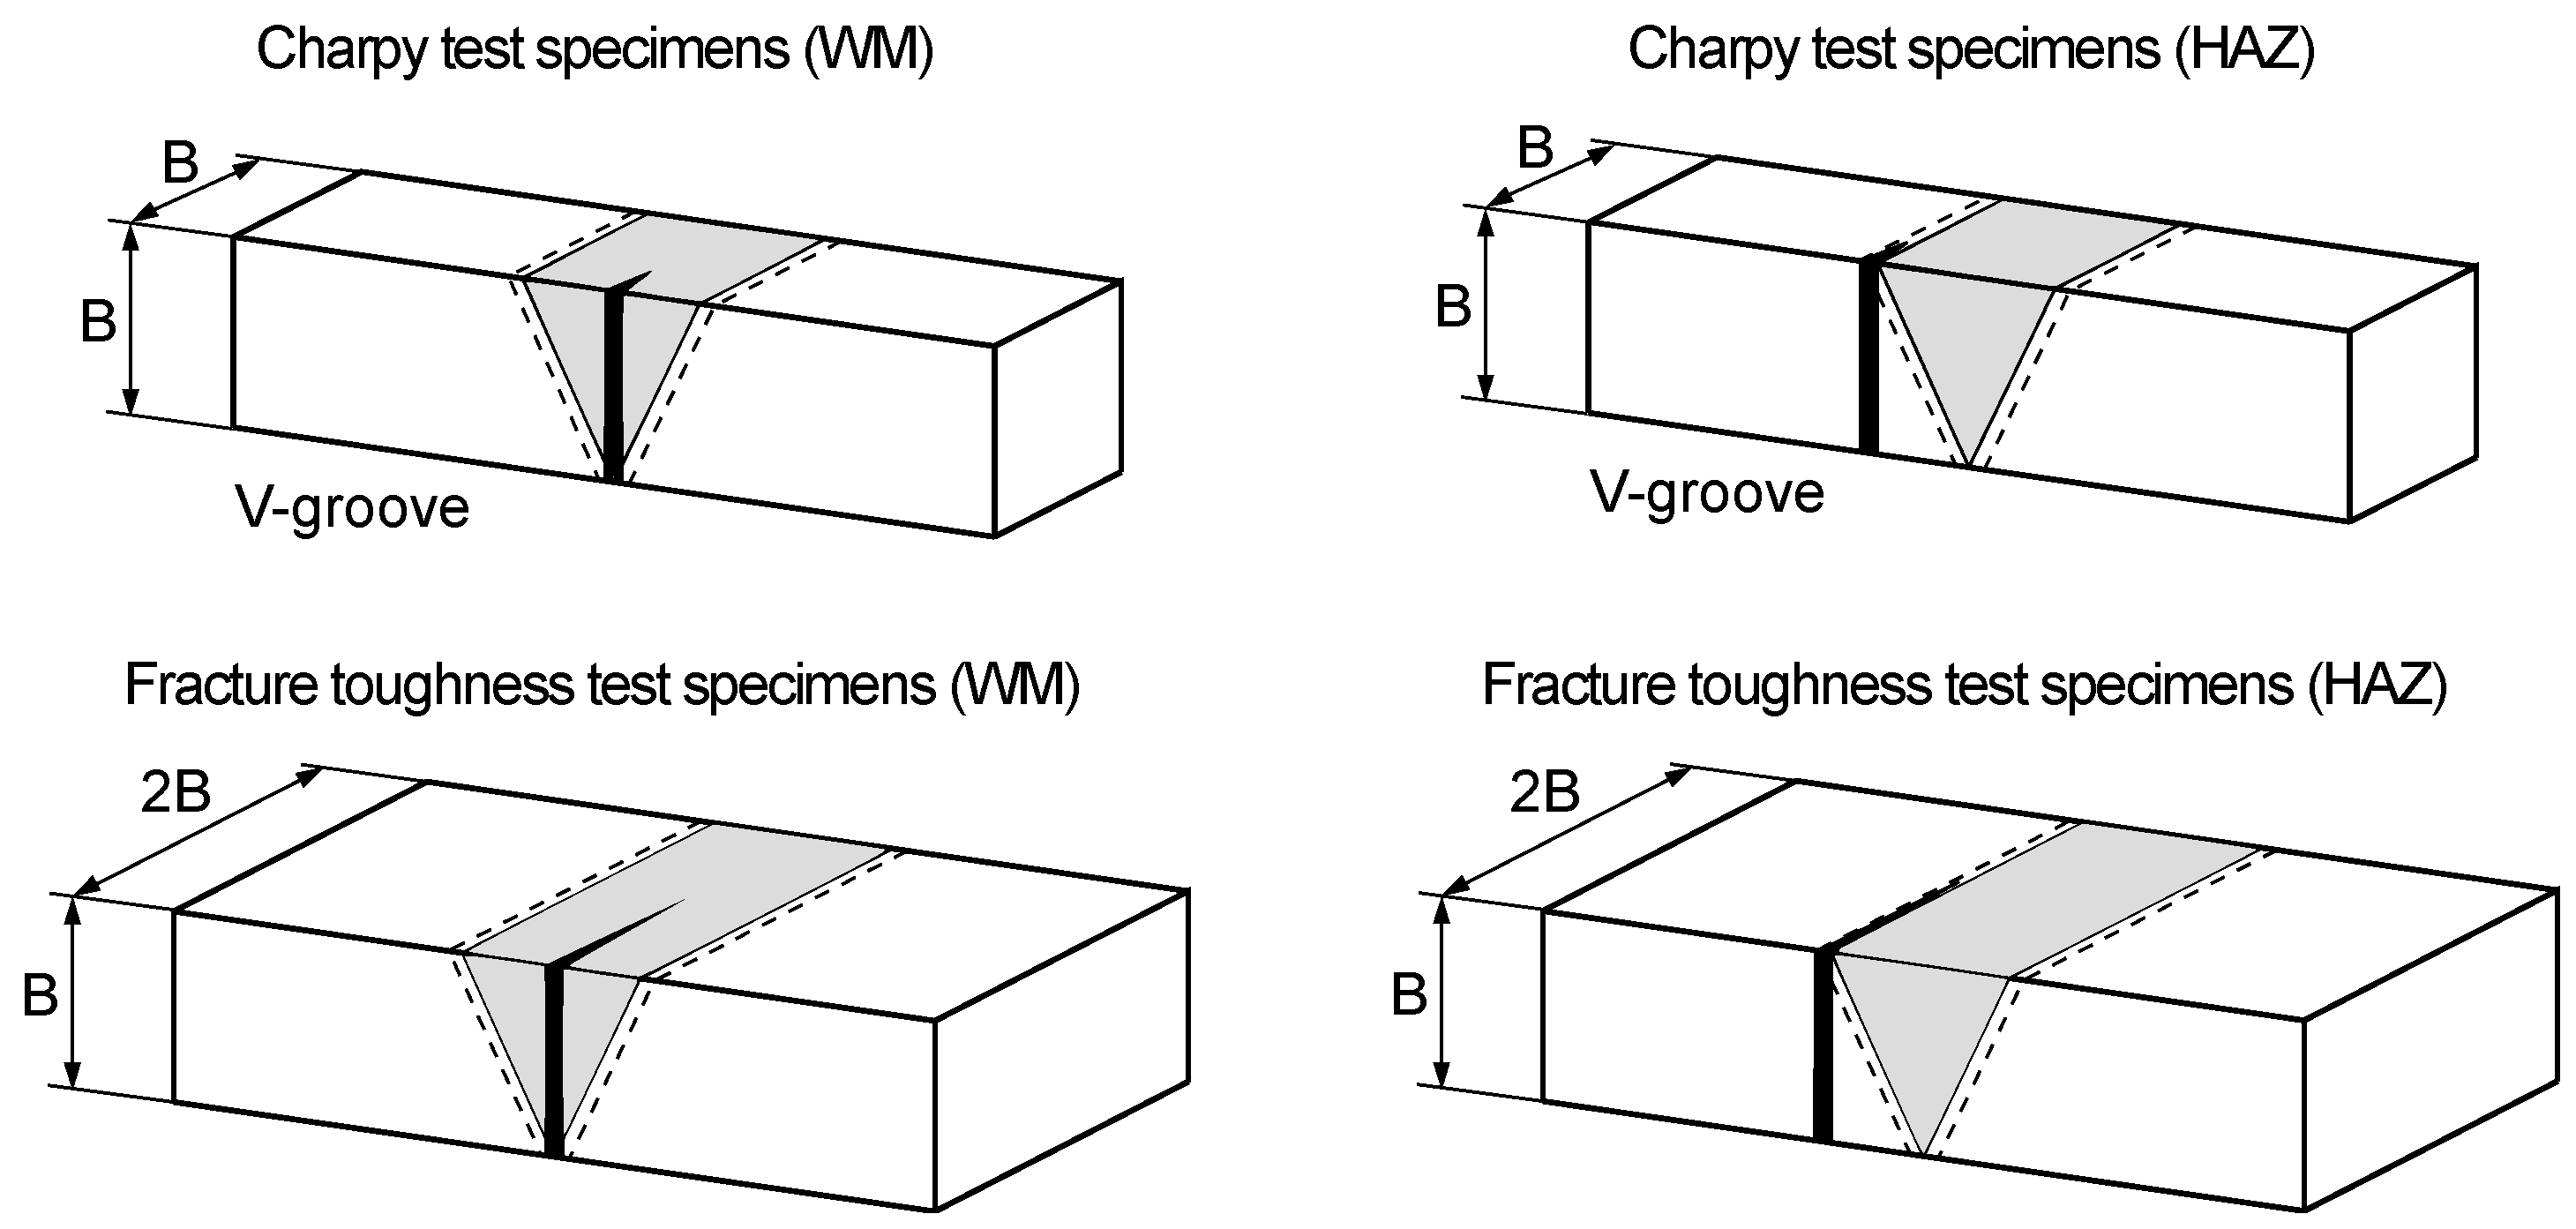
2.1. Specimen’s Design

In the experiments, middle tension M(t) specimens were used to determine FCG rates for the base material and welded joints made of S500 high-strength steel. For the first type of specimen, the crack starter notch was placed in the homogeneous base material. The crack starter notch is placed in the middle of a welded joint for the second type, as shown in Figure 1. The specimens were manufactured from S500G1+M steel, see Braun [32] for basic material properties, chemical composition, and welding parameters. The butt-welded joints were fabricated by flux-cored arc welding. This steel type is known to be susceptible to cold cracking in underwater welding [33], but otherwise easily weldable. The chemical composition and the mechanical properties of the steel are taken from Braun et al. [34] and listed in Table 1 and Table 2. The filler material was EN ISO 17632-A: T 50 6 1Ni P M21 1 H5.
The basic dimensions of the specimens are shown in Figure 1. In the gauge section, the samples were tapered by wire erosion to a width of 58 mm. The crack starter notch was placed in the middle of the specimens. The notch was also wire eroded and manufactured as a 15 mm long slot with runouts on both sides with an angle of 30°. In addition, the specimens made from the welded joint were milled in the gauge section to a constant thickness of 9.5 mm to remove the weld overfill and heat-treated to release welding residual stresses.

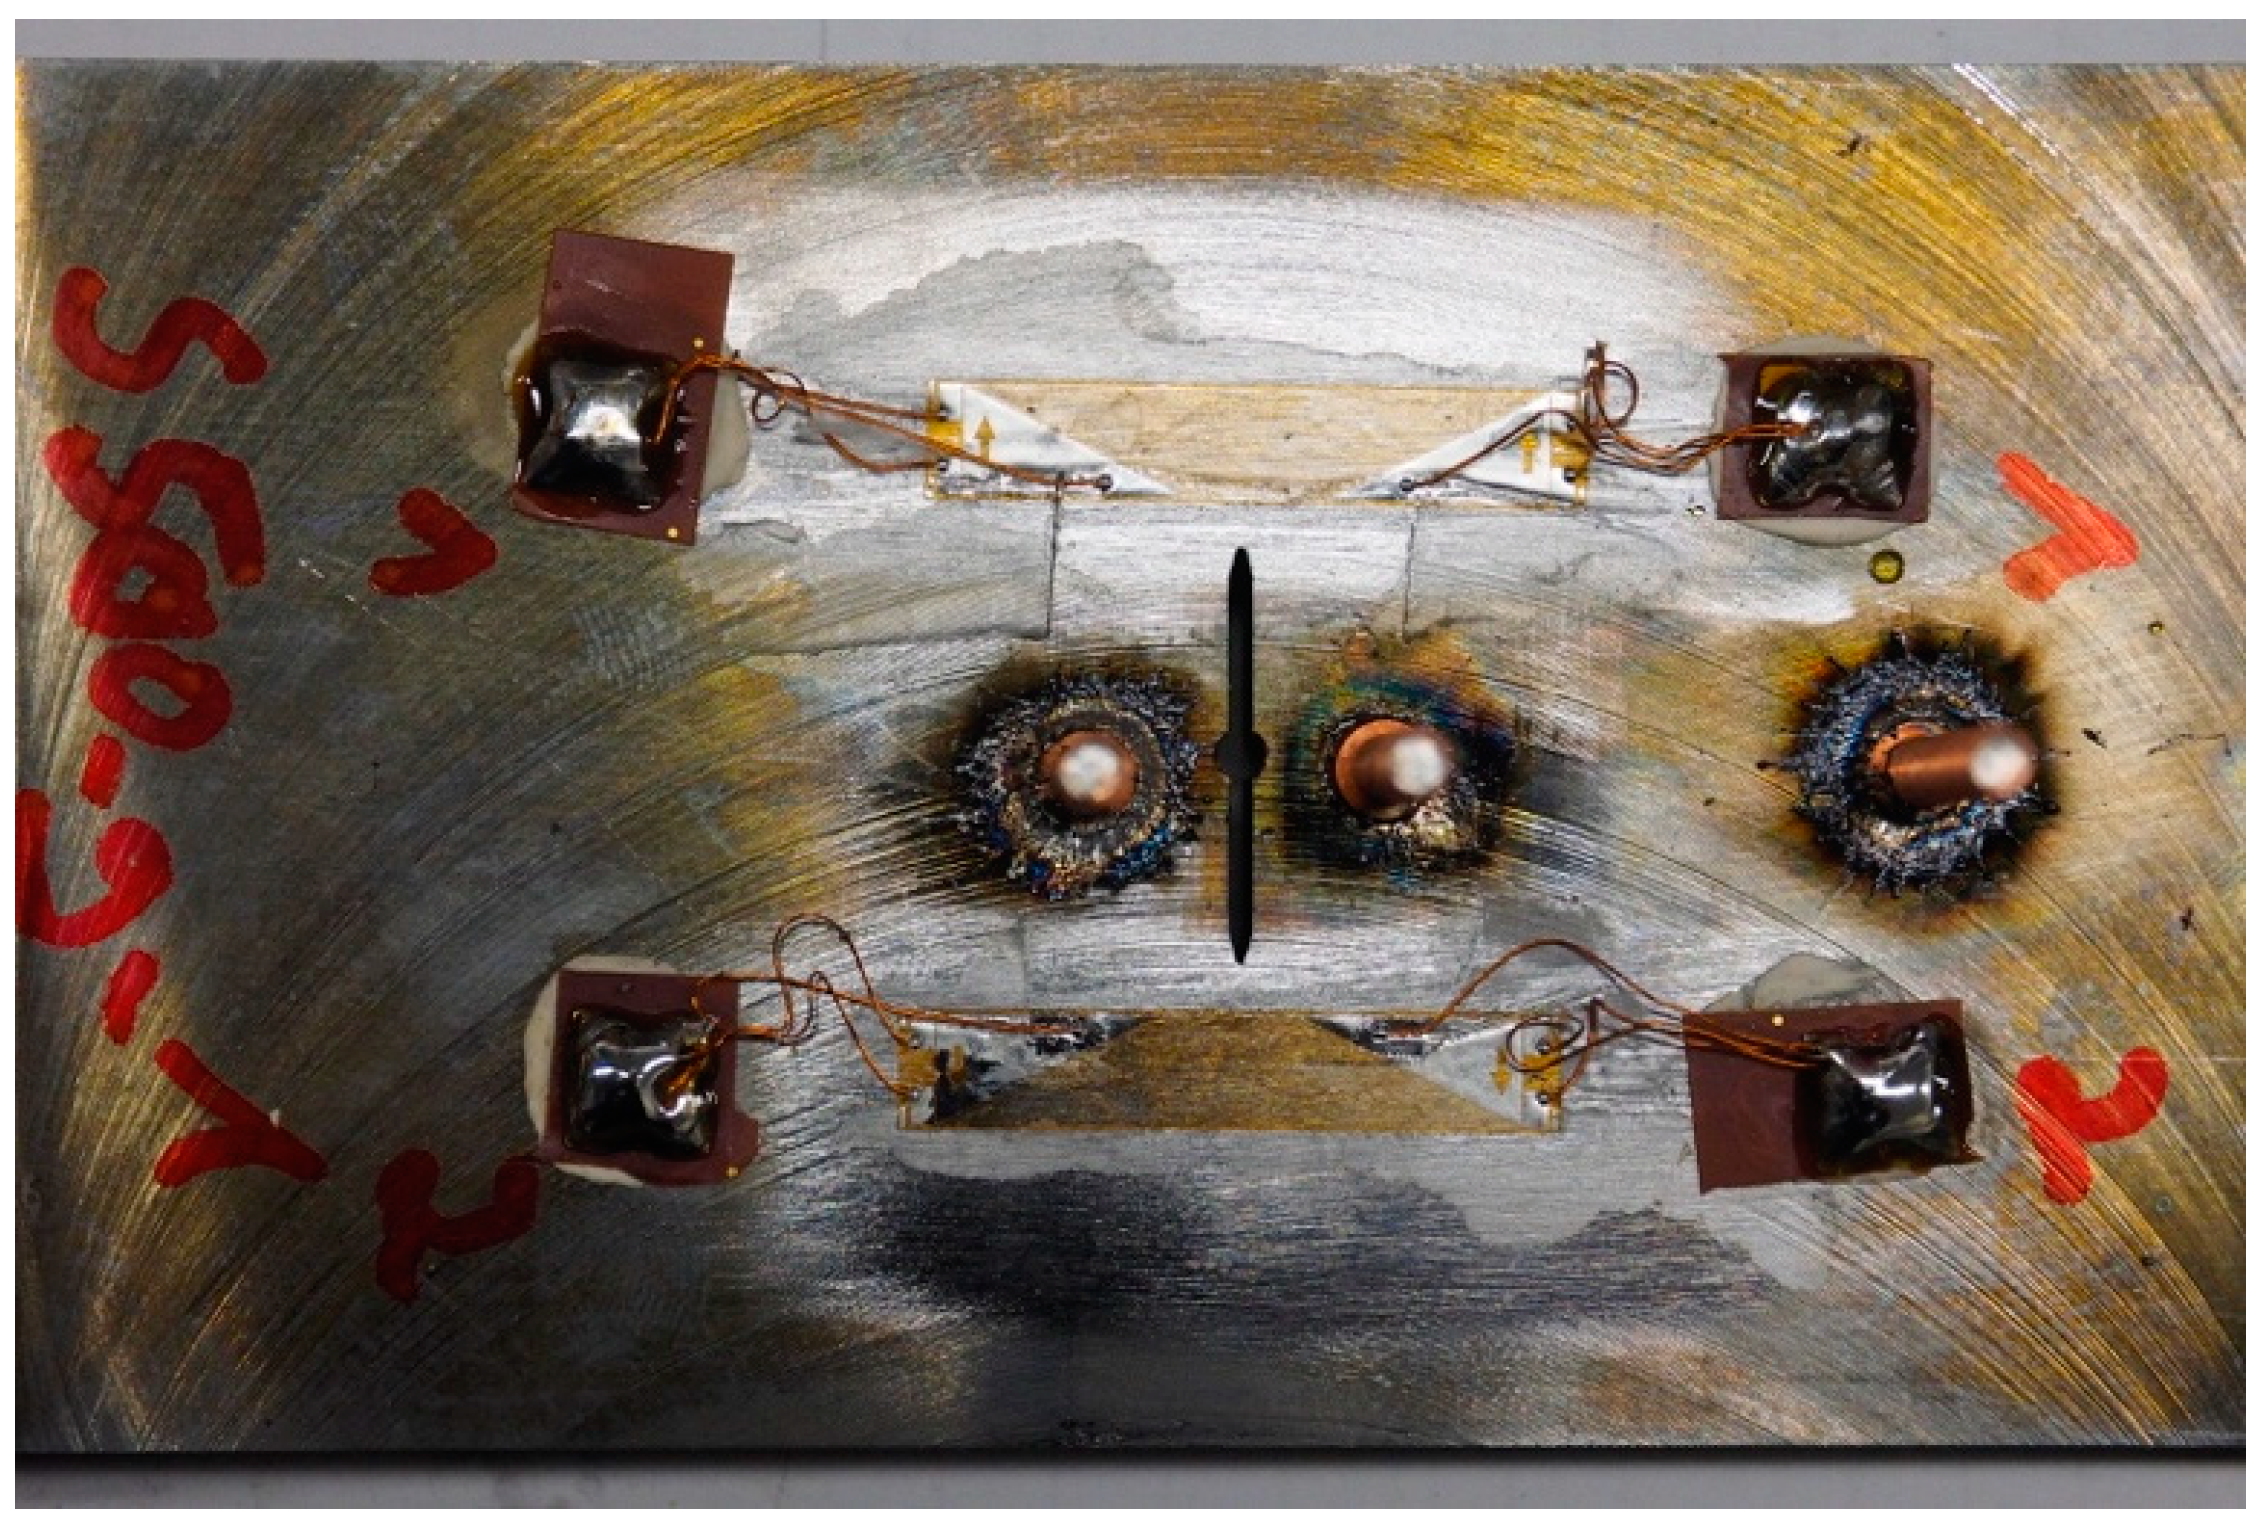
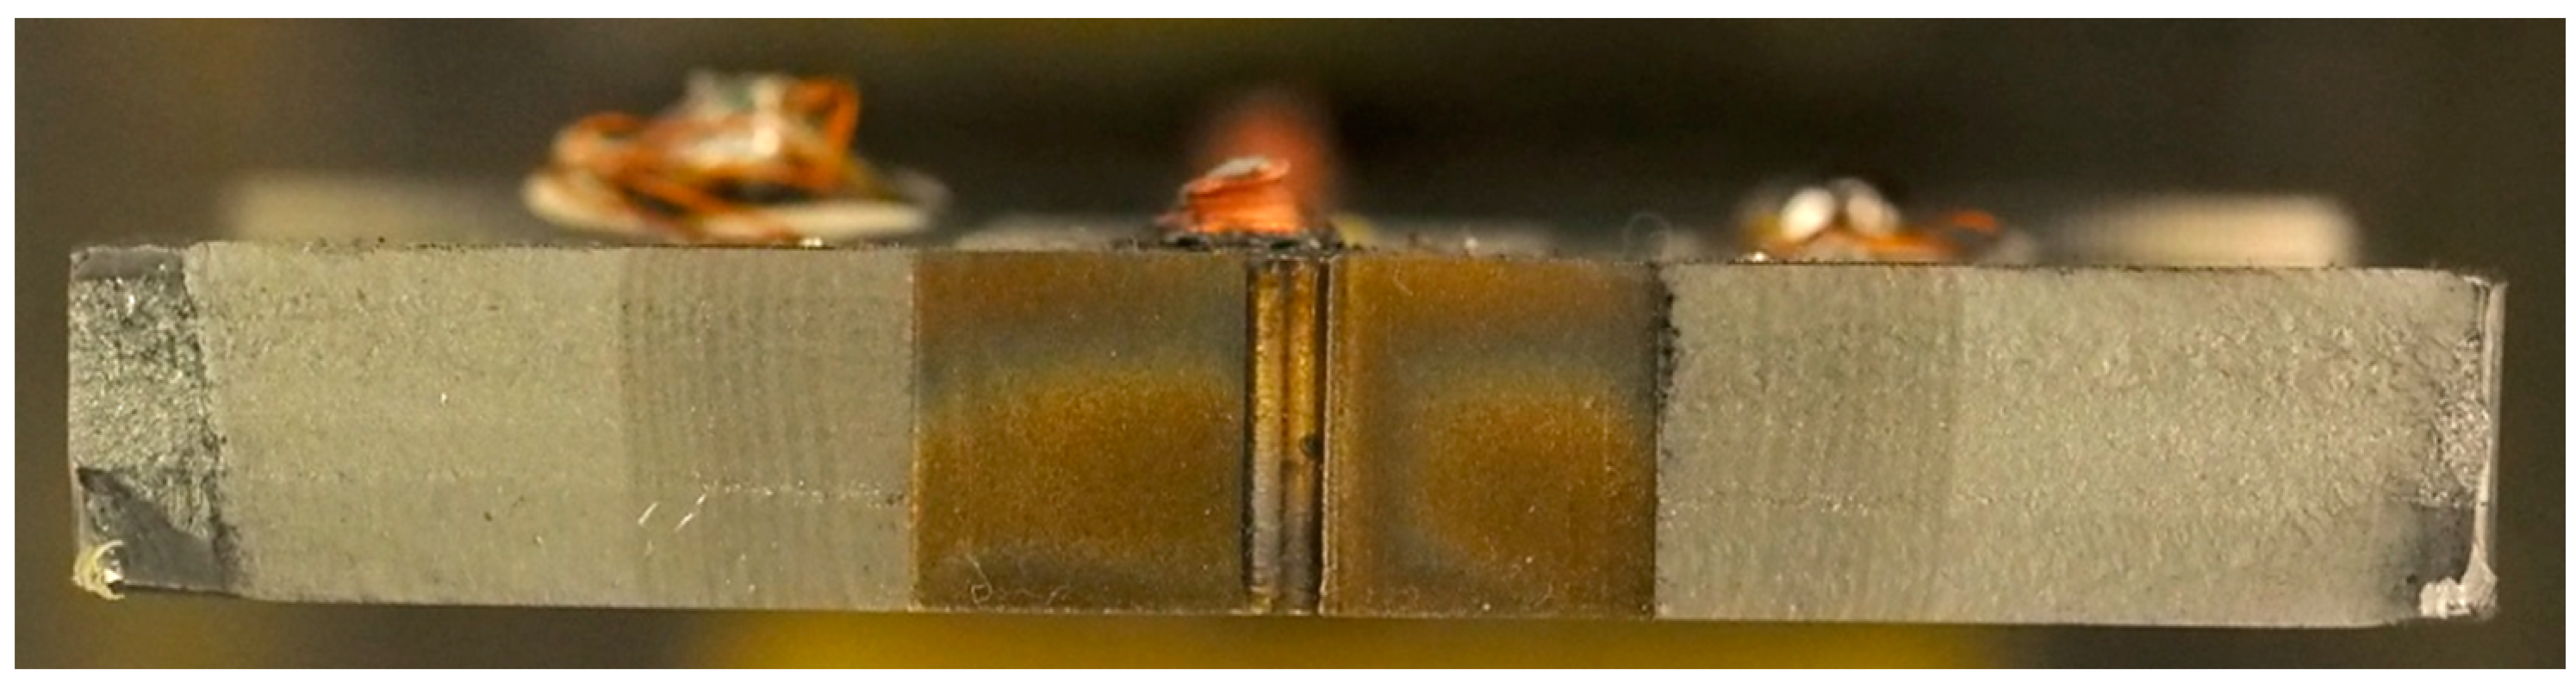
2.2. Preparation of the Test Specimens

First, to determine the initial crack length, crack detection gauges were glued to the specimen surface two millimeters from the tip of the notch. Second, copper-coated bolts were welded to the surface of the specimen to attach cables for current input and measurements. The arrangement was planned according to the standards of ASTM 647-15 [35]. The two bolts farthest away from the notch were used for current input (Y1), and another two bolts (YR.2, YR2.2) were placed on both sides of the notch to detect fluctuations in the power supply (VR). The two last bolts (Y0) were placed on opposite positions of the notch to determine the crack length by measuring the current potential drop over the growing crack (VM). The bolts were numbered from 1 to 6. The positions of the bolts are shown in Figure 2 and Table 3. In addition, a photograph of the specimen surface of a welded joint specimen is presented in Figure 3.

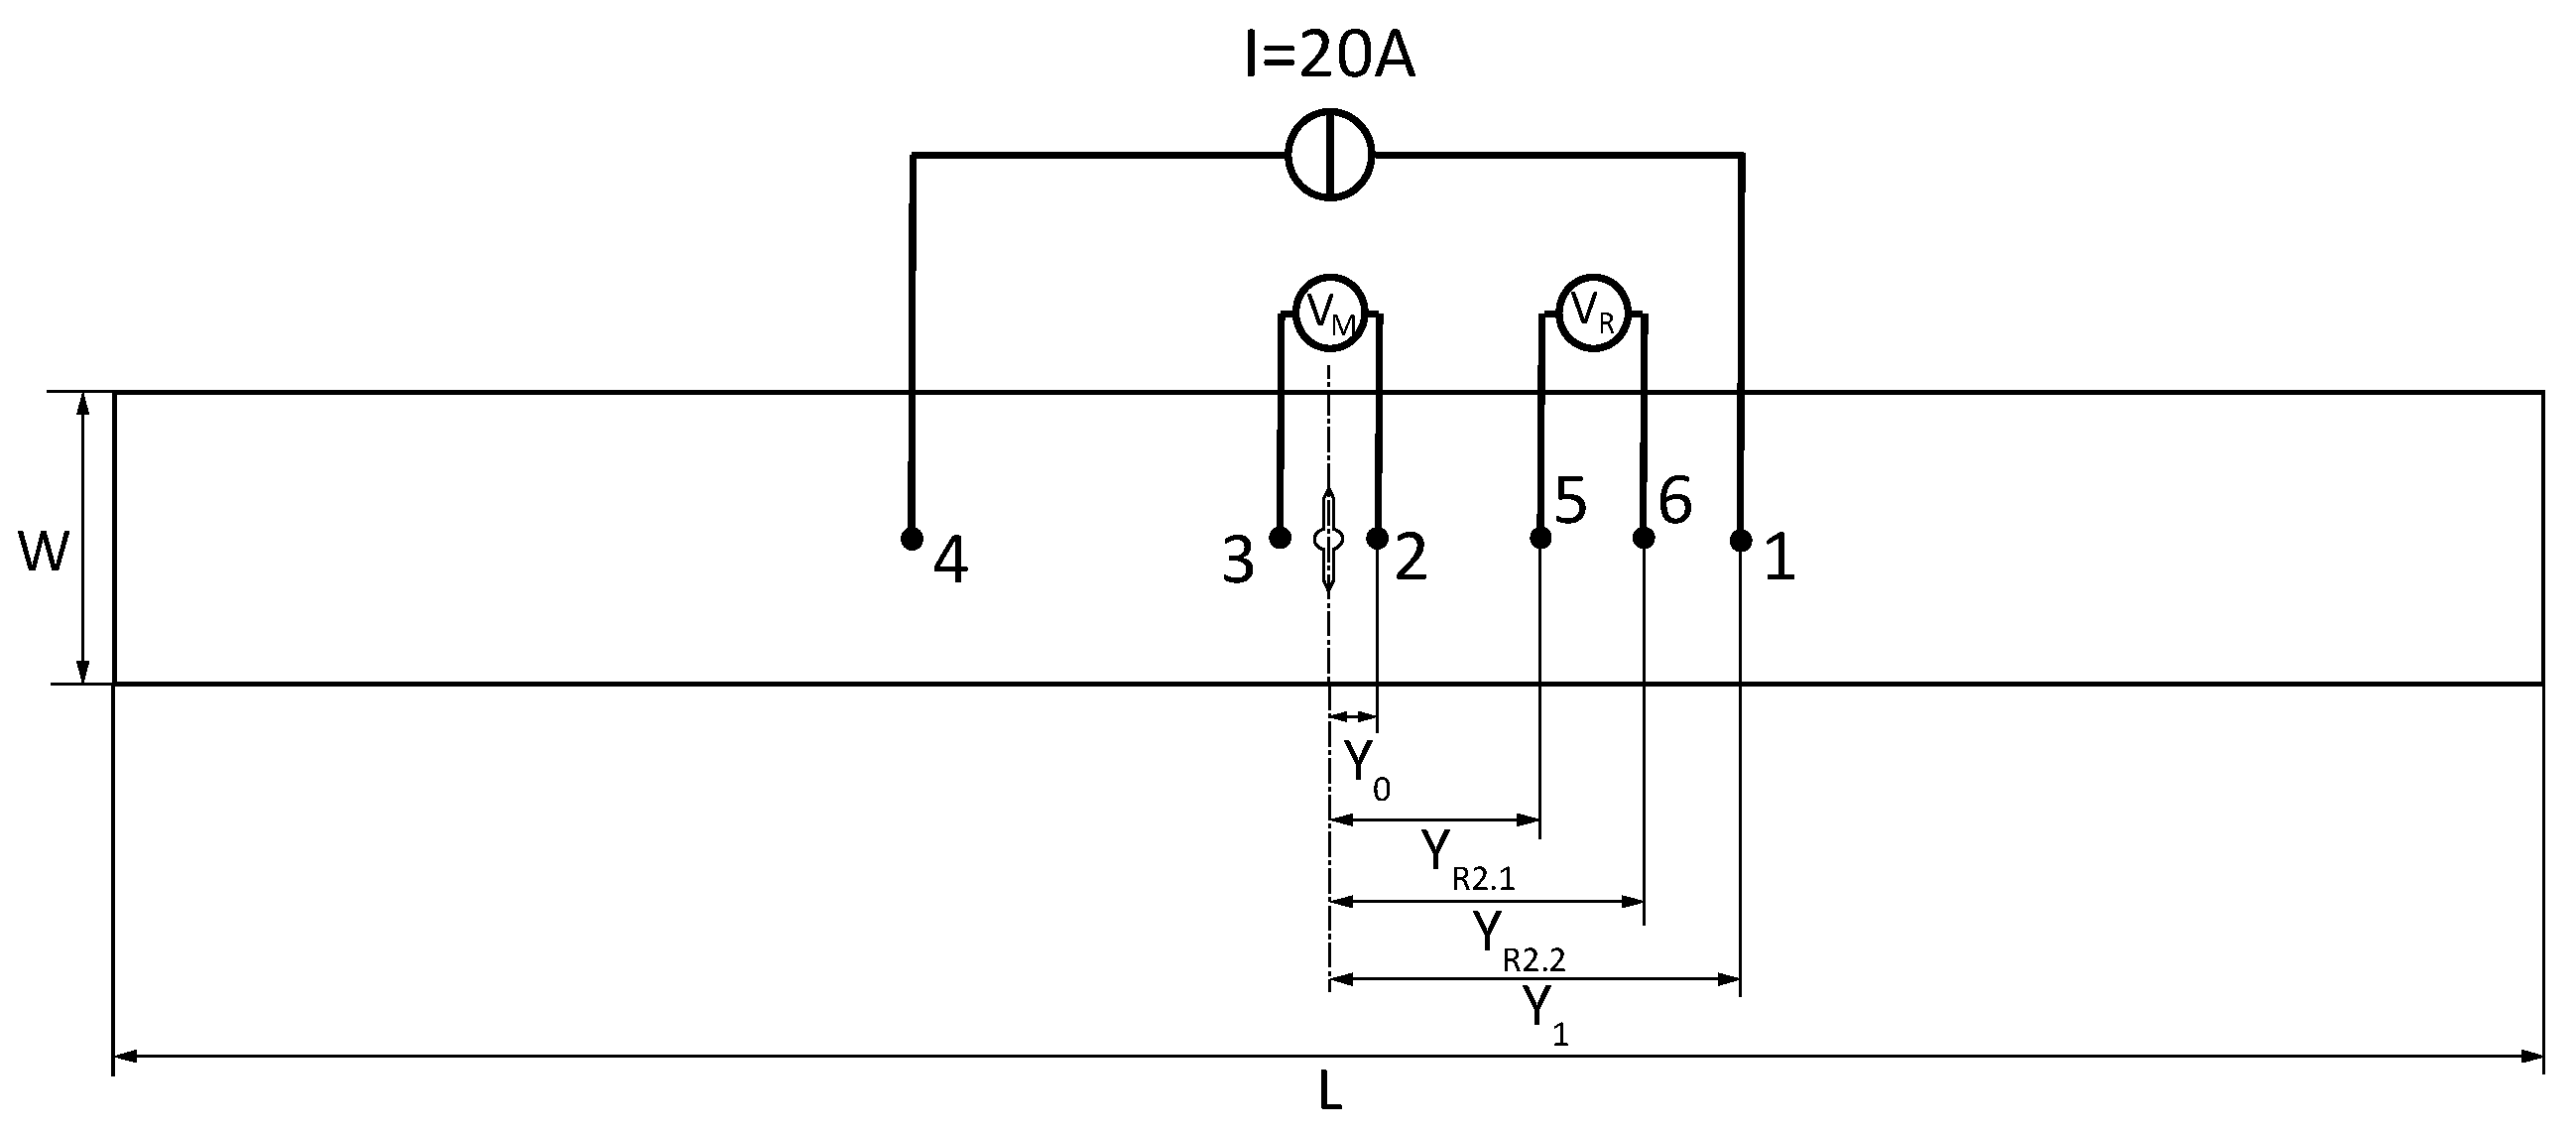
2.3. Experimental Setup

The experiments were carried out in a fatigue test rig (Carl Schenck AG, Darmstadt, Germany) with a climate chamber to regulate the temperature. The specimens were clamped inside the resonant testing machine. For electrical insulation, resin plates were placed between the sample and hydraulic clamps, and the chamber was cooled by vaporizing nitrogen. An Omron temperature controller (Omron K.K.; Kyoto, Japan) regulated the valve and ensured the selected temperature in the chamber. The temperature inside the chamber, on the specimens, and at the load cell were measured with PT100 sensors. The values were constantly recorded and controlled. The diameter of the cables for current input and measurements were chosen according to ASTM 647-15 [35] and insulated for protection against temperature fluctuations. As a power source, a stabilized laboratory power supply unit (EA Elektro Automatik; Viersen, Germany) was used.
A Peekel Autolog 3000 measurement amplifier (Peekel Instruments GmbH; Bochum Germany) with a maximum measurement frequency of 1 kHz was used for measurements. To verify the crack length on the surface, crack detection gauges with 0.1 mm spacing were used.

3. Experimental Procedure

3.1. Johnson’s Equation

The crack length change during the experiment was determined using Johnson’s equation [36]:
a = W π   c o s 1 cos h ( π W Y 0 ) cosh ( V V 0 c o s h 1 ( cos ( π W Y 0 ) cos ( π W a 0 ) ) )
Herein, the crack length a depends on the specimen width W, the actual measured current V and the measured current V0 at the reference crack length a0. The distance of the measuring pin is represented by Y0.

3.2. Stress Intensity Factor Range

The stress intensity factor range ΔK in the M(t) specimens is calculated according to ASTM 647-15 [35]:
Δ K = Δ P B   π   α B   s e c     π α 2
with force range ΔP, and form factor α and thickness Β. ΔP is defined by the maximum and minimum force per load cycle, see Equation (3). The definition of α is presented in Equation (4). According to ASTM 647-15 [35], the error of Equation (2) is less than 1% for 2 a / W 0.8 .
Δ P = P m a x P m i n
α = 2   a W

3.3. Calibration and Pre-Tests

Before the actual experiments, the precision of the direct current potential drop method was tested. For this reason, calibration curves were created at room temperature, −20 °C, −50 °C, and −80 °C for both materials (base and weld material) with reference specimens in increasing ΔK tests. For correlation of the results, the crack length of the Johnson equation was compared with beach marks, which were created during the test, see Figure 4. In addition, the crack detection gauges—used for the start crack length of the Johnson equation—were calibrated based on the information gained from these experiments. The correction thus accounts for crack front curvature. The influence of the temperature on the load cell was also corrected during the experiments.
For the determination of an SIF range for the experiments in this study, decreasing ΔK tests according to ASTM 647-15 [35] were performed at room temperature. A ΔK range of 8 MPa m a little above the threshold value ΔKth was then chosen for the experiments with decreasing temperature. The threshold value is the ΔK for which technically no crack growth occurs anymore.

3.4. Reference Decreasing ΔK Experiments

Decreasing ΔK experiments were performed at room temperature with one specimen per material as a reference for the tests with decreasing test temperature according to ASTM 647-15 [35]. First, the experiments were started from a specific ΔK. Second, after reaching a defined crack length, the experiments were stopped, and the load ranges were reduced before the experiments were continued. Third, this procedure was repeated until no crack growth was observed. This value is then assumed to represent the threshold stress intensity factor range ΔKth.

3.5. Experiments with Decreasing Test Temperature

The experiments with decreasing temperatures were carried out with one specimen for each material (base and weld material). The advantage of this method is that just one specimen is required, and specimen-related influences are mitigated. In order to find a representative SIF range for comparison, a value slightly above the threshold SIF was chosen.
Both specimens were then tested at a constant SIF range and at a stress ratio R = 0.5 while gradually reducing the temperature. Due to the changing crack length, the applied loading was constantly adjusted to yield a constant stress intensity factor range of 8   MPa m .
The procedure of the experiment can be summarized in seven steps:
  • The specimen was clamped into the resonant testing machine.
  • To avoid the notch shape influence, the resonant testing machine ran until the crack grew to an initial depth of 2 mm on each side of the notch. Upon reaching the crack detection gauges, the machine was stopped.
  • The current crack length was taken as the reference crack length a0 for Johnson’s equation. The upper and lower applied load was adjusted to equal an SIF to 8   MPa m at a stress ratio of 0.5.
  • The machine was then restarted and stopped once the crack had grown by 0.5 mm as proposed in ASTM 647-15 [35].
  • The stress ratio was changed to R = 0.75 to create the beach marks.
  • The temperature was then reduced by 20 °C and the test resumed once the specimen’s temperature had stabilized. The temperature does not deviate more than 0.5 degrees from the mean value of the respective temperature.
  • Steps 3–5 were then repeated until the nitrogen tank was empty.
As the 600 L nitrogen tank did not provide enough nitrogen for the lowest test temperatures, the last two test temperatures for both materials were performed separately. To this goal, the chamber was stepwise cooled down to a temperature of −100 °C for the welded specimen (WS) and −110 °C for the base material (BM). As nitrogen displaced air, no ice formation was observed in the chamber during the experiments.
Both specimens were still intact after finishing the tests at the lowest temperatures. Thus, the specimens were opened to evaluate the beach marks. To assess the position of the beach marks, photographs of the fracture surfaces were taken. The length of the crack associated with the beach mark was determined as the mean value of three points on the curved shape of the beach mark with equal distance between each other and to the surface. The initial crack length estimated by the crack detection gauges was corrected by the information of the beach mark shape (crack front curvature).

4. Results of Fatigue Crack Growth Rate Tests

This section presents the results of the different experiments. The first subsection focuses on the results of calibration of the Johnson equation. Then the results of the decreasing ΔK tests with the goal to find a reasonable ΔK for the decreasing temperature tests are presented. Finally, the results of the experiments with the constant ΔK and decreasing temperatures are presented.

4.1. Calibration Test Results
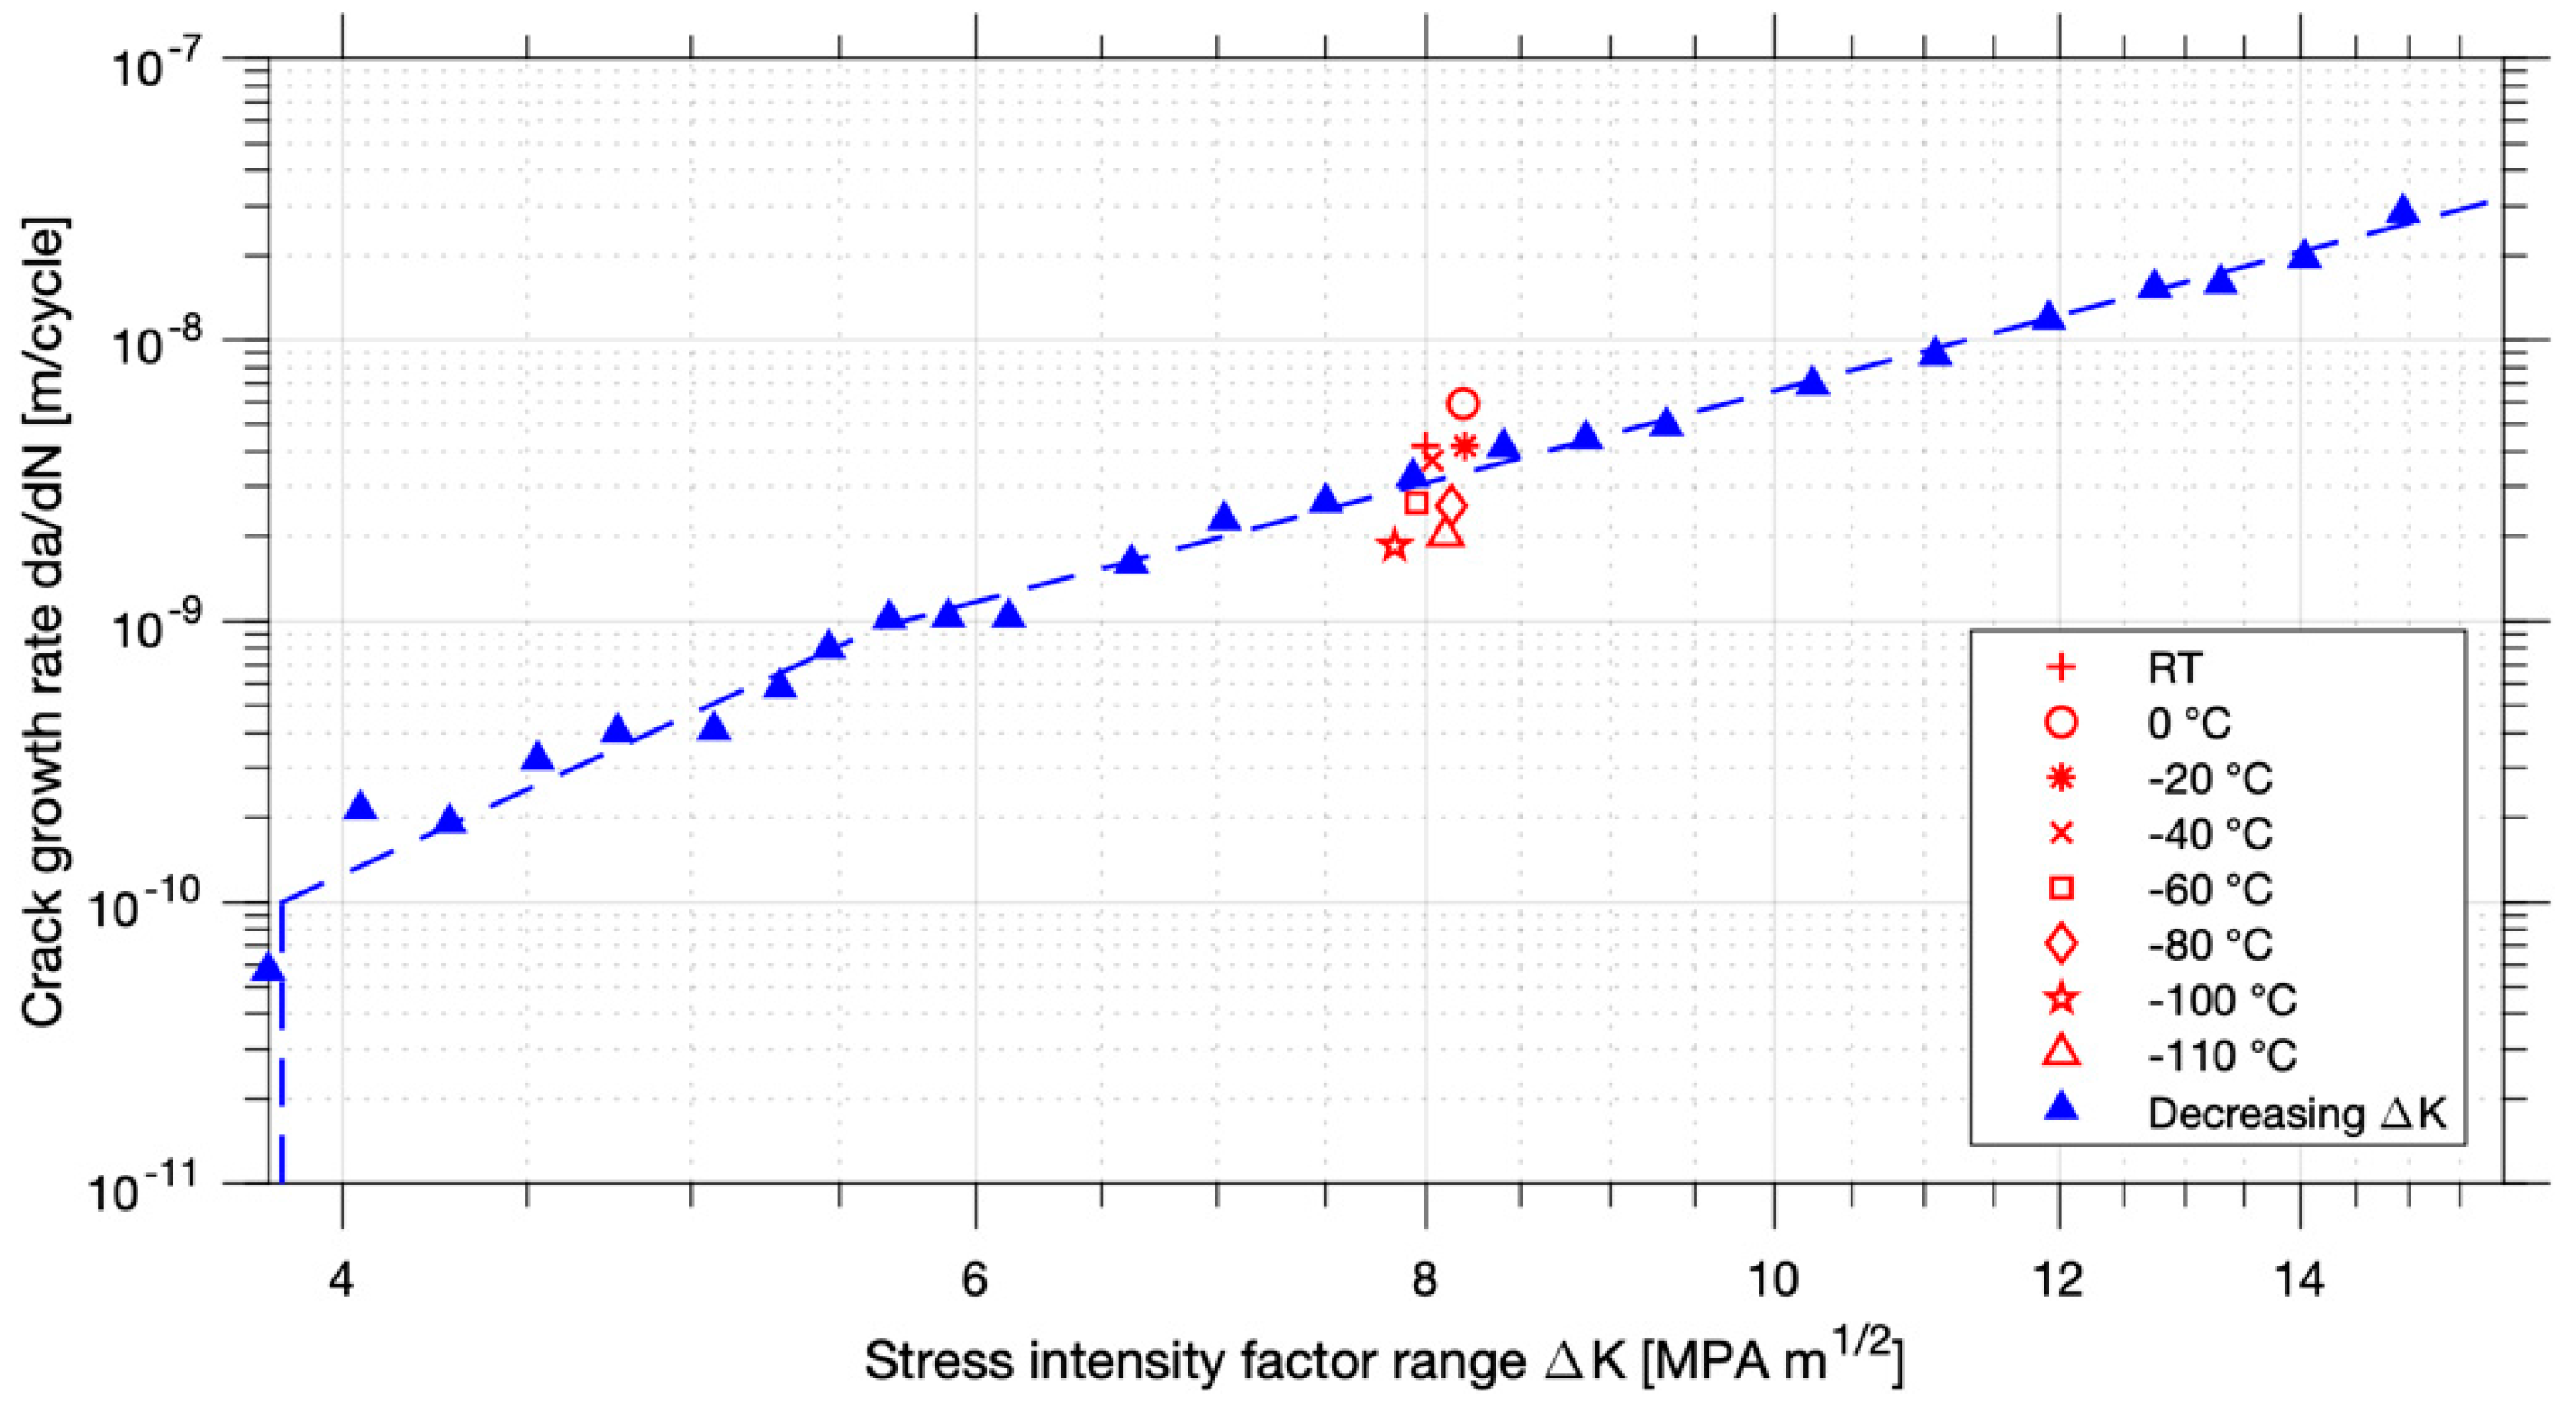
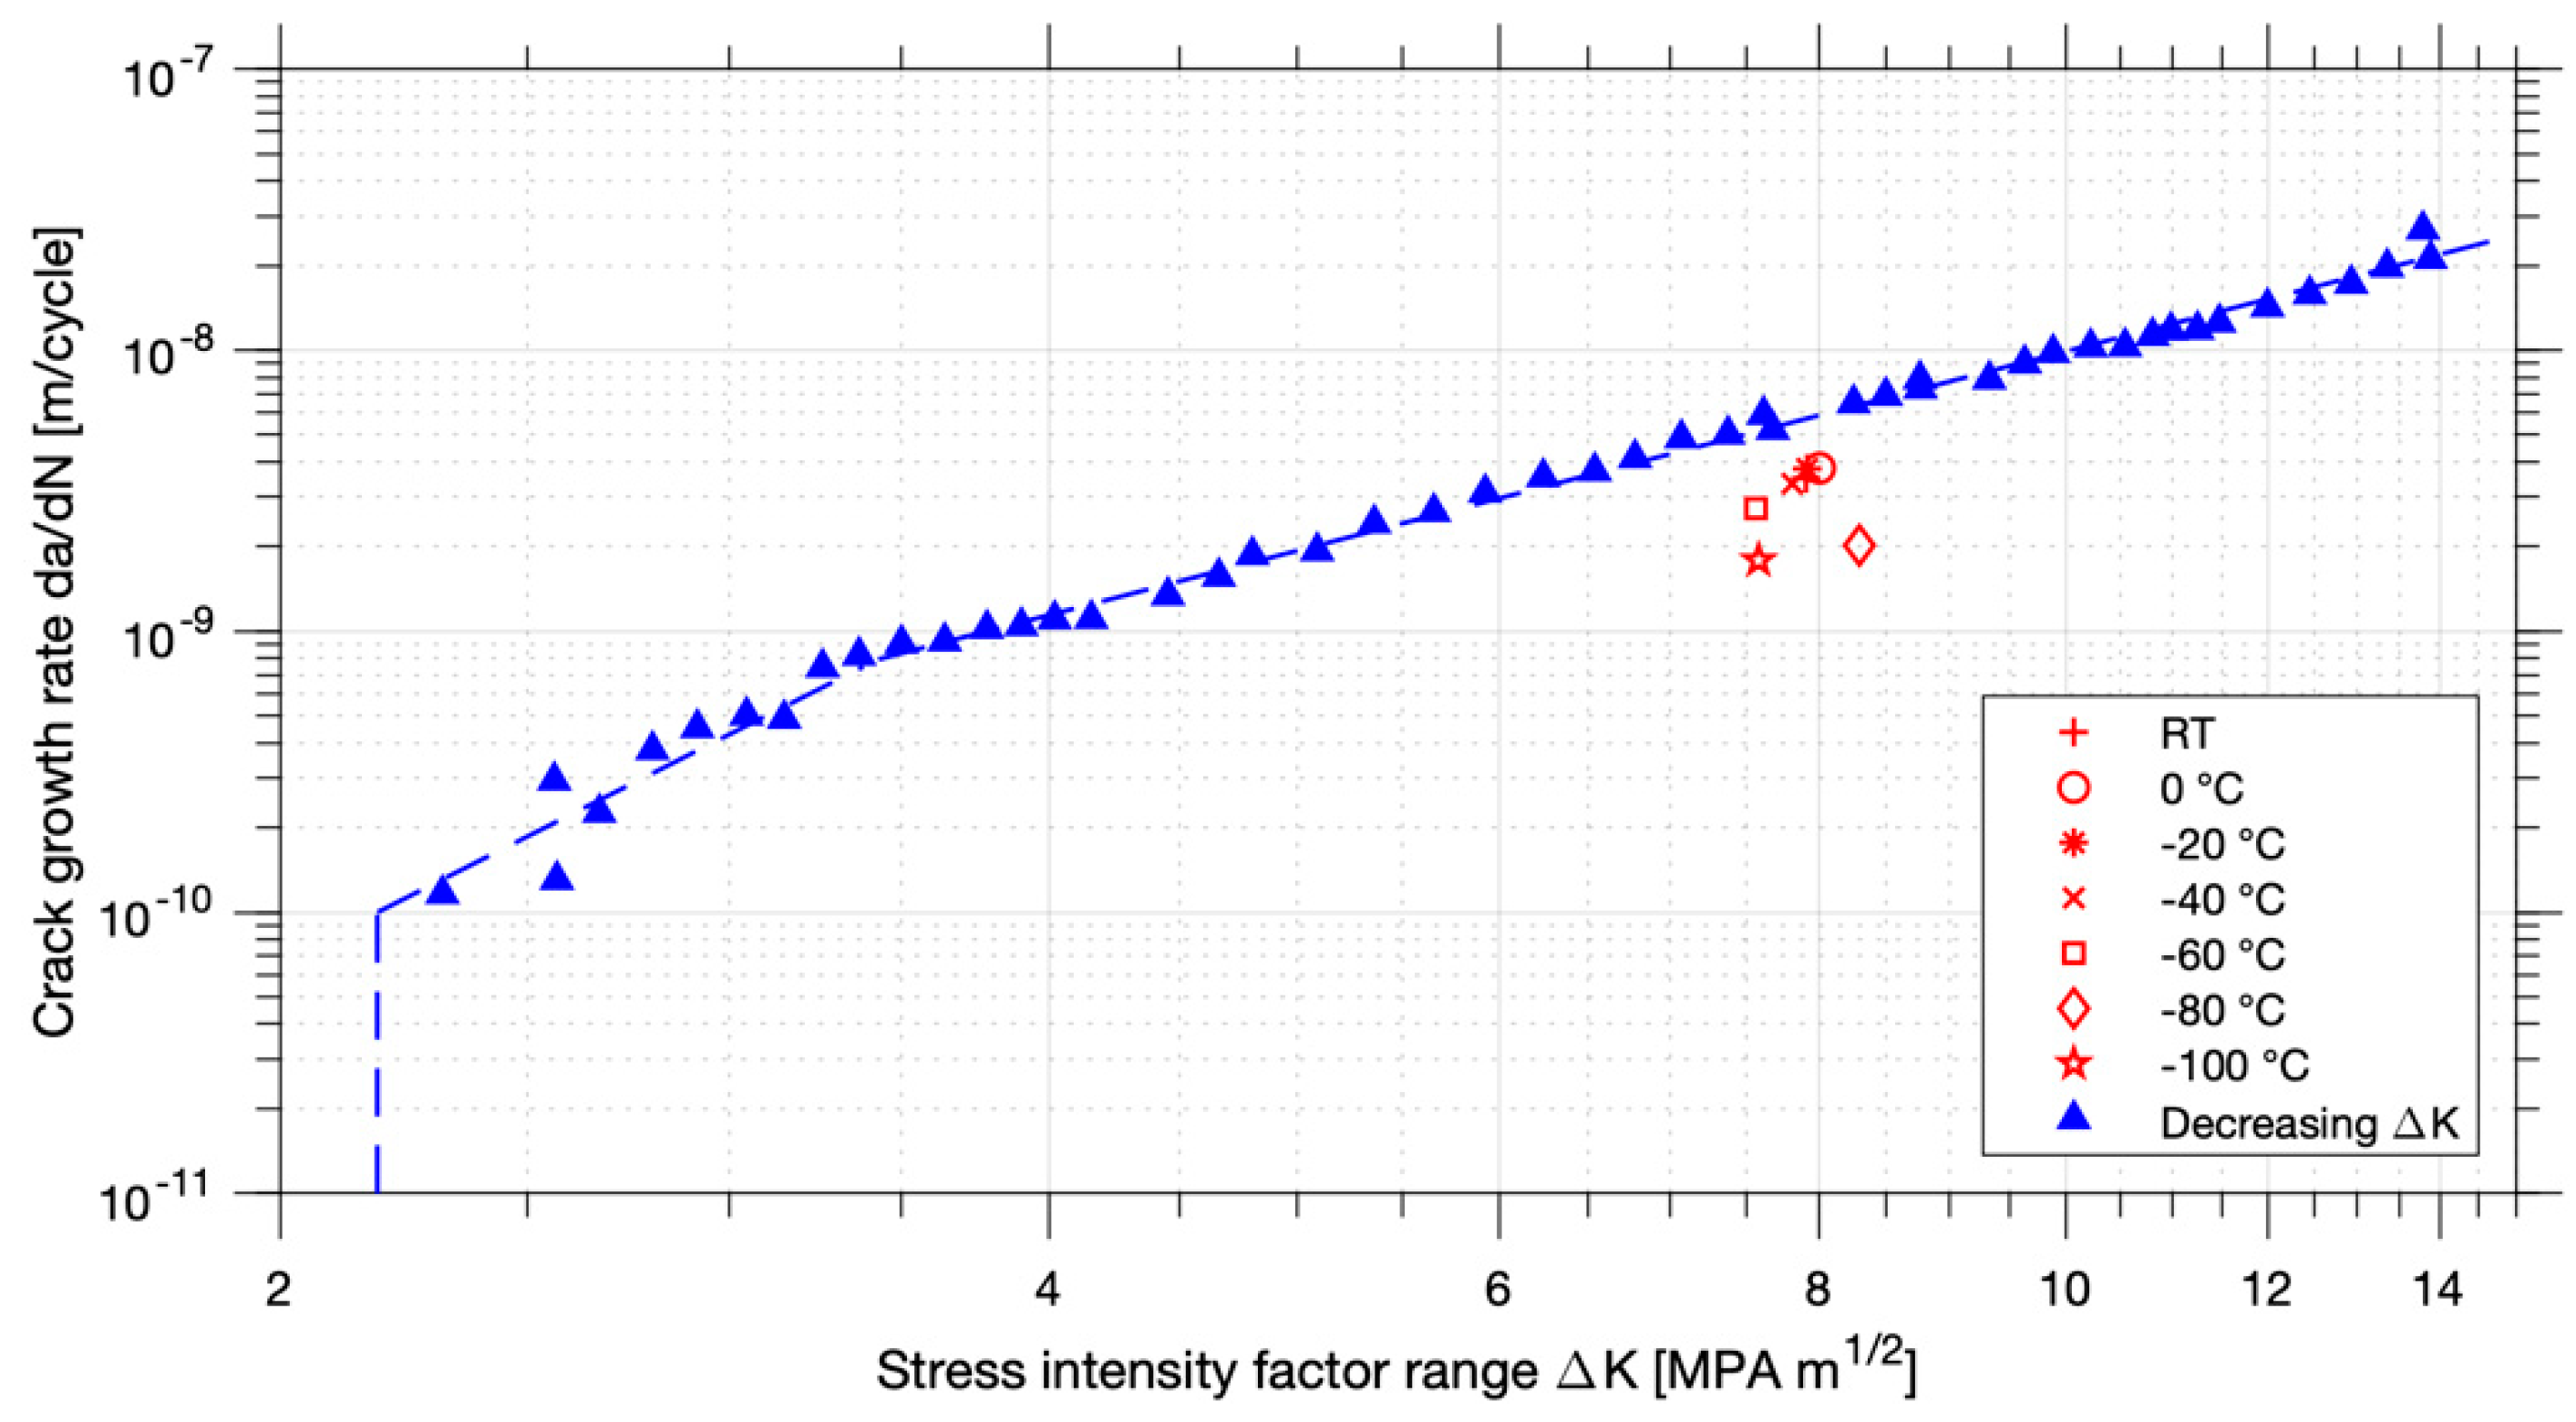
In general, a good agreement was observed between calibration curves and Johnson’s equation. For lower temperatures, the accuracy of Johnson’s equation shows increasing but still insignificant deviations. At room temperature, the maximum deviation is lower than 2% for both types of specimens. At −80 °C the maximum deviation is still below 5% and the mean below 3%. The influence of the temperature on the accuracy is larger than the influence of the crack length. More detailed results are presented in Sallaba [37].

4.2. Decreasing Δ K Test Results

The threshold region was estimated according to ASTM 647-15 [35]. The values of crack growth rates between 10−10 m/cycle and 10−9 m/cycle were fitted and a value corresponding to 10−10 m/cycle was used to define ΔKth. The decreasing ΔK experiments at room temperature yield a ΔKth of 3.85 MPa m and 2.35 MPa m for the S500 base material and for the welded specimen, respectively. The results of the base material experiments are presented in Figure 5 and Figure 6. The results of the cracks in welded material are presented in Figure 7 and Figure 8. The results of the decreasing ΔK experiments are presented in Figure 6 and Figure 8 in blue. The slope of the fitted Paris region of the base material experiments corresponds to 3.38 and 5.88 above and below 5.64 MPa m , respectively, while the slope of the results of the crack in the weld material corresponds to 2.36 and 4.60 above and below 3.38 MPa m , respectively.

4.3. Results of the Decreasing Temperature Tests for the Base Material

The evaluated data of the experiments of the base material and constant ΔK is presented in Figure 5. The crack growth rate is plotted over the corresponding temperature. Barsom and Rolfe [38] developed a scatter band for mild steel depending on the crack growth rate. The scatter band is plotted as a vertical error bar for each crack growth rate to put the results in perspective.
Interestingly, the crack growth rate is lower at 20 °C than at 0 °C. Below this temperature, the crack growth rate decreases constantly with decreasing temperature until −100 °C. At −110 °C, the rate is slightly above the rate at −100 °C. This could be related to the FTT; however, the change is small and still within the scatter band proposed by Barsom and Rolfe [38].
Figure 6 presents the results of the constant ΔK experiment together with the values of the decreasing ΔK experiment. As can be seen from this figure, the results for room temperature of both kinds of experiments are close together. Furthermore, the ΔK of the constant ΔK experiments lay close to the target value of 8 MPa m . The difference from the target value is caused by correcting the actual crack length after the experiments. In addition, the trend of decreasing crack growth rate with decreasing test temperature is clearly visible.

4.4. Results of the Decreasing Temperature Tests for the Weld Material

The results of the constant ΔK experiments of the specimen cracked in the weld material are displayed in Figure 7. Again, the crack growth rates increase slightly from room temperature to 0 °C, staying constant for 0 °C and −20 °C and decreasing for lower temperatures. For −100 °C, the crack growth rate corresponds to 1.8 × 10⁻⁹ m/cycle. This was the lowest temperature that was possible to achieve with the test setup without excessive nitrogen consumption.
The results of the decreasing ΔK and constant ΔK experiments of the welded specimen are presented together in Figure 8. The agreement is good but not as good as for the base material specimen. Many factors influence the crack growth in welded joints, such as welding deformation and material defects. In particular, the influence of secondary bending stresses caused by specimen misalignment cannot be accounted for in such experiments. The angular misalignment of both welded specimens was quite small with about 0.5°; nevertheless, misalignment effects on fatigue crack growth cannot be fully ruled out. The post-processed data uses the actual initial crack lengths evaluated from the beach marks.
In summary, a constant decrease of fatigue crack growth rates was determined between −20 °C and −100 °C for the weld material, which is similar to the base material. Interestingly, the fatigue crack growth rates are similar for both materials throughout the tested temperature range. This could be related to the release of welding residual stresses in the welded specimen by heat treatment. The only exception is the rate determined for the base material at 0 °C.

5. Fracture and Charpy Impact Toughness Properties

To compare the results of the previous section, Charpy impact and fracture toughness testing have been performed for different zones of the welded joints, i.e., the base material, the middle of the weld metal (WM), and the heat-affected zone (HAZ). For this purpose, specimens were machined according to ASTM E23-16b [39] and ASTM E399-20a [40] with notches in the different zones as presented in Figure 9. Calibrated thermoelements were attached to the Charpy and fracture toughness tests close to the notch or crack tip to perform the tests at intended test temperatures.

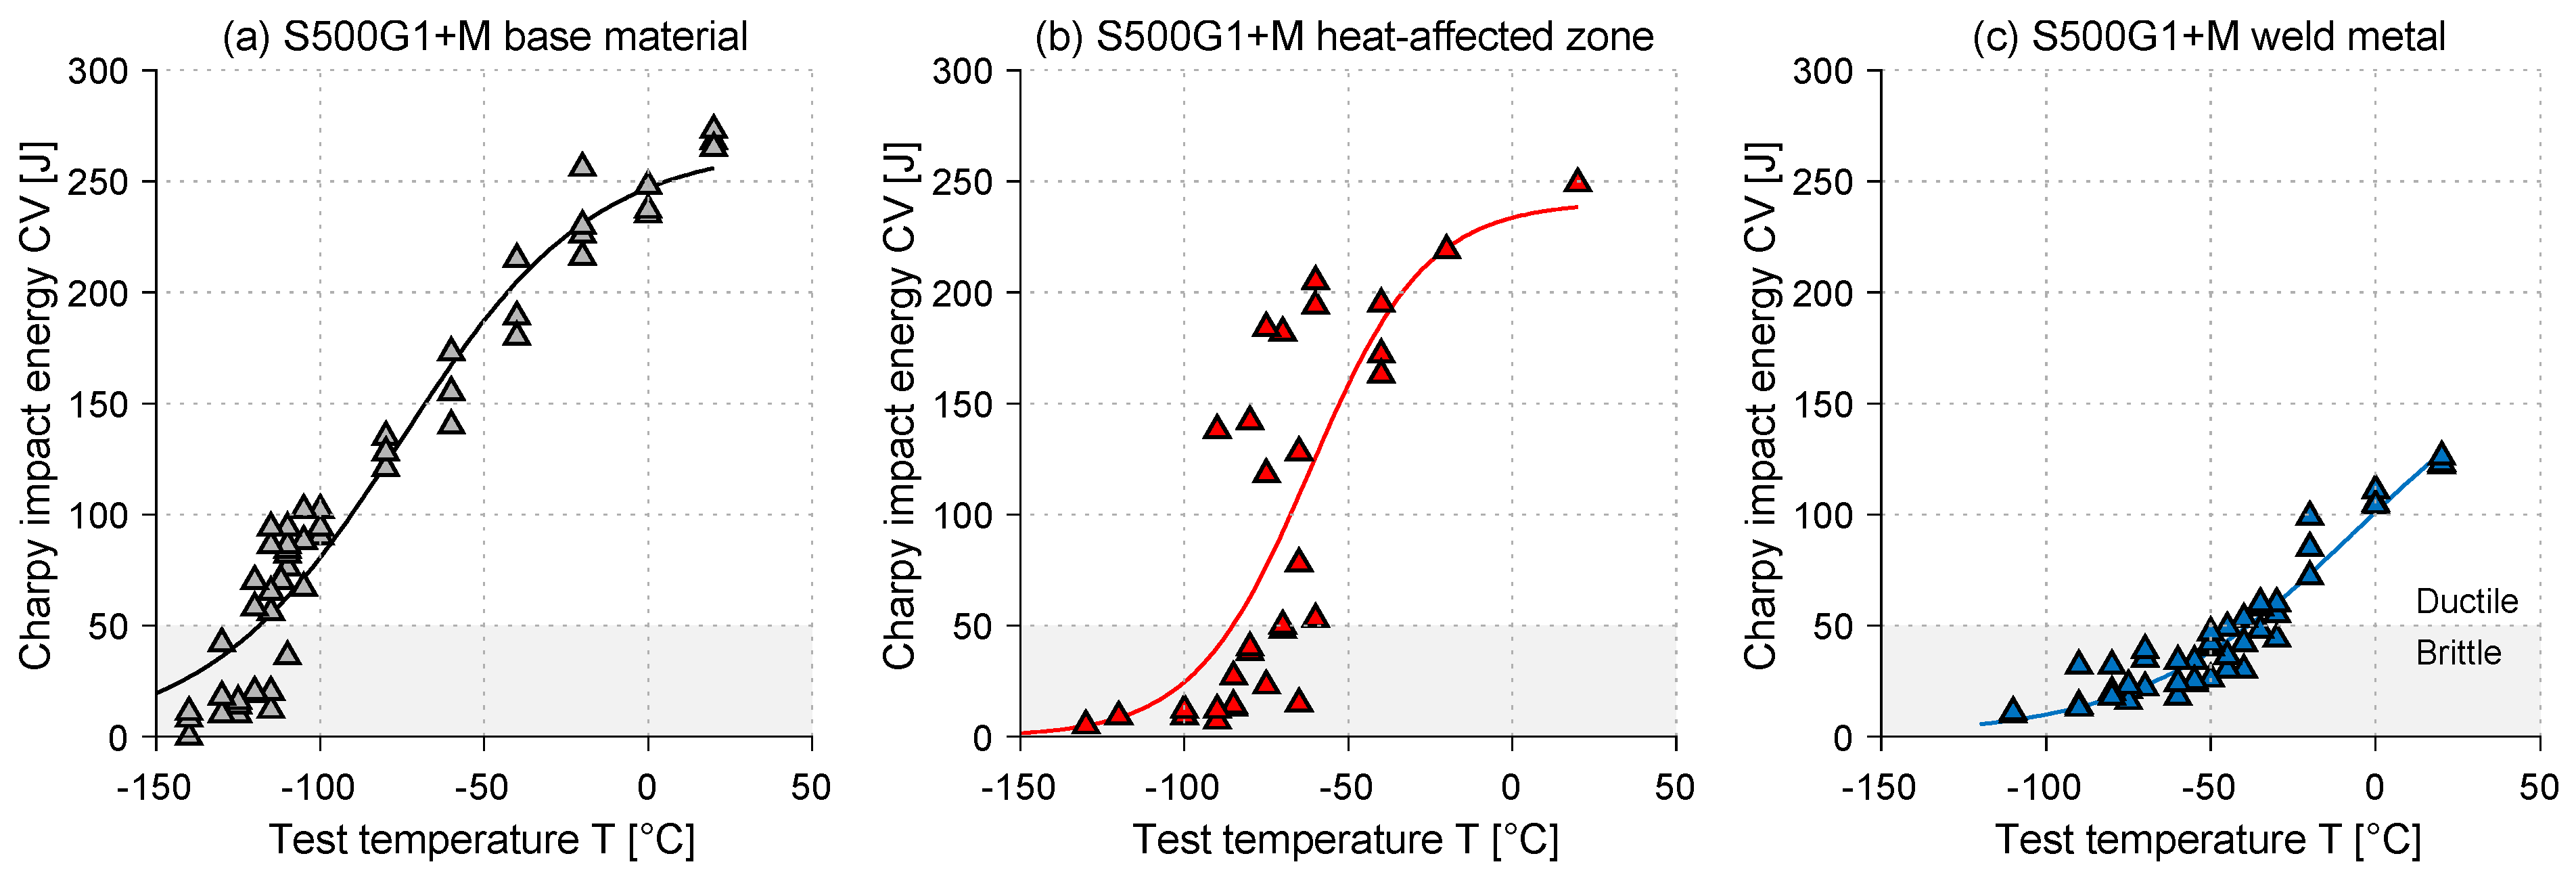
5.1. Charpy Impact Toughness Tests

The test results of the Charpy impact testing are presented in Figure 10 including sigmoidal fits to assess the mean DBTT (e.g., T50 J) [41,42].
Different curve trends are observed for the different zones of the welded joint. First of all, the base material has DBTT (T50 J = −119 °C) much lower than the minimum requirement of 50 J according to DNVGL-OS-B101 [43]. Furthermore, the heat-affected zone shows a very low DBTT of T50 J = −85 °C. In contrast, a much lower toughness and higher transition temperature is observed (T50 J = −39 °C) for the weld metal.
Testing of the middle of the weld metal is not required by EN 10225-1:2019 [44] but by DNVGL-OS-C401 [45]. It is typically assumed that the microstructure of the weld metal is inferior to the base metal, and the lowest toughness is usually associated with local brittle zones in the coarse-grain heat-affected zone [29]; however, in this study, the lowest toughness is found in the WM. This is thought to be related to the flux-cored arc welding (FCAW) process. A number of studies [28,46,47] observed much lower toughness in FCAW joints compared to other welding processes.

5.2. Fracture Toughness Tests

The fracture toughness tests have been performed according to ASTM E399-20 [40] and the fracture toughness DBTT (T0) was determined based on the master curve theory by Wallin [48]. To this goal, the procedure outline in ASTM E1921-20 [49] was applied and standard 10mm × 20 mm single-edge bend specimens were tested. Herein, the DBTT is associated with the temperature (T0) at which the critical stress intensity factor is 100   MPa m for an equivalent 25 mm thick specimen.
Fracture toughness tests are typically determined in a quasi-static manner; however, the goal of the here presented tests is to determine a DBTT based on a loading rate similar to the FCG rate tests. Thus, a higher loading rate of 1 mm/s was chosen. This rate approximately matches the stress intensity factor rate of the FCG rate tests ( K ˙ 8   MPa m · 28 1 s = 224   MPa m s ). This rate is about two times the rate at (T0) ( K ˙ = 100   MPa m s ); however, higher loading rates would have reduced the measuring accuracy, and more importantly, the DBTT is related to the logarithm of strain rate [50]. Thus, a difference in the loading rate by a factor of two does not have a significant effect on (T0).
The results of the tests are presented in Figure 11. As expected, the lowest DBTT is observed for the base material; however, in contrast to the Charpy impact tests, a lower DBTT is observed for the weld metal than for the heat-affected zone. Furthermore, a higher DBTT is obtained for BM and HAZ from the fracture toughness tests with a loading rate of 1 mm/s than from the Charpy tests.

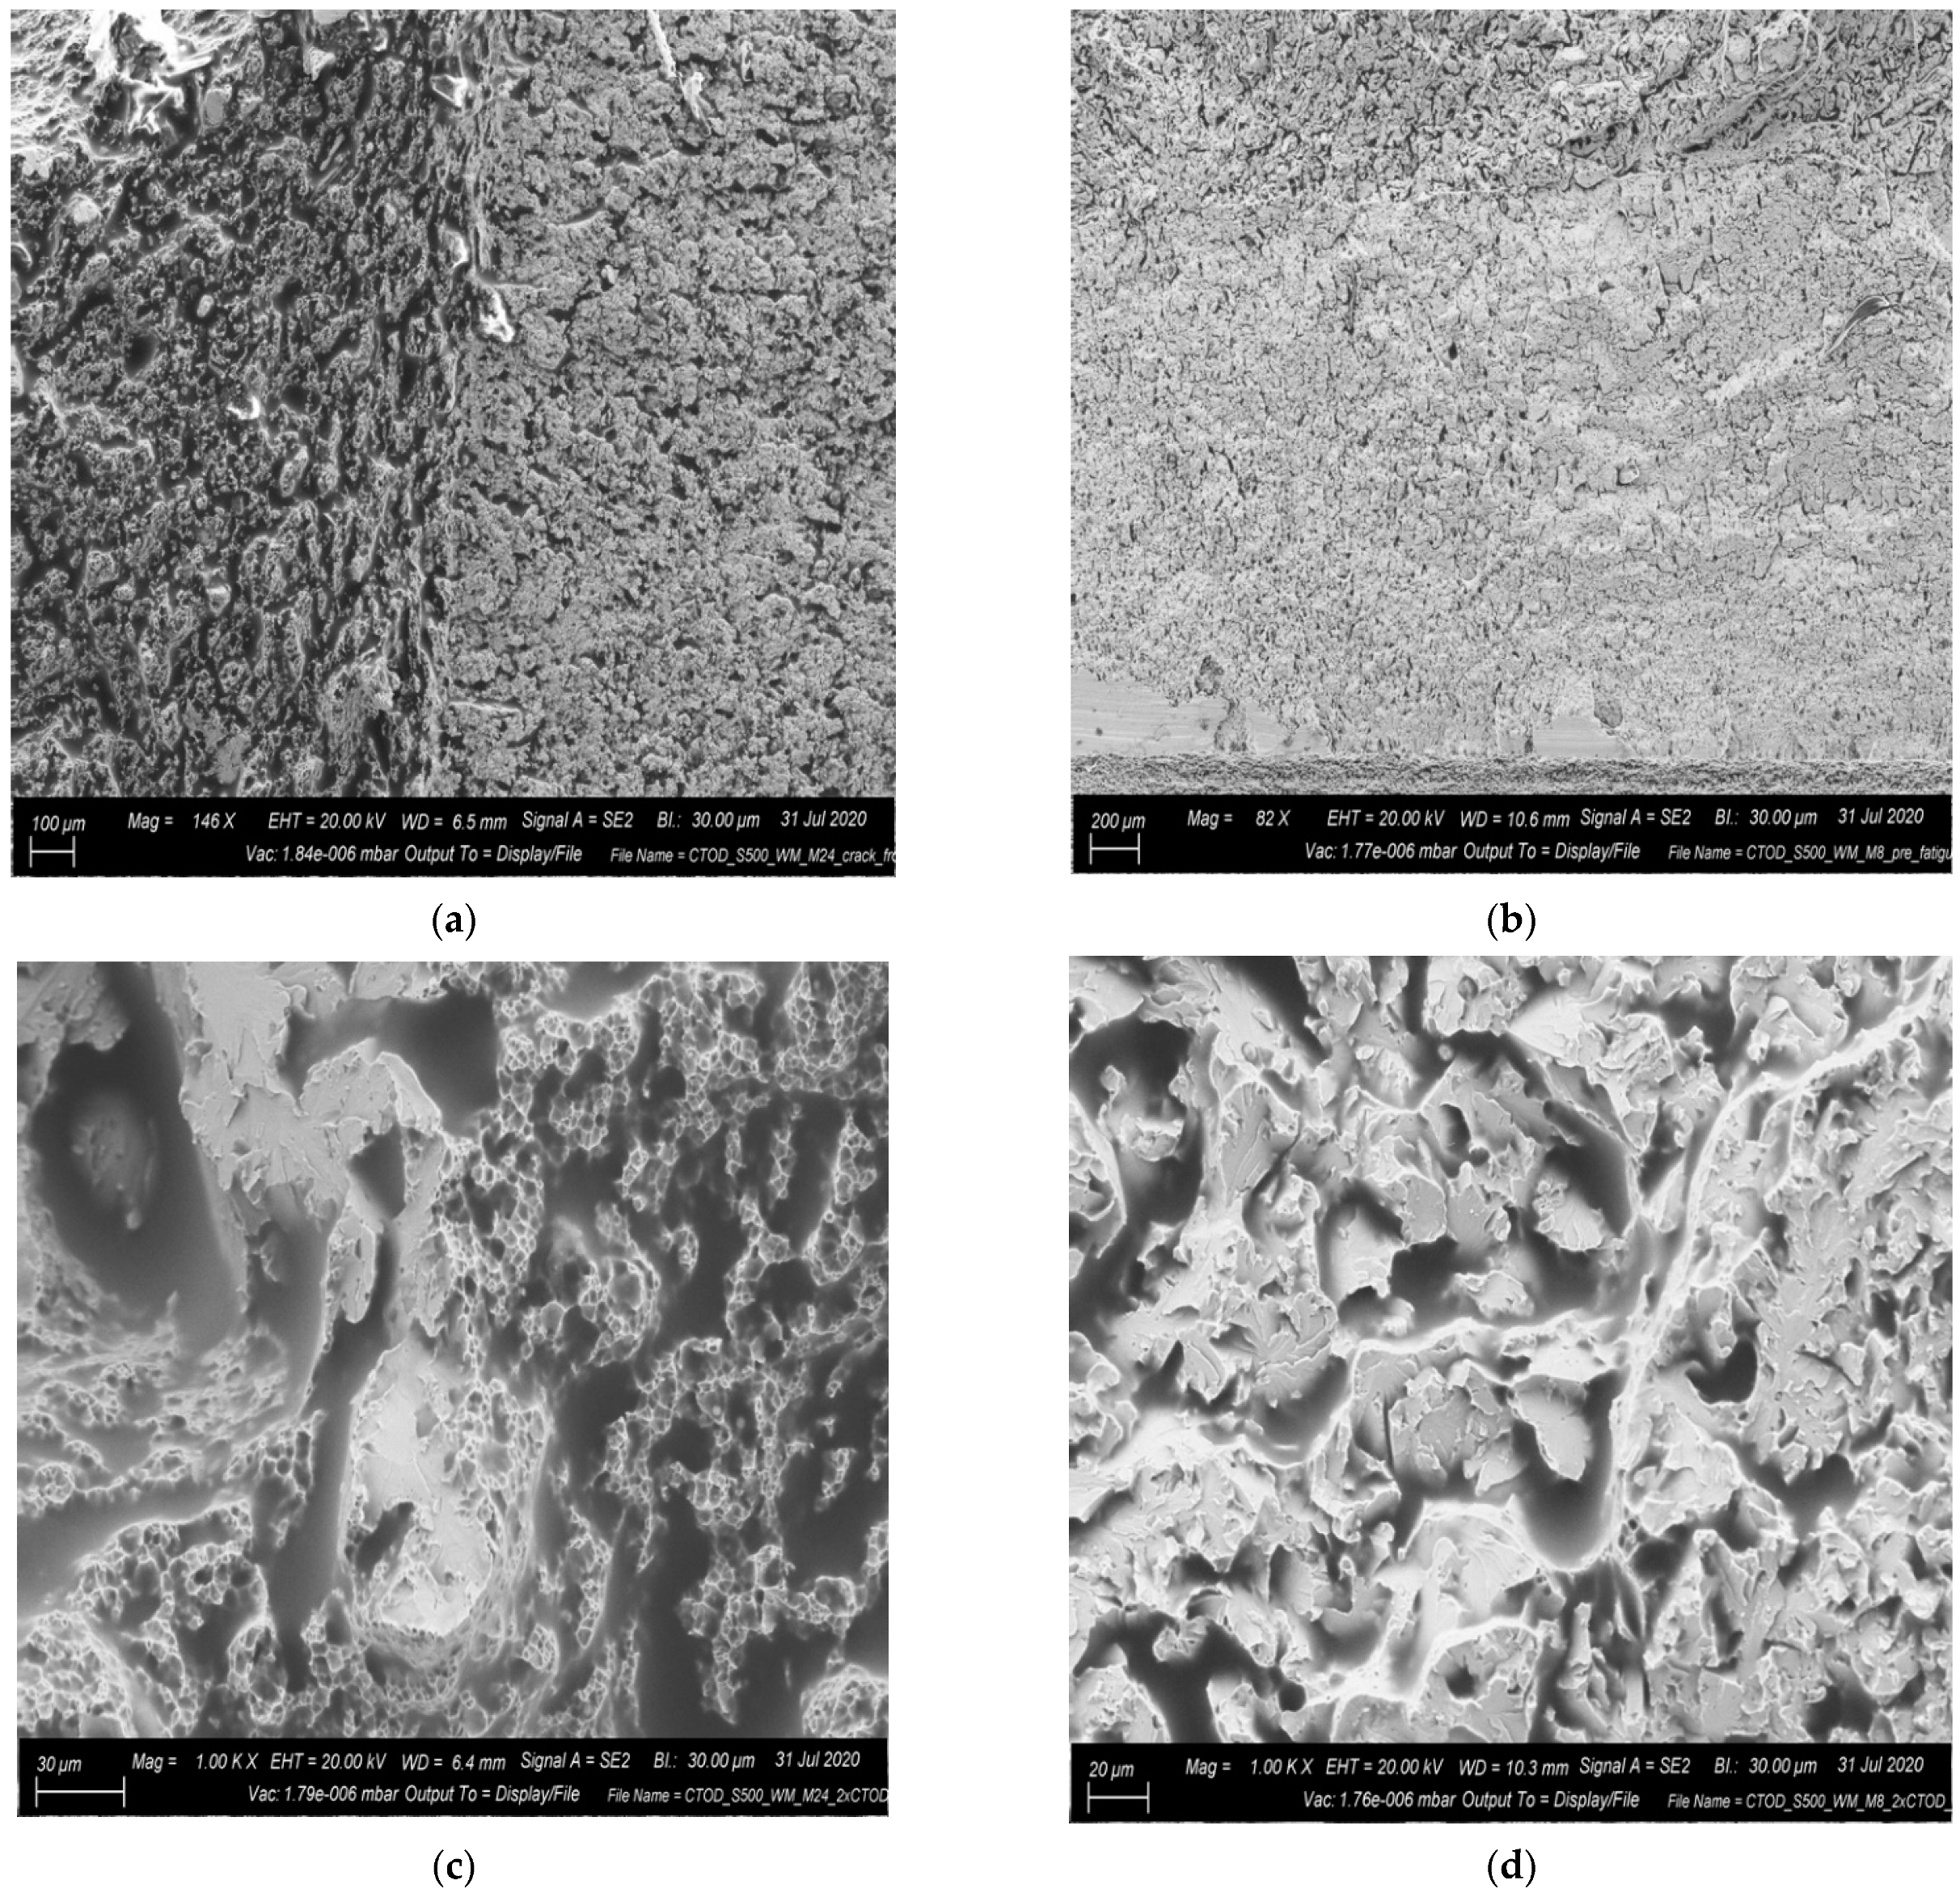
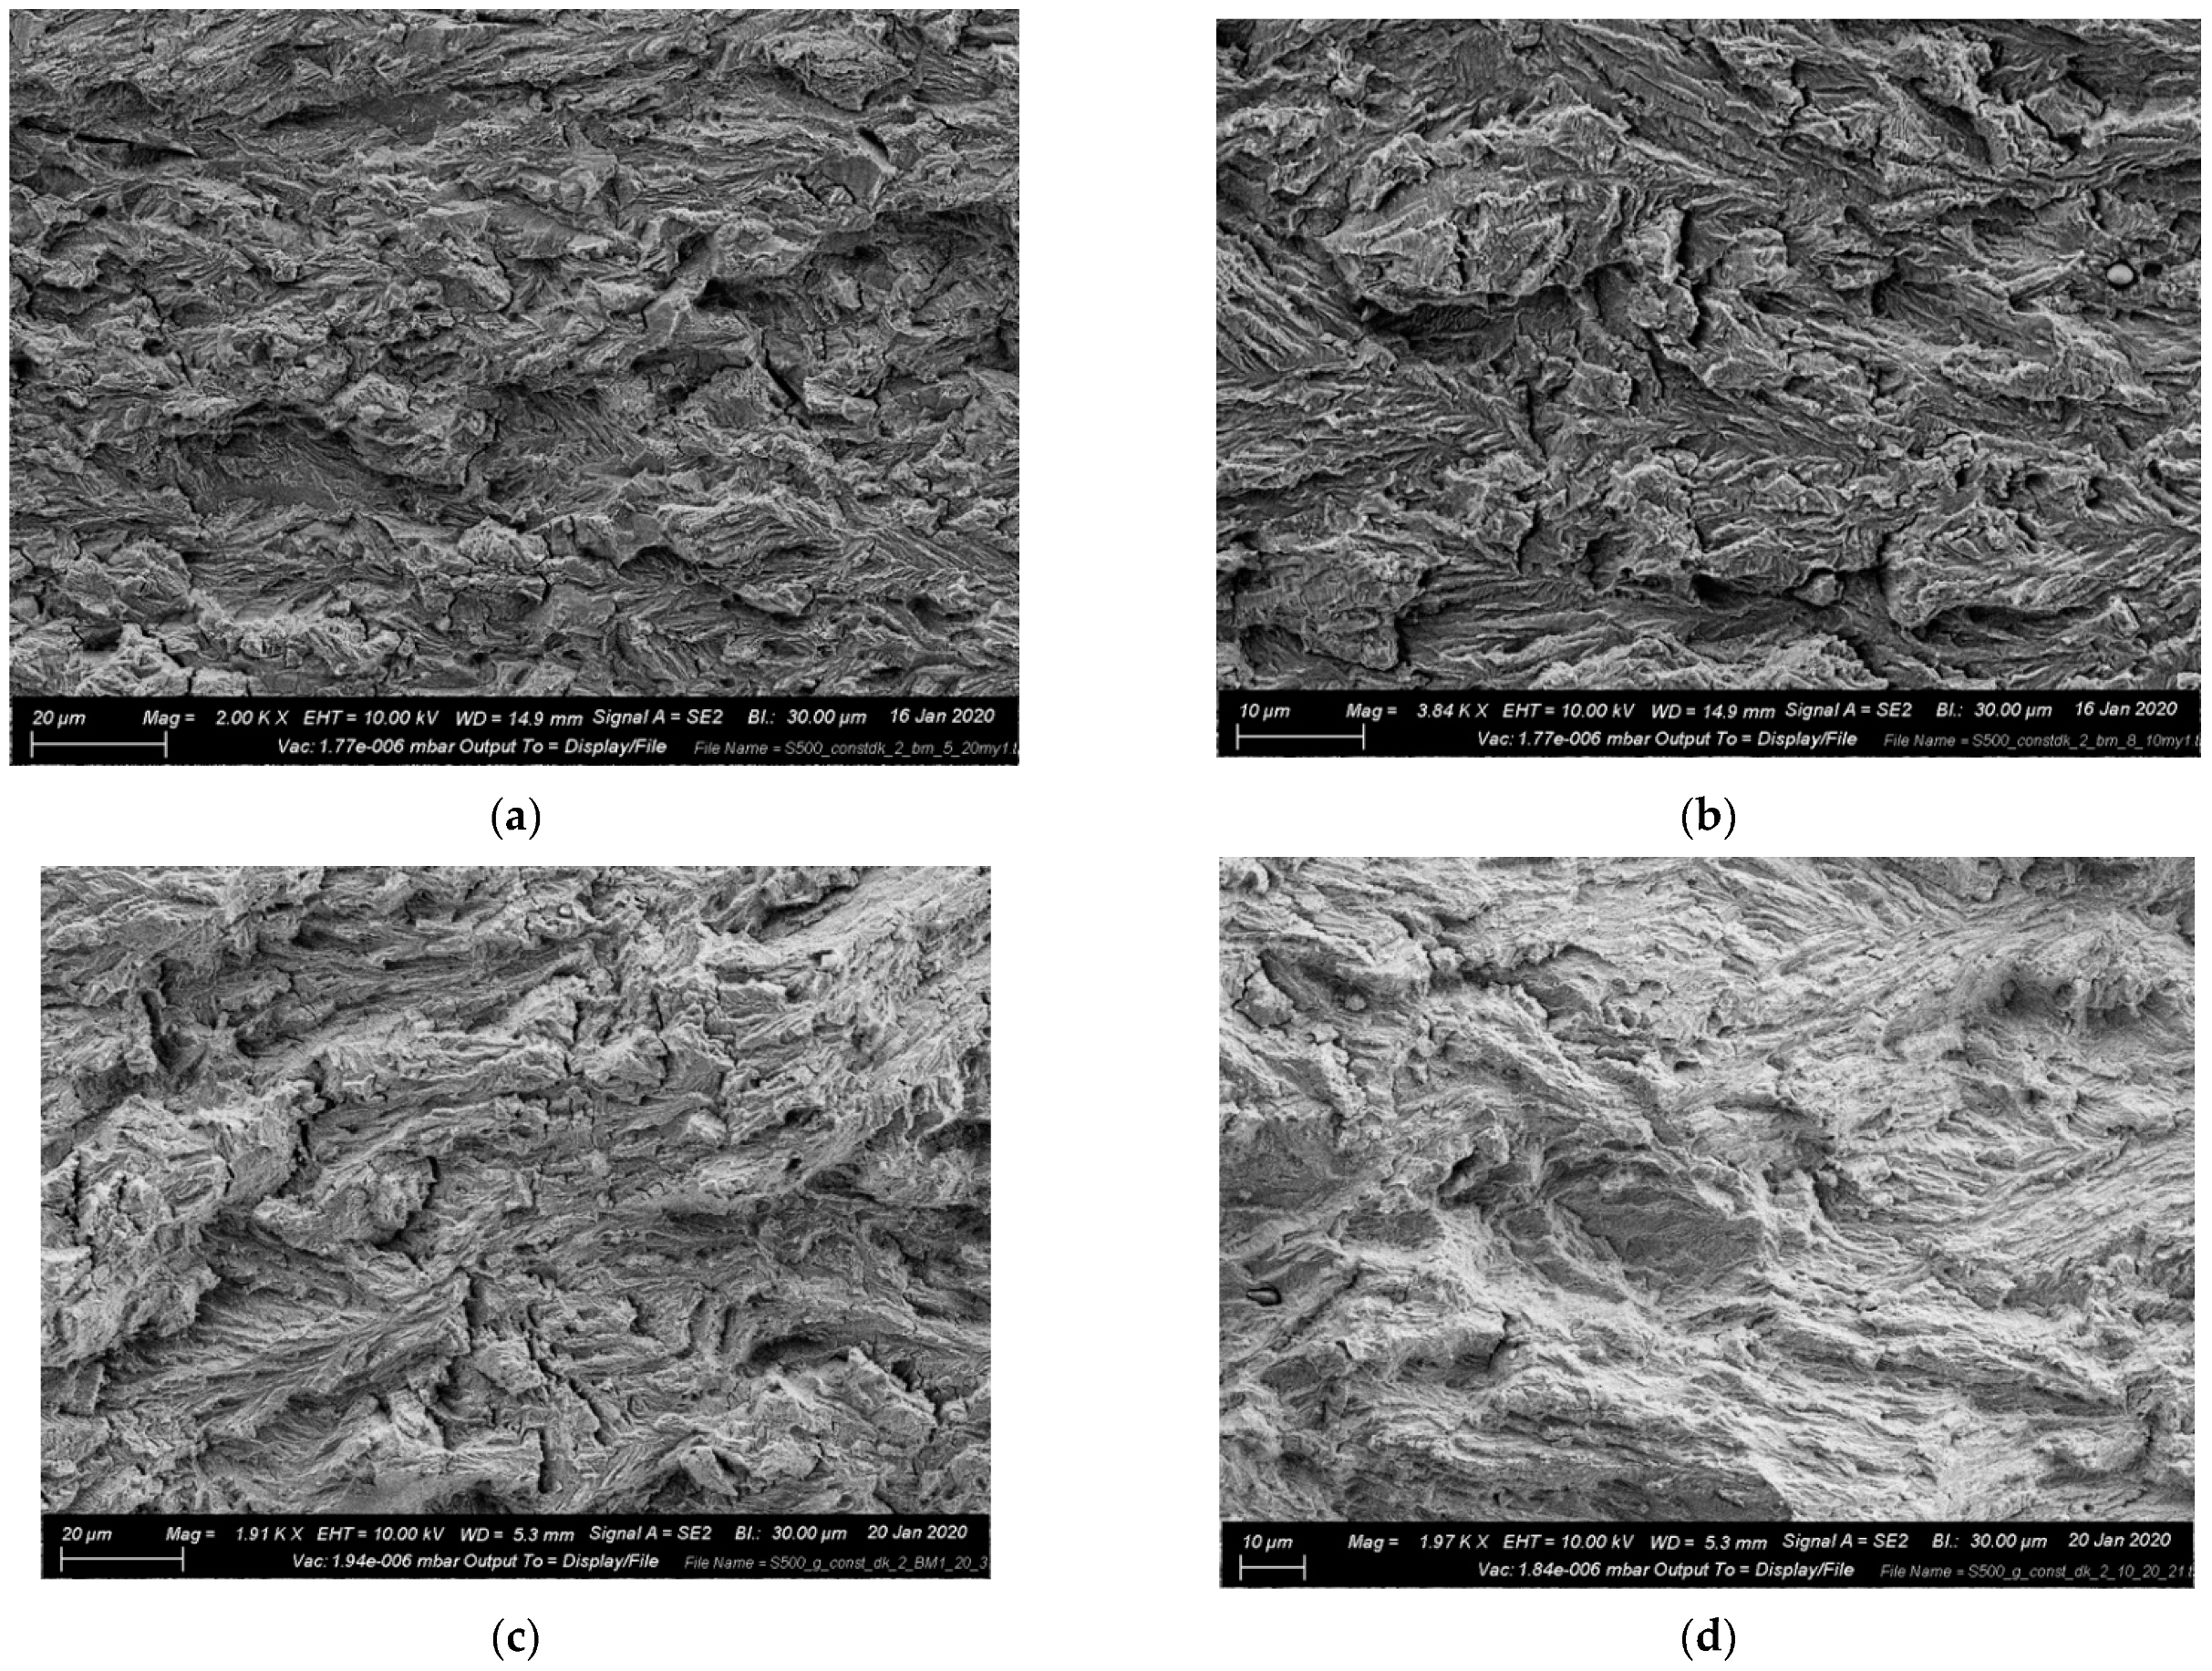
6. Fracture Surface Investigations by Means of Scanning Electron Microscopy

To explain changes in fatigue and fracture mechanics properties, fracture surface investigations by means of scanning electron microscopy were performed. First, the fracture surfaces of the fracture toughness test specimens are assessed to create a reference to assess the fracture surfaces of the fatigue test specimens. For comparison, two locations close to the pre-fatigued crack tip in the middle of the fracture surface were magnified.
The comparison of the fracture surfaces for two specimens tested at −40 °C and −85 °C shows clear evidence of different fracture mechanisms. While the magnification of the surface of the specimen tested at −40 °C (Figure 12c) shows a large number of dimples (typical for ductile failure), the fracture surface of the specimen tested at −85 °C (Figure 12d) is dominated by transgranular cleavage planes.
Compared to the apparent difference in fracture surface morphology of the fracture toughness test specimen, almost no difference is observed when assessing the surfaces of the fatigue crack growth test specimens. Again, locations in the middle of specimen thickness were magnified for comparison. To avoid the influences of previous measurements, a location corresponding roughly to the middle of a load block was chosen. This was enabled by beach marking the test specimens. The fracture surfaces of the base material and welded joints specimen are compared at −100 °C, as this was the lowest test temperature of the welded test specimen, see Figure 13. This test temperature also led to the lowest fatigue crack growth rate measured at approximately ΔK = 8   MPa m . Comparing both test specimens at room temperature and −100 °C, no change in fatigue crack growth mechanism can be observed with decreasing test temperature. This is not surprising for the base material specimens, as very low DBTTs were observed from both Charpy V-notch impact and fracture toughness testing; however, based on the DBTTs of the weld metal, a change in fatigue crack growth behavior was expected for the fatigue test specimens with cracks located in the weld metal. In fact, all four fracture surfaces are characterized by typical fatigue crack striations.

7. Discussion

7.1. Knowledge Gaps with Respect to the FTT

To avoid brittle fracture of materials at low temperatures, international standards require that the DBTT remains below the anticipated service temperatures at all times; however, low service temperatures also influence other limit states. For fatigue limit state design, it is generally assumed that lower temperatures have no detrimental effect on the fatigue properties of steels as long as the service temperature remains above the DBTT, see ISO/TS 35105:2018 [21] or Alvaro et al. [24]. This assumption is backed by fatigue crack growth rate testing of base materials for a wide variety of steel grades.
In steel structures without welds, fatigue life can be divided into two parts, fatigue crack initiation and fatigue crack growth. Depending on the geometry, stress state, and presence of material defects, one might dominate the other. The mechanism of fatigue damage is known to be the result of complex dislocation arrangement governed by local irreversible plastic flow [24]. Since the static strength increases with lower temperatures, the resistance against dislocation movement is increased and thus both the fatigue crack initiation and the crack propagation are slowed [24]; yet, for metals that feature a DBTT, the fatigue crack growth rate can increase again for temperatures below the FTT.
From base materials tests, it is known that both the slope and the intersect of the FCG curves change significantly, see Moody and Gerberich [22]; however, there is very limited data available for welded joints, see Braun and Ehlers [23]. More importantly, the relation between the fatigue and fracture ductile-brittle transition has so far only been assessed empirically. In addition, the only known investigation of this relation for welded materials has been performed for thermally weld simulated material (Gleeble machine tests), see Alvaro et al. [19]. To the authors’ knowledge, there have been limited investigations for actual welded joints, see [51,52,53]. This could be related to the complexity of such tests and additional influencing factors that are difficult to account for, e.g., welding-related specimen misalignment, weld defects, microstructural variations, and residual stresses. To overcome this problem, the current study performed tests with a single specimen by successively reducing the test temperature. Therefore, it is not possible to measure a full FCG curve but to perform a comparison of FCG rates at a constant Δ K . For this study, a Δ K of 8 MPa m was chosen, which is within the Paris regime of the FCG curve (linear part).
The results of the experiments have shown decreasing crack growth rates for temperatures below 0 °C for crack locations both in the base and the weld material. The S500 base material was tested to a temperature of −110 °C and the welded specimen to −100 °C. Down to this temperature, no distinct fatigue ductile-to-brittle transition occurred. Only at −110 °C, a slight increase in FCG rate was observed for the base material.

7.2. Relation between the FTT and the DBTT

Comparing the results with the results of the Charpy V-notch impact and fracture toughness tests, a higher FTT would have been expected. Alvaro et al. [19] and Walters et al. [20], observed an FTT 15 °C and 12 °C higher than the Charpy DBTT for the T40 J and T27 J values, respectively. Kawasaki et al. [54] observed that the FTT occurred at the same temperature as the fracture toughness that they referred to as the “fatigue fracture toughness”. For the tested S500 high-strength steel, DBTT T50 J of −39 °C and −119 °C were obtained for the weld and base material, respectively. In contrast, fracture toughness DBTT of −71 °C and −104 °C were obtained for the same zones by tests with increased loading rates that match the stress intensity factor rate of the FCG rate tests. Those two zones were chosen for FCG rate testing based upon the lower Charpy impact toughness for the weld metal and because a notch location in the HAZ would intersect several other zones of the welded joint. Attributing a change in FCG rate behavior at low temperatures to a particular zone of the welded joint would therefore be difficult.
The FCG rate tests performed in this study show that there is no sudden increase in FCG rates down to the Charpy and fracture toughness DBTTs for S500 base material and even below the two DBTTs for the weld material for a stress range of ΔK = 8 MPa m and an R-ratio of 0.5. This seems contradictory to the results of Walters et al. [20]. At FCG test temperatures below the DBTT, no sudden brittle fracture would have been expected due to the low ΔK of 8 MPa m ; yet, an increase in FCG rate was expected based on the results presented by Alvaro et al. [19] and Walters et al. [20]. In contrast, the specimens showed no sign of accelerated crack growth. The results seem to match better with the more subtle changes in FCG rate reported by Kawaski et al. [54]. This was also verified by scanning electron microscopy. The reason for this might be related to the choice of a low, constant ΔK for the FCG tests. This rate is in the lower part of the Paris regime of FCG curves and therefore representative for short cracks with slow crack propagation. Such a rate would, for example, characterize the majority of small fatigue cracks initiating at weld transitions. Alvaro et al. [19] observed cleavage burst—that they related to the FTT—at much higher ΔK of 17.2 MPa m . The effect of the FTT might therefore be strongly related to the magnitude of the stress intensity factor range. This would explain why no distinct FTT was observed even at temperatures below the DBTTs obtained from Charpy impact and fracture toughness tests; however, Walters et al. [20] pointed out the high scatter of crack growth tests in the transition region, which could also cover possible changes in FCG behavior.
Another explanation is that a number of authors have reported that the FCG curves at low temperatures tend to have higher slopes than the FCG curves at high temperatures, resulting in an intersection between the low- and high-temperature FCG curves somewhere in the Paris regime. These curves then have lower FCG values at low temperatures and low values of ΔK and higher FCG values at low temperatures and high values of ΔK, e.g., [22,51,55]. The intersection of FCG curves for room and low temperatures is presented in Figure 14.
With testing of multiple temperatures at only one value of ΔK, it is impossible to know if the ΔK value is below, at, or above the intersection. Hypothetically, materials that were tested at the intersection should show little influence of temperature.
In addition, a number of other factors are known to affect the FTT and DBTT. Some of them are related to the test conditions, i.e., specimen geometry and load ratio [29]. Others are related to the defects and inhomogeneities created during welding. The process of welding itself and the reheating and cooling of several weld layers has an impact on microstructure and mechanical properties [28], as do the welding consumables [30].
Typically, the highest ductile-brittle transition temperature is found in the coarse-grained and intercritically reheated coarse-grained heat-affected zones [6,19,29,31]. This zone is, however, fairly small, particularly in thin-plated structures with few weld layers, such as in ships. This might be the reason why the lowest Charpy notch impact toughness was observed in weld metal of the test specimens used for this study. As the specimens were rather thin with a thickness of about 10 mm, different results might have been observed in thick-plated structures with more weld layers. Another important aspect of welded structures is welding residual stresses. Typically, high tensile residual stresses are created in large welded structures. To account for this effect in a simplified manner, the weld material specimens of this study were first stress relieved by heat treatment and then tested at a high-stress ratio R = 0.5 to simulate high tensile residual stresses. In actual large-scale structures, residual stresses are typically not constant. This effect will therefore alter the effect stress ratio at critical locations.

7.3. Aspects to Consider in Future Work

In summary, the chosen approach by testing only one specimen at different temperatures presented clear evidence of decreasing FCG rates at low temperatures; however, no distinct FTT was observed even below the DBTT obtained from Charpy and fracture toughness tests for the investigated high-strength S500 steel. Based on the assumption that brittle fracture occurs before the changing fatigue behavior significantly affects the lifetime of a structure, current regulations for material qualifications are aimed at enforcing sufficient toughness values at the design temperature, e.g., ISO 19906:2019 [57]. The main objective of many research projects is therefore to provide a reliable basis for estimating the transition to brittle fracture of base materials and welded structures; yet, above the transition temperatures, the fatigue strength is significantly increased. This effect is currently not considered in any design standard or relevant specifications, e.g., ISO/TS 35105:2018 [21]. In fact, compared to the well-investigated fracture ductile-to-brittle transition, the effect of temperature on fatigue properties of welded structures is scarcely investigated.

8. Conclusions

This study investigated the relation between the fatigue transition temperature and the ductile-brittle transition temperature by means of fatigue crack propagation tests at constant stress intensity factor range and fracture mechanics tests (i.e., Charpy impact, fracture toughness), respectively. For this purpose, the base material and welded joints of S500 high-strength steel were investigated. In addition, scanning electron microscopy photographs of the fracture surfaces were made to assess changes in the failure mechanism. From the experiments, the following conclusions are obtained:
  • From the tests, an almost constant decrease in fatigue crack propagation rate is determined with decreasing test temperature even below the ductile-brittle transition temperature of the weld metal.
  • At −100 °C, the fatigue crack propagation rate is about half of the rate observed at room temperature for both base material and weld metal of the S500 steel.
  • Compared to the apparent difference in fracture surface morphology of the fracture toughness test specimen, almost no difference is observed when assessing the surfaces of the fatigue crack growth test specimens of both base material and weld metal at −100 °C and thereby well below the ductile-brittle transition temperature.
  • The relationship between fatigue crack growth rate and temperature is thought to be related to the magnitude of the stress intensity factor range. This could explain why no distinct fatigue transition temperature was observed even at temperatures below the ductile-brittle transition temperatures obtained from Charpy impact and fracture toughness tests.
In recent years, there has been an increased interest in low-temperature effects on fatigue and the relation between fatigue and fracture ductile-to-brittle transition; nevertheless, there is still a lot of work to do on this subject to fully understand the fatigue and fracture transition behavior and to correctly account for temperature effects during design.

Author Contributions

Conceptualization, F.S., M.B. and C.L.W.; methodology, F.S. and M.B.; software, F.S.; validation, M.B.; formal analysis, F.S., F.R. and M.B.; investigation, F.S. and M.B.; resources, M.B.; data curation, F.S. and M.B.; writing—original draft preparation, F.S. and M.B.; writing—review and editing, C.L.W. and S.E.; visualization, F.S., F.R. and M.B.; supervision, M.B. and S.E. All authors have read and agreed to the published version of the manuscript.

Funding

This research received no external funding.

Institutional Review Board Statement

Not applicable.

Informed Consent Statement

Not applicable.

Data Availability Statement

Not applicable.

Conflicts of Interest

The authors declare no conflict of interest.

References

  1. Von Bock und Polach, R.U.F.; Klein, M.; Kubiczek, J.; Kellner, L.; Braun, M.; Herrnring, H. State of the art and knowledge gaps on modelling structures in cold regions. In Proceedings of the ASME 2019 38th International Conference on Ocean, Offshore and Arctic Engineering Glasgow, Scotland, UK, 9–14 June 2019. [Google Scholar]
  2. Zhang, S.; Bridges, R.; Tong, J. Fatigue design assessment of ship structures induced by ice loading-an introduction to the ShipRight FDA ICE procedure. In Proceedings of the Twenty-first International Offshore and Polar Engineering Conference, International Society of Offshore and Polar Engineers, Maui, HI, USA, 19–24 June 2011. [Google Scholar]
  3. Bjerkås, M.; Alsos, H.S.; Wåsjø, K. Estimates of the number of vibration cycles from frequency locked-in ice loads. In Proceedings of the International Conference on Offshore Mechanics and Arctic Engineering, San Francisco, CA, USA, 8–13 June 2014; American Society of Mechanical Engineers: New York, NY, USA, 2014. [Google Scholar]
  4. Lehtomäki, V.; Rissanen, S.; Wadham-Gagnon, M.; Sandel, K.; Moser, W.; Jacob, D. Fatigue loads of iced turbines: Two case studies. J. Wind Eng. Ind. Aerodyn. 2016, 158, 37–50. [Google Scholar] [CrossRef]
  5. Panin, S.; Vlasov, I.; Maruschak, P.; Eremin, A.; Berto, F.; Syromyatnikova, A.; Vinogradov, A. Influence of long-term cold climate operation on structure, fatigue durability and impact toughness of 09Mn2Si pipe steel. Eng. Fail. Anal. 2019, 102, 87–101. [Google Scholar] [CrossRef]
  6. Horn, A.M.; Østby, E.; Moslet, P.O.; Hauge, M. The fracture resistance approach in order to prevent brittle failure of offshore structures under arctic environments. In Proceedings of the ASME 2016 35th International Conference on Ocean, Offshore and Arctic Engineering, Busan, Korea, 19–24 June 2016; American Society of Mechanical Engineers: New York, NY, USA, 2016; p. V004T03A021. [Google Scholar]
  7. Baek, J.-H.; Kim, C.-M.; Kim, W.-S.; Kho, Y.-T. Fatigue crack growth and fracture toughness properties of 304 stainless steel pipe for LNG transmission. Met. Mater. Int. 2001, 7, 579–585. [Google Scholar] [CrossRef]
  8. Bridges, R.; Zhang, S.; Shaposhnikov, V. Experimental investigation on the effect of low temperatures on the fatigue strength of welded steel joints. Ships Offshore Struct. 2012, 7, 311–319. [Google Scholar] [CrossRef]
  9. Jeong, D.; Lee, S.; Seo, I.; Yoo, J.; Kim, S. Fatigue crack propagation behavior of Fe24Mn steel weld at 298 and 110 K. Met. Mater. Int. 2015, 21, 22–30. [Google Scholar] [CrossRef]
  10. Jung, D.-H.; Kwon, J.-K.; Woo, N.-S.; Kim, Y.-J.; Goto, M.; Kim, S. S–N fatigue and fatigue crack propagation behaviors of X80 steel at room and low temperatures. Met. Mater. Trans. A 2014, 45, 654–662. [Google Scholar] [CrossRef]
  11. Kang, K.-W.; Goo, B.-C.; Kim, J.-H.; Kim, D.; Kim, J.-K. Experimental investigation on static and fatigue behavior of welded sm490a steel under low temperature. Int. J. Steel Struct. 2009, 9, 85–91. [Google Scholar] [CrossRef]
  12. Kim, S.; Jeong, D.; Sung, H. Reviews on factors affecting fatigue behavior of high-Mn steels. Met. Mater. Int. 2018, 24, 1–14. [Google Scholar] [CrossRef]
  13. Li, Z.; Zhang, D.; Wu, H.; Huang, F.; Hong, W.; Zang, X. Fatigue properties of welded Q420 high strength steel at room and low temperatures. Constr. Build. Mater. 2018, 189, 955–966. [Google Scholar] [CrossRef]
  14. Liao, X.; Wang, Y.; Qian, X.; Shi, Y. Fatigue crack propagation for Q345qD bridge steel and its butt welds at low temperatures. Fatigue Fract. Eng. Mater. Struct. 2018, 41, 675–687. [Google Scholar] [CrossRef]
  15. Shul’Ginov, B.; Matveyev, V. Impact fatigue of low-alloy steels and their welded joints at low temperature. Int. J. Fatigue 1997, 19, 621–627. [Google Scholar] [CrossRef]
  16. Zhao, W.; Feng, G.; Liu, W.; Ren, H. Research on Fatigue Properties of Typical Welded Joints of DH36 Steel at −60 °C. Appl. Sci. 2020, 10, 3742. [Google Scholar] [CrossRef]
  17. Wang, Y.; Liu, J.; Hu, J.; Garbatov, Y.; Soares, C.G. Fatigue strength of EH36 steel welded joints and base material at low-temperature. Int. J. Fatigue 2021, 142, 105896. [Google Scholar] [CrossRef]
  18. Viespoli, L.M.; Leonardi, A.; Cianetti, F.; Nyhus, B.; Alvaro, A.; Berto, F. Low-temperature fatigue life properties of aluminum butt weldments by the means of the local strain energy density approach. Mater. Des. Process. Commun. 2019, 1, e30. [Google Scholar] [CrossRef] [Green Version]
  19. Alvaro, A.; Akselsen, O.M.; Ren, X.B.; Perillo, G.; Nyhus, B. On the Relation between Fatigue and Static Ductile to Brittle Transition for Weld Simulated 420 MPa Structural Steel. In Proceedings of the 27th International Ocean and Polar Engineering Conference, San Francisco, CA, USA, 25−30 June 2017. [Google Scholar]
  20. Walters, C.L.; Alvaro, A.; Maljaars, J. The effect of low temperatures on the fatigue crack growth of S460 structural steel. Int. J. Fatigue 2016, 82, 110–118. [Google Scholar] [CrossRef]
  21. International Standards Organization. ISO/TS 35105:2018, Petroleum and Natural Gas Industries—Arctic Operations—Material Requirements for Arctic Operations; ISO: Geneva, Switzerland, 2018. [Google Scholar]
  22. Moody, N.; Gerberich, W. Fatigue crack propagation in iron and two iron binary alloys at low temperatures. Mater. Sci. Eng. 1979, 41, 271–280. [Google Scholar] [CrossRef]
  23. Braun, M.; Ehlers, S. Review of methods for the high-cycle fatigue strength assessment of steel structures subjected to sub-zero temperature. Mar. Struct. 2021, 82, 103153. [Google Scholar] [CrossRef]
  24. Alvaro, A.; Akselsen, O.M.; Ren, X.B.; Kane, A. Fundamental aspects of fatigue of steel in Arctic applications. In Proceedings of the 24th International Ocean and Polar Engineering Conference, Busan, Korea, 15–20 June 2014. [Google Scholar]
  25. Alvaro, A.; Akselsen, O.M.; Ren, X.B.; Nyhus, B. Fatigue Crack Growth of a 420 MPa Structural Steel Heat Affected Zone at Low Temperatures. In Proceedings of the 26th International Ocean and Polar Engineering Conference, Rhodes, Greece, 26 June–2 July 2014. [Google Scholar]
  26. Miki, C.; Anami, K. Improving fatigue strength by additional welding with low temperature transformation welding electrodes. Int. J. Steel Struct. 2001, 1, 25–32. [Google Scholar]
  27. Wahab, M.; Sakano, M. Corrosion and biaxial fatigue of welded structures. J. Mater. Process. Technol. 2003, 143–144, 410–415. [Google Scholar] [CrossRef]
  28. Gubeljak, N.; Legat, J.; Koçak, M. Effect of fracture path on the toughness of weld metal. Int. J. Fract. 2002, 115, 343–359. [Google Scholar] [CrossRef]
  29. Zerbst, U.; Ainsworth, R.; Beier, H.; Pisarski, H.; Zhang, Z.; Nikbin, K.; Nitschke-Pagel, T.; Münstermann, S.; Kucharczyk, P.; Klingbeil, D. Review on fracture and crack propagation in weldments—A fracture mechanics perspective. Eng. Fract. Mech. 2014, 132, 200–276. [Google Scholar] [CrossRef]
  30. Park, J.Y.; Kim, M.H. Investigation of fatigue and fracture characteristics for low-temperature metals considering the effects of various alloying components. Weld. World 2020, 64, 1691–1702. [Google Scholar] [CrossRef]
  31. Brandt, K.; Solberg, J.K.; Akselsen, O.M.; Østby, E. Initiation of Cleavage Fracture in a Weld Simuled Low Carbon Low Alloy Arctic Steel. In Proceedings of the Twenty-second International Offshore and Polar Engineering Conference, Rhodes, Greece, 17–22 June 2012. [Google Scholar]
  32. Braun, M. Assessment of Fatigue Strength of Welded Steel Joints at Sub-Zero Temperatures Based on the Micro-Structural Support Effect Hypothesis. Ph.D. Thesis, Technische Universität Hamburg, Hamburg, Germany, 2021. [Google Scholar]
  33. Fydrych, D.; Łabanowski, J.; Rogalski, G.; Haras, J.; Tomków, J.; Świerczyńska, A.; Jakóbczak, P.; Kostro, Ł. Weldability of S500MC Steel in Underwater Conditions. Adv. Mater. Sci. 2014, 14, 37–45. [Google Scholar] [CrossRef] [Green Version]
  34. Braun, M.; Scheffer, R.; Fricke, W.; Ehlers, S. Fatigue strength of fillet-welded joints at subzero temperatures. Fatigue Fract. Eng. Mater. Struct. 2019, 43, 403–416. [Google Scholar] [CrossRef]
  35. ASTM International. ASTM E647-15e1 Standard Test Method for Measurement of Fatigue Crack Growth Rates; ASTM International: West Conshohocken, PA, USA, 2015. [Google Scholar] [CrossRef]
  36. Johnson, H. Calibrating the electric potential method for studying slow crack growth. Mater. Res. Stand. 1965, 5, 442. [Google Scholar]
  37. Sallaba, F. Analysis of Fatigue Crack Growth Threshold of Welded Structural Steel. Master’s Thesis, Technische Universität Hamburg, Hamburg, Germany, 2019. [Google Scholar]
  38. Barsom, J.M.; Rolfe, S.T. Fracture and Fatigue Control in Structures: Applications of Fracture Mechanics; Third Edition; ASTM International: West Conshohocken, PA, USA, 1999; Volume 101520. [Google Scholar] [CrossRef]
  39. E28 Committee Test Methods for Notched Bar Impact Testing of Metallic Materials; ASTM International: West Conshohocken, PA, USA, 2016; p. 101520 0023.
  40. E08 Committee Test Method for Linear-Elastic Plane-Strain Fracture Toughness of Metallic Materials; ASTM International: West Conshohocken, PA, USA, 2021; p. 101520 0399.
  41. Braun, M.; Milaković, A.-S.; Ehlers, S.; Kahl, A.; Willems, T.; Seidel, M.; Fischer, C. Sub-Zero Temperature Fatigue Strength of Butt-Welded Normal and High-Strength Steel Joints for Ships and Offshore Structures in Arctic Regions. In Proceedings of the ASME 2020 39th International Conference on Ocean, Offshore and Arctic Engineering, Fort Lauderdale, FL, USA, 28 June–3 July 2020. [Google Scholar]
  42. Braun, M.; Kahl, A.; Willems, T.; Seidel, M.; Fischer, C.; Ehlers, S. Guidance for material selection based on static and dynamic mechanical properties at sub-zero temperatures. J. Offshore Mech. Arct. Eng. 2021, 143, 041704. [Google Scholar] [CrossRef]
  43. DNV GL AS. DNVGL-OS-B101; Metallic Materials: Høvik, Norway, 2018. [Google Scholar]
  44. European Committee for Standardization. EN 10225-1:2019 Weldable Structural Steels for Fixed Offshore Structures–Technical Delivery Conditions–Part 1: Plates; European Committee for Standardization: Brussels, Belgium, 2019. [Google Scholar]
  45. DNV GL AS. DNVGL-OS-C401: Fabrication and Testing of Offshore Structures; Metallic Materials: Høvik, Norway, 2018. [Google Scholar]
  46. Coronado, J.; Cerón, C. Fracture mechanisms of CTOD samples of submerged and flux cored arc welding. Theor. Appl. Fract. Mech. 2010, 53, 145–151. [Google Scholar] [CrossRef]
  47. Tuma, J.V.; Sedmak, A. Analysis of the unstable fracture behaviour of a high strength low alloy steel weldment. Eng. Fract. Mech. 2004, 71, 1435–1451. [Google Scholar] [CrossRef]
  48. Wallin, K. Fracture Toughness Transition Curve Shape for Ferritic Structural Steels. In Fracture of Engineering Materials and Structures; Springer Science and Business Media LLC: Berlin/Heidelberg, Germany, 1991; pp. 83–88. [Google Scholar]
  49. E08 Committee. Test Method for Determination of Reference Temperature, to, for Ferritic Steels in the Transition Range; ASTM International: West Conshohocken, PA, USA, 2020; p. 105201921. [Google Scholar]
  50. Walters, C.L.; Przydatek, J. Relating Structural Loading Rate to Testing Rate for Fracture Mechanics Specimens. In Proceedings of the ASME 2014 33rd International Conference on Ocean, Offshore and Arctic Engineering, San Francisco, CA, USA, 8–13 June 2014; American Society of Mechanical Engineers: New York, NY, USA, 2014. [Google Scholar]
  51. Kitsunai, Y. Fatigue Crack Growth Behavior in Mild Steel Weldments at Low Temperatures. In Fatigue at Low Temperatures; Stephens, R.I., Ed.; ASTM International: West Conshohocken, PA, USA, 1985; pp. 274–292. [Google Scholar]
  52. Kim, Y.W.; Oh, D.J.; Lee, J.M.; Noh, B.J.; Sung, H.J.; Ando, R.; Matsumoto, T.; Kim, M.H. An experimental study for fatigue performance of 7% nickel steels for type b liquefied natural gas carriers. J. Offshore Mech. Arct. Eng. 2016, 138, 031401. [Google Scholar] [CrossRef]
  53. Kitsunai, Y.; Yoshihisa, E. Fatigue crack growth behavior in welded joints of high-strength steel under low temperatures. JSME Int. J. Ser. A Mech. Mater. Eng. 1991, 34, 339–346. [Google Scholar] [CrossRef] [Green Version]
  54. Kawasaki, T.; Yokobori, T.; Sawaki, Y.; Nakanishi, S.; Izumi, H. Fatigue fracture toughness and fatigue crack propagation in 5.5% ni steel at low temperature. In Advances in Research on the Strength and Fracture of Materials; Elsevier BV: Amsterdam, The Netherlands, 1978; pp. 857–864. [Google Scholar]
  55. Stephens, R.I.; Chung, J.H.; Glinka, G. Low temperature fatigue behavior of steels-a review. SAE Tech. Pap. Ser. 1979, 88, 1892–1904. [Google Scholar] [CrossRef]
  56. Yarema, S.Y.; Krasovskii, A.Y.; Ostash, O.P.; Stepanenko, V.A. Development of fatigue failure of low-carbon sheet steel at room and low temperatures. Strength Mater. 1977, 9, 266–272. [Google Scholar] [CrossRef]
  57. European Committee for Standardization. EN ISO 19906:2019: Petroleum and Natural Gas Industries–Arctic Offshore Structures; European Committee for Standardization: Brussels, Belgium, 2019; Volume EN. [Google Scholar]
Figure 1. Dimensions of the specimens including magnification of the fatigue crack starter notch centered in the welded joint. In Detail Z ca. 9.5 is representing the approximate thickness of the specimens in milimeters.
Metals 12 00385 g001
Figure 2. Positions of the welded bolts for current input and measurements.
Metals 12 00385 g002
Figure 3. Photograph of one of the welded specimens with a machined surface, heat tint from the heat treatment, the two crack detection gauges, and the copper-coated bolts for current measurements.
Metals 12 00385 g003
Figure 4. Fracture welded specimen with wire-eroded crack starter notch and visible beach marks.
Metals 12 00385 g004
Figure 5. Results of the constant SIF range experiments at Δ K = 8   MPa m of the S500 steel base material for temperatures between RT and −110 °C. The results are displayed with the estimated scatter band according to Barsom and Rolfe [38].
Metals 12 00385 g005
Figure 6. The results of the base material experiments at constant ΔK plotted together with the results of decreasing ΔK experiments.
Metals 12 00385 g006
Figure 7. Results of the constant SIF range experiments at ΔK = 8   MPa m of the S500 steel weld material for temperatures between RT and −100 °C. The results are displayed with the estimated scatter band according to Barsom and Rolfe [38].
Metals 12 00385 g007
Figure 8. The results of the constant ΔK experiments of the specimen with the crack in the weld material are plotted together with the results of the decreasing ΔK experiments at room temperature.
Metals 12 00385 g008
Figure 9. Charpy and fracture toughness test specimens with the notch and crack tip located in the HAZ (heat-affected zone) or WM (weld metal).
Metals 12 00385 g009
Figure 10. Charpy V-notch impact toughness results for (a) base material, (b) heat-affected zone, and (c) weld metal of S500G1+M steel, based on [32,42].
Metals 12 00385 g010
Figure 11. Fracture toughness master curve results for (a) base material, (b) heat-affected zone, and (c) weld metal of S500G1+M steel; with T0 temperature marked by a star.
Metals 12 00385 g011
Figure 12. Fracture surfaces of fracture toughness test specimens obtained from welded joints with the front of fatigue pre-crack (a) after mainly ductile failure; and (b) after brittle failure; magnification of the fracture failure zones in the middle of the specimen with (c) clearly visible dimples (ductile failure); and (d) purely transgranular cleavage fracture.
Metals 12 00385 g012
Figure 13. Fracture surfaces of fatigue crack growth rate test specimens with crack located in the base material at (a) room temperature, and (b) −100 °C, and with crack located in the weld metal at (c) room temperature, and (d) −100 °C.
Metals 12 00385 g013
Figure 14. A fatigue crack growth rate (da/dN) versus stress intensity factor range (∆K) curve for a low-carbon steel above and below the FTT, based on Yarema et al. [56] and taken from Braun [32].
Metals 12 00385 g014
Table 1. Chemical composition of the S500G1+M steel (w%) [34].
SteelCSiMnPSNCuMoNiCrVNbTiAl-T
S500G1+M0.0560.2081.580.0120.0020.0040.2730.1750.5160.0560.0010.020.0010.033
Table 2. Mechanical properties of the S500G1+M steel [34].
SteelσYS (MPa)σUTS (MPa)ef (%)
S500G1+M59565123
Table 3. Position of the bolts welded to the specimens for measuring signals and connecting the power supply.
Distance Crack Plane to Bolt forDistance (mm)Symbol in FigureBolt(s)
Crack current measurement6Y02 + 3
Current input75Y11 + 4
Measurement for reference current 129YR2.15
Measurement for reference current 252YR2.26
Publisher’s Note: MDPI stays neutral with regard to jurisdictional claims in published maps and institutional affiliations.

