Article

Effect of Microstructure on High Cycle Fatigue Behavior of 211Z.X-T6 Aluminum Alloy

1
College of Materials and Metallurgy, Guizhou University, Guiyang 550025, China
2
Key Laboratory for Materials Structure and Strength of Guizhou Province, Guiyang 550025, China
3
Enterprise Technical Center, Guizhou Anda Aviation Forging Co., Ltd., Anshun 561000, China
4
State Key Laboratory of Solidification Processing, Northwestern Polytechnical University, Xi’an 710072, China
*
Author to whom correspondence should be addressed.
Metals 2022, 12(3), 387; https://doi.org/10.3390/met12030387
Submission received: 28 January 2022 / Revised: 18 February 2022 / Accepted: 22 February 2022 / Published: 23 February 2022
(This article belongs to the Special Issue Multi-Axial Fatigue and Fracture Behavior in Metals)

Abstract

:
In the present paper, the high cycle fatigue (HCF) of a novel 211Z.X aluminum alloy with high strength was studied under hot-rolling and as-cast states at room temperature. The effects of microstructure and distribution of precipitated phases and impurities on the mechanical properties, HCF performances, fatigue microcrack initiation, and propagation behavior of the 211Z.X alloy were studied by transmission electron microscopy (TEM), scanning electron microscopy (SEM) and energy dispersive spectrometry (EDS). The HCF S–N curves, P–S–N curves and Goodman fatigue diagrams of 211Z.X alloy consisting of two microstructures were drawn. The results suggested that the fine and dispersive distribution of the second phases improved the strength of the alloy. The formation of short-bar and spherical precipitates promoted coordinated deformation of the alloy. This promoted higher microcrack initiation resistance of 211Z.X alloy with a hot rolling state than in the cast state. As a result, the HCF properties of the hot-rolling alloy were better than those of the cast alloy. In sum, these results look promising for future reliable design of engineering structures and application of new aluminum alloys.

1. Introduction

Aluminum alloys are better in terms of lower density than iron and steel and have higher strength, better corrosion resistance, and are cheaper than titanium alloys. Therefore, aluminum alloys are widely used as lightweight materials for aircraft and vehicles [1,2,3,4]. According to statistics, about 60% of fuel consumption by vehicles is related to their own weight, and fuel consumption can be reduced by 6–8% when the weight is decreased by 10%. Consequently, aluminum alloys with high specific strength are widely used in various transportation vehicles [5]. Historically, the Aluminum Corporation of America first developed 2090 aluminum alloy in the 1970s and 1980s to replace high strength steel of aircraft framework, while Pechiney of France developed 2091 aluminum alloy with high damage tolerance to use in aircraft fuselage skin plate. At the end of the 20th century, Audi launched a car with an all-aluminum body frame, which reduced energy consumption and promoted the development of lightweight automobiles [6,7,8,9,10].
The second series of aluminum alloys consists of conventional aluminum alloys with high strength based on Al-Cu-Mg. These alloys are still the main materials used in aircraft, cars, and spacecraft [11,12]. The main alloy elements Cu, Mg, Mn, and Zn have certain strengthening effects on aluminum alloys, but their main role is to improve the heat and corrosion resistances of the material [8,13,14]. Furthermore, small numbers of auxiliary elements, such as Ni, Ti, Cr, Zr, and B, exist in alloys, which can further improve their properties [13,14,15,16,17,18]. However, the Fe and Si elements are harmful impurity elements for aluminum alloys with high strength and should be avoided as much as possible [7,19]. In the past decade, many scholars have studied various properties of different series of aluminum alloys. For example, Wang et al. [20] explored the microstructure and mechanical properties of powder metallurgy 2024 aluminum alloy during cold rolling. Pouraliakbar et al. [21] investigated the combined effect of heat treatment and rolling on pre-strain and severe plastic deformation on aluminum alloy sheets. The data showed that aluminum alloys with high strength and toughness can be strengthened by heat treatments, and the strengths of the materials can be changed by quenching and aging processes [22,23,24]. Aluminum alloys often have high heat resistance and strength combined with easy processing, but their corrosion resistance is generally lower than pure aluminum and rust-proof aluminum [13,14]. Numerous types of aluminum alloys have so far been developed, and the tensile strength and plasticity of most novel aluminum alloys are relatively excellent. For instance, 211Z.X aluminum alloy used in the background of the Five-hundred-meter Aperture Spherical radio Telescope (FAST) possesses a tensile strength reaching 500 MPa, while elongation maintains more than 10% and hardness is 165 HBW. Moreover, the tensile strength of such alloys remains around 135 MPa at a temperature of 350 °C [25].
In this paper, 211Z.X aluminum alloys with hot-rolling (R211Z.X) and as-cast states (C211Z.X) were used to investigate the high cycle fatigue (HCF) performance, fatigue deformation, and fatigue fracture mechanism under two different microstructures. The stress-cycle number (S–N) profiles, the probability-stress-cycle number (P–S–N) curves, and Goodman fatigue diagrams of R211Z.X and C211Z.X aluminum alloys were all drawn. The microstructure and distribution characteristics of the precipitates, inclusions, and other features of the two different microstructures of 211Z.X aluminum alloy before and after HCF revealed a strong effect of precipitates, inclusions, and different microstructures on HCF properties, microstructural cyclic deformation features, fatigue microcrack initiation, and propagation behaviors of 211Z.X aluminum alloys.

2. Materials and Methods

The 211Z.X aluminum alloy with high strength and toughness (Guizhou Hualco Aluminum Material Engineering Technology Research Co., Ltd., Guiyang, China) was used as raw material in the experiments. Specimens with two different microstructures were obtained after smelting, casting, and homogenization treatment. One was mechanically cut into 300 mm × 35 mm × 22 mm compact, and the other was shaped into a round bar with a diameter of 12.5 mm by hot rolling after homogenized treatment. The nominal chemical composition of 211Z.X aluminum alloy is listed in Table 1.
Smooth-bar tensile and fatigue specimens were machined after T6 heat treatment (solution and completely artificial aging treatments). All fatigue specimens were cut along the axial direction, and fatigue specimens of 211Z.X aluminum alloy showed slight differences between the hot rolling (R211Z.X) and casting state (C211Z.X) due to the difference in original material size. As shown in Figure 1a,b, the fatigue specimens based on the two different states were smooth hourglass specimens with slightly different specific sizes, but the minimum diameter in the middle section was the same, all dimensions in Figure 1a,b are mm. To reduce the influence of surface machining defects on fatigue performance testing, the fatigue specimens were polished with W6 metallographic sandpaper (~2 μm) followed by a nylon cloth (~0.5 μm) before fatigue testing.
According to the Chinese standard GB/T 228.1-2010 (“the tensile test method for metal materials at room temperature”), cylindrical tensile specimens (diameter 5 mm, gauge length 25 mm) were tested on an Instron 8501 system (Instron, Norwood, MA, USA) at a loading rate of 0.5 mm/min. To maintain the accuracy of experimental results, three repeated tensile tests were performed. The fatigue properties of R211Z.X alloy were tested at room temperature on an Instron 8501 system under total strain-controlled mode, stress ratio R of −1, frequency of 20 Hz, and triangular wave-form. Based on the engineering requirement of the FAST project, the setting fatigue life limit (Nc) was set to 2.5 × 10⁶ cycles. The fatigue performance of C211Z. X alloy was tested on a QBG-100 high-frequency fatigue testing machine (Changchun Qianbang Testing Equipment Co., Ltd., Changchun, China) at a stress ratio R of −1 and frequency of 120 Hz for Nc of 2.5 × 10⁶ cycles. All fatigue testing processes were carried out conforming to the Chinese standard GB/T 3075-2008 (“the axial force control method of metal material fatigue test”). The stress levels were selected according to the tensile strength of the alloy under two stations.
The fatigue performance of 211Z.X aluminum alloy was tested by the up-down fatigue test method. The S–N curve was drawn using origin 9.0 software (OriginLab Corporation, Northampton, MA, USA) combined with the up-down test data. The conditional fatigue limit of the alloy was determined by a lifting formula calculation and S–N curve. Subsequently, the group test method was employed to draw the P–S–N curves of the aluminum alloys. The probability conditional fatigue limits corresponding to P = 99.9% and P = 50.0% were then determined according to the P–S–N curves.
The metallographic specimens were corroded by hydrofluoric acid solution (HF:H2O = 1:1), and the microstructure was observed by optical microscopy (OM). The size parameters of the grains and the second phase were calculated by IPP image analysis software. The defect structures of each alloy before and after fatigue fracture were analyzed by transmission electron microscopy (TEM, FEI Tecnai G2 F20, FEI Company, Hillsboro, OR, USA). The fatigue fracture morphology was observed by scanning electron microscopy (SEM, KYKY-2008B, KYKY Technology Co., Ltd., Beijing, China), and compounds of fatigue fracture were determined by energy dispersive spectroscopy (EDS, Apollo energy spectrometer, Apollo Energy, Denver, CO, USA).

3. Results and Discussion

3.1. Microstructure and Mechanical Properties

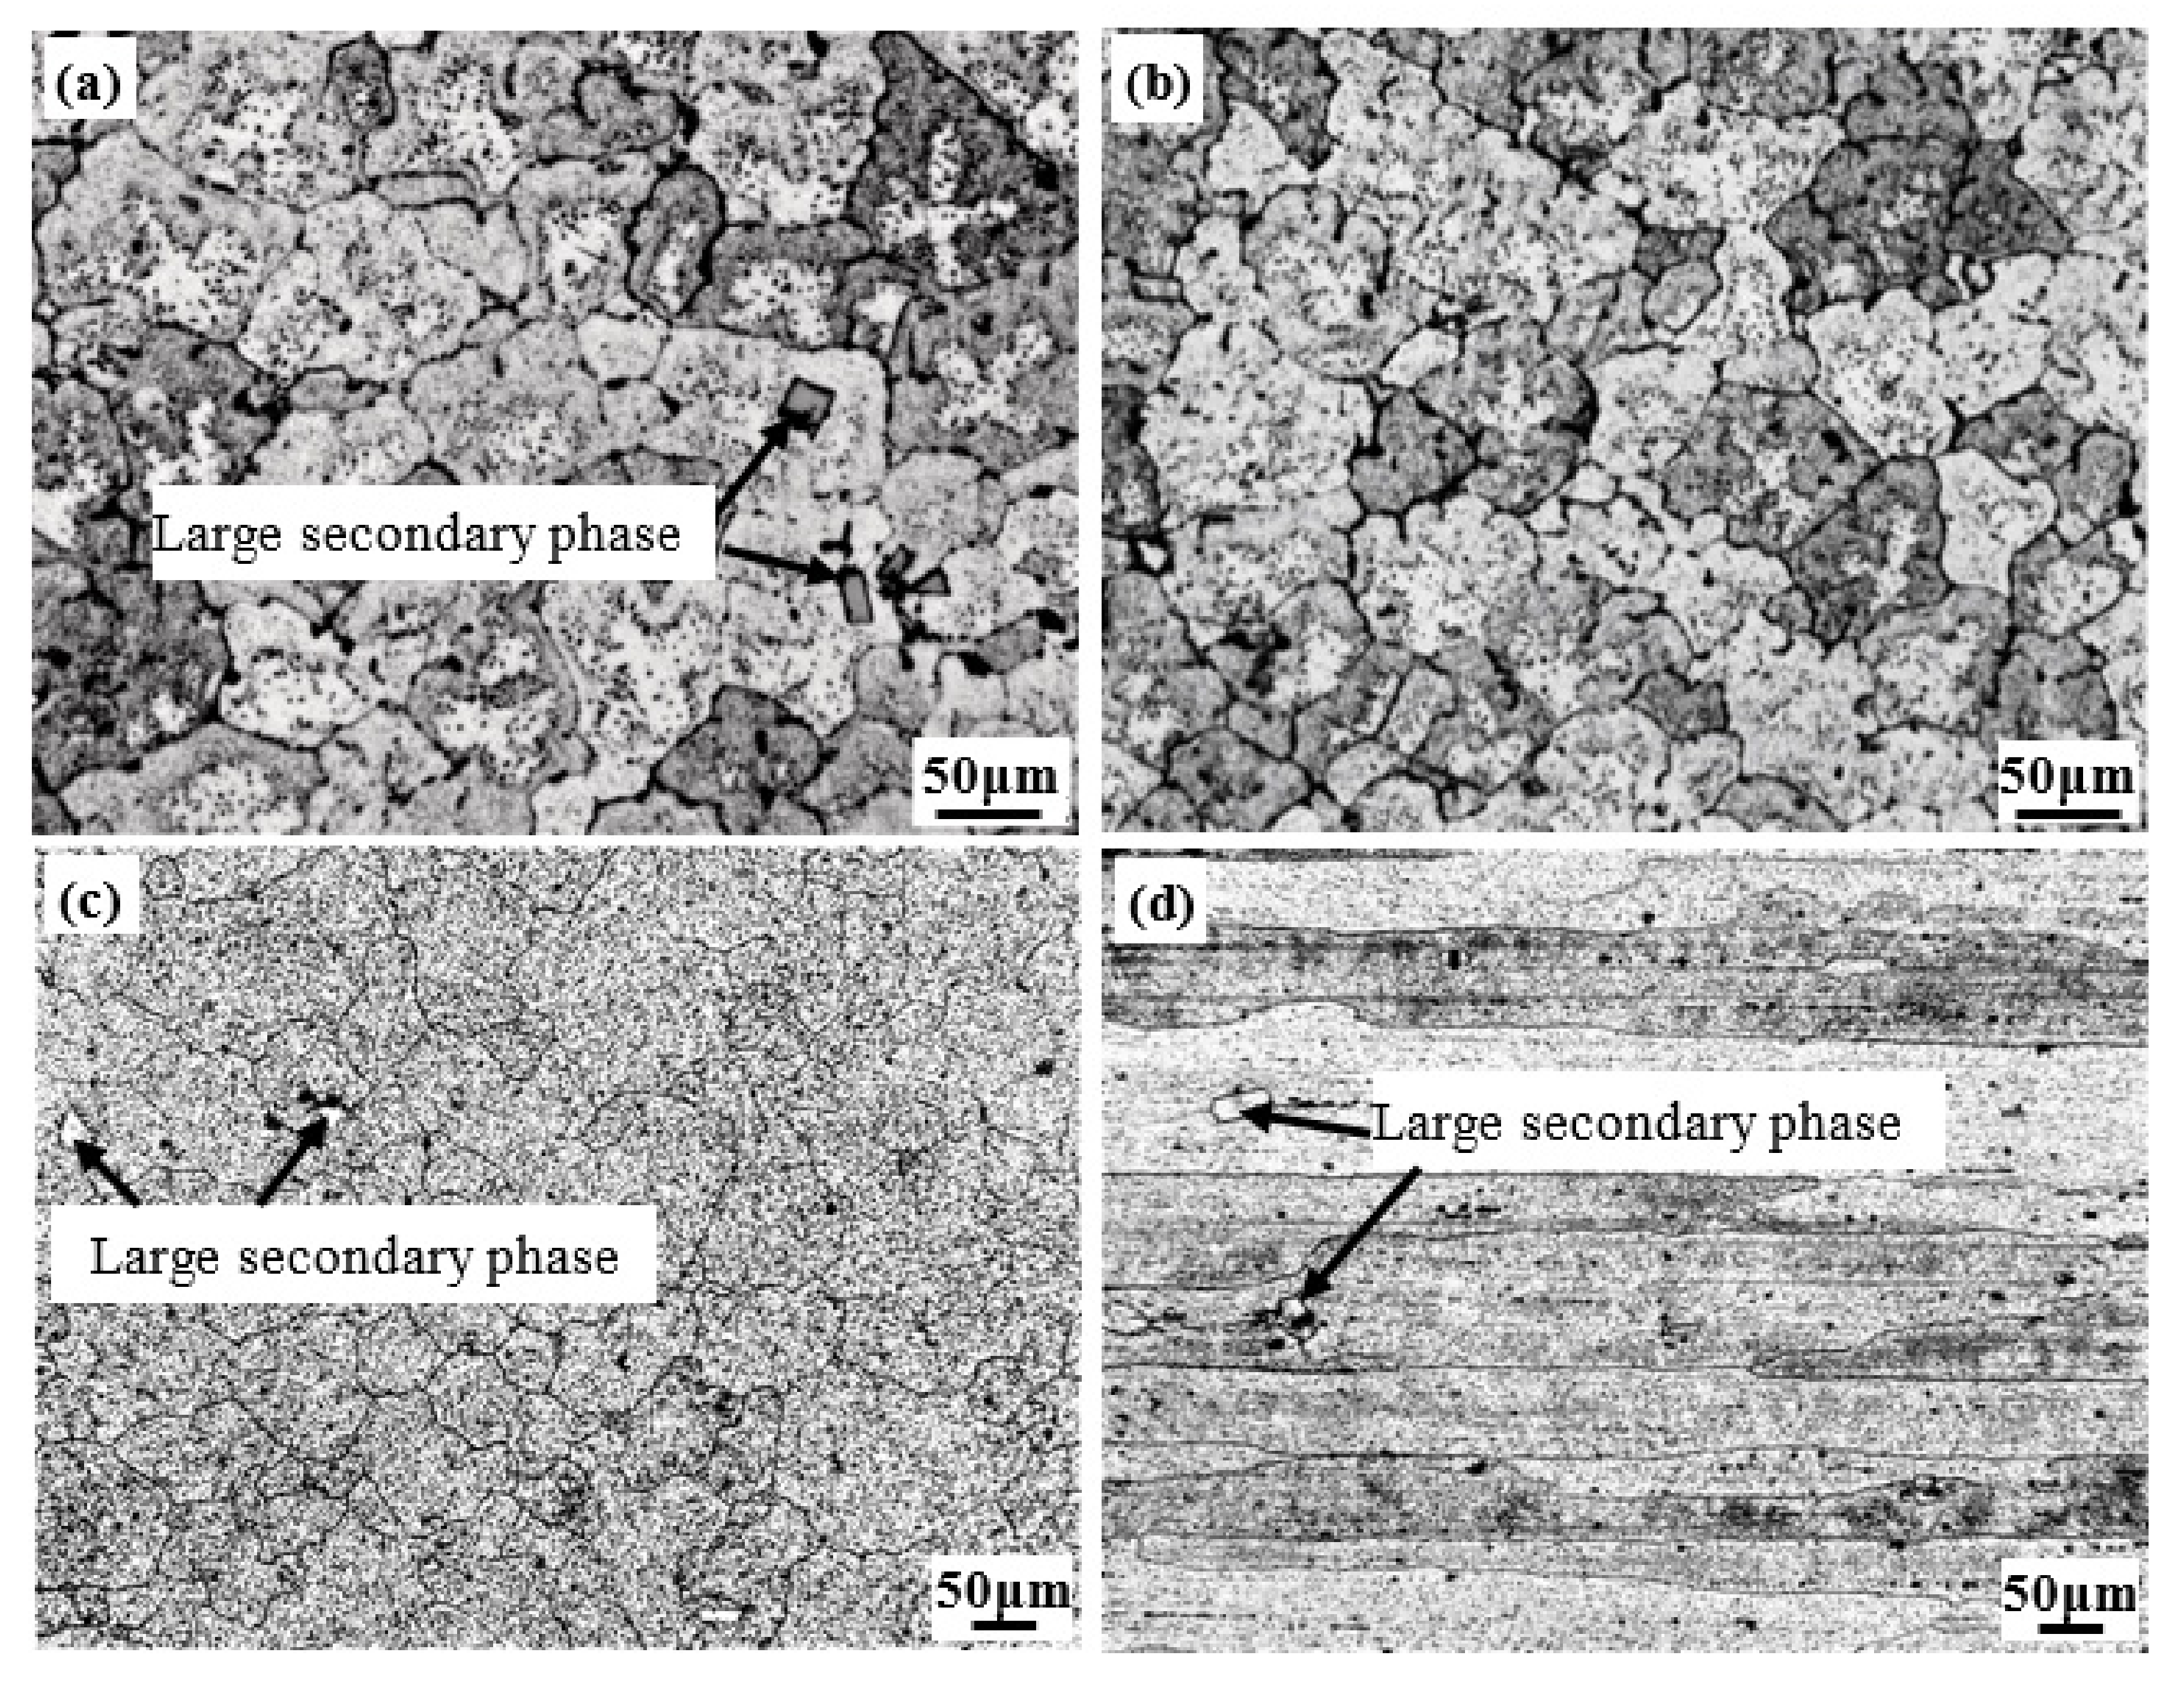
3.1.1. Matrix Microstructure
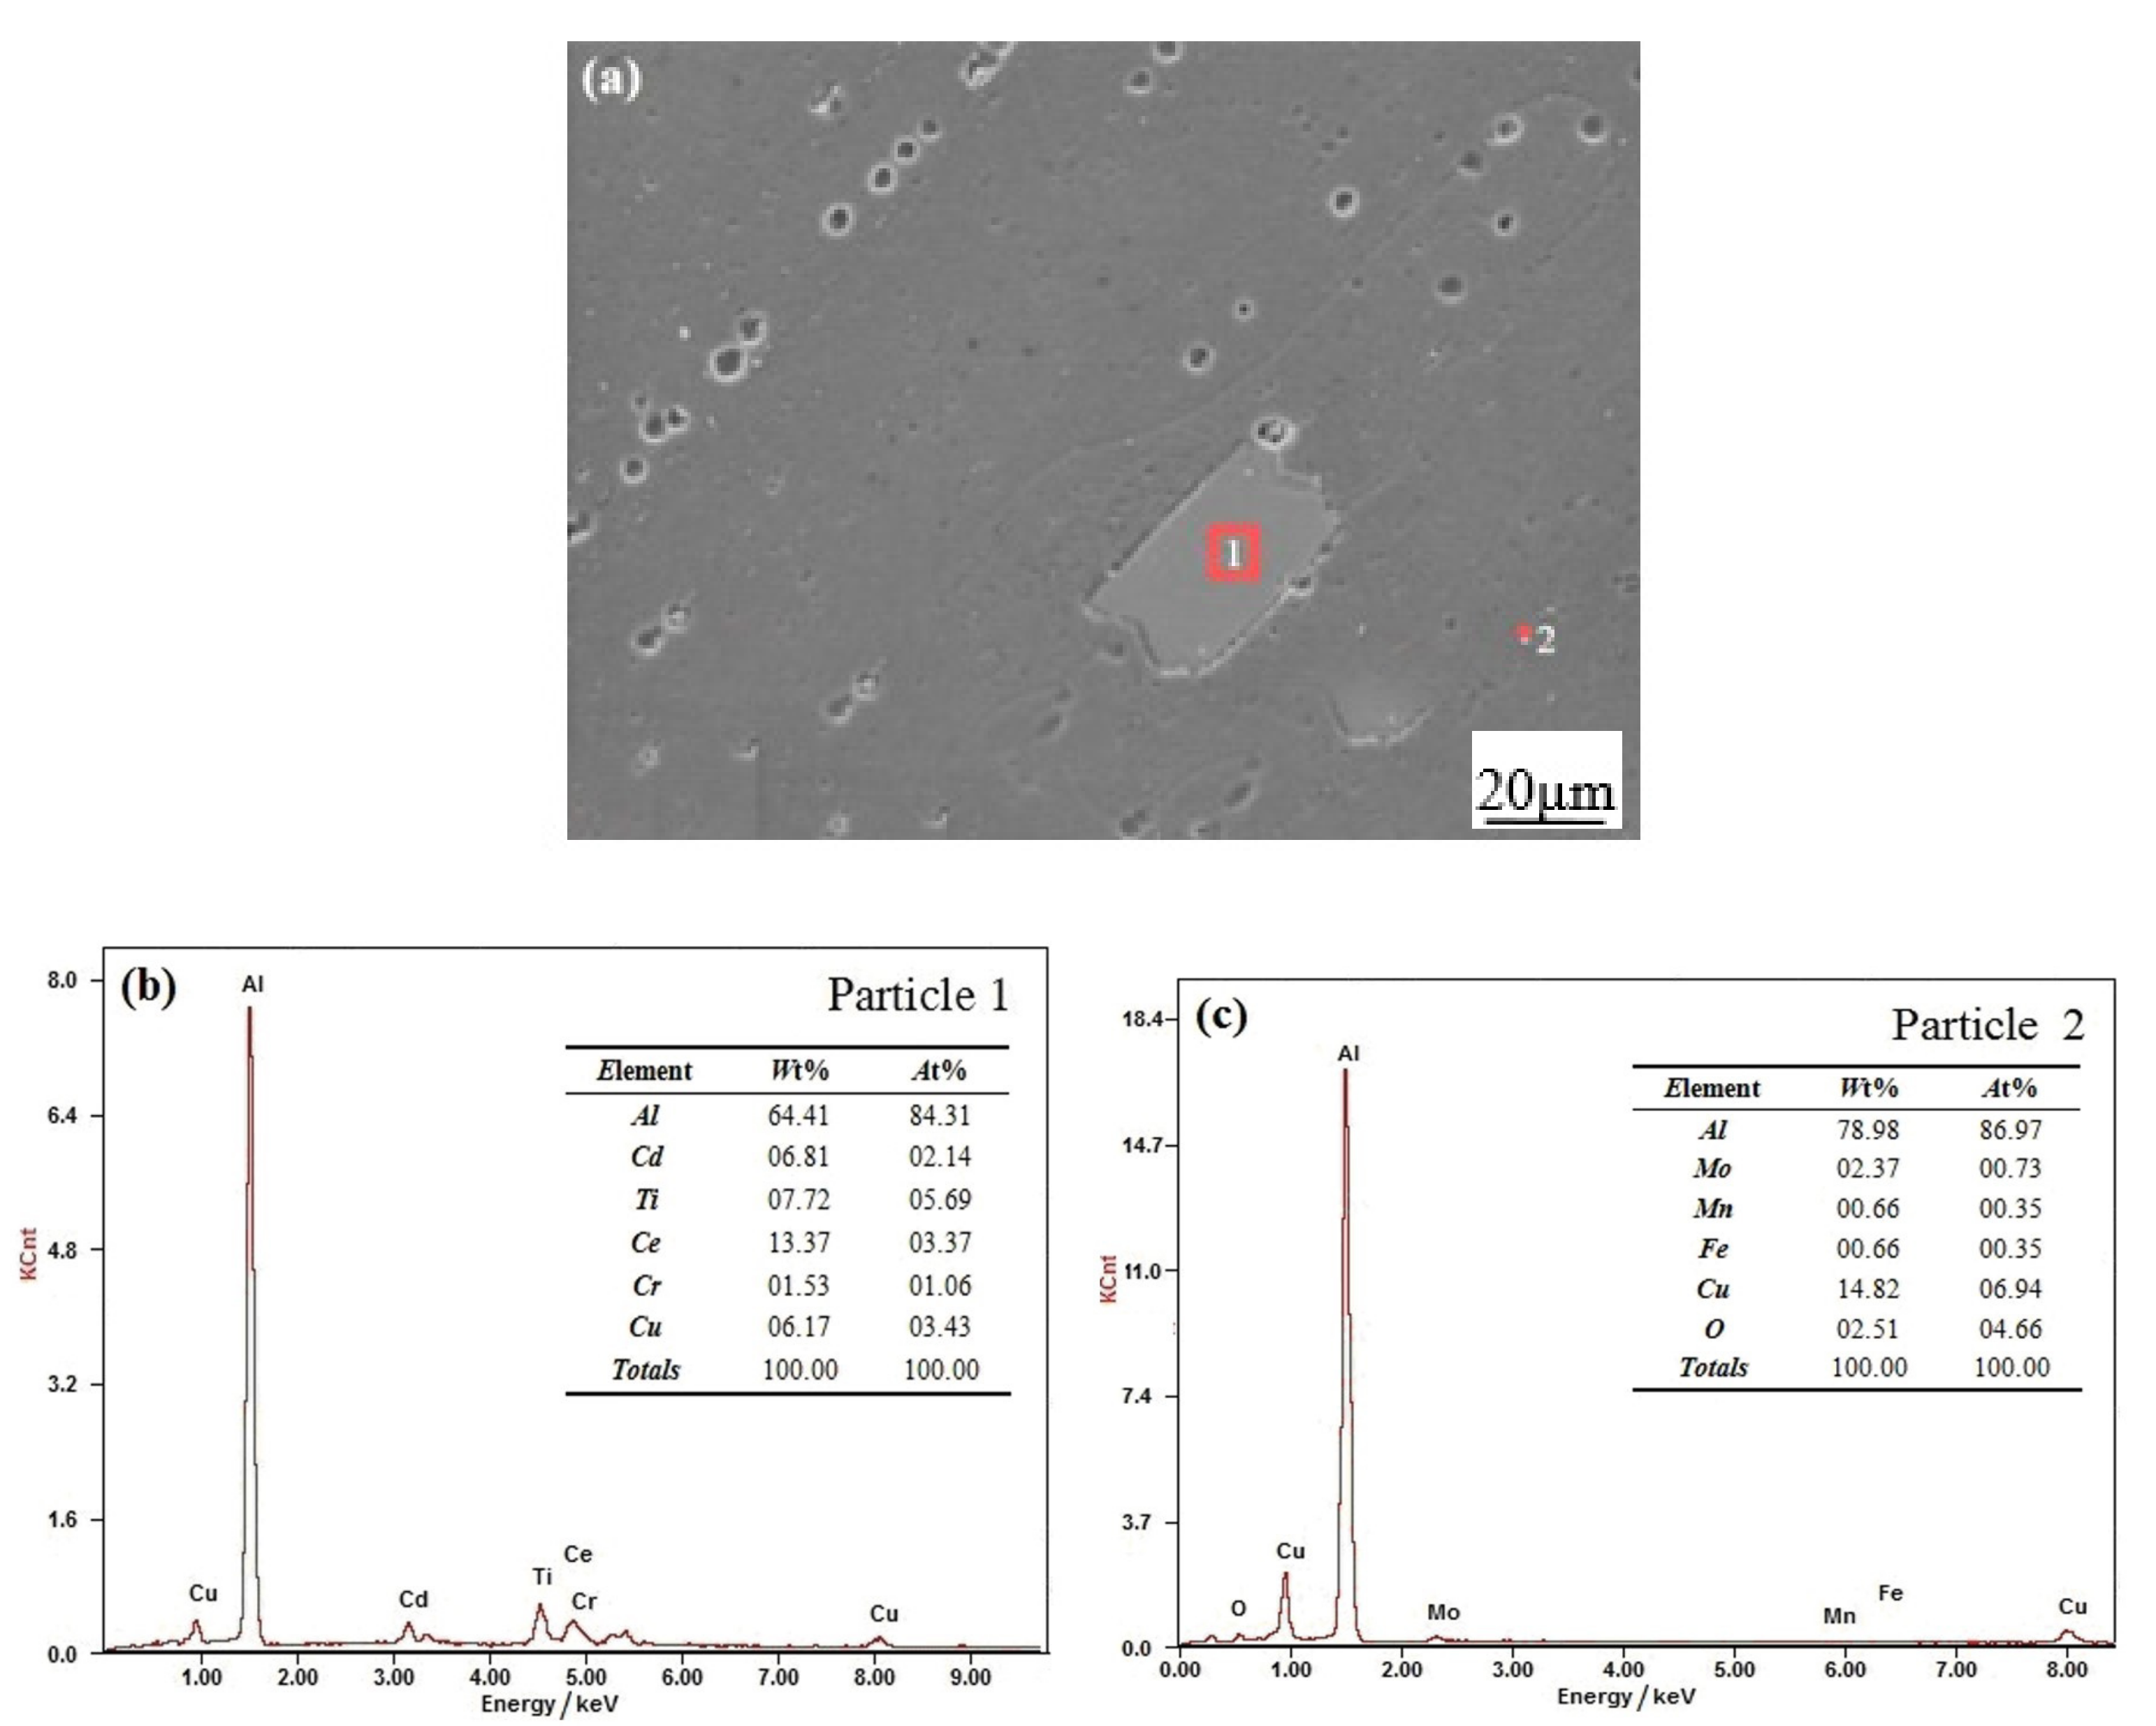
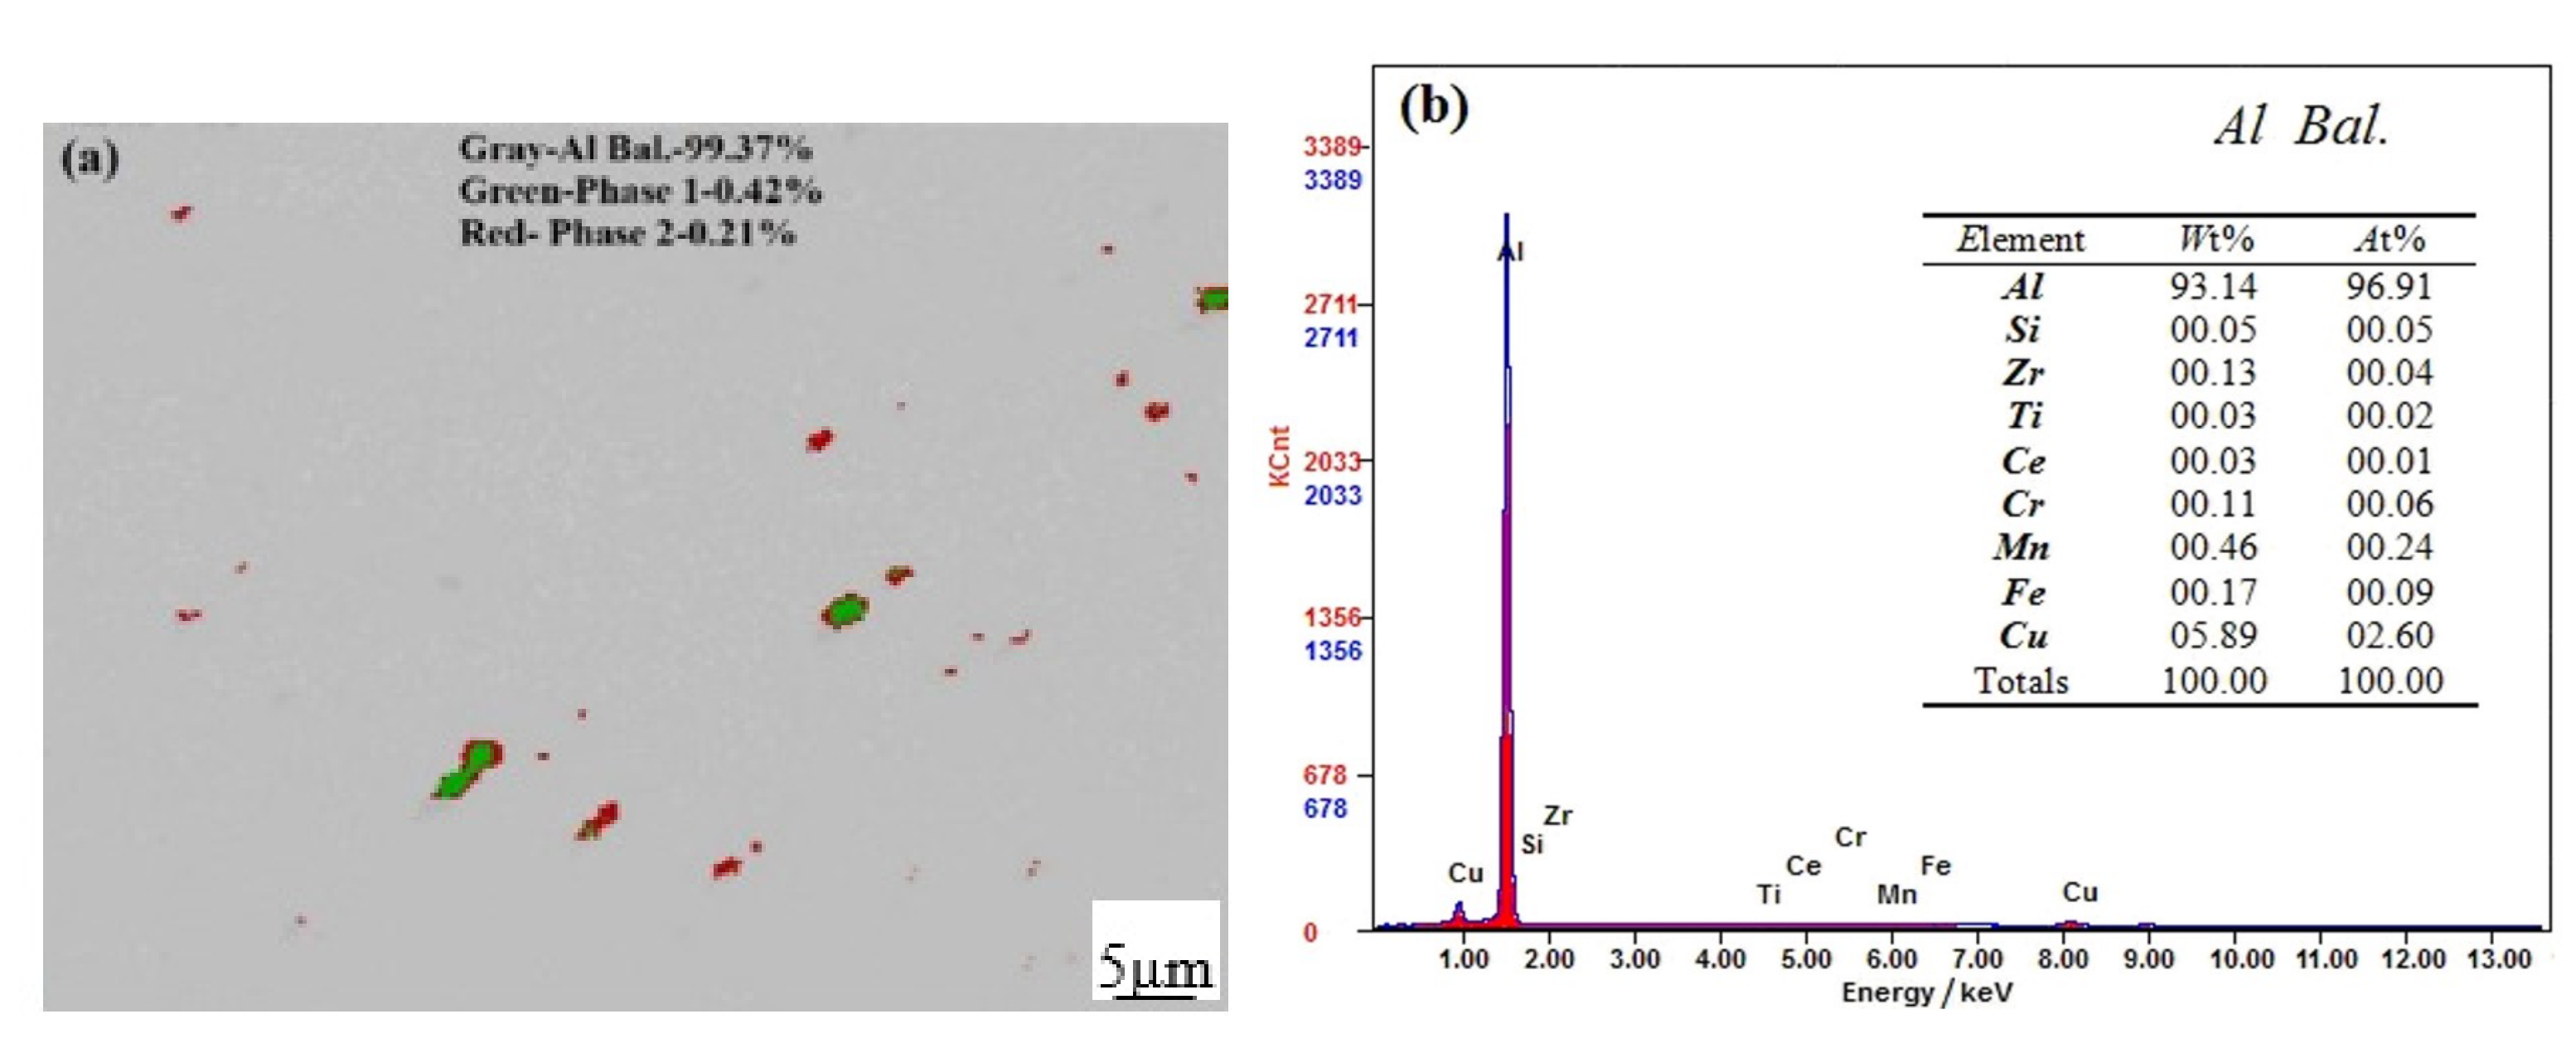
The OM and TEM images of 211Z.X aluminum alloy in the as-cast and hot-rolling states are shown in Figure 2 and Figure 3, respectively. The transverse and longitudinal microstructures of 211Z.X aluminum alloy in an as-cast state consisted of equiaxed grains with uneven size due to casting micro-holes that resulted in poor compactness of the alloy (Figure 2a,b). After hot-rolling deformation, the transverse microstructure of R211Z.X alloy became uniform and equiaxed crystal formed (Figure 2c). This can be attributed to incomplete recrystallization, where the axial microstructure presented typical machining-streamline morphology features (Figure 2d). The average casting grain size was estimated to about 42 μm, but transverse grain size increased to approximately 72 μm after hot rolling. Furthermore, small numbers of coarse compounds (Figure 2) and fine precipitates (Figure 3) existed in the alloy in both as-cast and hot-rolling microstructures. The coarse compounds size reached about 10–20 μm (Figure 2a,c,d), and the size of the as-cast compounds was slightly higher than that of the hot-rolling. In the TEM analysis in Figure 3, two types of fine precipitated phases can be distinguished. One consisted of a bulky phase with a size of about 1 μm (Figure 3a,c), considered as T-phase enriched with a Cd element. The other dealt with the rod-like nanoscale (Figure 3b,d), considered as θ′ and θ′ phases [11,26,27].

3.1.2. Second Phase

Characteristic parameters, such as type, size, and distribution of the second phase would significantly affect the performance of aluminum alloys, especially the fatigue damage performance [25]. To further investigate the type of the second phase in the organization of 211Z.X aluminum alloy, the precipitates were further analyzed by EDS. The data revealed precipitates in the alloy mainly made of intermetallic compounds, which can be divided into three types according to size. Figure 4 and Figure 5 display the image and EDS results of these three second-phase types.
The first type consisted of large intermetallic compounds, such as particle 1 in Figure 4 with the size of about 50 μm. These compounds were enriched with Cd, Ti, Ce, Cr, and other elements. The Cd content was estimated to be 6.53–6.98%, Ti content was 7.42–7.82%, Ce content reached up to 13.08–13.53%, and Cr content attained up to 1.36–1.53%. The larger atomic size of Ce, Cd, and Cr inhibited their flow during the solidification process. Hence, high melting point compounds in the homogenization process were not easy to melt, thereby forming a large block with many sharp angles. Under applied load, bulky intermetallic compounds and substrate interfaces easily piled up dislocations, leading to stress concentration that initiated microcracks. The latter was harmful to the fatigue properties of the alloy.
The second type consisted of compounds with a size of about 5–20 μm, such as particle 1 in Figure 5. These compounds mainly contained Mo, Ti, Mn, Cu, and impurity Fe. In Figure 5, phase 1 contained 0.8% Fe and 14.7% Cu. The Cu content of these particles ranged from 12.49% to 14.7%, and particle size was also larger, thereby harmful to the fatigue performance of the alloy.
The third type dealt with compounds with sizes less than 5 μm or θ′ and θ′′ phases. Examples include particle 2 containing more than 14% Cu, content higher than that of the second type in Figure 4 and Figure 5. Particle 2 contained 14.82% Cu, 2.37% Mo, and 2.51% O (Figure 4). Phase 2 also contained 26.37% Cu and 1.45% impurity Fe (Figure 5). These particles had a small size and mostly uniform distribution, beneficial to the fatigue performance of the alloy.

3.1.3. Mechanical Properties of 211Z.X Alloy before Fatigue

The mechanical properties of 211Z.X alloy in two states before fatigue are presented in Table 2. The strength and hardness of R211Z.X alloy were higher than that of C211Z.X alloy. Especially, the yield strength of the former was about 40 MPa higher than that of the latter. This was due to the alloy after deformation strengthening followed by a heat treatment that densified the structure and reduced the number of voids with smaller sizes. Additionally, plenty of casting defects existed in C211Z.X alloys, such as voids, segregation, poor density, and weak binding force between grains. These features led to lower strength and hardness of C211Z.X alloy than that of R211Z.X alloy. In general, the change in strength and plasticity presented an opposite tendency [19,28,29,30]. After hot-rolling deformation, the strength and reduction of the area of the alloy increased, while plasticity decreased.

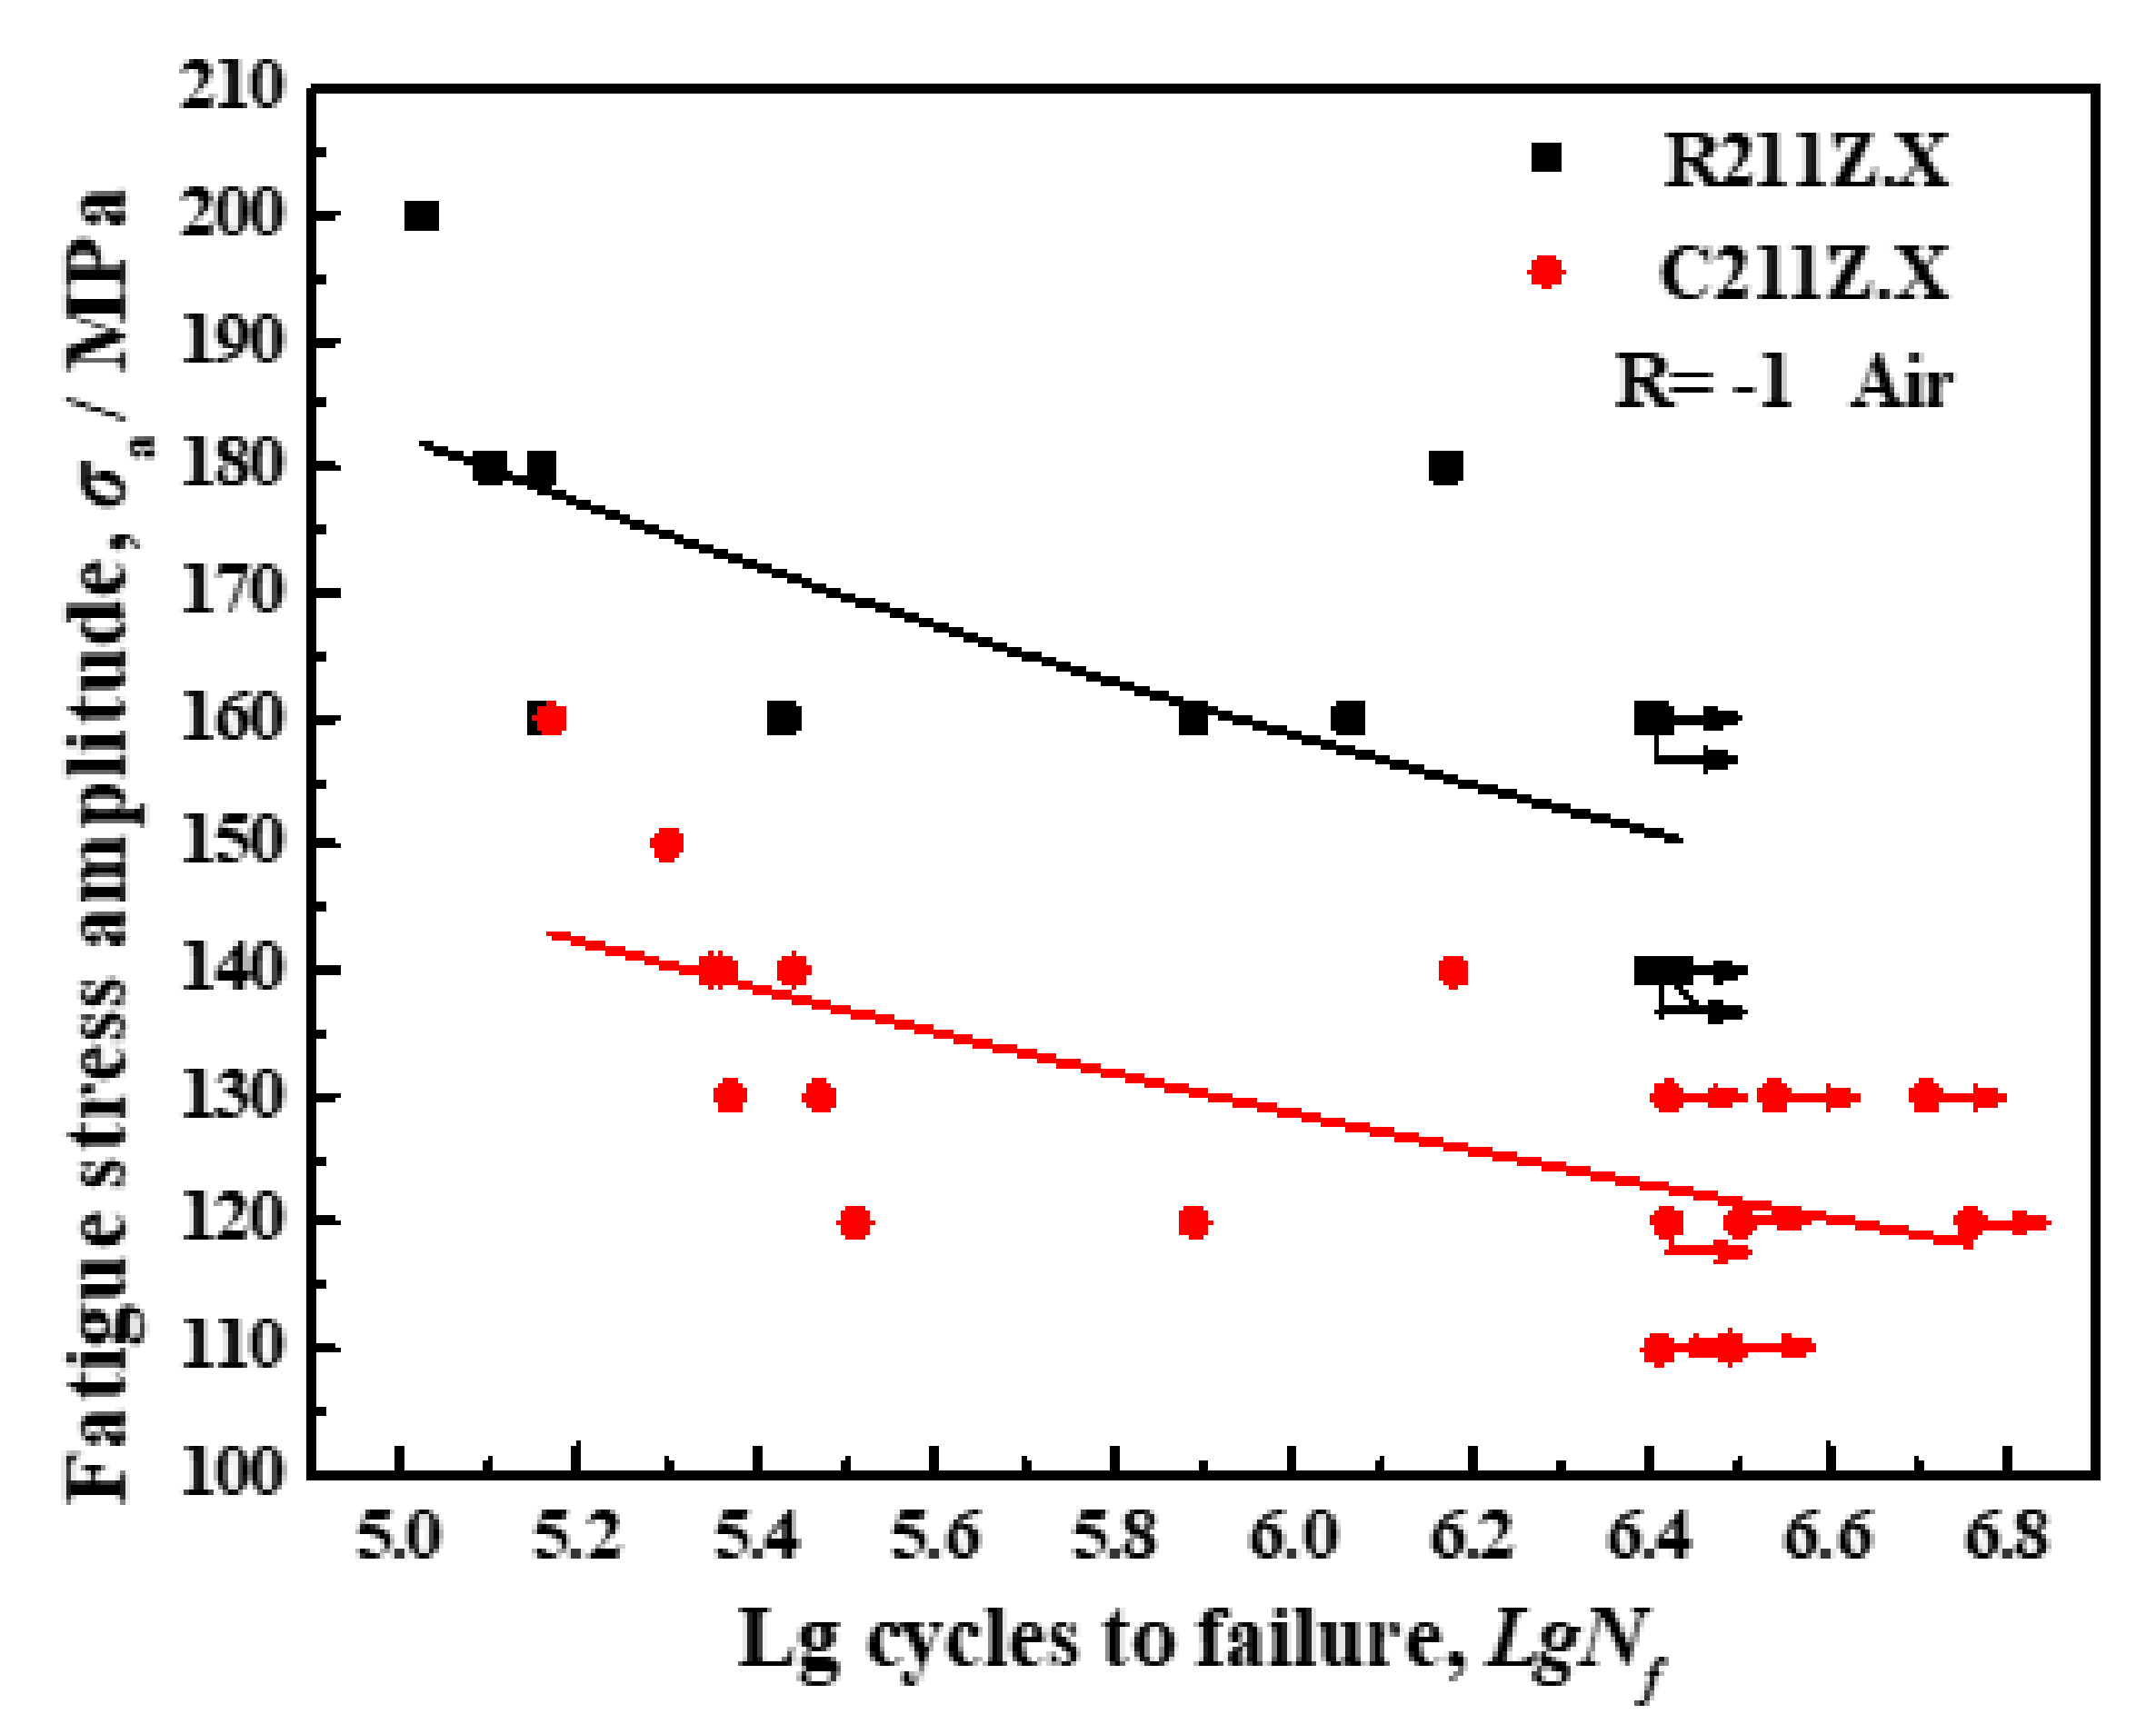
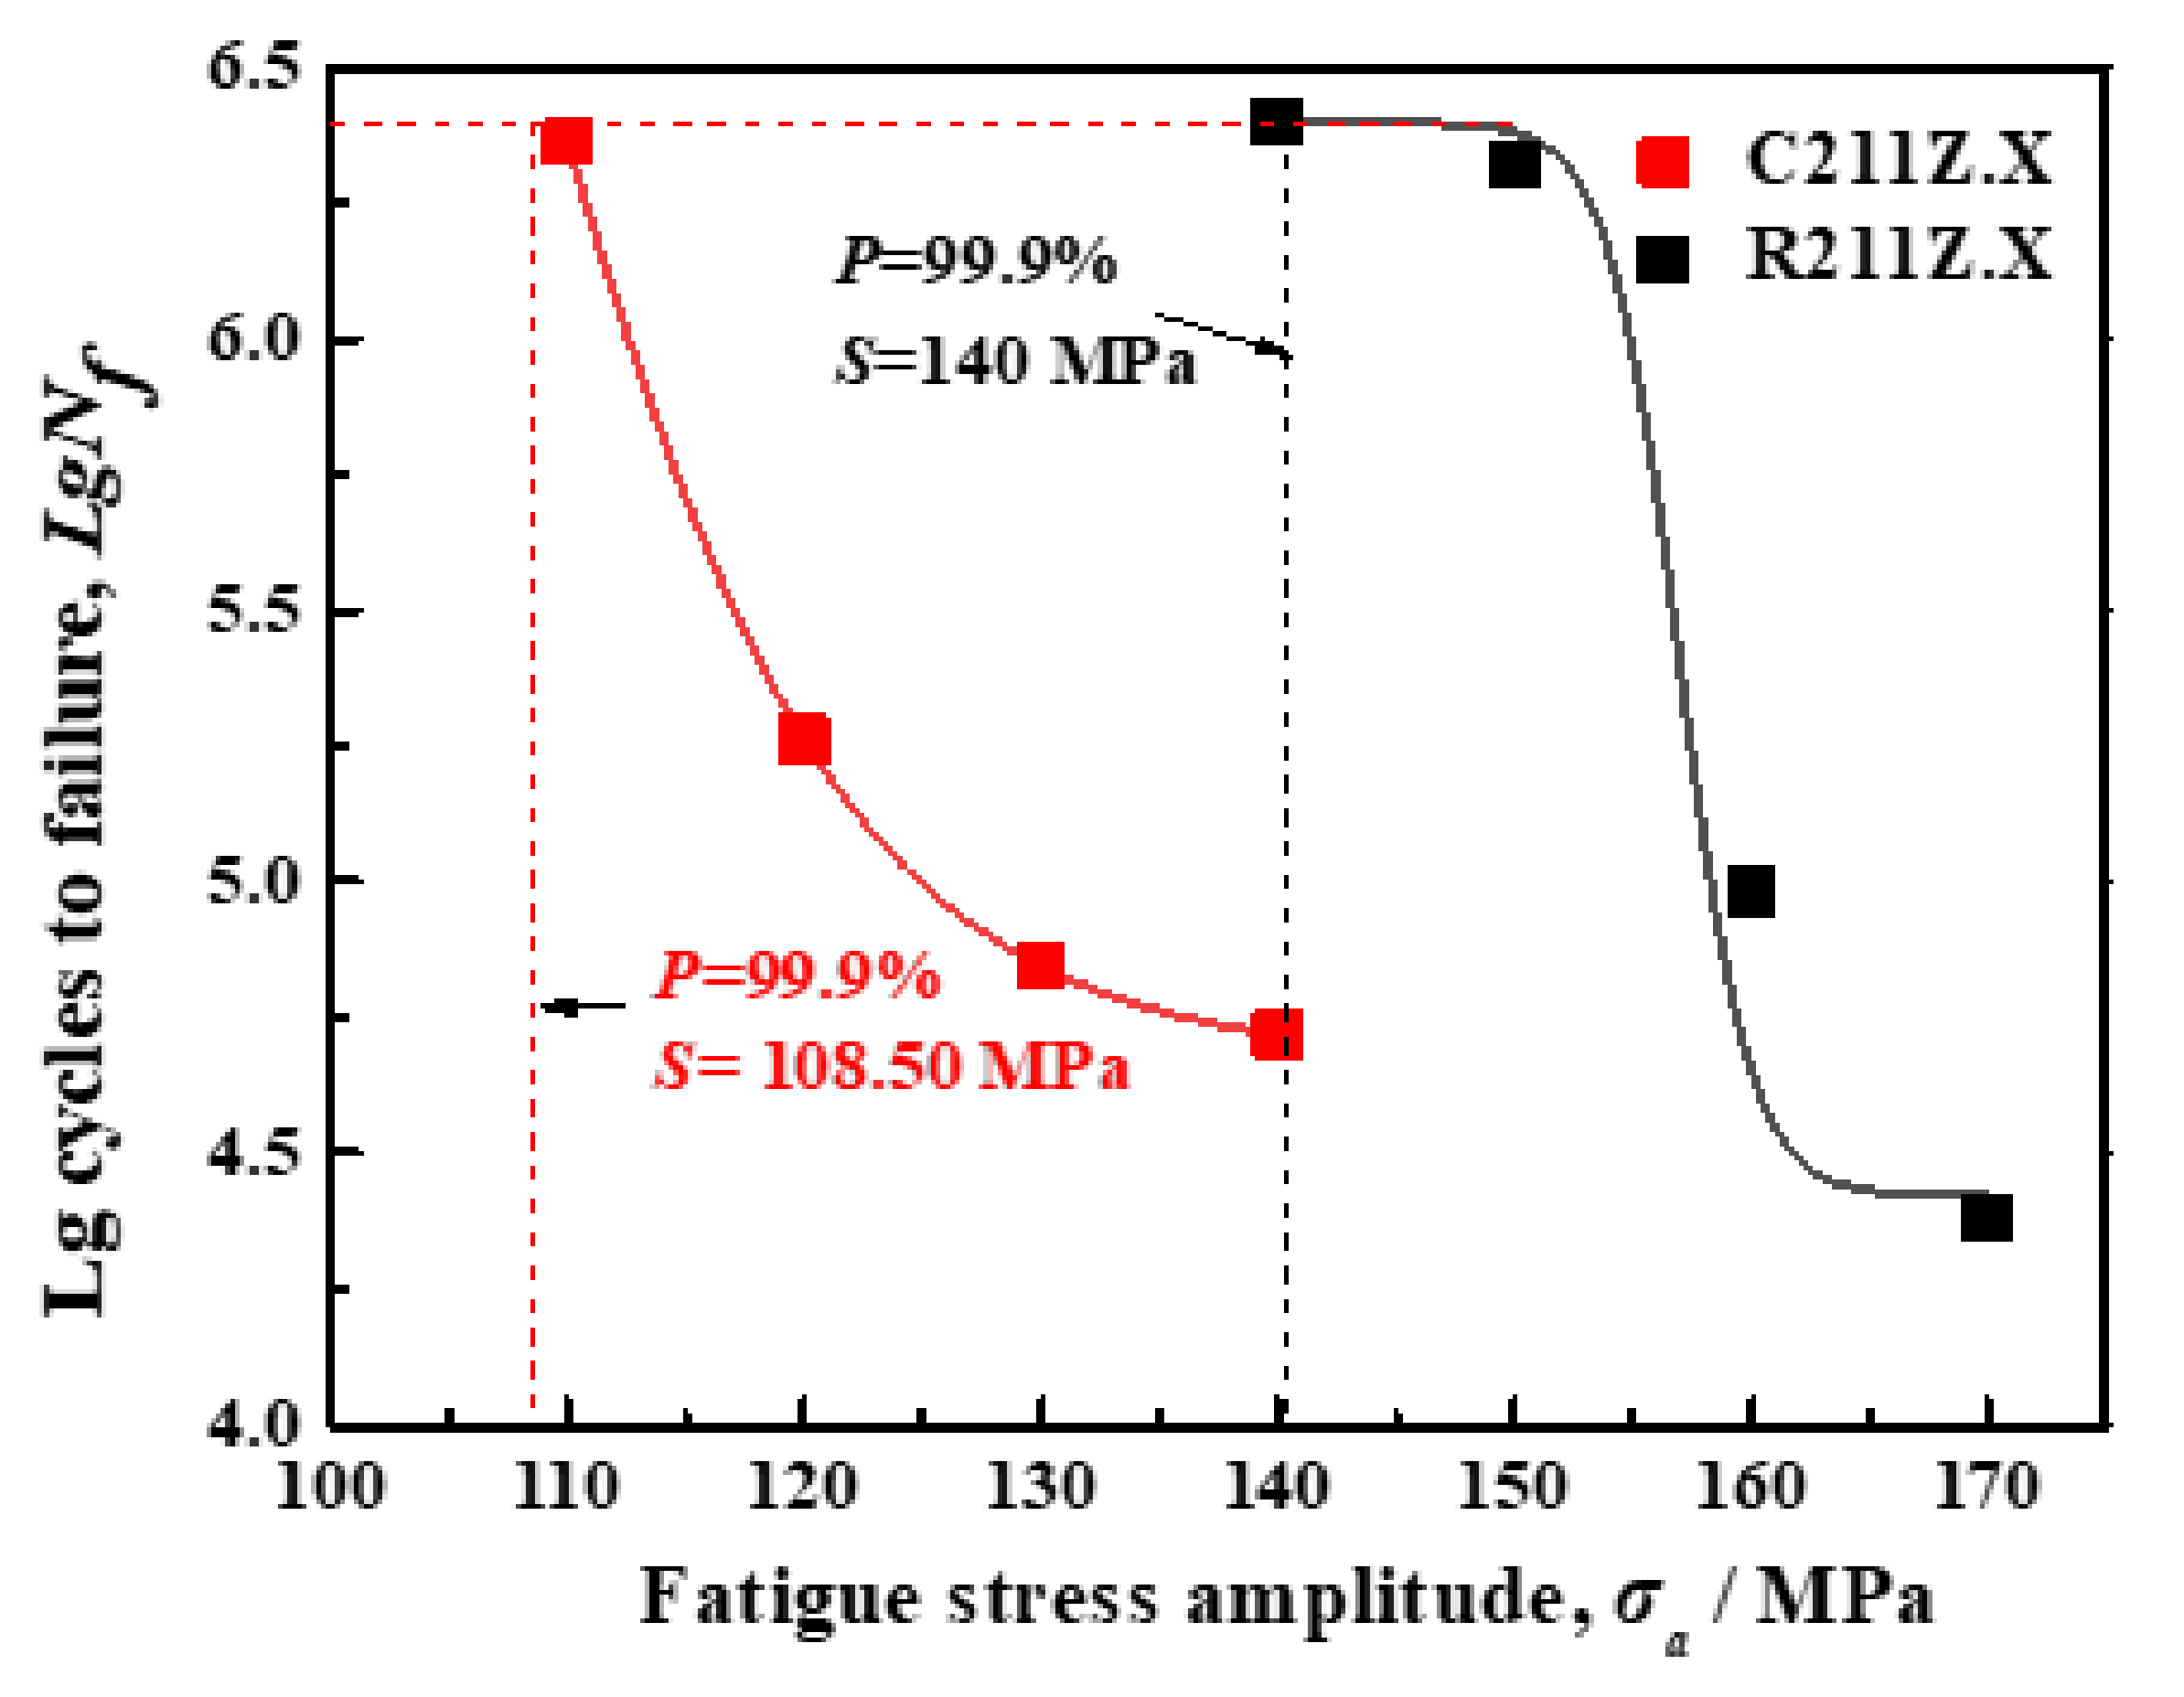
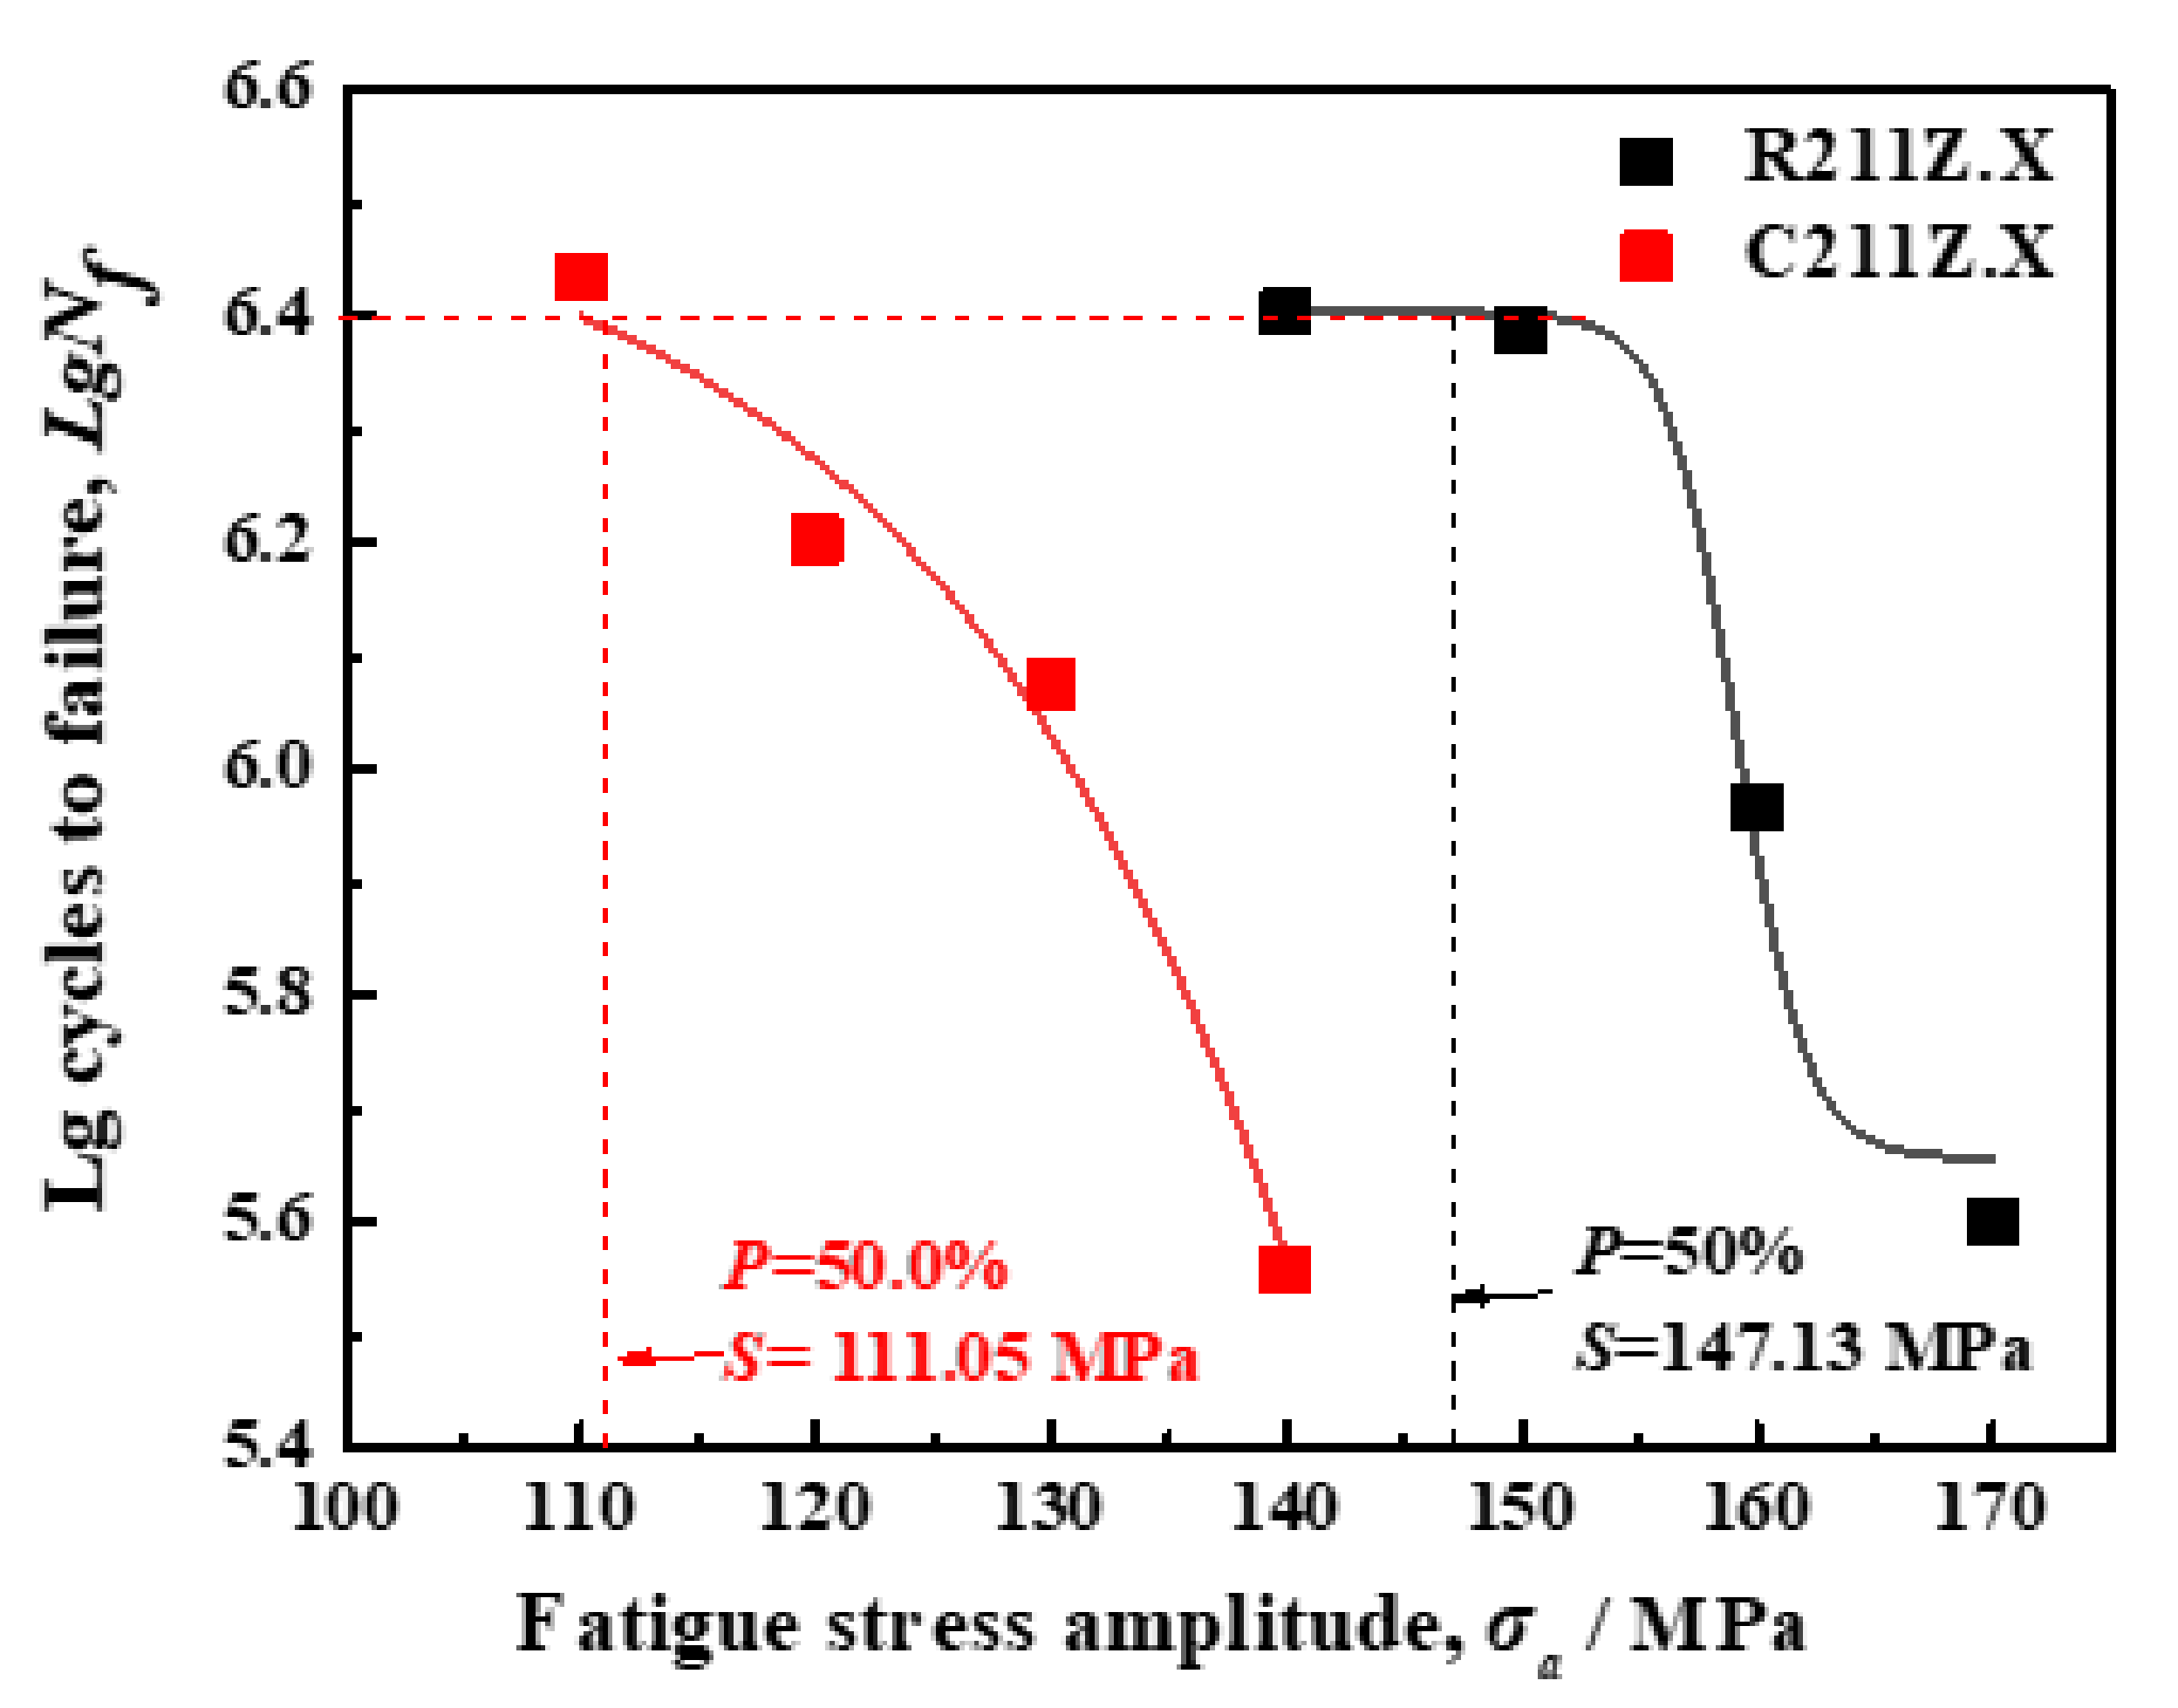
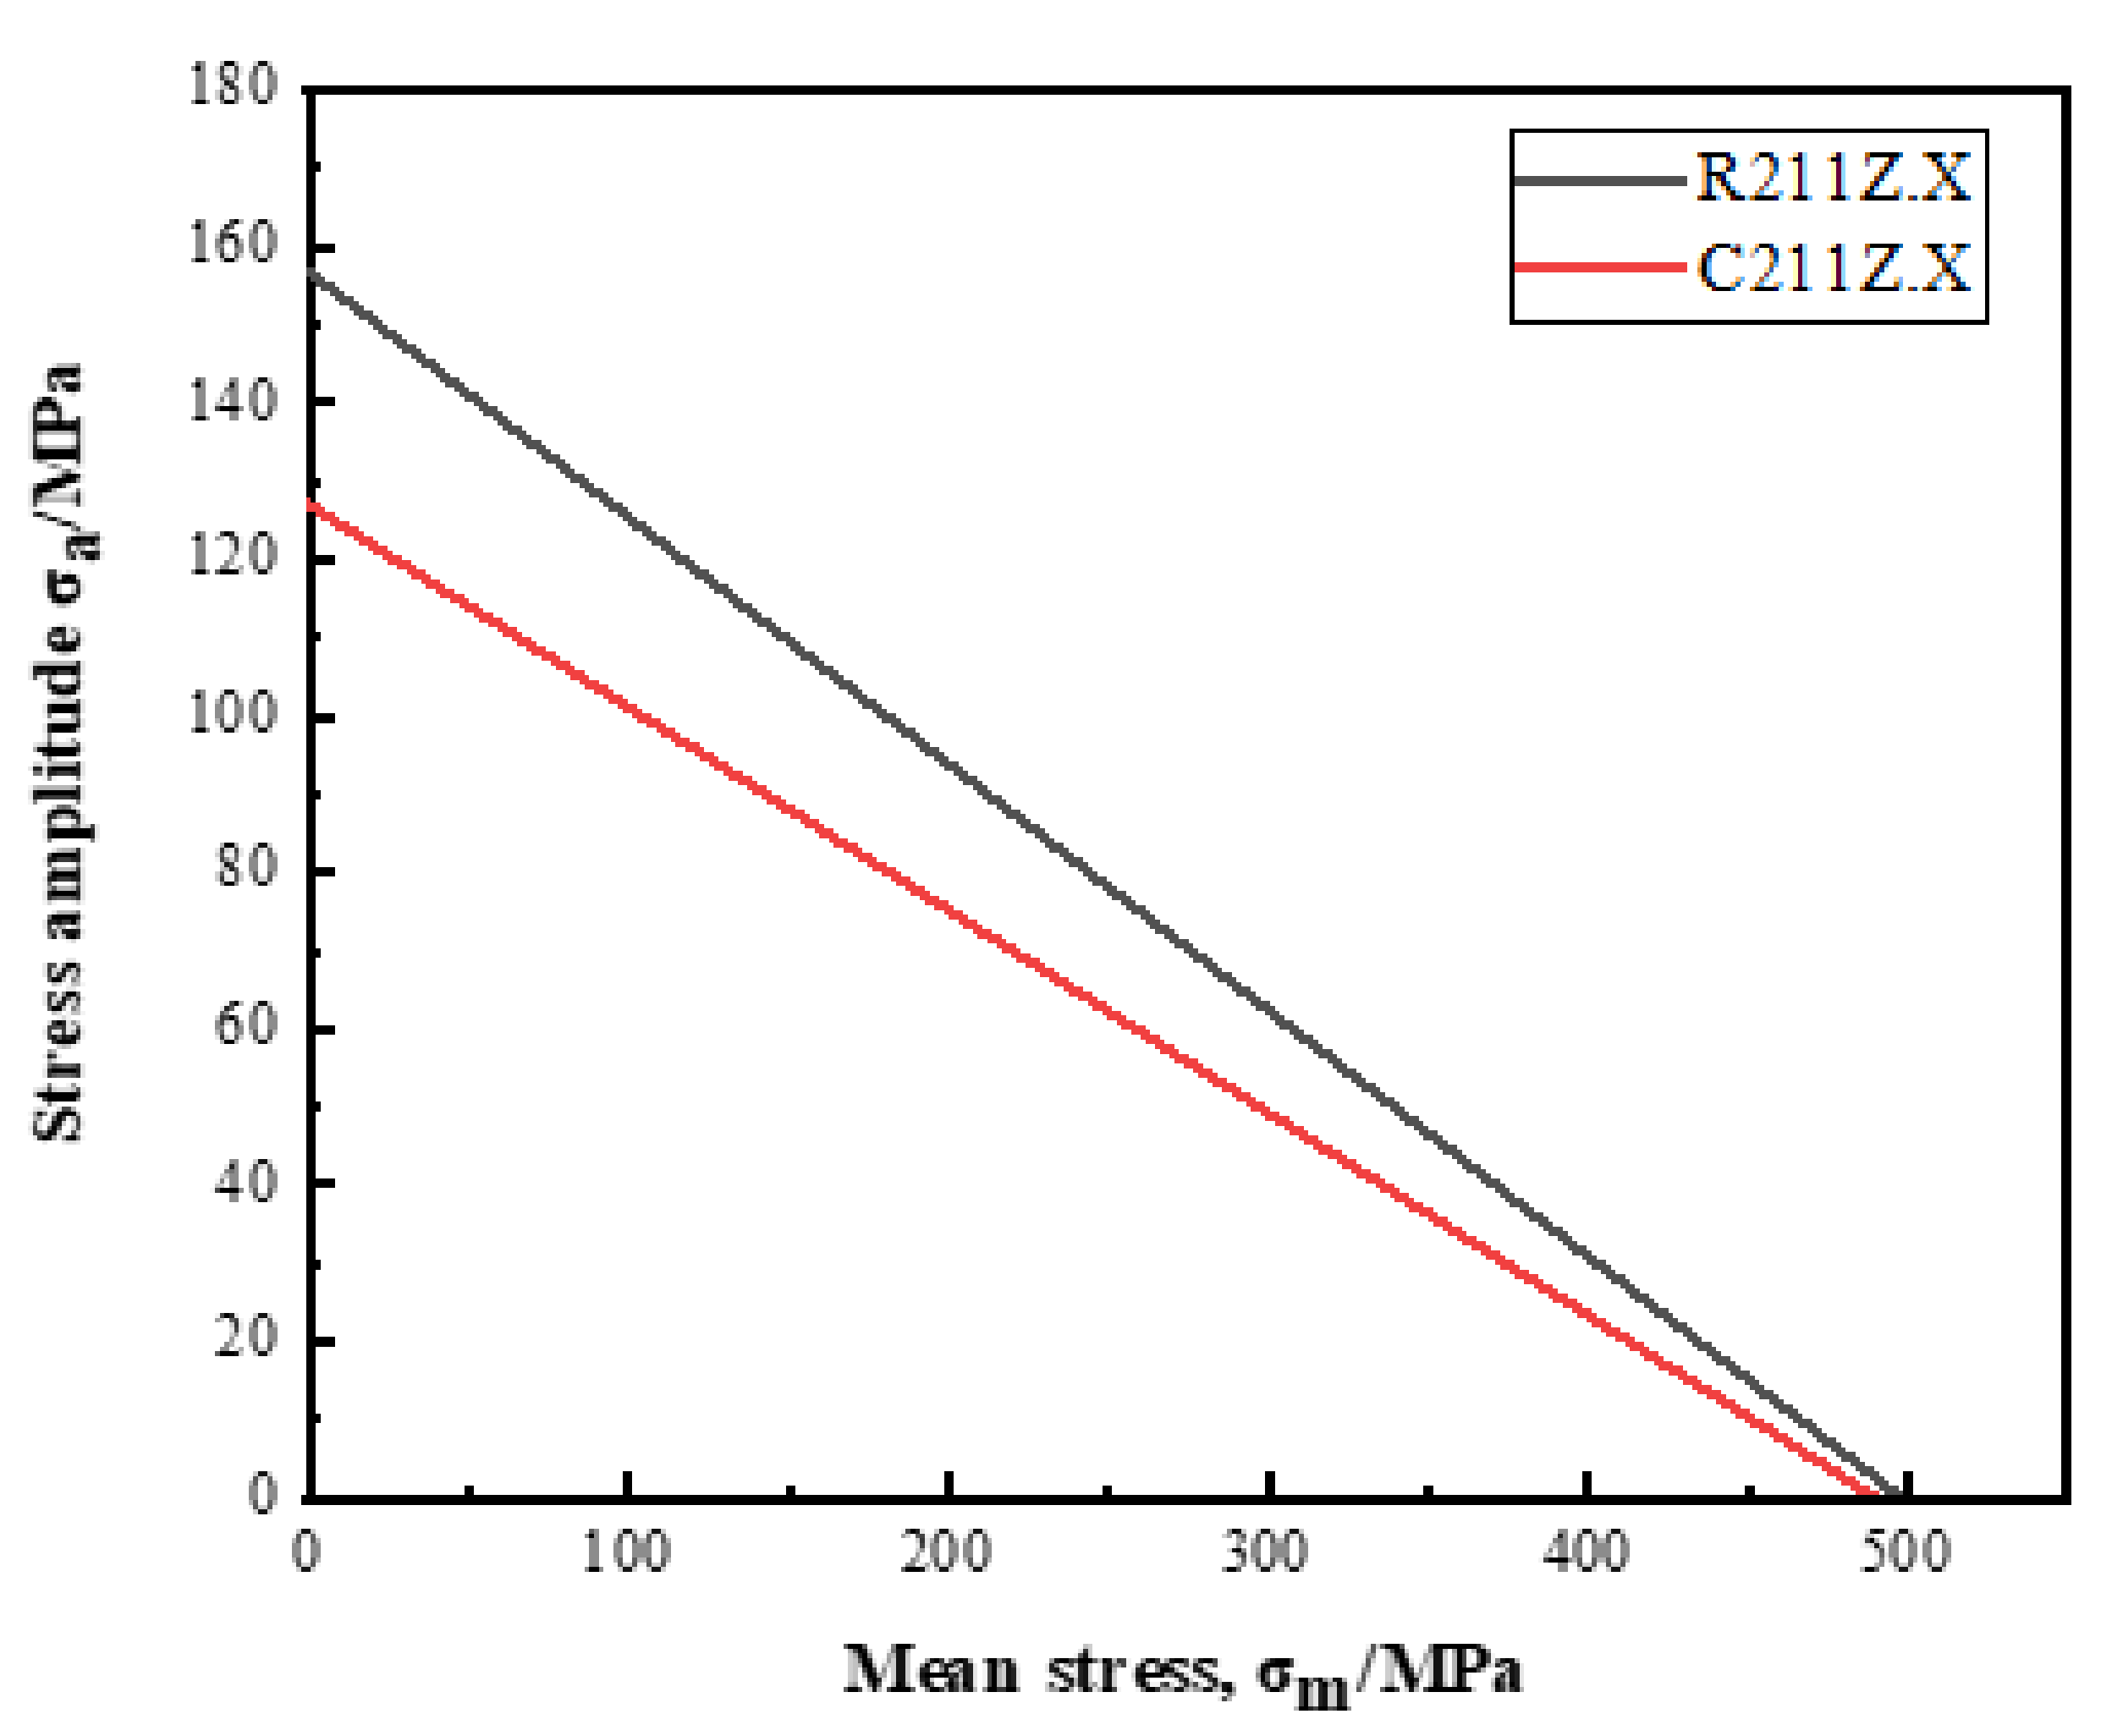
3.2. High Cycle Fatigue Performance of 211Z.X Alloy

The fatigue S–N curves of 211Z.X alloy with two different microstructures are shown in Figure 6. As can be seen, the fatigue limit of R211Z.X alloy was higher than that of C211Z.X alloy since the size and distribution of the second phase along with microvoids played important roles in the HCF processing of 211Z.X alloy. However, the second phase of R211Z.X alloy possessed more uniform distribution and a smaller scale, with good deformation coordination during the fatigue process. This, in turn, reduced the initiation of microcracks and hindered the propagation of cracks. Moreover, the fatigue limit of the alloy can be calculated by the up-down method shown by Equation (1) of the fatigue test [31]:
σ R ( N ) = 1 m i = 1 n V i σ i
where m is the total number of effective tests, including both broken and unbroken tests. N represents the test stress level grade, σi is the grade i stress level, and Vi refers to the number of tests at grade i stress level.
The fatigue limits of R211Z.X and C211Z.X alloys at specified fatigue cycles NC = 2.5 × 10⁶ calculated according to Equation (1) were σR(Nc) = σ1(2.5×10⁶) = 156.92 MPa for R211Z.X alloy and σR(Nc) = σ1(2.5×10⁶) = 127.06 MPa for C211Z.X alloy.
The P–S–N curves of 211Z.X alloy in as-cast and hot-rolling states are displayed in Figure 7 and Figure 8, respectively. The fatigue limits of two alloys at the confidence of 99.9% and failure probability of 0.1% were estimated to 108.50 MPa (C211Z.X) and 140 MPa (R211Z.X), respectively (Figure 7). By comparison, the fatigue limits of the two alloys at the confidence of 50% and failure probability of 50% were recorded as 110.05 MPa (C211Z.X) and 147.13 MPa (R211Z.X), respectively (Figure 8). As shown in Figure 7 and Figure 8, the fatigue limit of R211Z.X alloy was higher than that of C211Z.X alloy at both high confidence (99.9%) and median confidence (50%). Large numbers of casting defects existed in C211Z.X alloy. The P–S–N curve depended on the initial defect size, and defects reduced the fatigue strength [32]. The results showed that the P–S–N curve with a high survival rate and high confidence was more beneficial to engineering design and life estimation [33].
The relationships between tensile and fatigue properties of C211Z.X and R211Z.X alloys are shown in Table 3. The comparative HCF characteristics of C211Z.X and R211Z.X alloys may be related to the similar tendencies of tensile strength of the two different microstructures in Table 3. Obviously, the increase in tensile strength raised the HCF strength. As precipitated phase size decreased, the yield and ultimate tensile strengths of the alloys significantly increased while generally enhancing the fatigue strengths by retarding the crack initiation [27]. The improvement in fatigue crack initiation resistance resulted from finely dispersed precipitations as potential obstacles to impede dislocation movement, thereby decelerating microcrack formation [27].
The continuous life graph was often used in engineering applications, especially the Goodman model, which can be expressed according to Equation (2) [34]:
σ a = σ 1 × 1 σ m σ b
where σa represents the stress amplitude, σ−1 is the fatigue limit (R = –1) of 211Z.X alloy, σm is the mean stress, and σb is the ultimate tensile strength. Therefore, the Goodman equations of R211Z.X alloy and C211Z.X alloys were estimated to σ a = 156.92 × 1 σ m 498 and σ a = 127.06 × 1 σ m 490 , respectively. The Goodman fatigue diagrams of C211Z.X and R211Z.X aluminum alloys are shown in Figure 9.
As presented in Figure 9, R211Z.X alloy demonstrated slightly higher HCF strength than C211Z.X alloy at R, ranging from –1 to 1, consistent with the above S–N and P–S–N curves of the two alloys (Figure 6, Figure 7 and Figure 8). Seemingly, the alloy had obvious axial texture and uniformly distributed second phase particles after deformation, conducive to improving the fatigue strength of R211Z.X alloy (Figure 2 and Figure 9). The effect of microstructure on HCF damage behavior of 211Z.X aluminum alloy was further studied in subsequent sections.

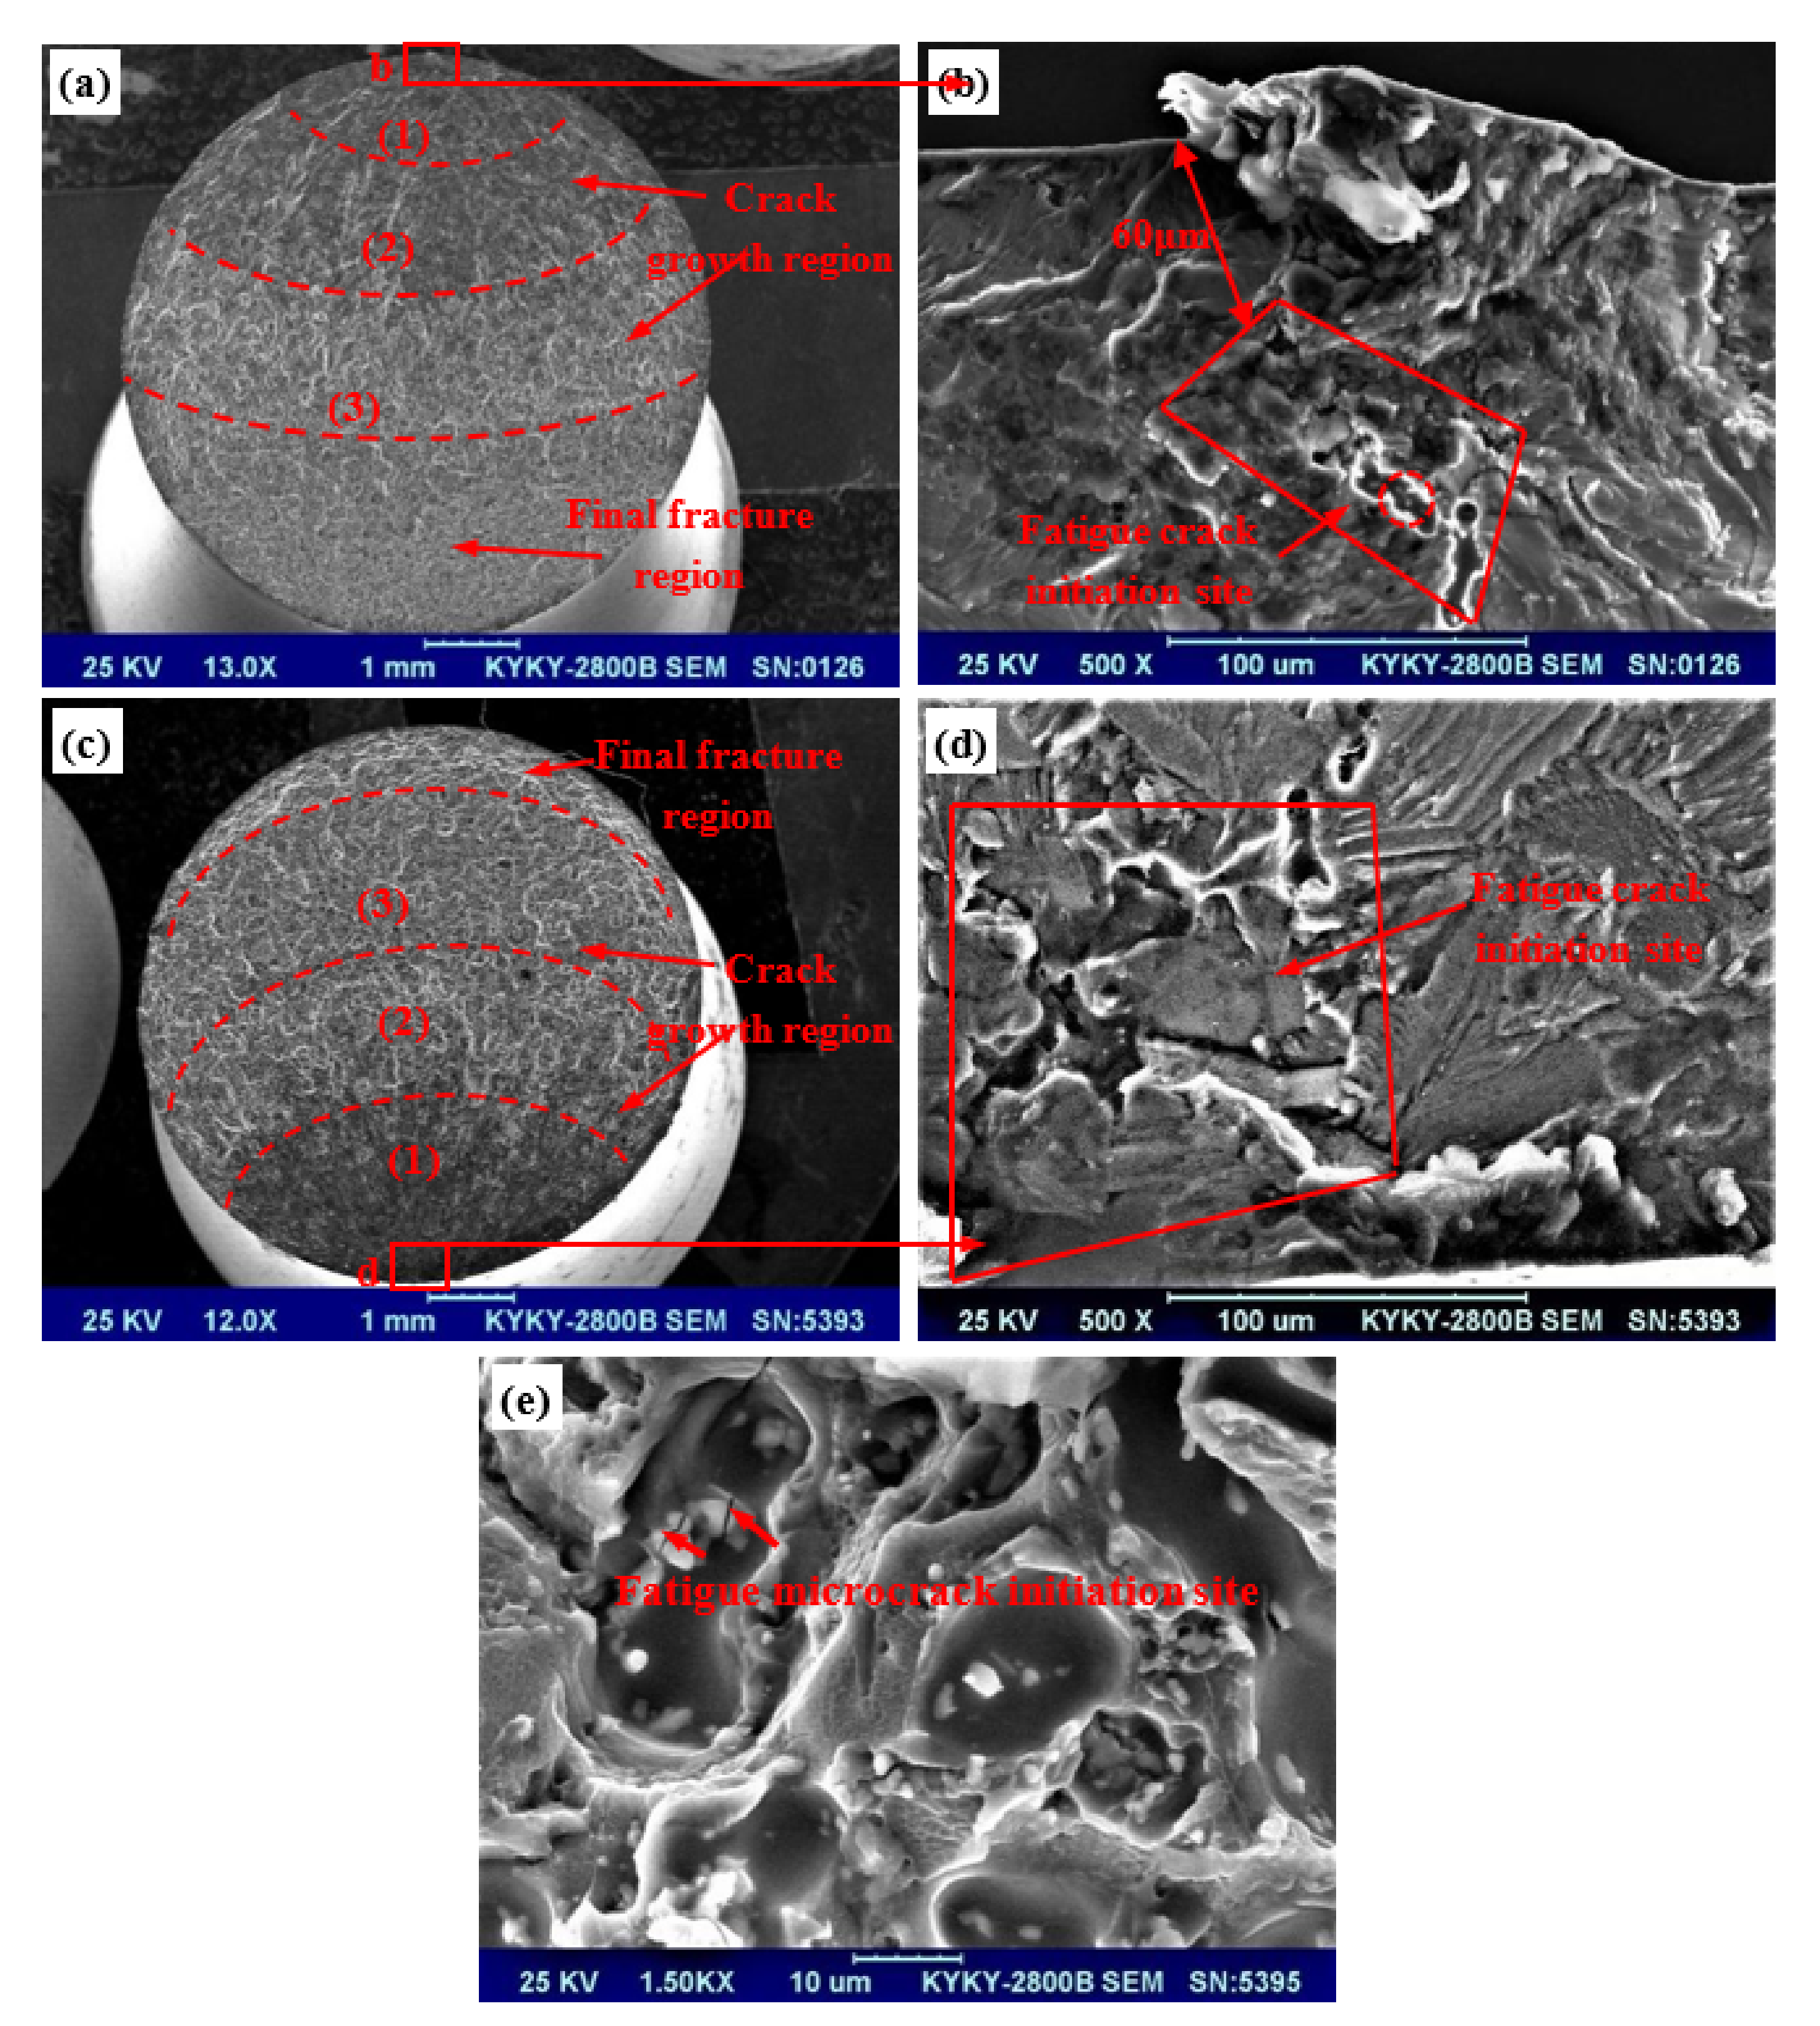
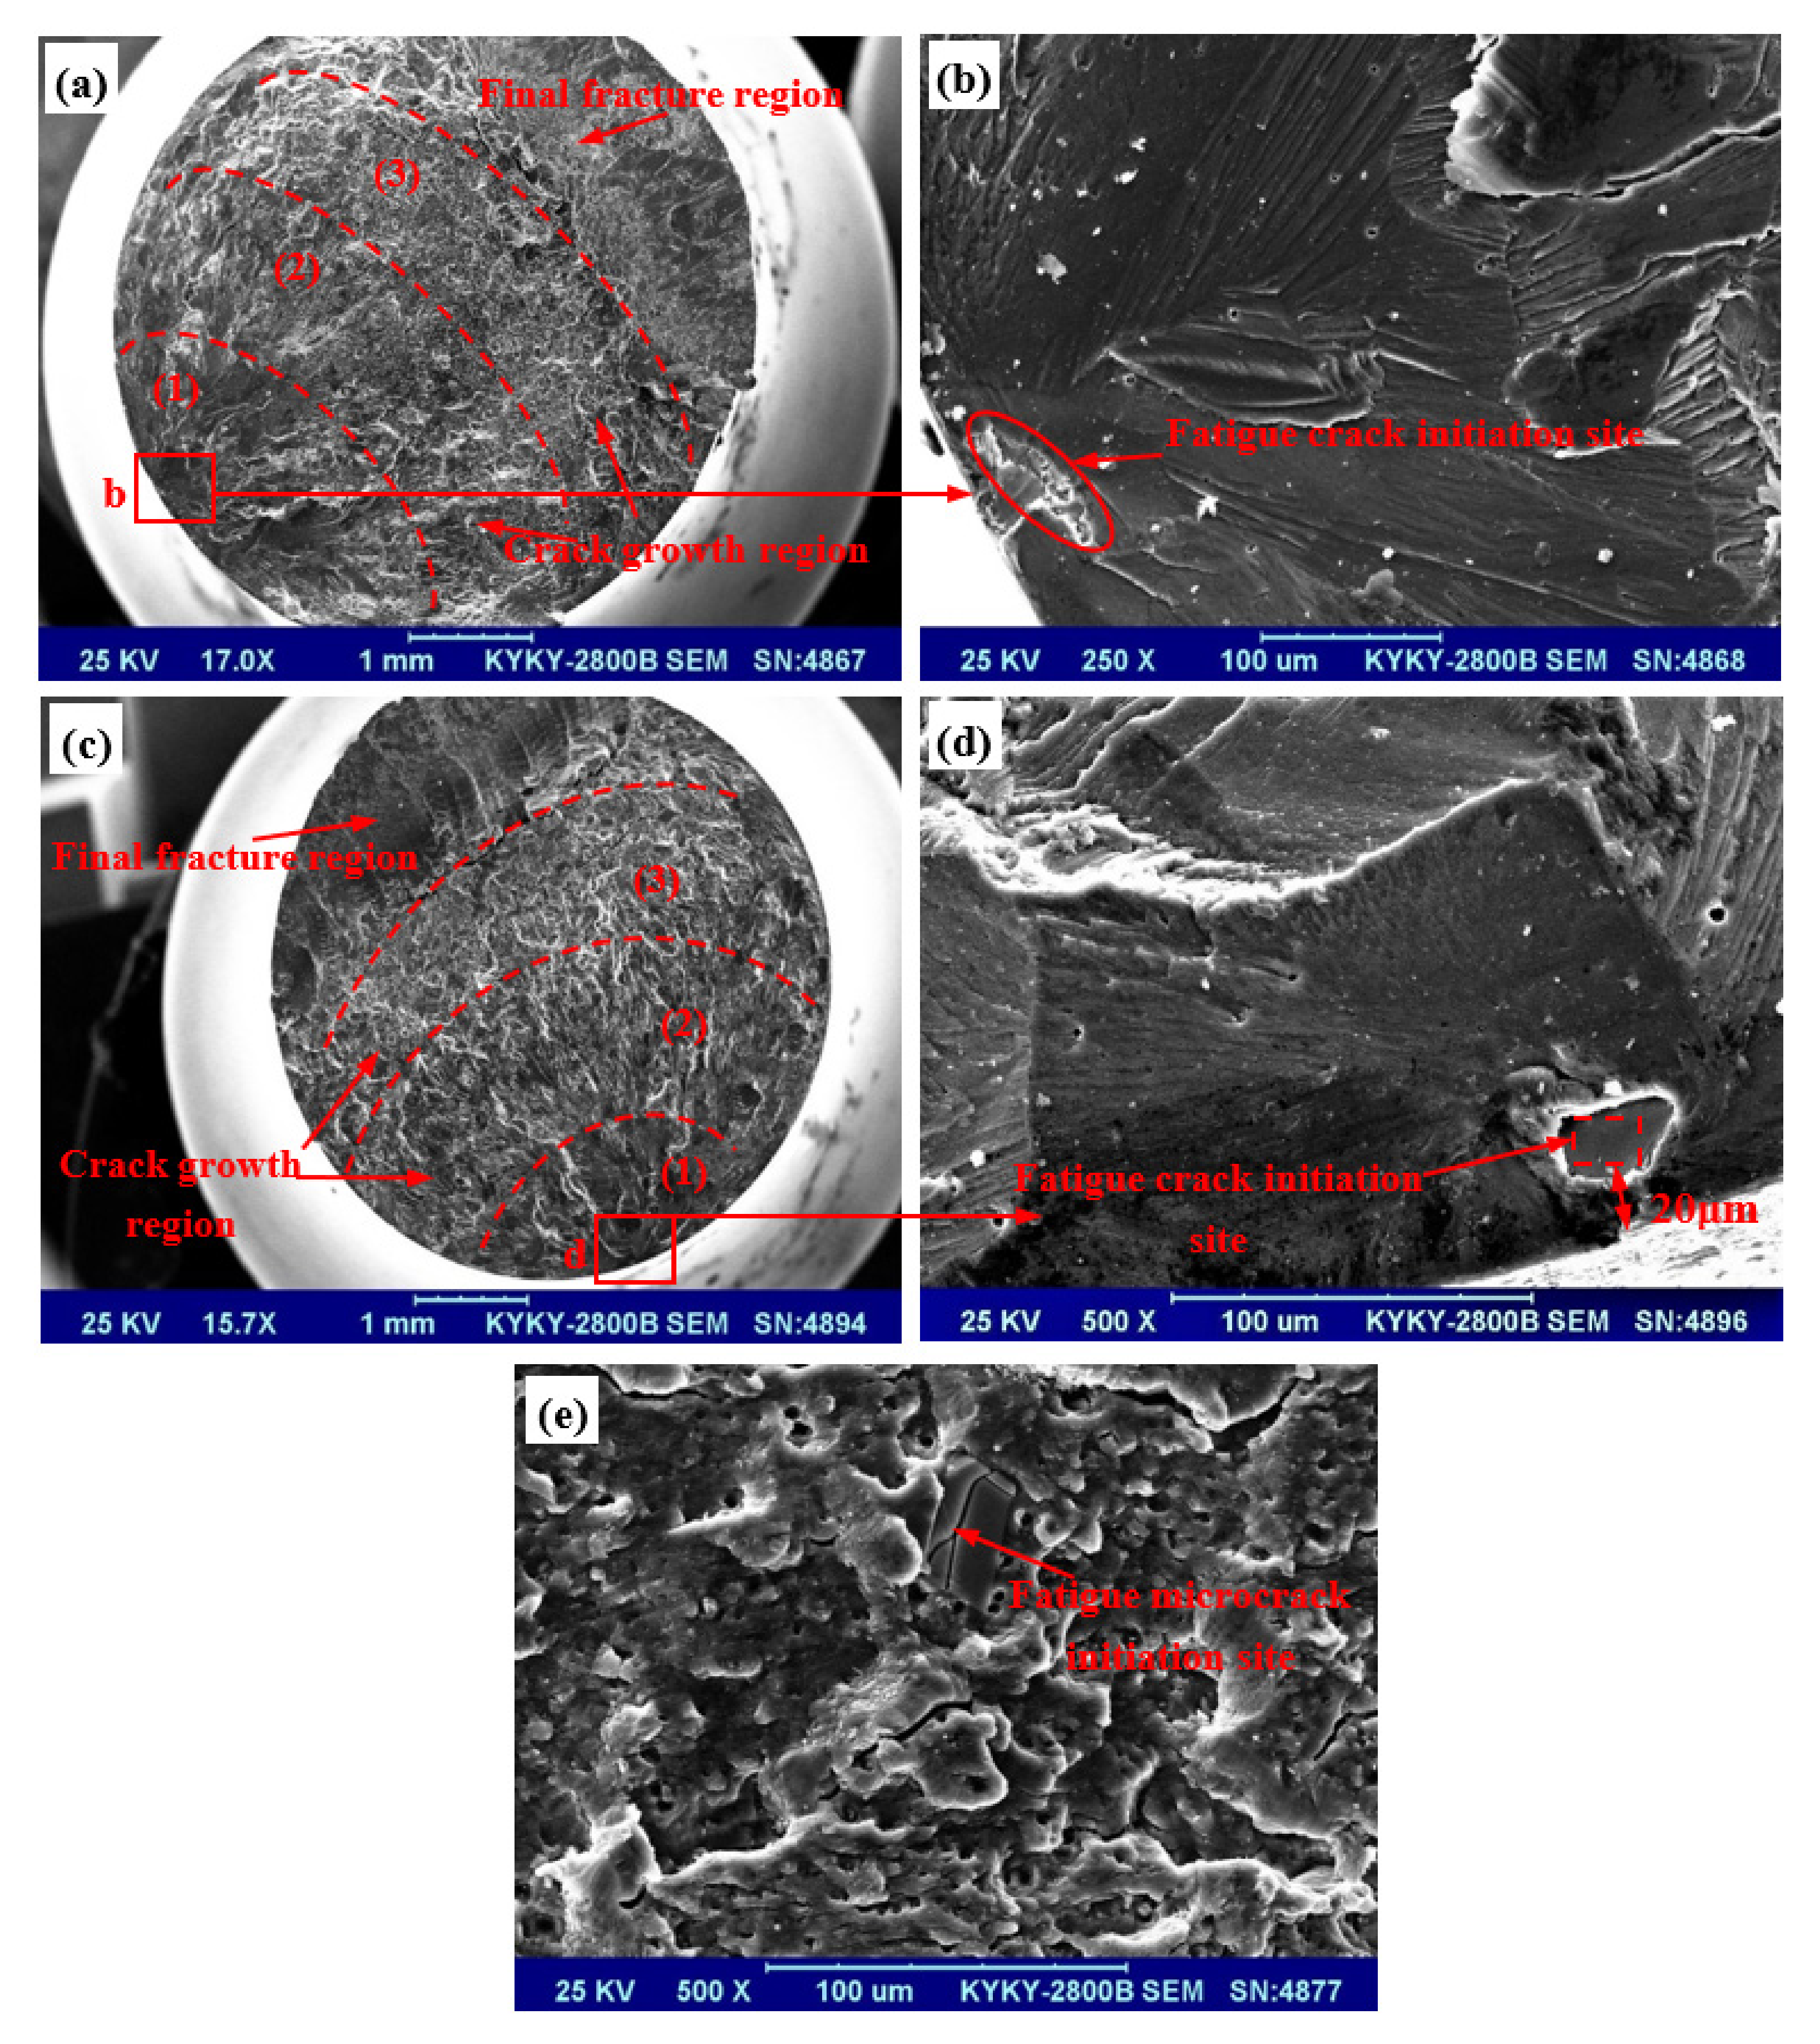
3.3. Fatigue Fracture Analysis of 211Z.X Alloy

3.3.1. Fatigue Crack Initiation Behavior of 211Z.X Alloy with Different Microstructures

The morphologies of fatigue crack initiation sites of 211Z.X aluminum alloy in the two different microstructures are displayed in Figure 10 and Figure 11. Based on the macroscopic fracture morphologies of C211Z.X and R211Z.X aluminum alloys, the fracture surface can be divided into three zones according to the typical fracture morphology. The first consisted of the fatigue crack initiation zone (Figure 10a,c and Figure 11a,c), the second was the crack propagation zone, and the third dealt with the transient fracture zone. Most of the fatigue crack initiation sites were located in the coarser second phase subsurface within 100 μm away from the specimen surface (Figure 10b,d and Figure 11b,d). A few intermetallic compounds and rare earth compound particles enriched with Fe, Ce, and other elements existed on the surface of the fatigue crack source. Moreover, small numbers of microcracks were initiated at the machining defects on the specimen surface. Upon microcrack initiation under cyclic loading (Figure 10a,c and Figure 11a,c), the fatigue microcrack propagated along the perpendicular direction to the maximum stress axis and fanned out from the step of the fatigue microcrack initiate site before expanding forward until the occurrence of specimen fracture [35,36,37]. In high-magnification images, the fatigue microcracks were initiated on the secondary surface with coarse second phases since the second phase particles with insoluble Ce-rich rare earth compounds and iron-containing intermetallic compounds could cause stress concentration during the fatigue testing (Figure 10b,d and Figure 11b,d), resulting in particles fragmentation, detachment, and initiation of microcracks [38,39,40]. In high-magnification images of the fracture surface of fatigued specimen #13 (Figure 10e), the initiation of microcracks was caused by the fragmentation of the fine precipitated phase in the solute atom segregation region located on the fracture surface. However, the high-magnification images of the fracture surface of fatigue specimen #6 (Figure 11e) showed broken coarse precipitates on the surface of the fatigue fracture, resulting in the initiation of microcracks [41]. The spectral energy analyses of the fatigue crack initiation site of C211Z.X alloy specimen #6 (red dotted circle in Figure 10b) and R211Z.X alloy specimen #13 (red dotted box in Figure 11d) are summarized in Table 4 and Table 5, respectively. The elemental composition contained mainly an aluminum matrix at the fatigue crack initiation site. At the fatigue crack initiation position of Z211Z. X alloy specimen #6, EDS data showed small amounts of Mn and impurity Fe elements besides the aluminum matrix (Figure 10 and Table 4). Several studies have pointed out the Fe element as an impurity element in aluminum alloys [11,25,26,27,42]. High amounts of Fe and Mn elements in aluminum alloy could yield coarse and insoluble intermetallic compounds, such as Al4(Mn, Fe) Al20Mn3Cu2Al3Fe, which can easily form. Also, most would be in needle-like form, easily promoting the initiation of microcracks during the fatigue process, thereby negatively impacting the fatigue properties. However, the EDS results of fatigue crack initiation location in the fatigue specimen of R211Z.X aluminum alloy #13 revealed large amounts of Ti, Cd, and Ce elements in the alloy (Table 5).
As mentioned above, the coarser second phase played an important role in fatigue crack initiation of 211Z.X aluminum alloy. However, the large number of the second phase significantly enhanced the resistance of microcrack initiation. This improved the fatigue strength and raised the fatigue life of the alloy, which can be obtained by reducing the size of the second phase and increasing the number of fine second phases. The size and quantity of the second phase could be reduced by prolonging the solution treatment time, shortening the aging time, and enhancing the solution treatment temperature. During the casting process, the content of harmful elements and element segregation can be decreased by using advanced impurity removal and mechanical oscillation methods, which can improve the fatigue performance of the alloy.

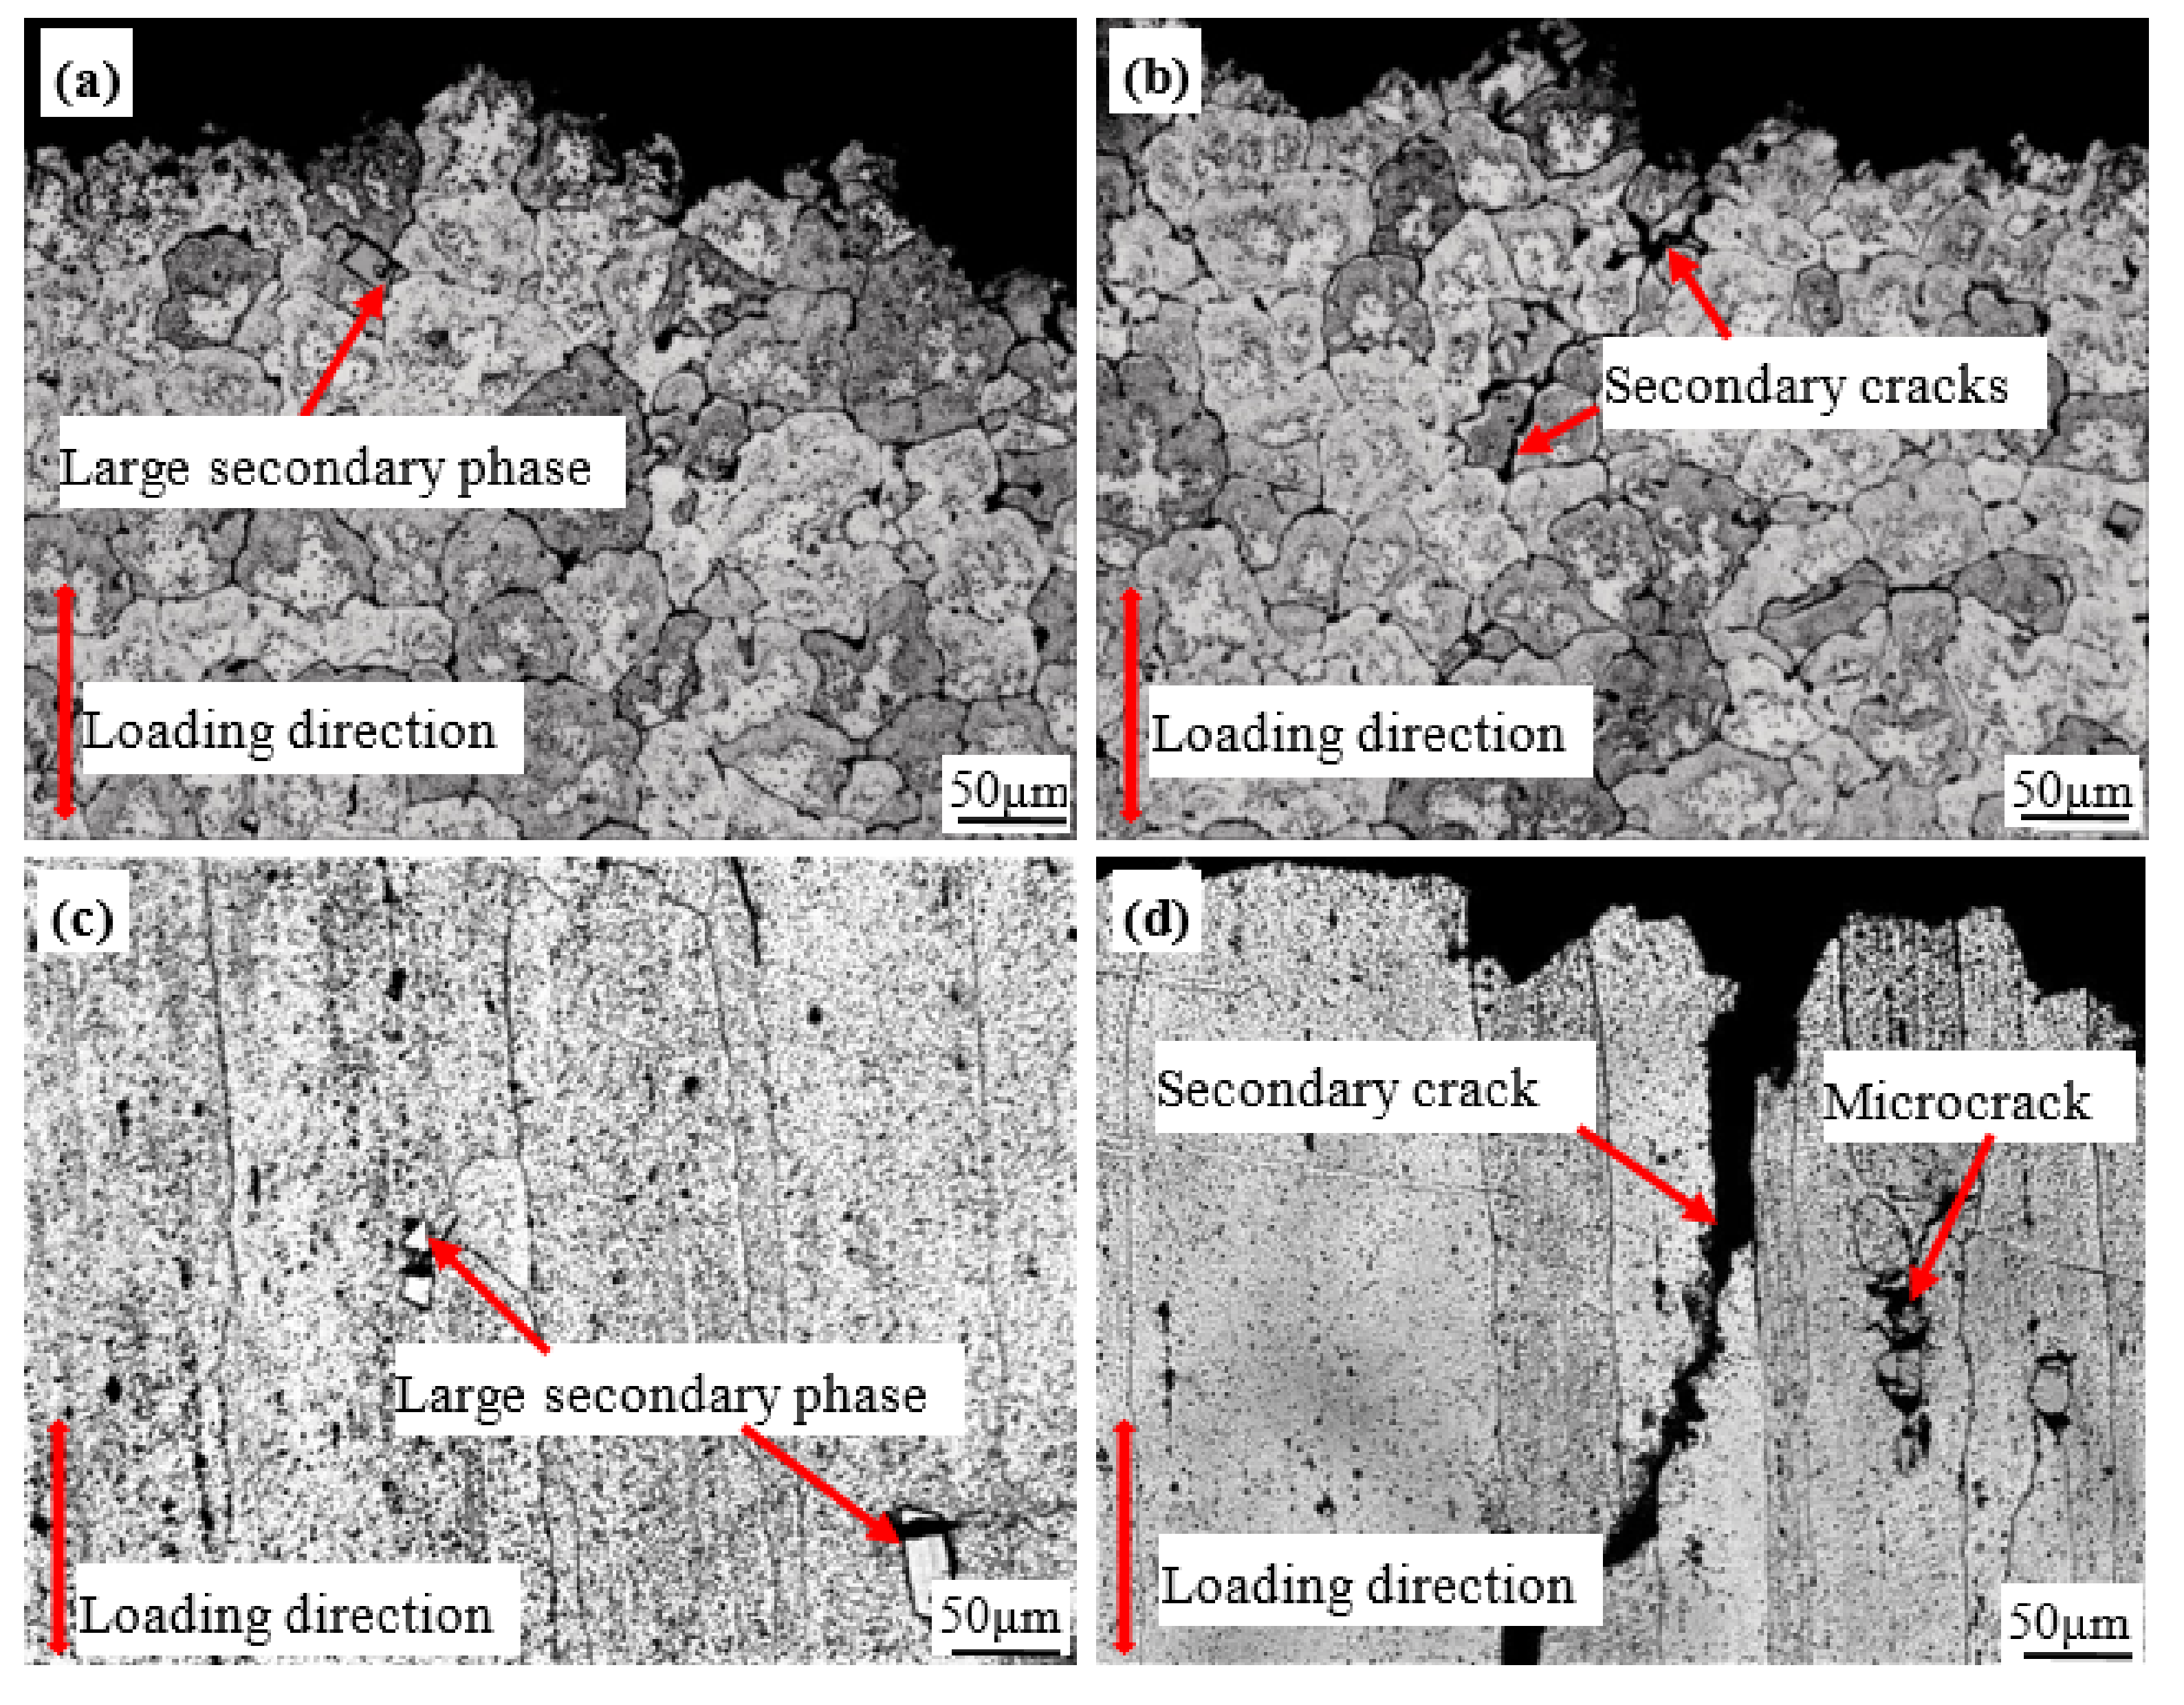
3.3.2. Fatigue Crack Propagation Behavior of 211Z.X Alloy with Different Microstructures

The fracture morphologies of the fatigue crack growth stage of C211Z.X (loading 140 MPa; life cycles 2.27 × 10⁵) and R211Z.X (loading 160 MPa, life cycles 1.16 × 10⁶) alloys are gathered in Figure 12. The crack propagation region consisted of three parts. The first consisted of low-speed crack propagation close to the fatigue crack initiation site. The second had to do with medium-speed crack propagation, and the third dealt with high-speed crack propagation regions. The micromorphology of a fatigue fracture in the low-speed growth stage, as well as the fatigue strip morphology in the steady-state growth region of 211Z.X alloy with two different microstructures, are illustrated in Figure 12. The cracks initiated on the subsurface of the specimens were mostly caused by the broken massive intermetallic compounds and rare earth compounds enriched with Fe, Ce, Si, and other elements. This may also be caused by debonding from the conjunction between particles and matrix (Figure 10, Figure 11 and Figure 12).
The characteristics of the crack propagation path in fatigue fracture profiles of 211Z.X alloys with two different microstructures are depicted in Figure 13. The low-speed growth region with a very small crack size was located near the crack initiation site, and the growth path was mostly transgranular cleavage. The cleavage plane would usually have certain crystallographic characteristics with high and low fluctuations, as well as a large number of steps to yield very steep fatigue fracture. However, the corresponding profile edge close to the fatigue crack origin or at the crack initiation site was relatively smooth without secondary cracks (Figure 13). The region where the crack continued expanding forward consisted of the medium-speed growth stage, where fatigue striation characteristics and small numbers of intergranular secondary cracks were observed (Figure 12c,d). The region between the medium-speed propagation region and the transient fracture zone was identified as the fatigue crack fast-growth stage, where the fatigue crack propagated fast. Obvious intergranular cracks propagating along the grain boundary for a certain distance followed by propagation toward the grain were observed in this region. This led to the formation of a mixed mechanism of intergranular and transgranular propagation (Figure 13b,d), leading to a rough and uneven edge of the fracture profile in this region [43]. The transient fracture region presented a static tensile fracture morphology with an oblique fracture formed near the specimen surface (Figure 10 and Figure 11). The mixed mechanism of intergranular and transgranular fractures was caused by a large amount of plastic deformation and dislocation energy accumulated during deformation. In the subsequent heat treatment process, some or all deformation works were released, giving rise to the driving force for recrystallization of the alloy’s internal structure. This, in turn, caused partial or total recrystallization, finally leading to incomplete recrystallization of the alloy [44]. Hence, recrystallization seriously influenced the fracture toughness of aluminum alloys.
The percentage of intergranular fracture increased with recrystallization volume [44]. The plastic work required for intergranular fracture was less than that required for transgranular fracture. As a result, the crack growth resistance of aluminum alloy decreased with the increase in recrystallization volume fraction.

3.3.3. Effect of Microstructure on HCF Deformation of 211Z.X Alloy

The microstructural deformation features of 211Z.X alloy with two microstructures after fatigue are displayed in Figure 14. Numerous deformations occurred in the microstructure of the alloy during the fatigue process (Figure 14a–d). The second phase particles were twisted and fractured in both the as-cast and deformed aluminum alloys (Figure 14b,d). The reason for this had to do with the large number of coarse second phases distributed in the aluminum matrix, which resulted in extremely high local shear stress at the coarse second phase front under cyclic loading. As the density of dislocation increased, the fine precipitates were forced to leave. Even though such shear stresses failed to shear the thicker precipitates enough, local lattice torsion with the adjacent matrix also occurred [45]. However, prolonged loading induced by the rise in density of the antiphase boundary promoted the plasticity, thereby causing the kinking deformation (rather than shearing) of the precipitates to accommodate deformation in the layer (Figure 14b,d). Furthermore, strain distribution was uneven and the existence of massive secondary precipitated phases led to stress concentration, resulting in crack initiation and rapid intergranular propagation [26,45], as shown in Figure 13.
Numerous studies [5,11,12,19,20] showed that the precipitated phases of 211Z.X aluminum alloy are mainly composed of T-phase enriched with Cd element and the nanoscale rod-like and θ′′ phase. The order of precipitates consisted of GP I zone—GP II zone (θ′′)—θ′—θ during aging, where θ′ is the strengthening phases (Figure 14). Additionally, many coarse precipitated phases were distributed near the grain boundary. According to the literature [19,26,46,47], cracks may easily nucleate at these sites and propagate along the grain boundary. The extensive presence of continuous coarse precipitated phases was important in premature fracture of specimens, which usually manifested as a brittle fracture mode. After T6 heat treatment, more Cu atoms dissolved in the aluminum matrix, leading to increased saturation of the alloy. Moreover, the coarse secondary phases were effectively broken and fully diffused by the hot rolling deformation, thereby improving the precipitation driving force of the strengthening phase (θ’). This, in turn, enhanced the quantity and uniformity of θ’ phase after T6 and hot rolling treatment, greatly improving the strength and toughness of the grain [19]. On the other hand, cracks generated during fatigue could hardly travel straight through grains, thereby spreading along grain boundaries and leading to increased tortuosity and complexity of crack propagation. In sum, the presence of θ′ phase increased the fatigue crack propagation resistance and enhanced fatigue performance. The TEM and SEM images in Figure 2, Figure 3 and Figure 14 revealed small amounts of blocky precipitates at the grain boundary considered as T-phase after EDS testing. Some studies revealed the T-phase with high hardness and poor plasticity, difficult to dissolve and break after low temperature deformation [19,26]. Moreover, the T-phase had strong adsorption capacity relative to nearby copper atoms, so large numbers of Cu atoms were adsorbed and significant precipitate free zones (PFZ) were formed. The results showed fewer strengthening phases in PFZ where the hardness and toughness were lower. The crack nucleated easily near the T-phase and the penetration rate of the intergranular crack increased, adversely affecting the mechanical properties of the alloys. In sum, though the T phase damaged the mechanical properties of the alloy, the strengthening phase θ′ improved its mechanical properties. The small and dispersive second phase was beneficial to improving the strength of the alloy since the short-rod and spherical secondary precipitates promoted the coordinated deformation and improved the overall fatigue properties of the alloy.
Furthermore, large numbers of studies showed that gas (mainly hydrogen), oxidized inclusions (mainly Al2O3), Fe-rich impurities, and second phases of different compositions in aluminum alloy melt would cause defects, such as pores and slacking in the ingot, directly or indirectly affecting the strength and toughness of aluminum alloys [11,38,48,49]. Impurities tended to form hard spots in aluminum and aluminum alloys, increasing the viscosity of aluminum alloy melt, reducing the casting performance, and promoting the formation of casting defects, such as loosening and shrinkage cavity [38]. Moreover, the elastic properties of most inclusions were quite different from those of the aluminum alloy matrix. For instance, non-metallic oxide impurities have a different elastic modulus and expansion coefficient than the aluminum alloy matrix. Upon deformation of the aluminum alloy by stress, large stress concentration can easily be produced around the impurities, leading to broken inclusions or damage to connection with the matrix, thereby providing the core for initiation of fatigue cracks and formation of microvoids. Under continuous deformation, microvoids were constantly generated and grown, subsequently connecting the neighboring microvoids to form microcracks [26,27,38]. Under the action of cyclic stresses, the microcracks continued to propagate and connect to form cracks. Also, the propagation of long cracks would eventually lead to material fracture [42], thereby decreasing the fatigue strength of structural parts. Moreover, the inclusions in the aluminum alloy usually existed as blocks, needles, and sheets, seriously damaging the continuity of the alloy matrix (Figure 3, Figure 4 and Figure 5). The subjection of aluminum alloy to external force would easily produce stress concentration at the sharp corner of the inclusion phase, reducing the strength and plasticity of the alloy, especially the fatigue properties. The relatively hard and brittle oxide inclusions would form a soft aluminum alloy matrix, and oxide inclusions during the machining process would seriously hinder the normal flow during metal plastic deformation. Simultaneously, inclusions and the alloy matrix between brittleness and oxide hardness could easily generate microcracks and an uneven deformation zone. As a result, the regions of transition between the matrix and oxide inclusions would produce cracks, accelerating the fracture during the fatigue process [38].

3.3.4. Relationship between the Size of the Second Phase, Grain Size, and Strength of 211Z.X Alloy

The relationship between the grain size of 211Z.X aluminum alloy and the size of the second phase in different microstructures are presented in Figure 15. The histogram of the size distribution of coarse second phase or inclusion is depicted in Figure 16, and the relationship between the grain size of the second phase and the strength of the alloy is illustrated in Figure 17. The precipitated phase size and grain size followed the same trend without considering the difference between the two microstructures of 211Z.X alloy (Figure 15, Figure 16 and Figure 17). In other words, the increase in grain size led to the growth of long and short diameters of the second phase (Figure 15). As shown in Figure 16, the histogram of the size distribution of the second phase exhibited a larger average and maximum grain size of the second phase in R211Z.X alloy than in C211Z.X alloy.
However, the fatigue strength of the alloy decreased with the increase in grain size (Table 3 and Figure 17). Furthermore, the nucleation and growth of alloy grains through recrystallization after hot-rolling deformation led to excessive temperature or excessive time taken for the subsequent tempering process. Hence, the grains and precipitates also grew rapidly with time extension [43]. According to the Hall–Petch equation, the strength and plasticity would decline as grain size incremented. Nonetheless, an opposite tendency was a rise in strength and plasticity due to various reasons (Figure 17). First, several factors would affect the properties of materials besides the grain size and size of the second phase. The PFZ, shape, volume percentage, and distribution of the second phase and inclusions, as well as other defects, such as holes, dendrite segregation, and reticular structure of the material, would greatly influence the fatigue strength and other properties of the material. Furthermore, after deformation, the alloy showed obvious axial texture, which promoted the improvement of alloy strength.

4. Conclusions

(1) Small amounts of the secondary phases, fine small-scale precipitates with a thin (film), rod-like (needle), or spherical shape mostly precipitated during the aging in both the as-cast and hot-rolling states of the 211Z.X aluminum alloy. Fine and dispersive distribution of the second phases improved the strength of the alloy, and the short-bars and spheres promoted the coordinated deformation of the alloy.
(2) The fatigue strength of the R211Z.X alloy was always higher than that of the C211Z. X alloy at the same survival probability. The Goodman equations of the R211Z.X and C211Z.X alloys were σ a = 156.92 × 1 σ m 498 and σ a = 127.06 × 1 σ m 490 , respectively.
(3) The initiation of fatigue microcracks in the 211Z.X alloy was greatly caused by the fragmentation of the precipitated phase, which enriched the alloy with Cu, Mn, Ce, and other elements. The fatigue cracks propagation mechanism in the 211Z.X alloy mainly consisted of mixed propagation of intergranular and transgranular cleavages. The crack growth region showed cleavage-like characteristics. Also, small cleavage facets, fatigue bands, and secondary cracks were noticeable.

Author Contributions

Z.Z.: Methodology, Validation, Formal analysis, Investigation, Data curation, Writing-original draft, Writing-review and editing. C.H.: Conceptualization, Methodology, Data curation, Supervision, Writing-original draft, Writing-review and editing, Funding acquisition. S.C.: Validation, Formal analysis, Writing-original draft. M.W.: Writing-original draft, Writing-review and editing. M.Y.: Resources, Writing-original draft. S.J.: Writing-original draft. W.Z.: Writing-original draft. All authors have read and agreed to the published version of the manuscript.

Funding

This work was supported by the Science and Technology Program of Guizhou Province (Nos. [2020]1Y196 and ZK [2021054]). We also appreciate the Postdoctoral Science Foundation of China (No. 2020M683656XB) and Program Foundation for Talents of Guizhou University (No. [2017]02).

Institutional Review Board Statement

Not applicable.

Informed Consent Statement

Not applicable.

Data Availability Statement

Not applicable.

Conflicts of Interest

The authors declare that they have no known competing financial interest or personal relationships that could have appeared to influence the work reported in this paper.

References

  1. Rioja, R.J. Fabrication Methods to Manufacture Isotropic Al-Li Alloys and Products for Space and Aerospace Applications. Mater. Sci. Eng. A 1998, 257, 100–107. [Google Scholar] [CrossRef]
  2. Miller, W.S.; Zhuang, L.; Bottema, J.; Wittebrood, A.J.; De Smet, P.; Haszler, A.; Vieregge, A. Recent Development in Aluminium Alloys for the Automotive Industry. Mater. Sci. Eng. A 2000, 280, 37–49. [Google Scholar] [CrossRef]
  3. Dursun, T.; Soutis, C. Recent Developments in Advanced Aircraft Aluminium Alloys. Mater. Des. (1980–2015) 2014, 56, 862–871. [Google Scholar] [CrossRef]
  4. Hirsch, J.; Al-Samman, T. Superior Light Metals by Texture Engineering: Optimized Aluminum and Magnesium Alloys for Automotive Applications. Acta Mater. 2013, 61, 818–843. [Google Scholar] [CrossRef]
  5. Hattori, C.S.; Almeida, G.F.C.; Gonçalves, R.L.P.; Santos, R.G.; Souza, R.C.; Da Silva, W.C.; Cunali, J.R.C.; Couto, A.A. Microstructure and Fatigue Properties of Extruded Aluminum Alloys 7046 and 7108 for Automotive Applications. J. Mater. Res. Technol. 2021, 14, 2970–2981. [Google Scholar] [CrossRef]
  6. Zhao, Z.; Liu, L.; Chen, Z. Co-Strengthening Contribution of δ′ and T1 Precipitates in Al-Li Alloys 2090 and 2090 + Ce. Rare Metals 2006, 25, 197–201. [Google Scholar] [CrossRef]
  7. Itoh, G.; Kanno, M.; Hagiwara, T.; Sakamoto, T. Embrittlement in an Age-Hardened 2091 Aluminum Alloy by Exposure at Elevated Temperatures Below the Aging Temperature. Acta Mater. 1999, 47, 3799–3809. [Google Scholar] [CrossRef]
  8. Ohsaki, S.; Kobayashi, K.; Iino, M.; Sakamoto, T. Fracture Toughness and Stress Corrosion Cracking of Aluminium-Lithium Alloys 2090 and 2091. Corros. Sci. 1996, 38, 793–802. [Google Scholar] [CrossRef]
  9. Shen, Y.Z.; Oh, K.H.; Lee, D.N. Serrated Flow Behavior in 2090 Al–Li Alloy Influenced by Texture and Microstructure. Mater. Sci. Eng. A 2006, 435–436, 343–354. [Google Scholar] [CrossRef]
  10. Pantelakis, S.G.; Daglaras, P.G.; Apostolopoulos, C.A. Tensile and Energy Density Properties of 2024, 6013, 8090 and 2091 Aircraft Aluminum Alloy After Corrosion Exposure. Theor. Appl. Fract. Mec. 2000, 33, 117–134. [Google Scholar] [CrossRef]
  11. Biswas, A.; Siegel, D.J.; Wolverton, C.; Seidman, D.N. Precipitates in Al–Cu Alloys Revisited: Atom-Probe Tomographic Experiments and First-Principles Calculations of Compositional Evolution and Interfacial Segregation. Acta Mater. 2011, 59, 6187–6204. [Google Scholar] [CrossRef]
  12. Knap, V.; Švecová, I.; Tillová, E.; Kuchariková, L. Influence of Iron Content on SDAS Factor, Al5FeSi Intermetallic Phases and Porosity of the Secondary Aluminum Alloy AlSi7Mg0.6 Used in the Automotive Industry. Transp. Res. Procedia 2021, 55, 814–820. [Google Scholar] [CrossRef]
  13. Fu, J.; Cui, K. Effect of Mn Content on the Microstructure and Corrosion Resistance of Al-Cu-Mg-Mn Alloys. J. Alloys Compd. 2022, 896, 162903. [Google Scholar] [CrossRef]
  14. Mei, L.; Chen, X.P.; Wang, C.; Xie, J.; Liu, Q. Good Combination of Strength and Corrosion Resistance in an Al-Cu-Mg Alloy Processed by a Short-Cycled Thermomechanical Treatment. Mater. Charact. 2021, 181, 111469. [Google Scholar] [CrossRef]
  15. Hu, Z.; Fan, C.; Shen, T.; Ou, L.; Dai, N.; Wang, L. Effect of Aging Treatment on Evolution of S′ Phase in Rapid Cold Punched Al−Cu−Mg Alloy. T. Nonferr. Metal. Soc. 2021, 31, 1930–1938. [Google Scholar] [CrossRef]
  16. Wang, Y.; Lin, X.; Kang, N.; Wang, Z.; Liu, Y.; Huang, W. Influence of Post-Heat Treatment on the Microstructure and Mechanical Properties of Al-Cu-Mg-Zr Alloy Manufactured by Selective Laser Melting. J. Mater. Sci. Technol. 2022, 111, 35–48. [Google Scholar] [CrossRef]
  17. Duan, S.Y.; Huang, L.K.; Yang, S.H.; Zhou, Z.; Song, S.J.; Yang, X.B.; Chen, Y.Z.; Li, Y.J.; Liu, G.; Liu, F. Uncovering the Origin of Enhanced Strengthening in Li-added Al–Cu–Mg Alloys. Mater. Sci. Eng. A 2021, 827, 142079. [Google Scholar] [CrossRef]
  18. Yang, R.; Feng, Z.; Huang, T.; Wu, G.; Godfrey, A.; Huang, X. Unprecedented Age-Hardening and its Structural Requirement in a Severely Deformed Al-Cu-Mg Alloy. Scripta Mater. 2022, 206, 114240. [Google Scholar] [CrossRef]
  19. Mao, X.; Yi, Y.; He, H.; Huang, S.; Guo, W. Second Phase Particles and Mechanical Properties of 2219 Aluminum Alloys Processed by an Improved Ring Manufacturing Process. Mater. Sci. Eng. A 2020, 781, 139226. [Google Scholar] [CrossRef]
  20. Wang, T.; Huang, Y.; Ma, Y.; Wu, L.; Yan, H.; Liu, C.; Liu, Y.; Liu, B.; Liu, W. Microstructure and Mechanical Properties of Powder Metallurgy 2024 Aluminum Alloy During Cold Rolling. J. Mater. Res. Technol. 2021, 15, 3337–3348. [Google Scholar] [CrossRef]
  21. Pouraliakbar, H.; Firooz, S.; Jandaghi, M.R.; Khalaj, G.; Amirafshar, A. Combined Effect of Heat Treatment and Rolling on Pre-Strained and SPDed Aluminum Sheet. Mater. Sci. Eng. A 2014, 612, 371–379. [Google Scholar] [CrossRef]
  22. Ashkenazi, D. How Aluminum Changed the World: A Metallurgical Revolution through Technological and Cultural Perspectives. Technol. Forecast. Soc. Chang. 2019, 143, 101–113. [Google Scholar] [CrossRef]
  23. Pirhayati, P.; Jamshidi Aval, H. Effect of Post-Heat Treatment on Friction Surfaced Al-Cu-Mg Alloy Coating Containing Ag. Surf. Coat. Technol. 2020, 397, 125984. [Google Scholar] [CrossRef]
  24. Chaowen, H.; Mingpan, W.; Yang, M.; Yilong, L.; Xin, W.; Fei, Z. Effect of solution process on microstructure and properties of high strength and toughness 211Z.X aluminum alloy. Rare Met. 2019, 43, 816–823. (In Chinese) [Google Scholar]
  25. Chaowen, H.; Yilong, L.; Yang, M.; Pingwei, X.; Xiang, L.; Yu, L. Fatigue characteristics of High strength and heat resistant 211Z.X aluminum alloy. Heat Treat. Met. 2013, 38, 43–47. (In Chinese) [Google Scholar]
  26. Mao, X.; Yi, Y.; Huang, S.; Guo, W.; He, H.; Que, J. Effects of Warm Saddle Forging Deformation on the Reduction of Second-Phase Particles and Control of the Three-Dimensional Mechanical Properties of 2219 Aluminum Alloy Rings. Mater. Sci. Eng. A 2021, 804, 140737. [Google Scholar] [CrossRef]
  27. Wang, B.; Yi, Y.; He, H.; Huang, S. Effects of Deformation Temperature on Second-Phase Particles and Mechanical Properties of Multidirectionally-Forged 2A14 Aluminum Alloy. J. Alloys Compd. 2021, 871, 159459. [Google Scholar] [CrossRef]
  28. Ma, M.; Li, Z.; Qiu, W.; Xiao, Z.; Zhao, Z.; Jiang, Y. Microstructure and Properties of Cu–Mg-Ca Alloy Processed by Equal Channel Angular Pressing. J. Alloys Compd. 2019, 788, 50–60. [Google Scholar] [CrossRef]
  29. Zha, M.; Li, Y.; Mathiesen, R.H.; Bjørge, R.; Roven, H.J. Microstructure Evolution and Mechanical Behavior of a Binary Al–7Mg Alloy Processed by Equal-Channel Angular Pressing. Acta Mater. 2015, 84, 42–54. [Google Scholar] [CrossRef]
  30. Rao, P.N.; Singh, D.; Jayaganthan, R. Mechanical Properties and Microstructural Evolution of Al 6061 Alloy Processed by Multidirectional Forging at Liquid Nitrogen Temperature. Mater. Des. (1980–2015) 2014, 56, 97–104. [Google Scholar] [CrossRef]
  31. Pollak, R.; Palazotto, A.; Nicholas, T. A Simulation-Based Investigation of the Staircase Method for Fatigue Strength Testing. Mech. Mater. 2005, 38, 1170–1181. [Google Scholar] [CrossRef]
  32. Paolino, D.S.; Tridello, A.; Chiandussi, G.; Rossetto, M. Effect of Defect Size On P-S-N Curves in Very-High-Cycle Fatigue. Procedia Struct. Integr. 2017, 7, 335–342. [Google Scholar] [CrossRef]
  33. Zheng, X.L.; Lü, B.; Jiang, H. Determination of Probability Distribution of Fatigue Strength and Expressions of P-S-N Curves. Eng. Fract. Mech. 1995, 50, 483–491. [Google Scholar] [CrossRef]
  34. Huang, C.; Zhao, Y.; Xin, S.; Tan, C.; Zhou, W.; Li, Q.; Zeng, W. Effect of Microstructure on High Cycle Fatigue Behavior of Ti–5Al–5Mo–5V–3Cr–1Zr Titanium Alloy. Int. J. Fatigue 2017, 94, 30–40. [Google Scholar] [CrossRef]
  35. Sajadifar, S.V.; Scharifi, E.; Wegener, T.; Krochmal, M.; Lotz, S.; Steinhoff, K.; Niendorf, T. On the Low-Cycle Fatigue Behavior of Thermo-Mechanically Processed High-Strength Aluminum Alloys. Int. J. Fatigue 2022, 156, 106676. [Google Scholar] [CrossRef]
  36. Haël, M. Microstructural Mechanisms of Cyclic Deformation, Fatigue Crack Initiation and Early Crack Growth. Philos. Transactions. Ser. A Math. Phys. Eng. Sci. 2015, 373, 20140132. [Google Scholar]
  37. Mughrabi, H. Microstructural Fatigue Mechanisms: Cyclic Slip Irreversibility, Crack Initiation, Non-Linear Elastic Damage Analysis. Int. J. Fatigue 2013, 57, 2–8. [Google Scholar] [CrossRef]
  38. Fischer, C.; Schweizer, C. Experimental Investigation of the Damage Characteristics of Two Cast Aluminium Alloys: Part III—Influence of the Local Microstructure and Initial Defect Size on the Fatigue Properties. Int. J. Fatigue 2021, 152, 106388. [Google Scholar] [CrossRef]
  39. Tang, Z.; Yuan, T.; Tsai, C.; Yeh, J.; Lundin, C.D.; Liaw, P.K. Fatigue Behavior of a Wrought Al0.5CoCrCuFeNi Two-Phase High-Entropy Alloy. Acta Mater. 2015, 99, 247–258. [Google Scholar] [CrossRef]
  40. Hockauf, K.; Wagner, M.F.X.; Halle, T.; Niendorf, T.; Hockauf, M.; Lampke, T. Influence of Precipitates on Low-Cycle Fatigue and Crack Growth Behavior in an Ultrafine-Grained Aluminum Alloy. Acta Mater. 2014, 80, 250–263. [Google Scholar] [CrossRef]
  41. Dezecot, S.; Brochu, M. Microstructural Characterization and High Cycle Fatigue Behavior of Investment Cast A357 Aluminum Alloy. Int. J. Fatigue 2015, 77, 154–159. [Google Scholar] [CrossRef]
  42. Bülbül, F.; Christ, H.J.; Wicke, M.; Brückner-Foit, A.; Kirsten, T.; Zimmermann, M. Characterization of the Long Crack Propagation Behaviour in a Hardenable Aluminium Alloy in Very High Cycle Fatigue Regime. Procedia Struct. Integr. 2018, 13, 590–595. [Google Scholar] [CrossRef]
  43. Srivatsan, T.S. An Investigation of the Cyclic Fatigue and Fracture Behavior of Aluminum Alloy 7055. Mater. Des. 2002, 23, 141–151. [Google Scholar] [CrossRef]
  44. Hou, L.G.; Xiao, W.L.; Su, H.; Wu, C.M.; Eskin, D.G.; Katgerman, L.; Zhuang, L.Z.; Zhang, J.S. Room-Temperature Low-Cycle Fatigue and Fracture Behaviour of Asymmetrically Rolled High-Strength 7050 Aluminium Alloy Plates. Int. J. Fatigue 2021, 142, 105919. [Google Scholar] [CrossRef]
  45. Kaira, C.S.; Stannard, T.J.; De Andrade, V.; De Carlo, F.; Chawla, N. Exploring Novel Deformation Mechanisms in Aluminum–Copper Alloys Using in Situ 4D Nanomechanical Testing. Acta Mater. 2019, 176, 242–249. [Google Scholar] [CrossRef]
  46. Zhang, R.; Zhao, W.; Zhang, H.; Yang, W.; Wang, G.; Dong, Y.; Ye, C. Fatigue Performance Rejuvenation of Corroded 7075-T651 Aluminum Alloy through Ultrasonic Nanocrystal Surface Modification. Int. J. Fatigue 2021, 153, 106463. [Google Scholar] [CrossRef]
  47. He, P.; Webster, R.F.; Yakubov, V.; Kong, H.; Yang, Q.; Huang, S.; Ferry, M.; Kruzic, J.J.; Li, X. Fatigue and Dynamic Aging Behavior of a High Strength Al-5024 Alloy Fabricated by Laser Powder Bed Fusion Additive Manufacturing. Acta Mater. 2021, 220, 117312. [Google Scholar] [CrossRef]
  48. Wang, J.; Yang, K.; Zhang, Y.; Lu, Y.; Bai, Z.; Li, X. Investigation on Variations of Microstructures and Mechanical Properties Along Thickness Direction of Friction Stir Processed AA2014 Aluminum Alloy Via Ultra-Rapid Cooling. Mater. Charact. 2021, 179, 111352. [Google Scholar] [CrossRef]
  49. Lan, X.; Li, K.; Wang, F.; Su, Y.; Yang, M.; Liu, S.; Wang, J.; Du, Y. Preparation of Millimeter Scale Second Phase Particles in Aluminum Alloys and Determination of their Mechanical Properties. J. Alloys Compd. 2019, 784, 68–75. [Google Scholar] [CrossRef]
Figure 1. The size parameter of fatigue specimens for 211Z.X aluminum alloy: (a) R211Z.X alloy and (b) C211Z.X alloy. All dimensions are mm.
Metals 12 00387 g001
Figure 2. OM images of microstructures for the 211Z.X aluminum alloy: (a,b) the transverse and axial microstructures of C211Z.X alloy; (c,d) the transverse and axial microstructure of R211Z.X alloy.
Metals 12 00387 g002
Figure 3. TEM images of microstructures for 211Z.X aluminum alloy: (a,b) the microstructure of C211Z.X alloy; (c,d) the microstructure of R211Z.X alloy.
Metals 12 00387 g003
Figure 4. Energy spectrum analysis of coarse particles in microstructure of 211Z.X aluminum alloy: (a) OM image; (b) energy spectrum of particle 1; (c) energy spectrum of particle 2.
Metals 12 00387 g004
Figure 5. Energy spectrum analysis of fine precipitated phases in the microstructure of 211Z.X aluminum alloy: (a) microstructure; (b) the energy matrix spectrum; (c) the energy spectrum of phase 1; (d) the energy spectrum of phase 2.
Metals 12 00387 g005aMetals 12 00387 g005b
Figure 6. The HCF S–N curves of 211Z. X aluminum alloy with the two microstructures.
Metals 12 00387 g006
Figure 7. The P–S–N curves of R211Z.X and C211Z.X aluminum alloys with P = 99.9% (NC = 2.5 × 10⁶ cycles).
Metals 12 00387 g007
Figure 8. The P–S–N curves of the R211Z.X and C211Z.X aluminum alloys with P = 50% (NC = 2.5 × 10⁶ cycles).
Metals 12 00387 g008
Figure 9. The Goodman fatigue diagram of C211Z.X and R211Z.X aluminum alloys.
Metals 12 00387 g009
Figure 10. Fatigue fracture surface of C211Z.X aluminum alloy: (a) #6 (loading 140 MPa; life cycles 2.27 × 10⁵) macro morphology; (b) #6 crack source; (c) #6 (loading 120 MPa; life cycles 3.21 × 10⁵) macro morphology; (d) #13 crack source; (e) The fine precipitates in the solute atom segregation zone on the surface of fatigue fracture #13 are broken, leading to the initiation of microcracks.
Metals 12 00387 g010
Figure 11. Fatigue fracture surface of R211Z.X aluminum alloy: (a) #6 (loading 160 MPa, life cycles 1.16 × 10⁶) macro morphology;(b) #6 crack source; (c) #13 (loading 140 MPa, life cycles 2.25 × 10⁶) macro morphology; (d) #13 crack source; (e) The coarse precipitated phases on the surface of fatigue fracture #6 are broken, leading to the initiation of microcracks.
Metals 12 00387 g011
Figure 12. The fracture morphologies of fatigue crack growth stage of C211Z.X (loading 140 MPa; life cycles 2.27 × 10⁵) and R211Z.X (loading 160 MPa, life cycles 1.16 × 10⁶) alloys: (a,b) are the fracture morphology of 211Z.X alloys in the low-speed growth stage of fatigue crack; (c,d) are the fatigue striations in fatigue crack steady-state growth stage in 211Z.X alloys.
Metals 12 00387 g012
Figure 13. The microstructure and crack propagation path of the fatigue fracture profile in the crack propagation region of 211Z.X aluminum alloy: (a,b) the fracture profile of the C211Z.X alloy; (c,d) the fracture profile of the R211Z.X alloy.
Metals 12 00387 g013
Figure 14. Fatigue deformation characteristics of 211Z.X aluminum alloy: (a,b) the microstructure of C211Z.X alloy; (c,d) the microstructure of R211Z.X alloy after HCF.
Metals 12 00387 g014
Figure 15. The grain size and coarse second phase size of the 211Z.X alloy with the two states.
Metals 12 00387 g015
Figure 16. Histogram of size distribution of coarse second phase of the 211Z.X alloy with the two states. (a) R211Z.X and (b) C211Z.X alloys.
Metals 12 00387 g016
Figure 17. The relationship between performance and grain size of the 211Z.X alloy.
Metals 12 00387 g017
Table 1. Nominal chemical composition of the 211Z.X aluminum alloy (wt.%).
ElementCuMnTiZrREFeSiMgAl
Percent6.280.50.020.130.170.150.10.05Bal.
Table 2. The mechanical properties of 211Z.X aluminum alloy before fatigue in different states.
Alloy ConditionYS/MPaUTS/MPaEl/%RA/%Hardness/HBW
C211Z.X393 ± 2490 ± 312.93 ± 114.46 ± 1124 ± 2
R211Z.X432 ± 3498 ± 210.42 ± 124.81 ± 1165 ± 2
Table 3. The relationship between tensile and fatigue properties of C211Z.X and R211Z.X aluminum alloys.
C211Z.X AlloyR211Z.X Alloy
YS/MPa393432
UTS/MPa490498
σ−1(2.5×10⁶)/MPa127.06156.92
σ−1(2.5×106,99.9%)/MPa108.50140
σ−1(2.5×106,50%)/MPa111.05147.13
σ−1(2.5×10⁶)/YS0.3230.363
σ−1(2.5×10⁶)/UTS0.2590.315
Table 4. The energy spectrum analysis results of fatigue crack initiation position (red dotted box in Figure 10b) of fatigue specimen #13 for C211Z.X aluminum alloy.
Elementwt.%at.%
Al91.8396.14
Cu0.483.38
Mn2.261.16
Fe0.480.24
Cr0.430.23
Total100%100%
Table 5. The energy spectrum analysis results of fatigue crack initiation position (red dotted box in Figure 10b) of fatigue specimen #13 for R211Z.X aluminum alloy.
Elementwt.%at.%
Al55.6978.75
Ti12.8210.22
Cu5.593.36
Cd9.223.13
Ce16.674.54
Total100%100%
Publisher’s Note: MDPI stays neutral with regard to jurisdictional claims in published maps and institutional affiliations.

